
INTRODUCTION
Hedgehog (Hh) proteins signal via two multitransmembrane proteins, Ptch and Smoothened (Smo). In this receptor complex, Ptch is the ligand-binding subunit and Smo is the signaling component. Upon binding of Hh to its receptor Ptch, an inhibitory effect of Ptch on Smo is released, allowing Smo to trigger a signaling cascade activating the Gli transcription factors (Gli1, 2 and 3), essential effectors for Hh-mediated cellular effects. Due to its repressive function in the Hh pathway, inactivation of Ptch results in pathological activation of Hh signaling that in turn promotes tumor development. This is characterized by increased levels of Gli1 mRNA (reviewed in Hooper et al. [1]). Since the Ptch promoter contains Gli-binding sites, activation of the Hh pathway is also followed by Ptch transcription [2, 3].
Inactivating Ptch mutations have been identified in various tumors including basal cell carcinoma, medulloblastoma and RMS [4–6] thus supporting a role for Ptch as a tumor suppressor gene. However, one normal allele is frequently retained in the tumors [7–9]. Using heterozygous Ptch knockout mice we demonstrated that the wildtype (wt) and mutated Ptch alleles are differentially expressed in RMS. Interestingly, the Ptch transcripts consistently overexpressed in RMS are derived predominantly from the mutated allele, whereas transcript levels of the wt allele appear to be unchanged or even downregulated [10–12]. These observations led to the hypothesis that RMS formation in heterozygous Ptch knockout mice is associated with epigenetic mechanisms differentially repressing mutant and wt Ptch alleles.
Since DNA methylation is one of the best characterized epigenetic modifications contributing to the repression of genes with tumor suppressor activity in tumors, we initially examined the levels of DNA methylation at the Ptch promoter in RMS to compare the DNA methylation status. We identified specific changes in DNA methylation that are associated with transcriptional activation of mutant Ptch in tumors. In addition, we show an increased occupancy of activating histone marks between normal and tumorigenic tissue of heterozygous Ptch knockout mice as well as Gli1 binding to the mutant Ptch allele. Finally, we monitored RMS formation in heterozygous Ptch knockout mice that have been treated with 5-aza-dC at the RMS-susceptible stage E9.5–E11.5 during embryogenesis. Moreover we analyzed the methylation status of the Ptch promoter in mouse embryos at E9.5 and E13.5 (i.e. the RMS-susceptible and RMS-non-susceptible stages, respectively [12]). Altogether, our findings define a pattern of epigenetic changes associated with differential expression of the mutant and wt allele and provide foundation for future studies aimed at defining the mechanism underlying the interplay between these marks and Gli1 in RMS pathogenesis.
RESULTS
The mutant Ptch promotor is hypomethylated in RMS from Ptch heterozygous mice
We recently showed that RMS of Ptch heterozygous mice consistently overexpress the mutant Ptch allele whereas the expression of the remaining wt Ptch allele is unchanged or even repressed [11, 12 and Supplementary Fig. S1]. Further in silico analysis identified a methylation-sensitive region within the murine Ptch promoter in RMS [11, Fig. 1] that suggests DNA methylation as potential mediator of this phenomenon. We next analyzed methylation of the Ptch promotor by MeDIP using RMS and SM samples from 16 Ptchdel/+(Ptch+/−) [13] and Ptchneo67/+ [14] mice. The total methylation content was calculated as % input. As shown in Fig. 2A, 3 of the 7 amplicons analyzed showed methylation, whereas the remaining amplicons were unmethylated (data not shown). Surprisingly, and in contrast to our previous hypothesis, the methylation content in these fragments (i.e. amplicon 3, 4 and 7 of the Ptch promoter) was reduced in RMS compared to SM (Fig. 2A). Thus, the percentage of methylation in SM in the amplicons 3, 4 and 7 decreased from 32% to 20% (P = 0.0053), from 45% to 22% (P = 0.0112) and from 1.1% to 0.5% (P = 0.0054) in RMS, respectively. Although the decrease was small, especially in fragment 7, the difference between SM and RMS was statistically significant. For positive and negative controls for the MeDIP see supplemental Fig. S2. Next, we used bisulfite next generation sequencing (NGS) to validate the above results. Due to the special requirements of bisulfite specific primers, the amplicons differed slightly from the MeDIP (as indicated in Figs. 2A and 2B). In agreement with the MeDIP results, methylation was only detected in the fragments 3, 4 and 7. Moreover we found a highly significant decrease of methylation at several CpG positions in RMS compared to SM (9/13 CpG positions in fragment 3, 4/4 in fragment 4 and 2/17 in fragment 7). As a control we analyzed two amplicons within the CpG island A (see Fig. 1, Supplemental Table 1) close to the Gli-binding site 1 and we were able to confirm the lack of methylation in this region ([11] and data not shown).
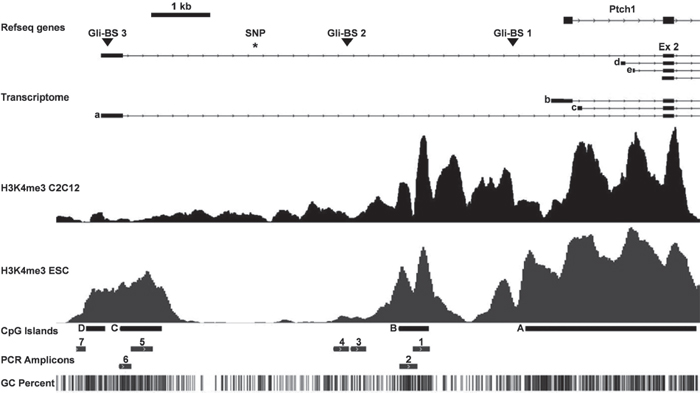
Figure 1: Murine Ptch promoter region analyzed in this study. The upper part shows the upstream genomic region of Ptch, its transcriptome, the three Gli-binding sites (triangles) and the SNP rs29624336 (asterisk). The alternative exons 1a-1e (a–e) and exon 2 (ex 2) are indicated. H3K4me3 occupancy in differentiated C2C12 cells and murine embryonic stem cells (ESC) as downloaded from the European Nucleotide Archive and NCBI Gene Expression Omnibus are indicated below. The CpG islands (A–D), the analyzed PCR amplicons 1–7 (fragment 3 equates the methylation-sensitive DNA fragment described by Ecke et al. [11], all primers are shown in supplemental Table 1) and the CpG content are shown in the lower part. The largest amplicon 5 (391 bp) could only be amplified in the H3K4me3 ChIP experiment and NGS bisulfite sequencing.
We next sought to determine whether the methylated or unmethylated amplicons in RMS were derived from the transcriptionally repressed wt Ptch or the transcriptionally active Ptch mutant allele, respectively (see also supplemental Fig. S1). Allele-specific methylation is a widespread phenomenon that also occurs tissue-specifically and can be identified by the presence of specific Single Nucleotid Polymorphisms (SNPs) [15]. We therefore searched for SNPs in the amplicons 3, 4 and 7 (see Fig. 1) that would have allowed for discrimination between the mutant and the wt Ptch alleles when breeding Ptch+/− mice to another mouse strain. Unfortunately, no informative SNPs within these amplicons were present according to the Mouse Phenome Database and to our bisulfite NGS analyses. We were therefore unable to investigate allele specific methylation.
Enhanced occupancy of the Ptch promoter by activating H3K4me3 marks in RMS
We extended the promoter analysis and investigated if changes in histone marks were accompanying the DNA methylation patterns of the wt and mutant Ptch alleles. Specifically, we examined the levels the trimethylation of H3K4, a hallmark of unmethylated CpG islands [16]. We immunoprecipitated H3K4me3-modified chromatin and performed qPCR (supplemental Table 1, for controls see supplemental Fig. S3). We found that the Ptch promoter contained 4 regions that were occupied by H3K4me3 in RMS, but not in SM derived from 4 Ptch heterozygous mice (Fig. 2C). Increased H3K4me3 enrichment was observed for amplicons 1, 2, 3 and 5. The difference between RMS and SM was statistically significant for amplicons 2 and 5 (both P = 0.0286). These data are consistent with ChIP-sequencing data for H3K4me3 in C2C12 mouse myoblast cells and murine ESC and together demonstrate an increased occupancy of H3K4me3 on the Ptch promoter in RMS (Fig. 1). Next, we determined what were the candidate mediators of these changes in RMS and normal SM. Interestingly, there was no significant changes between tumor and normal tissue in enzymes writing or erasing H3K4 marks including Kmt2a [17], Ash1l [18], Cxxc1 [19], Kdm1a [20] and Ezh2 [21] (supplemental Fig. S4). However, the histone deacetylases (Hdac) 1, 5–7 and 9–11 [22] as well as DNA methyltransferases Dnmt1 and 3b [23] were significantly increased in RMS compared to SM (Fig. 3A, 3B). The high levels of Hdac1 and Dnmt1 in RMS were previously reported to be induced by active Hh signaling [24, 25]. In contrast, the de novo DNA methyltransferase Dnmt3a did not show aberrant expression in RMS although it was reported to be regulated by Gli1 as well [25]. Together, these data show increased levels of the active histone modification H3K4me3 in the Ptch promotor in RMS and increased expression of enzymes involved in DNA methylation and histone deacetylation in the tumors.
RMS show higher binding of Gli1 at the mutant Ptch promoter
To determine how the methylation differences contributed to the differential transcriptional activity of the Ptch alleles in RMS, we initially examined the binding of Gli1, a known activator of Ptch in cancer, in SM and RMS from 5 Ptch+/− mice and consecutively amplified the fragments 1–4 and a 197 bp fragment covering the polymorphism by qPCR (Supplemental Fig. S5 and data not shown). For fragment 4 covering a Gli-binding site (Gli-BS 2, Fig. 1) increased Gli1 binding was found in RMS. A slight increase in RMS was also detected in the neighboring fragment 3, whereas no difference was detected for the other amplicons (Supplemental Fig. S5). To determine if there were differences in the binding of Gli1 between alleles we made use of the SNP rs29624336, a genetic variant allowing to differentiate between the genetic backgrounds 129Sv and Balb/c (C) and C57BL/6 (T) (supplemental Fig. S6). When crossing Ptch+/− mice (on a Balb/c background) in which the vector used for the propagation and original targeting was 129Sv [26] to wt C57BL/6 mice, the mutant locus in the resulting Balb x B6 Ptch+/− mice carries the C allele and the wt Ptch locus the T allele. Due to the location of the SNP rs29624336 in vicinity to the Gli-binding sites indicated in Fig. 1 (~1.6 kb to Gli-BS 2 and ~2.6 kb to Gli-BS-3) this SNP serves as excellent reference to determine if the level binding of Gli1 was enhanced at the mutant locus. To this end, we used 3 RMS from Balb x B6 Ptch+/− mice. DNA was precipitated with the Gli1 antibody and after qPCR was subcloned and sequenced. Indeed, although the results did not reach statistical significance, in all samples the C allele and thus the mutant Ptch locus was more frequently amplified than the T allele (together 83 C and 59 T). These data show that Gli1 binding is higher at the mutant Ptch allele. This together with hypomethylation of the mutant Ptch alleles in RMS may explain the higher transcriptional activity of the mutant Ptch allele.
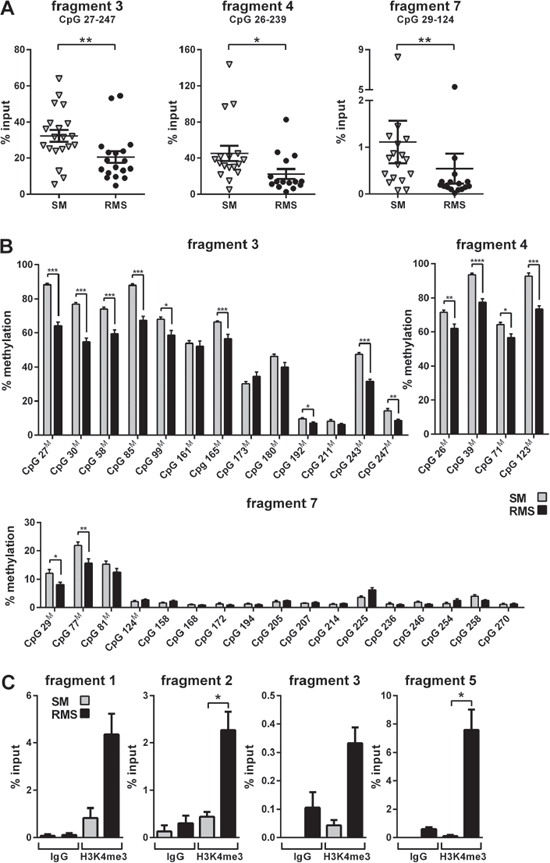
Figure 2: Analysis of methylation and histone occupancy of the Ptch promoter in RMS of heterozygous Ptch mice. A and B. Decreased methylation of the Ptch promoter in RMS. A, DNA derived from tissue samples from Ptch+/− (n = 10) and Ptchneo67/+ (n = 6) mice was subjected to MeDIP and analyzed by qPCR. Each triangle (SM) and circle (RMS) represents one sample measured in triplicates. Mean values (lines) and SEM are indicated for each group. The decrease in methylation in amplicons 3, 4 and 7 in RMS is statistically significant. The covered CpG dinucleotides (in comparison to bisulfite NGS, see B) are indicated for each fragment. B, Decreased methylation of several CpG dinucleotides in the Ptch promoter in RMS. SM (grey bars) and RMS (black bars) from 9 Ptch+/− mice were analyzed by bisulfite NGS. Mean values and SEM from SM and RMS are given for each CpG at the indicated position within the respective fragment. CpG dinucleotides also covered in the MeDIP assay are marked with a superscriptM. C. H3K4me3 enrichment at the Ptch promoter in RMS. The ChIP enrichment for H3K4me3 was analyzed in chromatin from RMS (black bars) and SM (grey bars) from 1 Ptch+/− and 3 Ptchneo67/+ mice and quantified by qPCR. Mean values and SEM for the amplicons 1, 2, 3 and 5 are shown, IgG served as a negative control. The increase in H3K4me3 occupancy in fragments 2 and 5 in RMS is statistically significant. All statistically significant differences are indicated by asterisks (*P < 0.05, **P < 0.01, ***P < 0.001, ****P < 0.0001).
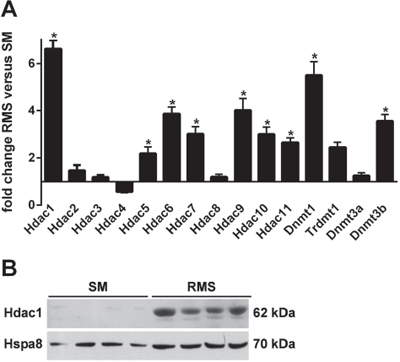
Figure 3: A. Expression of Hdacs, Dnmts and Trdmt1 in SM and RMS of heterozygous Ptch mice. Tissue samples were isolated from 4 Ptchneo67/+ mice and analyzed by qPCR. Shown is fold expression of the genes analyzed in RMS (mean ± SEM) in comparison with normal skeletal muscle (SM) that was set to 1. Statistically significant changes in gene expression levels between RMS and SM are marked with an asterisk (P < 0.05). B. increased expression of Hdac1 protein in RMS. Hdac1 was analyzed in protein lysates from RMS and SM derived from 4 Ptchneo67/+ mice. Hspa8 served as loading control.
5-aza-dC treatment during embryogenesis accelerates RMS development in heterozygous Ptch mice
Using a conditional knock-out strategy in Ptchflox/+ mice, we recently demonstrated that disruption of one Ptch allele at embryonic day E9.5 in the mouse results in RMS initiation in approximately 90% of mice. The RMS susceptibility declines to 44% when Ptch is disrupted at E11.5 and the window for RMS initiation is closed at E13.5 during embryogenesis [12]. These data suggest that epigenetic modifications at the Ptch promoter repressing the wt allele while concomitantly activating the mutant Ptch allele occur before day E13.5. If hypomethylation of the Ptch promoter indeed plays a role in RMS formation, global DNA demethylation by 5-aza-dC at the RMS-susceptible stage should either influence onset, incidence or latency time of RMS in Ptch+/− mice. To test this hypothesis, we mated female wt mice to Ptch+/− males and treated the pregnant animals with 5-aza-dC at 9.5, 10.5, and at 11.5 days post coitum (dpc) (i.e. at the RMS-susceptible stages). At the end of the study 92% and 95% of 5-aza-dC and untreated animals, respectively, developed at least one visible or palpable and histologically confirmed RMS (Fig. 4 and Table 1). There were no differences in morphology or differentiation between tumors. However, the 5-aza-dC treatment significantly shortened RMS latency time. Thus, the median RMS latency time of 5-aza-dC treated animals was 50 days and that of untreated animals was 98 days (P = 0.0012 for palpable RMS by Gehan-Breslow-Wilcoxon test). Together, these data suggest that changes in DNA methylation controls RMS initiation and progression. Furthermore, the 5-aza-dC treatment resulted in an average number of tumors of 3.5 ± 0.49 (Table 1), while the average tumor number of untreated mice was 2.6 ± 0.29 per animal (P = 0.217). Despite a lack of significance these data show that 5-aza-dC, in addition to shortening the latency time, may also increase the multiplicity of RMS.
Since Ptch+/− mice are highly susceptible to RMS formation at E9.5, whereas the susceptibility progressively declines at later stages, we next hypothesized that the Ptch promoter may show a different methylation pattern at different developmental stages during embryogenesis. To test this hypothesis we compared the methylation status of the Ptch locus at the RMS-susceptible stage E9.5 with the RMS-non-susceptible stage E13.5. To this end we analyzed the methylation-sensitive regions 3, 4 and 7 (see Fig. 1) in DNA from 30 E9.5 and 4 E13.5 wt embryos. As shown in Supplemental Fig. S7 almost no DNA methylation of the Ptch promoter was detectable in E9.5 embryos. At E13.5 the methylation increased and was significantly higher compared to E9.5 (P = 0.0238, P = 0.0159, P = 0.0333 for amplicons 3, 4 and 7, respectively; for control experiments see supplemental Fig. S8). Together, these data show that the Ptch promoter at the RMS-susceptible stage (i.e. at E9.5) is marginally methylated and methylation increases at the RMS-non-susceptible (i.e. at E13.5) stage. Along with the observations that the 5-aza-dC-treatment at the RMS-susceptible stage accelerates RMS growth (i.e. 5-aza-dC accelerated occurrence of palpable RMS) these data support our notion that Ptch promoter hypomethylation is involved in RMS formation.
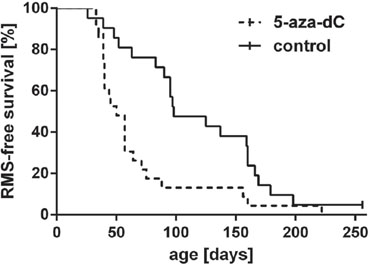
Figure 4: Lifetime monitoring of RMS in heterozygous Ptch mice after exposure to 5-aza-dC. Pregnant mice were injected with 5-aza-dC at 9.5, 10.5 and 11.5 dpc and formation of palpable RMS in the Ptch+/− offspring (dashed line) was monitored weekly until the age of 250 days. Ptch+/− control animals (continuous line) were not exposed to 5-aza-dC. Two censored animals are marked by a bar. The difference between both groups is statistically significant (P = 0.0012, Gehan-Breslow-Wilcoxon test).
Table 1: Tumor formation in Ptch+/− mice after application of 5-aza-dC
age at 5-aza-dC application |
n |
age range; median (days) |
mice with RMS1 |
median LT2 of RMS (days) |
RMS3/mouse (mean ± SEM) |
mice with cystic tumors4 |
others |
E9.5–E11.5 |
25 |
46–230; 101 |
23 (92%) |
50 |
3.5 ± 0.49 |
6 (24%) |
25 |
– |
21 |
93–272; 161 |
20 (95%) |
98 |
2.6 ± 0.29 |
6 (29%) |
0 |
1palpable RMS only
2latency time of the first palpable RMS
3palpable and non-palpable RMS
4see [13]
51 mouse suffered from rectum prolapse, 1 developed a non-palpable RMS
DISCUSSION
In this study we analyzed epigenetic modifications at the Ptch promoter in RMS of heterozygous Ptch mice. Since only the mutant Ptch transcript is overexpressed in RMS we previously assumed that the tumor-initiating event is active repression of the wt Ptch allele [11]. Indeed, our previous data showed that 5-aza-dC-treatment of RMS modulated methylation of Ptch upstream sequences. In general, changes in the methylation pattern are a hallmark of cancer cells. Whereas hypomethylated regions in tumor cells usually comprise genes or structures that are normally silent or interfere with chromosomal stability, hypermethylated regions frequently include promoter regions of tumor suppressor genes [27].
In our study the promoter of the putative tumor suppressor gene Ptch is hypomethylated in RMS compared to SM in regions with only a moderate CpG content. This fits to findings that DNA methylation is usually associated with CpG-poor DNA, whereas CpG islands remain mostly unmethylated [16]. In addition, the Ptch promoter in RMS is furthermore occupied by the activation-associated histone mark H3K4me3. Indeed H3K4me3 is a hallmark of unmethlyated CpG islands [28]. Accordingly, fragment 3 (see Figs. 1, 2) showed both DNA methylation and H3K4me3 occupancy, and the level of H3K4me3 signal correlated inversely with the degree of DNA methylation. These data strongly suggest that the Ptch promoter in RMS is activated due to hypomethylation and increased occupancy of activating histone marks. Interestingly accumulation of H3K4me3 has been shown to be associated with strong gene activation in tumor tissues even without changes in DNA methylation levels [29]. This sheds light on the promoter regions without methylation changes in RMS and SM (fragments 1, 2 and 5) with increased H3K4me3 occupancy in RMS and supports our assumption that the mutant Ptch promoter is activated in RMS by diverse epigenetic mechanisms. Furthermore H3K4me3 protects DNA from methylation [30]. Thus increased H3K4me3 occupancy of the mutant Ptch allele might contribute to the pathological Ptch expression in RMS.
Hypomethylation of the Ptch promoter in RMS is most likely established independently of the tumor-specific expression profile of epigenetic modifier enzymes, because RMS i) generally express elevated levels of genes involved in the establishment and maintenance of genomic hypermethylation (i.e. HDACs and Dnmts; see Fig. 3) and ii) do not exceedingly express genes associated with the regulation of H3K4 methylation.
So far only a few studies analyzed Ptch promoter methylation in cancer. Apparently the methylation status varies significantly at different regions of the Ptch promoter. As shown in Fig. 1 the Ptch promoter contains several alternative first exons. Lack of methylation at the alternative exon 1B was reported for human medulloblastoma [31, 32] whereas others showed methylation in exon 1A [33]. Methylation of exon 1A was also found in gastric cancer samples [34] and exon 1B was methylated in fibroma and dermoids [35], in basal cell carcinoma [36] but not in squamous cell cervical cancer or ovarian cancer [37]. Moreover it was reported that the Ptch promoter in medulloblastoma from Ptch heterozygous mice is not methylated [38]. Since our previous studies did not reveal methylation near the Gli-binding site 1 in the murine Ptch promoter [11], we focused on the CpG islands B-D (Fig. 1) and neighboring CpG rich regions. Strikingly, the hypomethylated Ptch promoter regions in RMS cover one of the three Gli-binding sites. Since loss of Ptch function results in aberrant Hh signaling activity that culminates in activation of Gli transcription factors, hypomethylation of the Gli-binding site could explain the very high Ptch transcripts levels in tumors of Ptch+/− mice.
These data support a new model of RMS formation in Ptch+/− mice (Fig. 5). According to this model the Ptch promoter becomes methylated and inactivated after E9.5 in the course of muscle development. This assumption is supported by i) a lack of methylation of the methylation-sensitive sites within the Ptch promoter at E9.5, ii) an increase in methylation at E13.5 and iii) distinct methylation of the methylation-sensitive sites in adult SM. It is also fostered by the very low Ptch expression in SM [11, 14, 39]. According to our new model a RMS develops when methylation of the mutant Ptch locus in a specific RMS precursor cell does not occur during the RMS-susceptible state of embryogenesis (i.e. before E13.5) which then results in increased Gli1 binding and permanent Hh pathway activity.
The finding that 5-aza-dC treatment of E9.5 old Ptch+/− embryos accelerates RMS growth also favors this model of RMS formation. 5-aza-dC irreversibly inhibits Dnmts. Whereas Dnmt1 is the primary enzyme responsible for copying methylation patterns after DNA replication, Dnmt3a and Dnmt3b are responsible for de novo methylation of genes, also during mammalian development [40, 41]. Indeed, de novo DNA methylation in the embryo occurs between E4.5 and E13.5 [16] and Dnmt3a and Dnmt3b are expressed ubiquitously in the E9.5 old embryo [40]. Since the Ptch promoter is unmethylated at the RMS-susceptible stage E9.5 (Supplemental Fig. S7) and since 5-aza-dC blocks both the de novo and maintenance Dnmts [42], blockage of de novo methylation of the Ptch promoter at E9.5 (by 5-aza-dC treatment) appears to be responsible for maintaining the mutant Ptch locus in an unmethylated state. If this occurs in a RMS precursor cell, the pathological activation of Hh signaling provides a proliferative advantage. In addition to this mechanism, 5-aza-dC likely also affects other DNA regions which may contribute to accelerated RMS formation in Ptch+/− mice.
At first glance, our new model appears to conflict with our recent observation that heterozygosity for Dnmt1 delayed (instead of accelerated) the growth of medulloblastoma in heterozygous Ptch mice. Medulloblastoma formation in Ptch mutant mice follows a similar molecular mechanism as RMS formation with the mutant Ptch transcripts being highly overexpressed and the wt transcripts underrepresented [11]. However, since the reduction of Dnmt1 activity in heterozygous Ptch mice did not affect initiation of medulloblastoma [11] and since reduced levels of Dnmt1 activity can inhibit proliferation and induce apoptosis [43], it is possible that the already initiated medulloblastoma simply underwent pronounced apoptosis and thus stagnated in their growth.
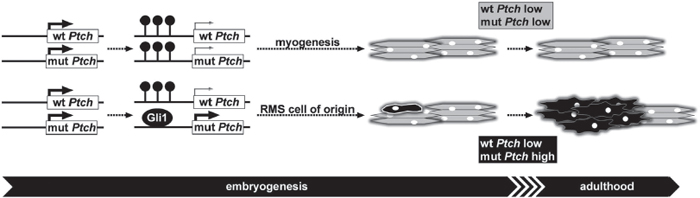
Figure 5: Mechanism of RMS formation in heterozygous Ptch mice. Initially the Ptch promoter is not methylated during early embryonic development allowing abundant expression (thick arrows) of wildtype (wt) and mutant (mut) Ptch transcripts in heterozygous Ptch knockout mice. Subsequently methylation (resembled by lollipops) of the Ptch promoter starts at E13.5 or later during embryogenesis leading to decreased Ptch expression of the methylated alleles (as indicated by thin arrows). If both Ptch alleles are methylated myogenesis proceeds unperturbed and wt as well as mut Ptch are expressed at low levels during and after myogenesis (indicated by grey color). If the mut allele remains accidentally unmethylated and Gli1 binding is increased, the cell of origin for RMS (single black cell) expresses high levels of mut Ptch (indicated by black color) and finally gives rise to RMS (cluster of black cells) during adulthood.
Furthermore, we showed that treatment with 5-aza-dC of adult mice did not influence RMS growth [11]. This indicates that 5-aza-dC-induced demethylation of the wt Ptch locus in already established RMS precursor lesions in the adult does not compensate for the overexpression of the demethylated and thus overexpressed mutant Ptch allele. The efficient prevention of RMS growth by 5-aza-dC along with valproic acid in the adult animal [11] can be explained either by a more efficient reactivation of wt Ptch expression after combination therapy or by additional Ptch-independent mechanisms.
In conclusion, our data suggest an alternative model of tumor formation caused by the tumor suppressor gene Ptch. This model includes loss of methylation and occupancy by activating histone marks and probably Gli1 binding of the mutant Ptch locus. In this model, overexpression of the mutant, non-functional Ptch protein results in aberrant Hh signaling activity and tumor formation. Whether this model can also be applied to human Ptch-associated tumors remains to be analyzed in the future.
METHODS
Compounds
5-aza-dC (Sigma-Aldrich, Taufkirchen, Germany) was diluted in PBS. Stocks of 120 μg/ml 5-aza-dC were stored at −80°C and the required amount was diluted from a new aliquot directly prior use.
Animals
Experiments using animals were performed with consideration of all necessary legal requirements. Ptch+/− mice, which served for treatment studies and tumor monitoring, were on a Balb/cJ background that confers RMS susceptibility [44]. In Ptch+/− mice exons 8 and 9 of the murine Ptch gene are replaced by a neo cassette. Genotyping of the wt and the targeted Ptch alleles were performed as described [13]. Some of the results were confirmed in Ptchneo67/+ mice that lack Ptch exons 6 and 7 (for description of the mice and genotyping see Hahn et al. [14]).
Balb x B6 Ptch+/– mice used for SNP analyses were on a mixed Balb/cJ x C57BL/6 background. In these mice the wt Ptch locus is derived from a C57BL/6 wt female whereas the mutated Ptch locus is derived from a Ptch+/− male on a Balb/cJ background.
5-aza-dC injection
To treat embryos in utero with 5-aza-dC, wt Balb/cJ females were mated to Ptch+/− males. The pregnant females were injected intraperitoneally with 100 μg/kg of 5-aza-dC (maximal tolerable dose; see Ecke et al. [11]) in PBS at 9.5, 10.5, and 11.5 dpc. For determination of embryonic ages, noon on the day of the postcoital plug was taken as E0.5.
Tumor monitoring and histological examination
RMS development in Ptch+/− mice was monitored by weekly manual palpations of animals as most RMS develop in the muscles of the hip/thigh or intraabdominally. Tail deformation in some mice treated with 5-aza-dC during embryogenesis indicated that they were efficiently exposed to the substance during embryogenesis [45, 46]. If possible, the observation period encompassed 250 days. After death the animals were examined for additional, non-visible and non-palpable tumors. The identity of the tumors as RMS was confirmed using paraffin sections stained with hematoxylin and eosin.
DNA and RNA-isolation and qPCR
DNA was extracted according to standard procedures. Total RNA was isolated using PeqGOLD TriFast™ reagent (PeqLab, Erlangen, Germany). Reverse transcription of total RNA was performed using random hexamers and SuperScriptII reverse transcriptase (Invitrogen, Karlsruhe, Germany). qPCR was performed on an ABI PRISM 7900HT Sequence Detection System (Applied Biosystems, Foster City, California, USA). Amplification of 18s rRNA as an endogenous control was performed to standardize the amount of sample RNA. All primers and probes used in qPCR assays for analyses of transcript expression were intron-flanking (supplemental Table 1).
In order to distinguish between the wt Ptch and mutant Ptch transcripts derived from Ptch+/− mice we established a TaqMan assay using fluorogenic probes that span exons 8 and 9 or exons 7 and 10, respectively (supplemental Table 1).
MeDIP
MeDIP was performed with phenol chloroform extracted DNA from RMS and the corresponding SM from Ptch+/− mice and from E9.5 and E13.5 mouse embryos. The MagMeDIP kit (Diagenode, Liège, Belgium) was used according to the manufacturer’s instructions. Efficiency of DNA shearing (Bioruptor® NGS, Diagenode, high power, 5 cycles: 30 sec on/off) was analyzed by agarose gel electrophoresis. MeDIP and input samples were analyzed by qPCR and MeDIP samples were normalized to the respective input. The results are shown as % input (ratio signals in immunoprecipitated DNA versus input DNA).
Bisulfite next generation sequencing
Sodium bisulfite treatment of genomic DNA from RMS and SM from 9 Ptch+/− mice was carried out using the EpiTect Bisulfite Kit (Qiagen, Venlo, Netherlands) according to the manufacturer’s instructions. Bisulfite-treated DNA was amplified with primers located in the CpG island A (Fig. 1) and in fragments 3–7 specific for bisulfite-treated DNA (see supplemental Table 1). For primer design Methyl Primer Express Software v1.0 (Applied Biosystems) was used. All gel extracted amplicons (QIAquick Gel Extraction Kit, Qiagen) derived from one RMS or SM tissue sample were pooled and quantified using Quanti Flour (Promega, Fitchburg, WI, USA). For each sample 1.2 μg DNA were diluted in 100 μl tris/EDTA buffer and sonicated to 200 bp using the Nano NGS-Bioruptor® (Diagenode). Library preparation was performed using the TruSeq custom Amplicon Library Preparation (Illumina, San Diego, CA, USA). Library sizes were evaluated using the Bioanalyzer 2100 (Agilent Technologies, Santa Clara, CA, USA) and the quantity was estimated using Quanti Flour. Libraries were diluted to 8 pM and sequenced with the MiSeq System (MS-102–3001, Illumina) using the 300 cycle kit and v3 Reagents.
Bisulfite NGS data were analyzed with the software Sequence Pilot Version 4.1.2 (JSI medical systems, Ettenheim, Germany). Briefly, the sequences (FASTQ files) were aligned to the bisulfite modified reference sequence for each amplicon assuming all C in a CpG position as methylated. The percentage of C to T nucleotide changes compared to the reference sequence was used to calculate the ratio of DNA methylation. The percentage and coverage of C to T nucleotide changes for all CpG in fragments 3, 4 and 7 are shown in supplemental Table 4. The efficiency of bisulfite conversion was estimated by the proportion of non-CpG cytosines converted to uracil and was > 98% in all samples.
Chromatin immunoprecipitation
The H3K4me3 ChIP was essentially carried out as described [47]. See supplemental Table 2 for buffers and solutions. Briefly, RMS and SM were minced and crosslinked. After washing (PBS) samples were homogenized, dounced, sonicated (Bioruptor® Plus, high power, 30 cycles: 30 sec on/off) and insoluble remains removed by centrifugation. Fifteen μl were used for DNA isolation and quantification (NanoDrop 8000, Thermo Scientific, Waltham, Massachusetts, USA). DNA fragmentation was confirmed by agarose gel electrophoresis. The chromatin was pre-cleared (1 h, 4°C). One μg chromatin was mixed with 1 ml IP buffer/ 1 μg anti-H3K4me3 or IgG control antibody (see supplemental Table 3) and incubated at 4°C overnight. To bind immunoprecipitated complexes protein A Sepharose was used (2 h, 4°C). Thereafter samples were washed with IP buffer/0.1% SDS, wash buffer, IP buffer/0.1% SDS and TE. Then the immunoprecipitated complexes and input samples (0.1 μg) were incubated with 10% chelex 100 (10 min, 95°C). Two μg proteinase K were added and samples were heated to 55°C (30 min) and 95°C (10 min). Samples were centrifuged and supernatants were used for qPCR. Therefore all input samples were diluted 1:10 with water. ChIP samples were normalized to their respective input sample. The results are shown as % input.
The Gli1 ChIP was conducted using a modification of the Magna ChIP kit protocol (EMD Millipore, Bedford, MA). Defrosted SM and RMS tissue samples were sliced with a scalpel blade, resuspended in PBS and fixed at room temperature with 1% formaldehyde for 15 min. After that, 10x glycine solution was added to quench unreacted formaldehyde, samples were spinned down and washed twice with PBS/proteases inhibitor cocktail (Roche, Mannheim, Germany). Samples were minced for 2 min using the homogenizer, resuspended in cell lysis buffer, kept on ice for 40–45 min and vortexed for 5 min. After spinning down samples were resuspended in nuclear lysis buffer, sonicated for 40–45 cycles and insoluble remains were removed by centrifugation. The following steps were the same as the ones from H3K4me3 ChIP.
SNP analysis
After Gli1 ChIP and qPCR using primers encompassing the SNP rs29624336 (Supplemental Table 1) the amplicons were purified with the QIAquick Gel Extraction Kit (Qiagen) and cloned into pGEM-T Easy (Promega). For each amplicon at least 40 clones were sequenced using the BigDye Terminator v3.1 Cycle Sequencing Kit (Applied Biosystems) according to the manufacturer’s instruction. The sequences were analyzed on the ABI 3500xL Genetic Analyzer (Applied Biosystems) and the chromatograms were evaluated using the software BioEdit version 7.1.3.0 [48].
Western blot
RMS and SM from 4 heterozygous Ptch mice were homogenized in 1% Triton X-100, 150 mM Hepes, 1 mM EDTA at pH 7, supplemented with protease and phosphatase inhibitors. For determination of protein concentration the Pierce Protein BCA Assay Kit (Thermo Scientific) was used. Fifty μg of each sample were transferred using standard methods by semi-dry blotting onto a PVDF membrane (GE Healthcare, Buckinghamshire, England). Antibodies are shown in supplemental Table 3.
Analysis and visualization of ChIP-sequencing (ChIP-seq) data
Raw FASTQ files for H3K4me3 ChIP-seq (GSM721293) and input (GSM721307) from differentiated C2C12 cells were downloaded from the European Nucleotide Archive and analyzed with a Galaxy server. Reads were mapped to the mouse genome (mm9) using Bowtie (version 1.1.2) and wiggle files were generated using MACS (version 1.0.0). ChIP-seq data for H3K4me3 from mouse embryonic stem cells (GSM1033636) were downloaded as processed wiggle files directly from the NCBI Gene Expression Omnibus. Tracks for transcriptome data from the transcriptome analyzer (TromER) project as well as GC content for the region near the Ptch1 gene were downloaded directly from the UCSC genome browser for visualization together with ChIP-seq data using the Integrated Genome Viewer (IGV version 2.3.25).
Statistics
GraphPad Prism was used for statistical analysis. Gehan-Breslow-Wilcoxon tests were performed to assay statistical differences for survival curves. A factor was considered statistically significant if it had a two-tail P value of < 0.05. Gene expression and tumor multiplicity were analyzed by Mann-Whitney tests. P values of < 0.05 were considered significant.
ACKNOWLEDGMENTS
We are grateful to Susan Peter and Stefan Wolf for excellent animal care; Tobias Goldak, Ina Heß and Miriam Weiss for technical assistance; Magali Hennion (German Center for Neurodegenerative Diseases, Göttingen) for technical advice and Walter Schulz-Schaeffer (Institute of Neuropathology, University Medical Center Göttingen), Mladen Tzvetkov (Institute of Clinical Pharmacology, University Medical Center Göttingen), Anja Uhmann and Arne Zibat for useful discussion.
GRANT SUPPORT
This work was supported by a grant from the German Research Foundation (DFG) HA2197/7–1 to H.H., CA136526 to M.E.F.-Z., JO 815/1–1 and JO 815/3–1 to S.A.J, and the Deutsche Krebshilfe (109088) to S.A.J.
DISCLOSURE OF POTENTIAL CONFLICTS OF INTEREST
No potential conflicts of interest were disclosed.
REFERENCES
1. Hooper JE, Scott MP. Communicating with Hedgehogs. Nat Rev Mol Cell Biol. 2005; 6:306–317.
2. Agren M, Kogerman P, Kleman MI, Wessling M, Toftgard R. Expression of the PTCH1 tumor suppressor gene is regulated by alternative promoters and a single functional Gli-binding site. Gene. 2004; 330:101–114.
3. Nagao K, Toyoda M, Takeuchi-Inoue K, Fujii K, Yamada M, Miyashita T. Identification and characterization of multiple isoforms of a murine and human tumor suppressor, patched, having distinct first exons. Genomics. 2005; 85:462–471.
4. Evangelista M, Tian H, de Sauvage FJ. The hedgehog signaling pathway in cancer. Clin Cancer Res. 2006; 12:5924–5928.
5. Epstein EH. Basal cell carcinomas: attack of the hedgehog. Nat Rev Cancer. 2008; 8:743–754.
6. Tostar U, Malm CJ, Meis-Kindblom JM, Kindblom LG, Toftgard R, Unden AB. Deregulation of the hedgehog signalling pathway: a possible role for the PTCH and SUFU genes in human rhabdomyoma and rhabdomyosarcoma development. J Pathol. 2006; 208:17–25.
7. Gailani MR, Stahle-Backdahl M, Leffell DJ, Glynn M, Zaphiropoulos PG, Pressman C, Unden AB, Dean M, Brash DE, Bale AE, Toftgard R. The role of the human homologue of Drosophila patched in sporadic basal cell carcinomas [see comments]. Nature genetics. 1996; 14:78–81.
8. Xie J, Johnson RL, Zhang X, Bare JW, Waldman FM, Cogen PH, Menon AG, Warren RS, Chen LC, Scott MP, Epstein EH Jr. Mutations of the PATCHED gene in several types of sporadic extracutaneous tumors. Cancer research. 1997; 57:2369–2372.
9. Raffel C, Jenkins RB, Frederick L, Hebrink D, Alderete B, Fults DW, James CD. Sporadic medulloblastomas contain PTCH mutations. Cancer research. 1997; 57:842–845.
10. Calzada-Wack J, Kappler R, Schnitzbauer U, Richter T, Nathrath M, Rosemann M, Wagner SN, Hein R, Hahn H. Unbalanced overexpression of the mutant allele in murine Patched mutants. Carcinogenesis. 2002; 23:727–734.
11. Ecke I, Petry F, Rosenberger A, Tauber S, Monkemeyer S, Hess I, Dullin C, Kimmina S, Pirngruber J, Johnsen SA, Uhmann A, Nitzki F, Wojnowski L, et al. Antitumor effects of a combined 5-aza-2′deoxycytidine and valproic acid treatment on rhabdomyosarcoma and medulloblastoma in Ptch mutant mice. Cancer research. 2009; 69:887–895.
12. Nitzki F, Zibat A, Frommhold A, Schneider A, Schulz-Schaeffer W, Braun T, Hahn H. Uncommitted precursor cells might contribute to increased incidence of embryonal rhabdomyosarcoma in heterozygous Patched1-mutant mice. Oncogene. 2011; 30:4428–4436.
13. Zibat A, Uhmann A, Nitzki F, Wijgerde M, Frommhold A, Heller T, Armstrong V, Wojnowski L, Quintanilla-Martinez L, Reifenberger J, Schulz-Schaeffer W, Hahn H. Time-point and dosage of gene inactivation determine the tumor spectrum in conditional Ptch knockouts. Carcinogenesis. 2009; 30:918–926.
14. Hahn H, Wojnowski L, Zimmer AM, Hall J, Miller G, Zimmer A. Rhabdomyosarcomas and radiation hypersensitivity in a mouse model of Gorlin syndrome. Nature Med. 1998; 4:619–622.
15. Schalkwyk LC, Meaburn EL, Smith R, Dempster EL, Jeffries AR, Davies MN, Plomin R, Mill J. Allelic skewing of DNA methylation is widespread across the genome. American journal of human genetics. 2010; 86:196–212.
16. Auclair G, Weber M. Mechanisms of DNA methylation and demethylation in mammals. Biochimie. 2012; 94:2202–2211.
17. Ruthenburg AJ, Allis CD, Wysocka J. Methylation of lysine 4 on histone H3: intricacy of writing and reading a single epigenetic mark. Molecular cell. 2007; 25:15–30.
18. Gregory GD, Vakoc CR, Rozovskaia T, Zheng X, Patel S, Nakamura T, Canaani E, Blobel GA. Mammalian ASH1L is a histone methyltransferase that occupies the transcribed region of active genes. Molecular and cellular biology. 2007; 27:8466–8479.
19. Clouaire T, Webb S, Skene P, Illingworth R, Kerr A, Andrews R, Lee JH, Skalnik D, Bird A. Cfp1 integrates both CpG content and gene activity for accurate H3K4me3 deposition in embryonic stem cells. Genes & development. 2012; 26:1714–1728.
20. Wang J, Hevi S, Kurash JK, Lei H, Gay F, Bajko J, Su H, Sun W, Chang H, Xu G, Gaudet F, Li E, Chen T. The lysine demethylase LSD1 (KDM1) is required for maintenance of global DNA methylation. Nature genetics. 2009; 41:125–129.
21. Caretti G, Di Padova M, Micales B, Lyons GE, Sartorelli V. The Polycomb Ezh2 methyltransferase regulates muscle gene expression and skeletal muscle differentiation. Genes & development. 2004; 18:2627–2638.
22. Delcuve GP, Khan DH, Davie JR. Roles of histone deacetylases in epigenetic regulation: emerging paradigms from studies with inhibitors. Clinical epigenetics. 2012; 4:5.
23. Denis H, Ndlovu MN, Fuks F. Regulation of mammalian DNA methyltransferases: a route to new mechanisms. EMBO reports. 2011; 12:647–656.
24. Canettieri G, Di Marcotullio L, Greco A, Coni S, Antonucci L, Infante P, Pietrosanti L, De Smaele E, Ferretti E, Miele E, Pelloni M, De Simone G, Pedone EM, et al. Histone deacetylase and Cullin3-REN(KCTD11) ubiquitin ligase interplay regulates Hedgehog signalling through Gli acetylation. Nat Cell Biol. 2010; 12:132–142.
25. He S, Wang F, Yang L, Guo C, Wan R, Ke A, Xu L, Hu G, Xu X, Shen J, Wang X. Expression of DNMT1 and DNMT3a are regulated by GLI1 in human pancreatic cancer. PLoS ONE. 2011; 6:e27684.
26. Uhmann A, Dittmann K, Nitzki F, Dressel R, Koleva M, Frommhold A, Zibat A, Binder C, Adham I, Nitsche M, Heller T, Armstrong V, Schulz-Schaeffer W, et al. The Hedgehog receptor Patched controls lymphoid lineage commitment. Blood. 2007; 110:1814–1823.
27. Daniel FI, Cherubini K, Yurgel LS, de Figueiredo MA, Salum FG. The role of epigenetic transcription repression and DNA methyltransferases in cancer. Cancer. 2011; 117:677–687.
28. Maunakea AK, Nagarajan RP, Bilenky M, Ballinger TJ, D’Souza C, Fouse SD, Johnson BE, Hong C, Nielsen C, Zhao Y, Turecki G, Delaney A, Varhol R, et al. Conserved role of intragenic DNA methylation in regulating alternative promoters. Nature. 2010; 466:253–257.
29. Hahn MA, Li AX, Wu X, Yang R, Drew DA, Rosenberg DW, Pfeifer GP. Loss of the polycomb mark from bivalent promoters leads to activation of cancer-promoting genes in colorectal tumors. Cancer research. 2014; 74:3617–3629.
30. Balasubramanian D, Akhtar-Zaidi B, Song L, Bartels CF, Veigl M, Beard L, Myeroff L, Guda K, Lutterbaugh J, Willis J, Crawford GE, Markowitz SD, Scacheri PC. H3Kme3 inversely correlates with DNA methylation at a large class of non-CpG-island-containing start sites. Genome medicine. 2012; 4:47.
31. Shahi MH, Afzal M, Sinha S, Eberhart CG, Rey JA, Fan X, Castresana JS. Regulation of sonic hedgehog-GLI1 downstream target genes PTCH1, Cyclin D2, Plakoglobin, PAX6 and NKX2.2 and their epigenetic status in medulloblastoma and astrocytoma. BMC cancer. 2010; 10:614.
32. Pritchard JI, Olson JM. Methylation of PTCH1, the Patched-1 gene, in a panel of primary medulloblastomas. Cancer Genet Cytogenet. 2008; 180:47–50.
33. Diede SJ, Guenthoer J, Geng LN, Mahoney SE, Marotta M, Olson JM, Tanaka H, Tapscott SJ. DNA methylation of developmental genes in pediatric medulloblastomas identified by denaturation analysis of methylation differences. Proceedings of the National Academy of Sciences of the United States of America. 2010; 107:234–239.
34. Du P, Ye HR, Gao J, Chen W, Wang ZC, Jiang HH, Xu J, Zhang JW, Zhang JC, Cui L. Methylation of PTCH1a gene in a subset of gastric cancers. World J Gastroenterol. 2009; 15:3799–3806.
35. Cretnik M, Musani V, Oreskovic S, Leovic D, Levanat S. The Patched gene is epigenetically regulated in ovarian dermoids and fibromas, but not in basocellular carcinomas. Int J Mol Med. 2007; 19:875–883.
36. Heitzer E, Bambach I, Dandachi N, Horn M, Wolf P. PTCH promoter methylation at low level in sporadic basal cell carcinoma analysed by three different approaches. Experimental dermatology. 2010; 19:926–928.
37. Lof-Ohlin ZM, Levanat S, Sabol M, Sorbe B, Nilsson TK. Promoter methylation in the PTCH gene in cervical epithelial cancer and ovarian cancer tissue as studied by eight novel Pyrosequencing(R) assays. International journal of oncology. 2011; 38:685–692.
38. Oliver TG, Read TA, Kessler JD, Mehmeti A, Wells JF, Huynh TT, Lin SM, Wechsler-Reya RJ. Loss of patched and disruption of granule cell development in a pre-neoplastic stage of medulloblastoma. Development. 2005; 132:2425–2439.
39. Uhmann A, Ferch U, Bauer R, Tauber S, Arziman Z, Chen C, Hemmerlein B, Wojnowski L, Hahn H. A model for PTCH1/Ptch1-associated tumors comprising mutational inactivation and gene silencing. International journal of oncology. 2005; 27:1567–1575.
40. Okano M, Bell DW, Haber DA, Li E. DNA methyltransferases Dnmt3a and Dnmt3b are essential for de novo methylation and mammalian development. Cell. 1999; 99:247–257.
41. Robert MF, Morin S, Beaulieu N, Gauthier F, Chute IC, Barsalou A, MacLeod AR. DNMT1 is required to maintain CpG methylation and aberrant gene silencing in human cancer cells. Nature genetics. 2003; 33:61–65.
42. Weisenberger DJ, Velicescu M, Cheng JC, Gonzales FA, Liang G, Jones PA. Role of the DNA methyltransferase variant DNMT3b3 in DNA methylation. Mol Cancer Res. 2004; 2:62–72.
43. Brown KD, Robertson KD. DNMT1 knockout delivers a strong blow to genome stability and cell viability. Nature genetics. 2007; 39:289–290.
44. Hahn H, Nitzki F, Schorban T, Hemmerlein B, Threadgill D, Rosemann M. Genetic mapping of a Ptch1-associated rhabdomyosarcoma susceptibility locus on mouse chromosome 2. Genomics. 2004; 84:853–858.
45. Branch S, Francis BM, Brownie CF, Chernoff N. Teratogenic effects of the demethylating agent 5-aza-2′-deoxycytidine in the Swiss Webster mouse. Toxicology. 1996; 112:37–43.
46. Rogers JM, Francis BM, Sulik KK, Alles AJ, Massaro EJ, Zucker RM, Elstein KH, Rosen MB, Chernoff N. Cell death and cell cycle perturbation in the developmental toxicity of the demethylating agent, 5-aza-2′-deoxycytidine. Teratology. 1994; 50:332–339.
47. Nelson JD, Denisenko O, Sova P, Bomsztyk K. Fast chromatin immunoprecipitation assay. Nucleic acids research. 2006; 34:e2.
48. Hall TA. BioEdit: a user-friendly biological sequence alignment editor and analysis program for Windows 95/98/NT. Nucleic Acids Symposium. 1999; 41:95–98.