Corrections:
Correction: Induction of phenotypic changes in HER2-postive breast cancer cells in vivo and in vitro
Metrics: PDF 359 views | ?
1Department of Bioengineering, Clemson University, Clemson, SC, USA
2Department of Biological Sciences, Clemson University, Clemson, SC, USA
3Center for Cancer Research, National Cancer Institute, National Institutes of Health, Bethesda, MD, USA
4CCR Collaborative Bioinformatics Resource, National Cancer Institute, National Institutes of Health, Bethesda, MD, USA
5Advanced Biomedical Computational Science, Frederick National Laboratory for Cancer Research, Frederick, MD, USA
*These authors contributed equally to this work
Published: September 28, 2023
Copyright: © 2023 Frank-Kamenetskii et al. This is an open access article distributed under the terms of the Creative Commons Attribution License (CC BY 4.0), which permits unrestricted use, distribution, and reproduction in any medium, provided the original author and source are credited.
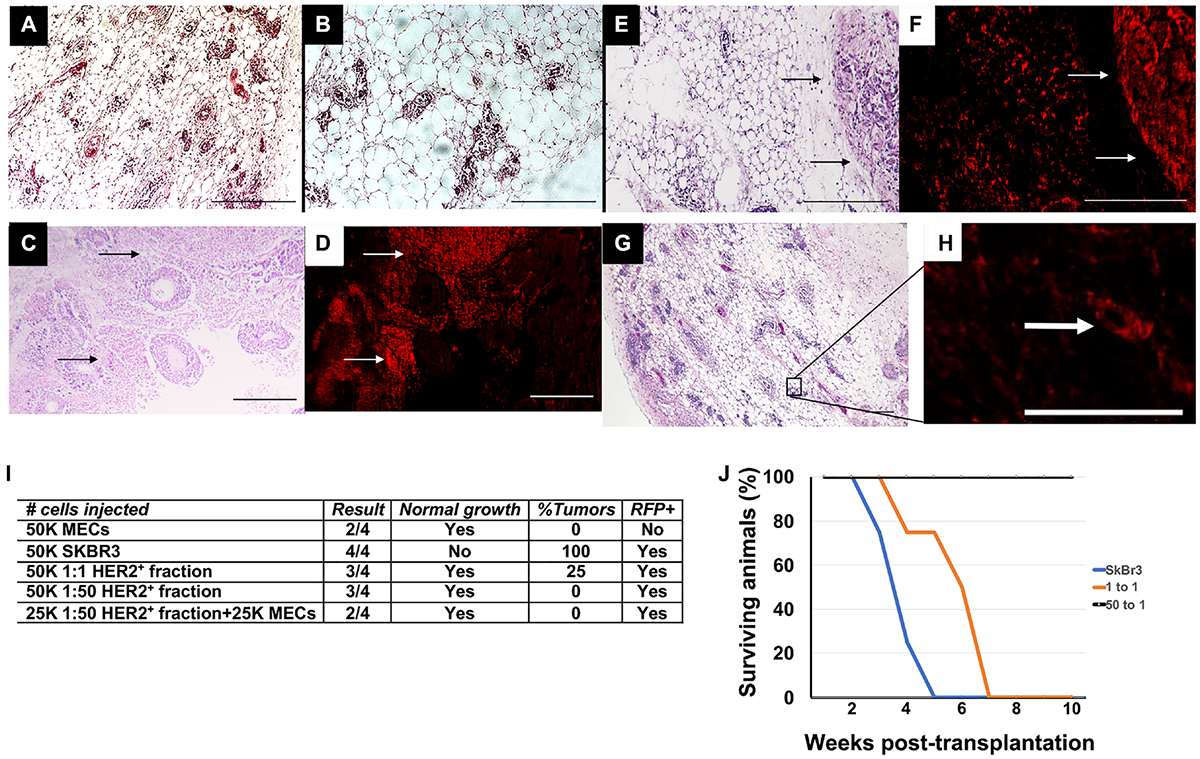
This article has been corrected: In Figure 2, panels A and B contain accidental ‘placeholder’ images that contain partial duplications of panels E and G. The corrected figure 2, obtained using the original data, shown below. The authors declare that these corrections do not change the results or conclusions of this paper.
Original article: Oncotarget. 2020; 11:2919–2929. DOI: https://doi.org/10.18632/oncotarget.27679

Figure 2: Transplantation results following in vitro redirection. (A, B) H&E staining of mammary outgrowth following MEC transplantation. (C) H&E staining of mammary tumor that formed following transplantation of SkBr3-RFP cells. (D) Fluorescent image of C. (E) H&E staining of mammary outgrowth and mammary tumor following transplantation of HER2+ 1:1 fraction. (F) Fluorescent image of E. (G) H&E staining of HER2 + 1:50 fraction. (H) Fluorescent image of outlined area in G. (I) Transplantation results. (J) Survival curve of animals listed in I. Scale bars A, B, E, F, G = 200 μm, C, D, H = 400 μm.
 All site content, except where otherwise noted, is licensed under a Creative Commons Attribution 4.0 License.
PII: 28520