
Introduction
Hepatocellular carcinoma (HCC) is the most prevalent primary liver cancer and the third leading cause of cancer-related deaths worldwide [1, 2]. Despite advances in treatment modalities such as surgical techniques, radiofrequency ablation, and novel molecular targeted agents that include multi-kinase inhibitors (e.g., sorafenib and lenvatinib) and monoclonal antibodies (e.g., anti-PD-L1 [atezolizumab] and anti-vascular endothelial growth factor [bevacizumab]), the prognosis of HCC patients is still unacceptable. This is due in large part to the advanced stage of the disease at diagnosis resulting from its asymptomatic nature [3–7]. Post-treatment relapse of HCC, including multicentric recurrence, is also common, particularly among high-risk patients such as those with hepatitis B virus (HBV) or hepatitis C virus (HCV) infection, non-alcoholic fatty liver disease, and non-alcoholic steatohepatitis. Therefore, there is an urgent need to identify novel diagnostic biomarkers to assist in the early detection of HCC, while current diagnostic approaches for HCC consist of measurement of serum α-fetoprotein levels and imaging of liver parenchyma by Gd-EOB-DTPA-enhanced magnetic resonance imaging have been established [8–14].
Metabolomics, a relatively recently introduced ‘omics’ technology, is defined as the comprehensive analysis of small molecules (typically < 1.5 kDa), including amino acids, sugars, lipids, and inorganic ions, in a biological sample [15]. The human metabolome is estimated to consist of between 2500 and 8000 metabolites [16, 17]. Currently, the three main analytical methods for metabolome analysis are gas chromatography / mass spectrometry, liquid chromatography–mass spectrometry, and capillary electrophoresis–mass spectrometry, each of which analyzes a different class of metabolites [15, 18]. In the last two decades, these analytical methods have been advanced and optimized to enable disease phenotyping and biomarker identification, and they have been increasingly applied in clinical settings [19, 20]. We previously reported on the use of an advanced technique, capillary electrophoresis–time-of-flight mass spectrometry (CE-TOFMS), to monitor changes in liver metabolites following hepatectomy with ischemia reperfusion [21]. Several studies have investigated alterations in the metabolome during hepatocarcinogenesis and identified several candidate metabolic biomarkers that could potentially discriminate between liver diseases, including HCC [22–26]. However, those findings were various and a consensus decision on a reliable metabolomic biomarker of liver disease and/or hepatocarcinogenesis has not yet been reached.
In the present study, we sought to discover reliable metabolomic biomarkers for HCC diagnosis by elucidating metabolic alterations in primary HCC tumor tissue compared with non-tumor tissue, and additionally by investigating the serum metabolomic profiles before and after curative hepatectomy.
Results
Metabolic alterations in HCC tumor tissue
The metabolomic profiles of tumor and non-tumor liver tissues from 20 HCC patients and 4 CRLM patients were obtained and subjected to OPLS-DA. As shown in the scores plot in Figure 1, the metabolomes of HCC tumor and non-tumor tissues could be clearly distinguished. Similarly, PCA revealed obvious differences in the component profiles of the 20 HCC tumor and 4 CRLM tissues (Figure 2A). The analysis did not distinguish between the metabolomic profiles of HCC tumors from HBV-infected (n = 5), HCV-infected (n = 7), or uninfected (n = 8) patients (Figure 2A), indicating that the metabolomes did not differ significantly between HCC of differing etiologies. Notably, the profiles were also similar between non-tumor tissue from patients with HCC and CRLM (Figure 2B) and between non-tumor tissue from patients with HCC of differing etiologies (Figure 2B).
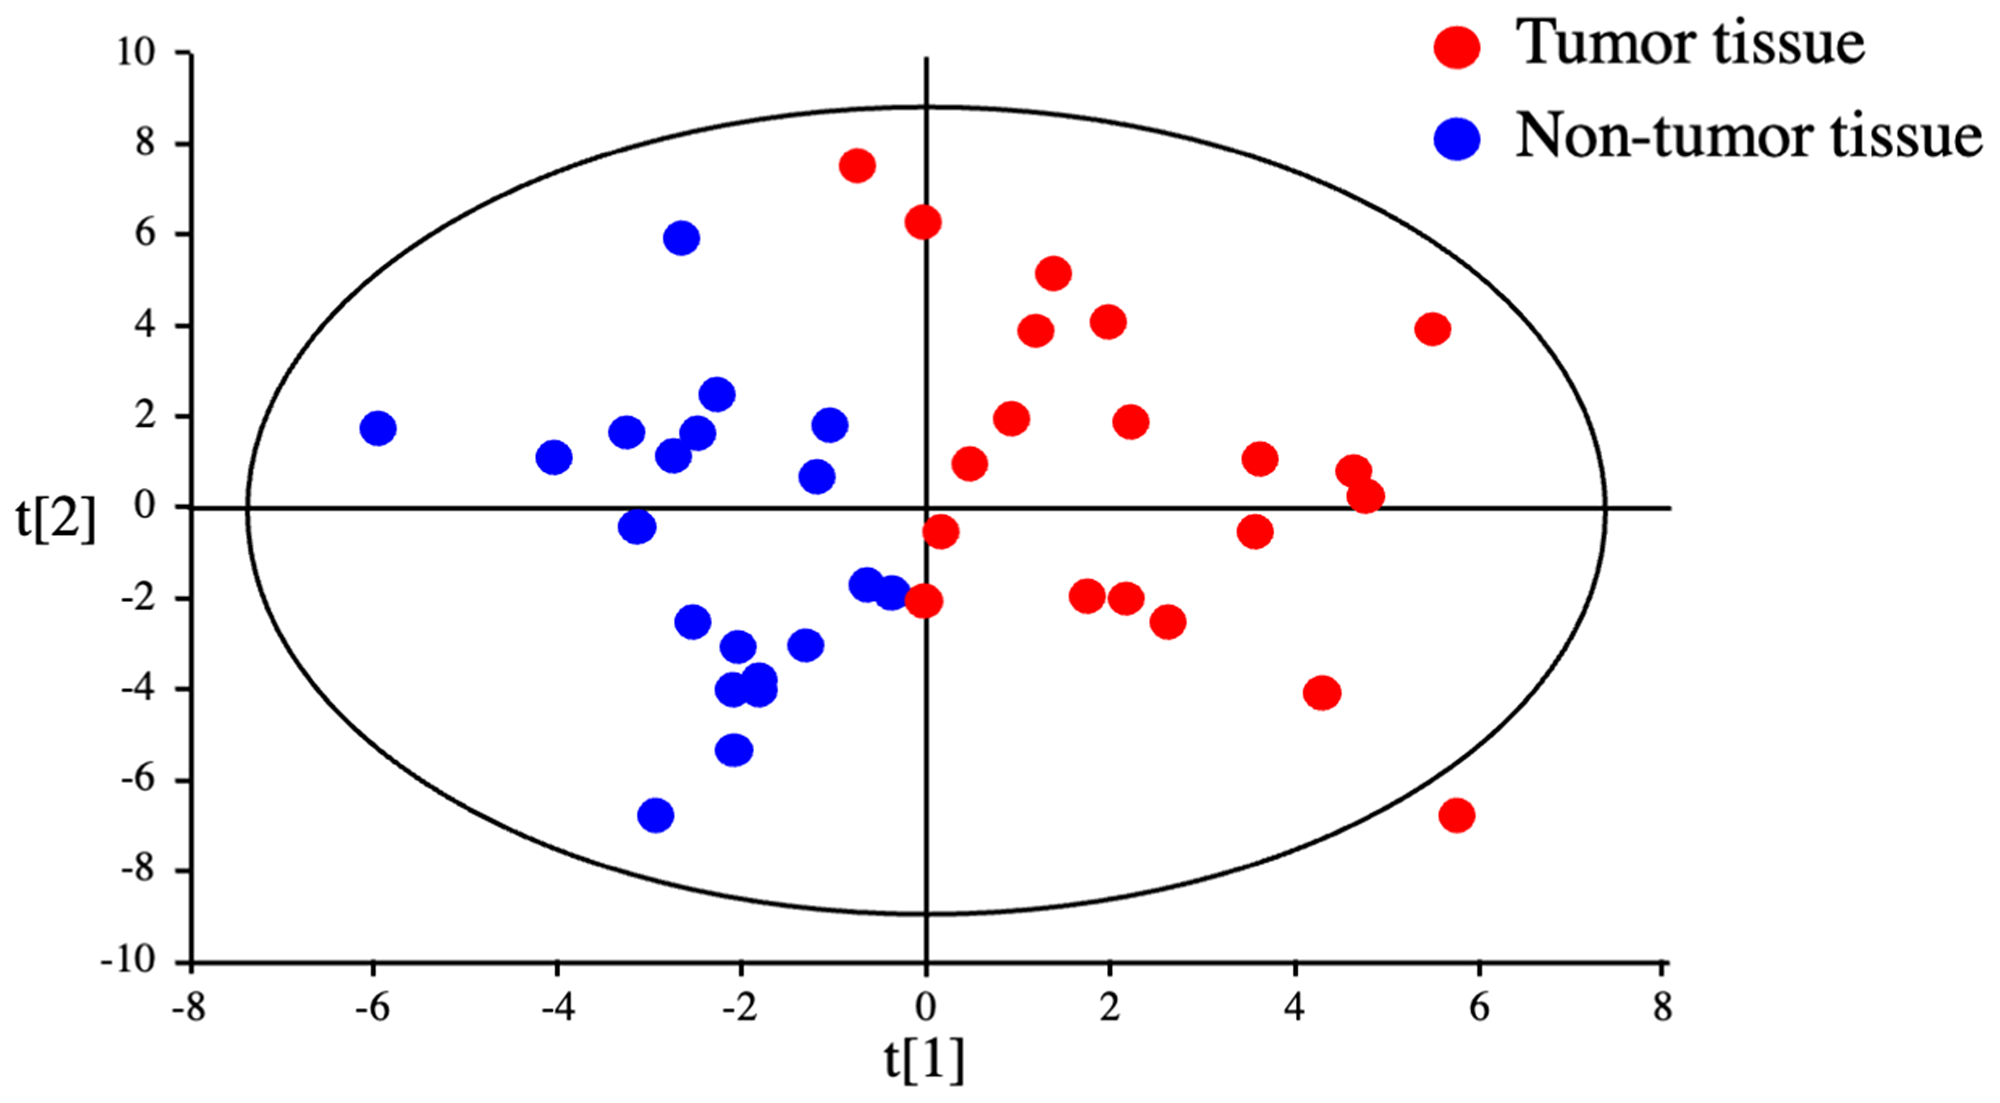
Figure 1: Discrimination between tumor and non-tumor tissues from HCC patients by metabolomics. OPLS-DA of HCC tumor and non-tumor tissues could clearly distinguished.
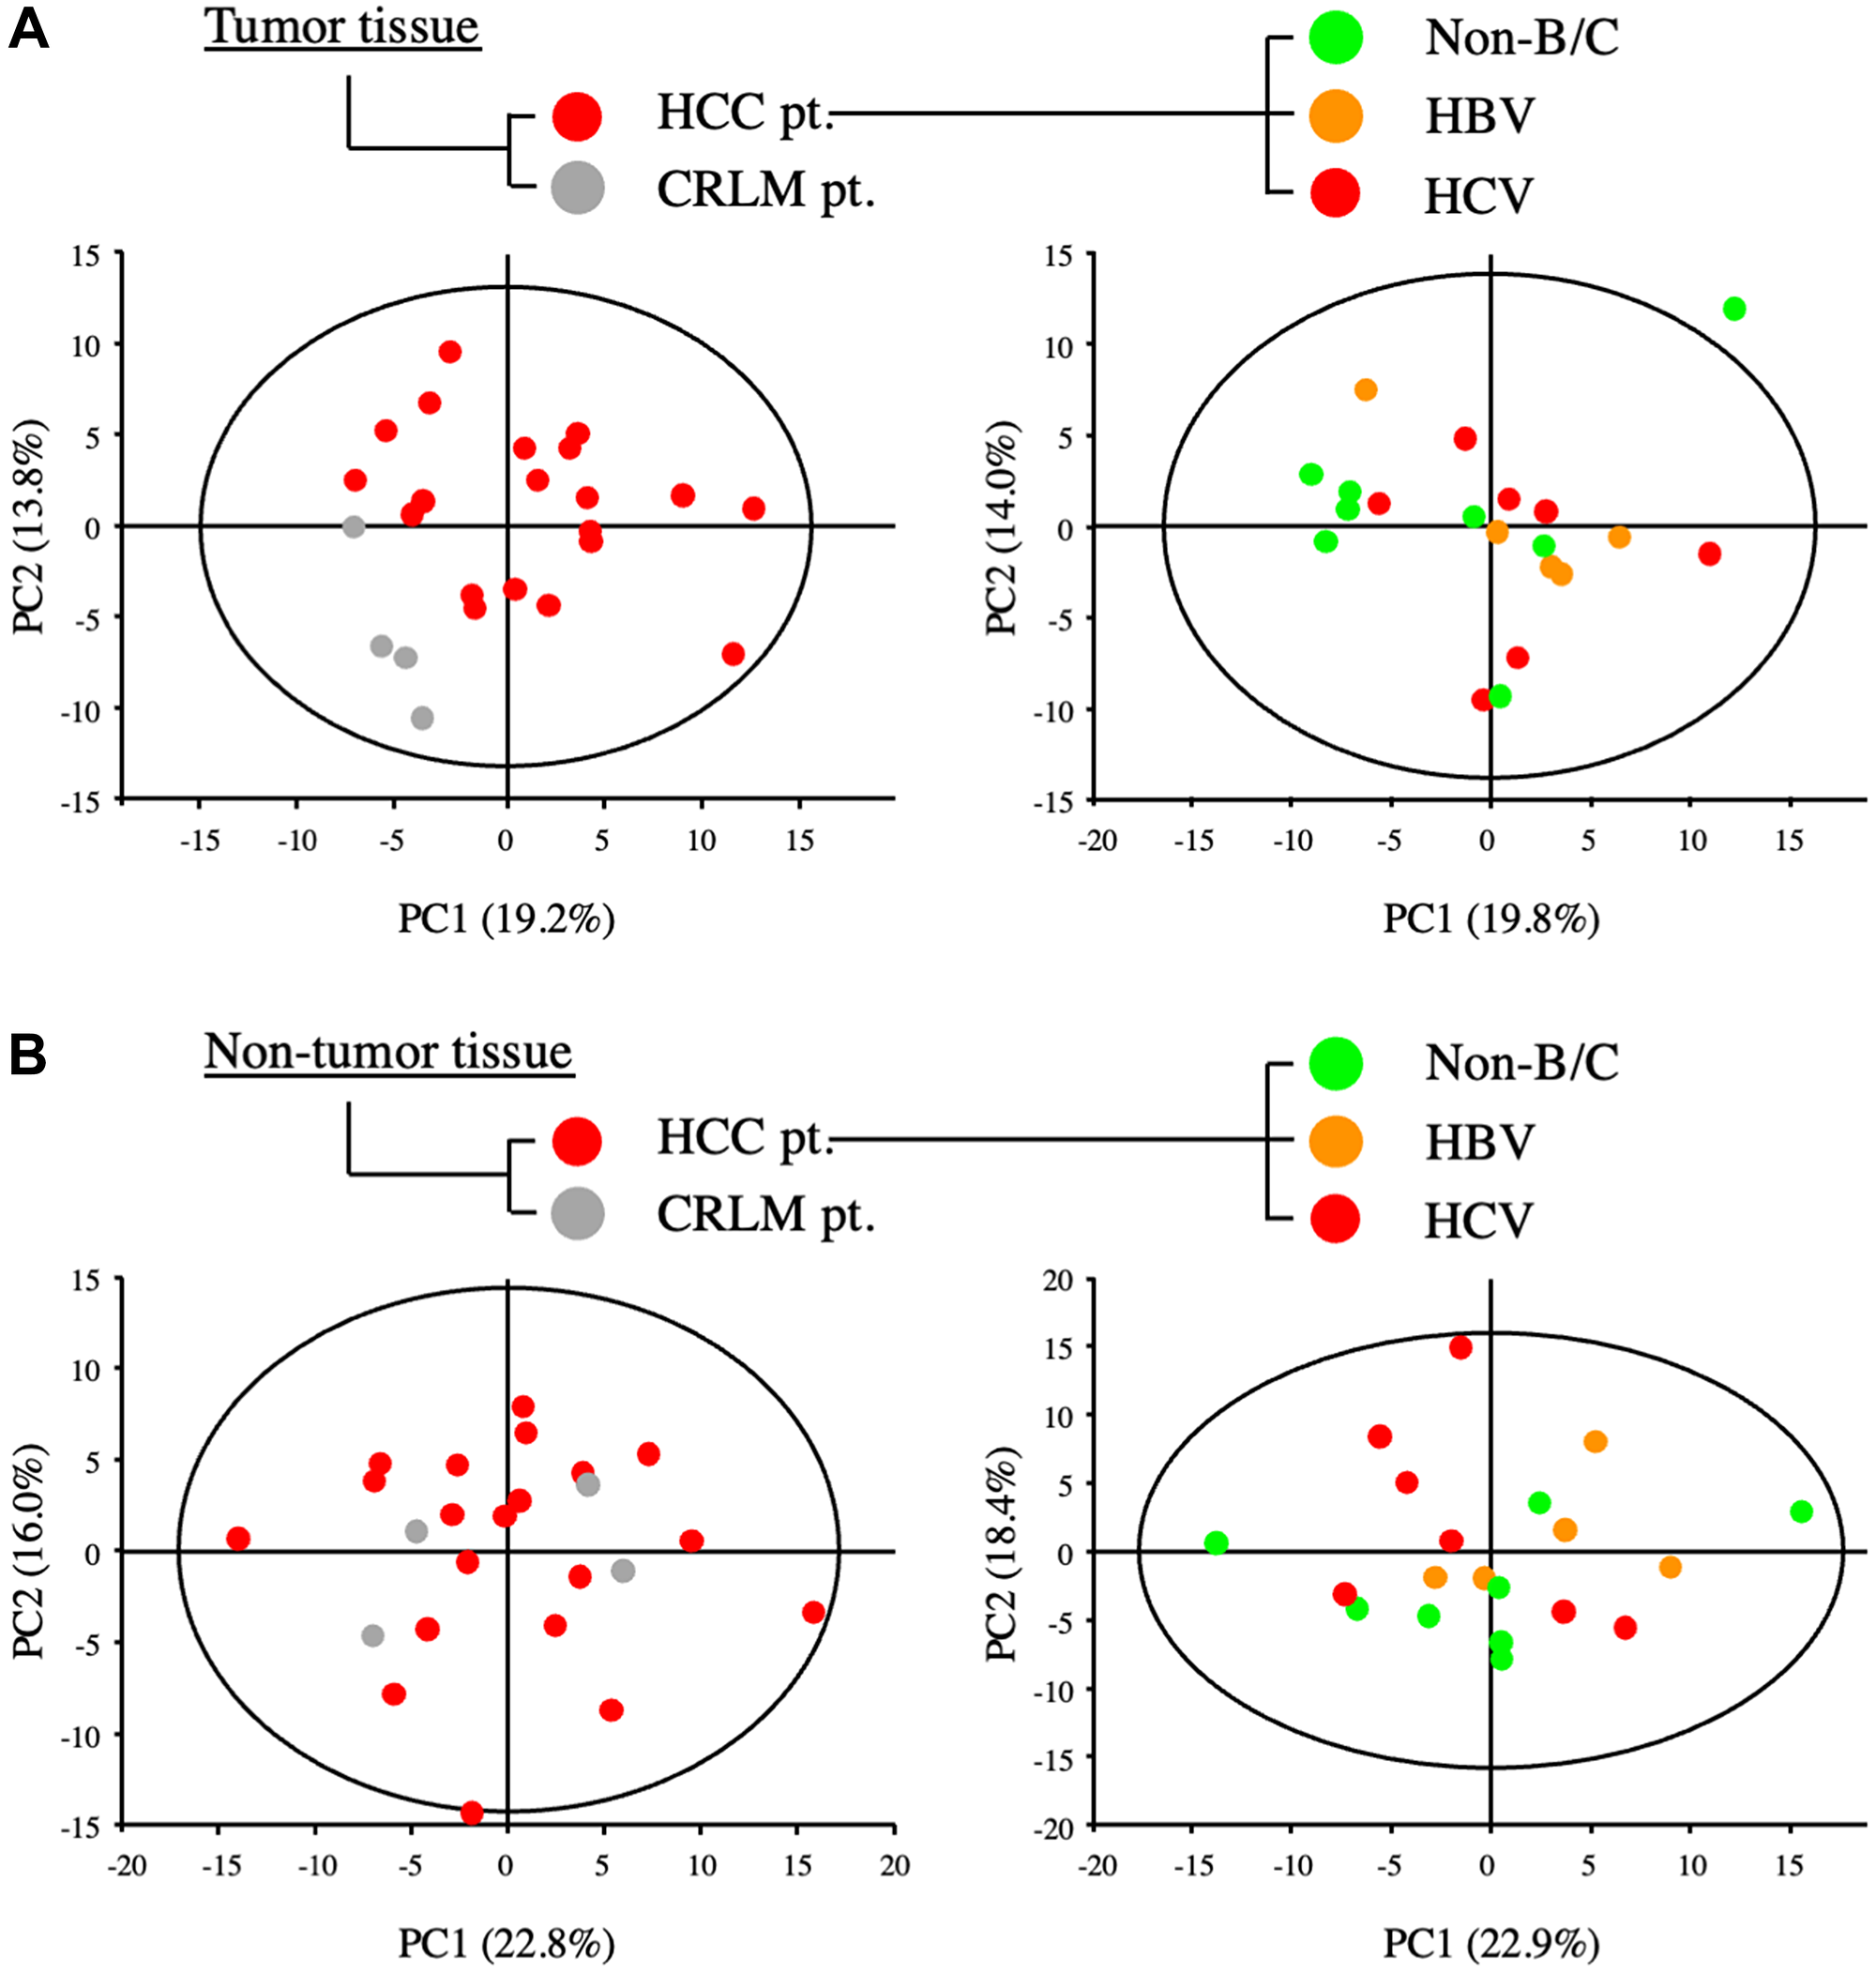
Figure 2: Metabolic analysis of primary and metastatic liver tumors from patients with HCC and colorectal cancer. (A) PCA of components of tumor tissues from patients with HCC (HCC-pt), CRLM (CLRM-pt), and HCC of viral (HBV, HCV) and non-viral etiology (non-B/C). (B) PCA of components of non-tumor liver tissues from patients as described for (A).
We analyzed a total of 179 metabolites in HCC tumor versus non-tumor tissues. Among these, 61 metabolites had a variable importance for projection (VIP) score of >1.0 and a p value < 0.05 and were thus considered critical metabolites for distinguishing between the metabolomic profiles of HCC tumor and non-tumor tissues (Supplementary Figure 1 and Table 1). Hierarchical clustering of the 61 metabolites revealed that 30 metabolites were significantly upregulated and 31 were significantly downregulated in HCC tumor tissue compared with non-tumor tissue (Figure 3A and Table 2). One of the metabolites upregulated in HCC tumor tissue was lactate, which is consistent with the known propensity of tumor cells to undergo elevated rates of aerobic glycolysis; a process known as the Warburg effect. In addition, 10 amino acids were increased in HCC tumor compared with non-tumor tissue, and of these, 7 were the essential amino acids (EAAs) valine, leucine, isoleucine, tryptophan, methionine, lysine, and phenylalanine (Figure 3B).
Table 1: Tissue metabolites that distinguish between HCC tumor tissue and non-tumor tissue (VIP >1.0, p < 0.05)
| No. | Up-regulated metabolites in tumor tissue | VIP score | No. | Down-regulated metabolites in tumor tissue | VIP score |
|---|---|---|---|---|---|
| 1 | Lactate | 1.78707 | 1 | Pyridoxamine 5’-phosphate | 2.4411 |
| 2 | Phosphorylcholine | 1.71512 | 2 | Glycerophosphate | 2.37857 |
| 3 | Phe | 1.65483 | 3 | Guanidinosuccinate | 2.17465 |
| 4 | SAM+ | 1.63714 | 4 | N-Acetylneuraminate | 2.07864 |
| 5 | Ethanolamine phosphate | 1.62781 | 5 | Thiamine | 1.97634 |
| 6 | Trp | 1.56405 | 6 | Urate | 1.9265 |
| 7 | CDP-choline | 1.5565 | 7 | N,N-Dimethylglycine | 1.92546 |
| 8 | 3-Hydroxy-3-methylglutarate | 1.51524 | 8 | NADH | 1.92425 |
| 9 | Met | 1.50306 | 9 | FAD | 1.84351 |
| 10 | Cystathionine | 1.48954 | 10 | Glycerophosphorylcholine | 1.79874 |
| 11 | Ile | 1.4859 | 11 | Succinate | 1.71503 |
| 12 | Asymmetric dimethylarginine | 1.37081 | 12 | O-Phosphoserine | 1.6733 |
| 13 | N-Acetyl-beta-alanine | 1.34241 | 13 | Sedoheptulose 7-phosphate | 1.62377 |
| 14 | 2-Hydroxyglutarate | 1.28193 | 14 | Glucose | 1.61838 |
| 15 | UDP-N-acetylglucosamine | 1.2539 | 15 | gamma-Glu-Cys | 1.55918 |
| 16 | Tyr | 1.23994 | 16 | 2-Aminobutyrate | 1.39563 |
| 17 | Leu | 1.21722 | 17 | Cytosine | 1.31766 |
| 18 | Homoserine | 1.20879 | 18 | Sarcosine | 1.28744 |
| 19 | Guanidinoacetate | 1.19845 | 19 | NAD+ | 1.27527 |
| 20 | Ser | 1.19066 | 20 | Xanthosine | 1.26902 |
| 21 | Val | 1.18445 | 21 | Nicotinamide | 1.26782 |
| 22 | N-Acetylaspartate | 1.17003 | 22 | Creatine | 1.25463 |
| 23 | Arg | 1.1405 | 23 | NADP+ | 1.24883 |
| 24 | N-Acetylglucosamine 1-phosphate | 1.12281 | 24 | Betaine | 1.18196 |
| 25 | Spermidine | 1.12021 | 25 | Creatinine | 1.12331 |
| 26 | Glutarate | 1.11995 | 26 | IMP | 1.1043 |
| 27 | Methionine sulfoxide | 1.11277 | 27 | GABA | 1.10039 |
| 28 | Putrescine | 1.07124 | 28 | beta-Ala | 1.09067 |
| 29 | Lys | 1.06571 | 29 | Fumarate | 1.09013 |
| 30 | 2-Phosphoglycerate | 1.03023 | 30 | Pipecolate | 1.04196 |
| 31 | Malate | 1.0326 |
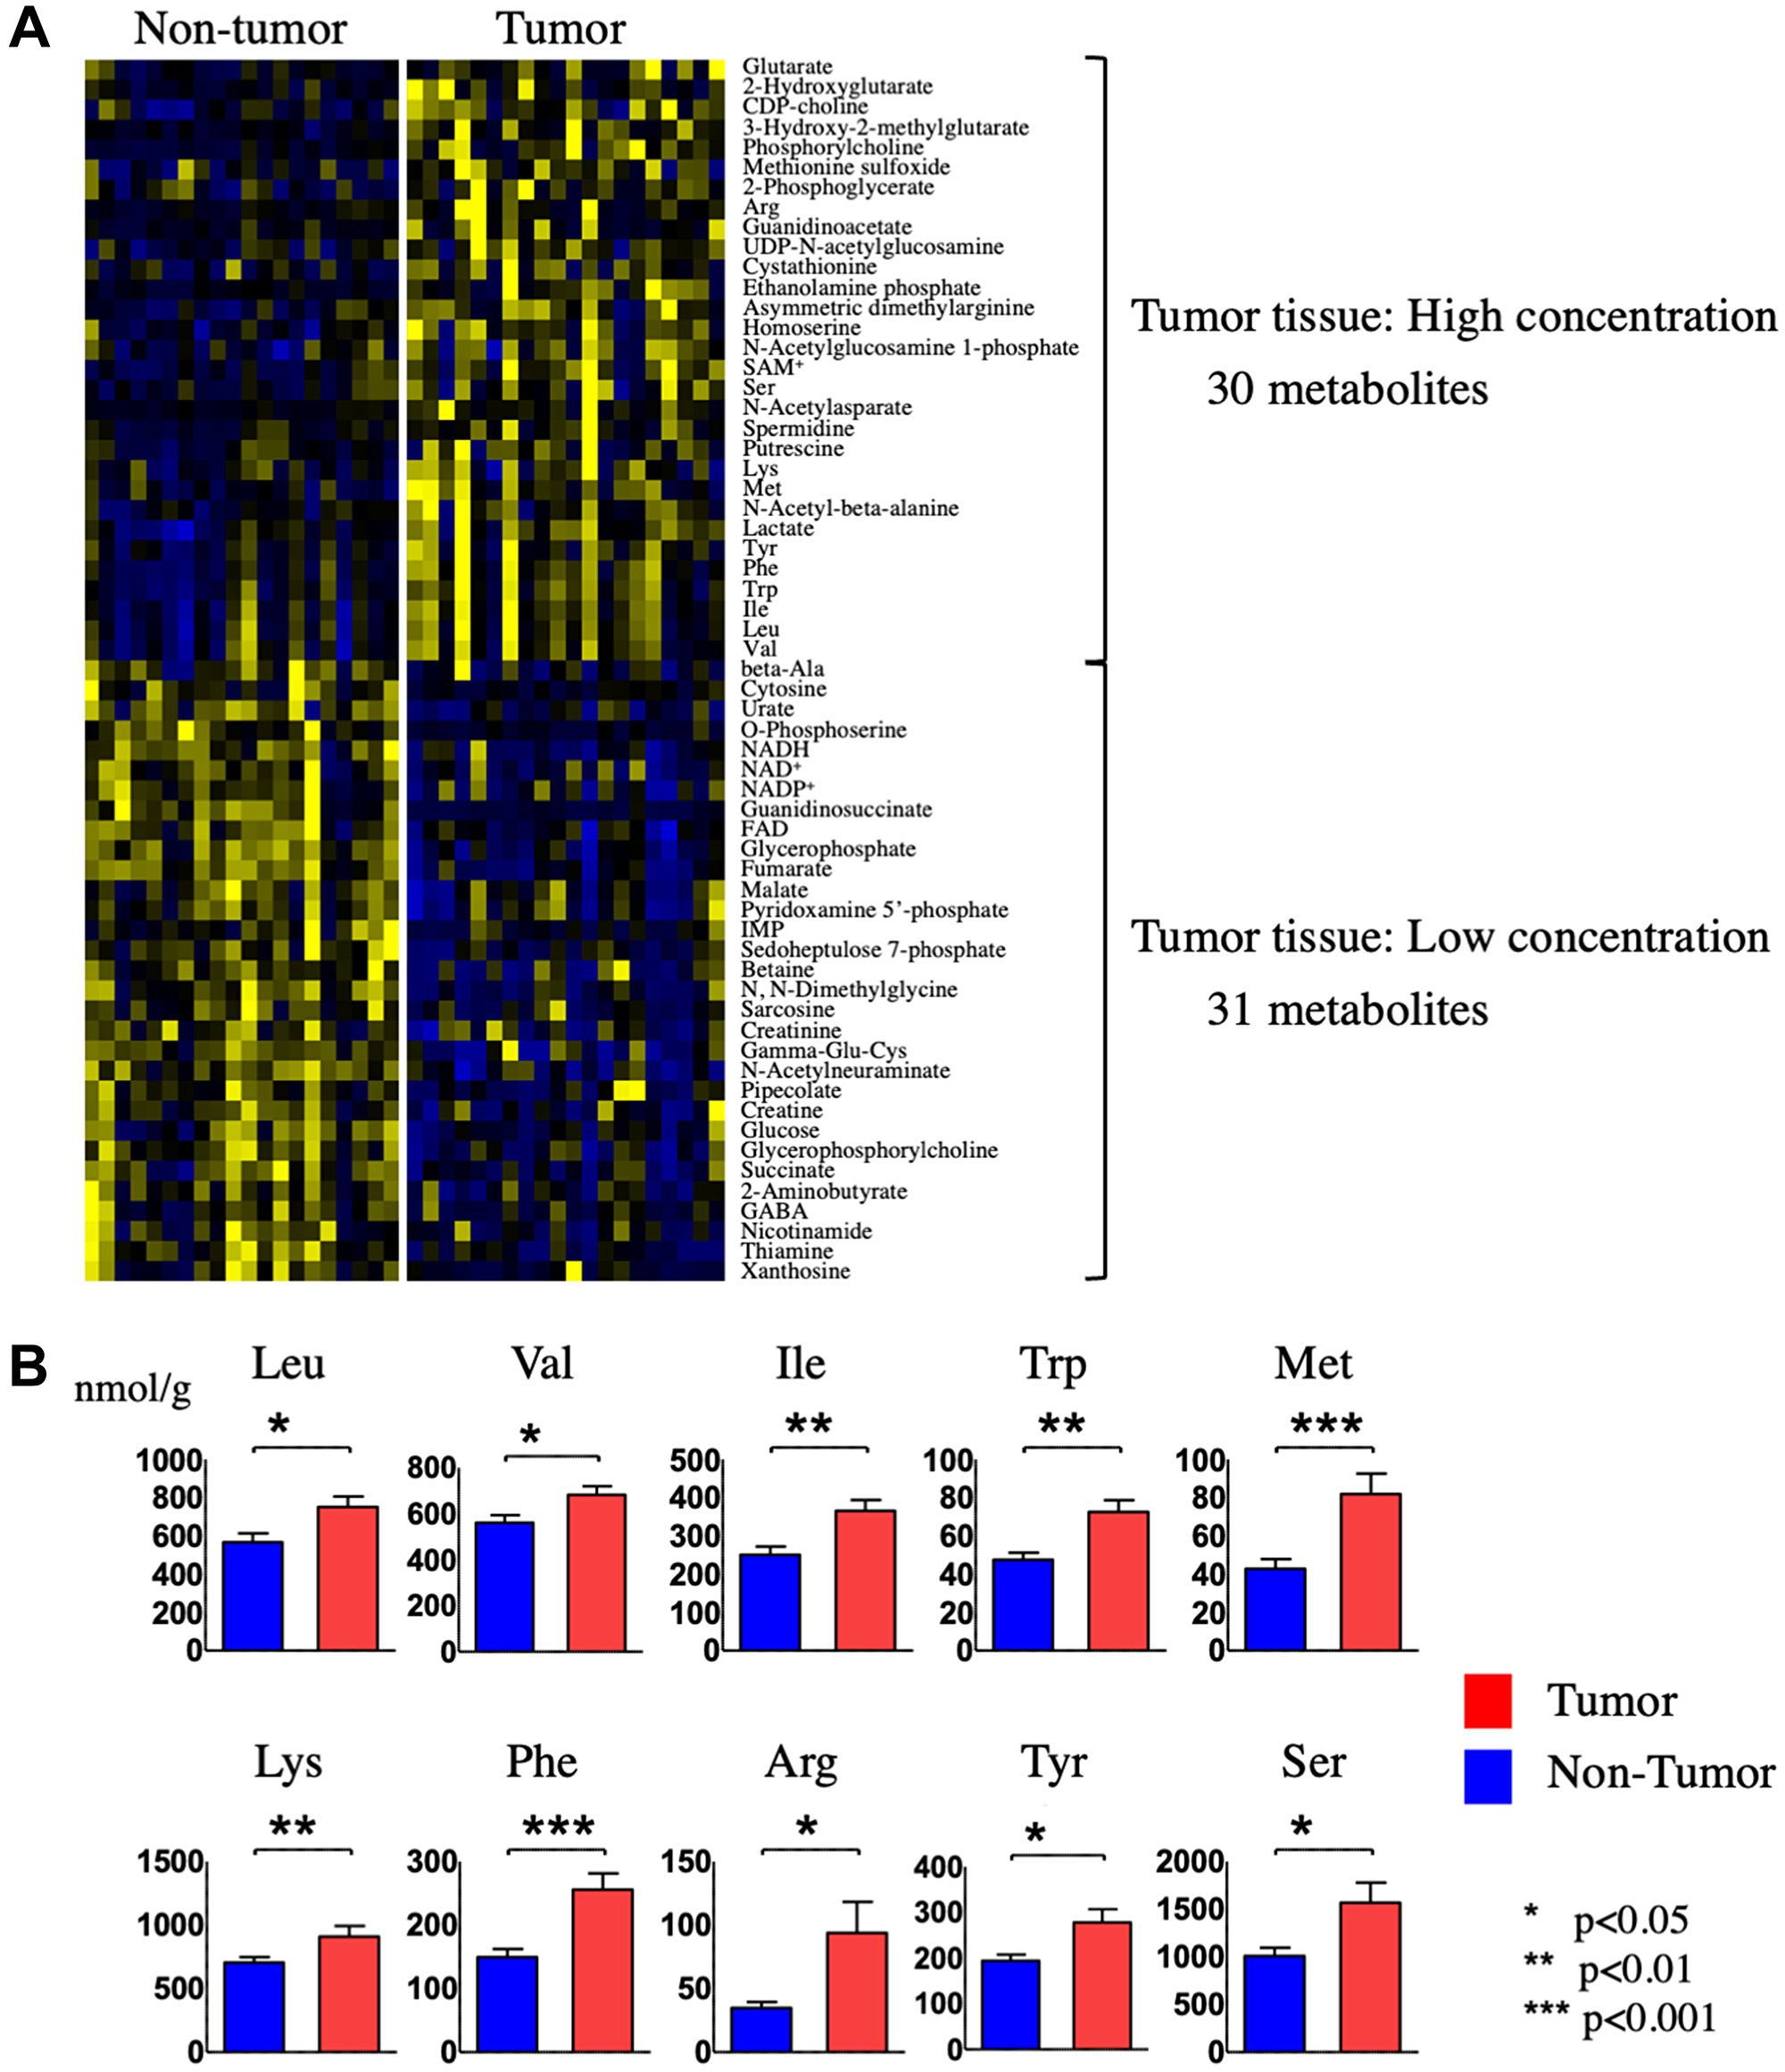
Figure 3: Identification and quantification of metabolites in tumor and non-tumor tissues from HCC patients. (A) Hierarchical clustering of metabolites present at different levels in HCC tumor tissue compared with non-tumor tissue. (B) Quantification of the indicated 10 amino acids in HCC tumor tissue compared with non-tumor tissue.
Table 2: Serum metabolites that distinguish between HCC patients before and after hepatectomy (VIP >1.0, p < 0.05)
| No. | Increased metabolites in post-Hx | VIP score | No. | Decrease metabolites in post-Hx | VIP score |
|---|---|---|---|---|---|
| 1 | Methionine sulfoxide | 2.11817 | 1 | His | 2.30411 |
| 2 | Glycolate | 1.95728 | 2 | Pentanoate + 3-Methylbutanoate | 2.22692 |
| 3 | N-Acetylglucosamine | 1.79674 | 3 | Val | 2.07023 |
| 4 | Asymmetric dimethylalginine | 1.78249 | 4 | Glycerophosphorylcholine | 2.06643 |
| 5 | Phe-Phe | 1.59984 | 5 | Trp | 1.70211 |
| 6 | Lactate | 1.48632 | 6 | Ala | 1.66633 |
| 7 | Hypoxanthine | 1.48582 | 7 | 4-Oxohexanoate + 4-Acetylbutyrate | 1.63735 |
| 8 | beta-Ala | 1.47965 | 8 | Thr | 1.63534 |
| 9 | N-Acetylaspartate | 1.42722 | 9 | Carnitine | 1.52112 |
| 10 | N-Acetylglutamate | 1.42277 | 10 | 4-Methyl-2-oxopentanoate | 1.48188 |
| 11 | 3-Hydroxybutyrate | 1.32702 | 11 | 3-Indoxyl sulfate | 1.41297 |
| 12 | Fumarate | 1.2612 | 12 | 2-Oxoisopentanoate | 1.37897 |
| 13 | Allantoin | 1.18354 | 13 | Leu | 1.36857 |
| 14 | Gly | 1.36797 | |||
| 15 | Kynurenine | 1.34456 | |||
| 16 | Azelate | 1.14054 |
Changes in serum metabolic profiles after hepatectomy
OPLS-DA statistics also showed a clear distinction between the serum metabolomes of patients before and 14 days after hepatectomy (Figure 4). Of the 110 metabolites identified, 29 had a VIP score >1.0 and a p value < 0.05 and were considered critical metabolites for distinguishing between pre-and post-Hx patients (Supplementary Figure 2 and Table 2). Hierarchical clustering of the metabolites indicated that serum levels of 16 metabolites increased before Hx and decreased after Hx, moreover, those of 13 metabolites decreased before Hx and increased after Hx (Figure 5A). Interestingly, 5 EAAs (leucine, valine, tryptophan, histidine, and threonine) were included in the 16 increased metabolites before Hx.
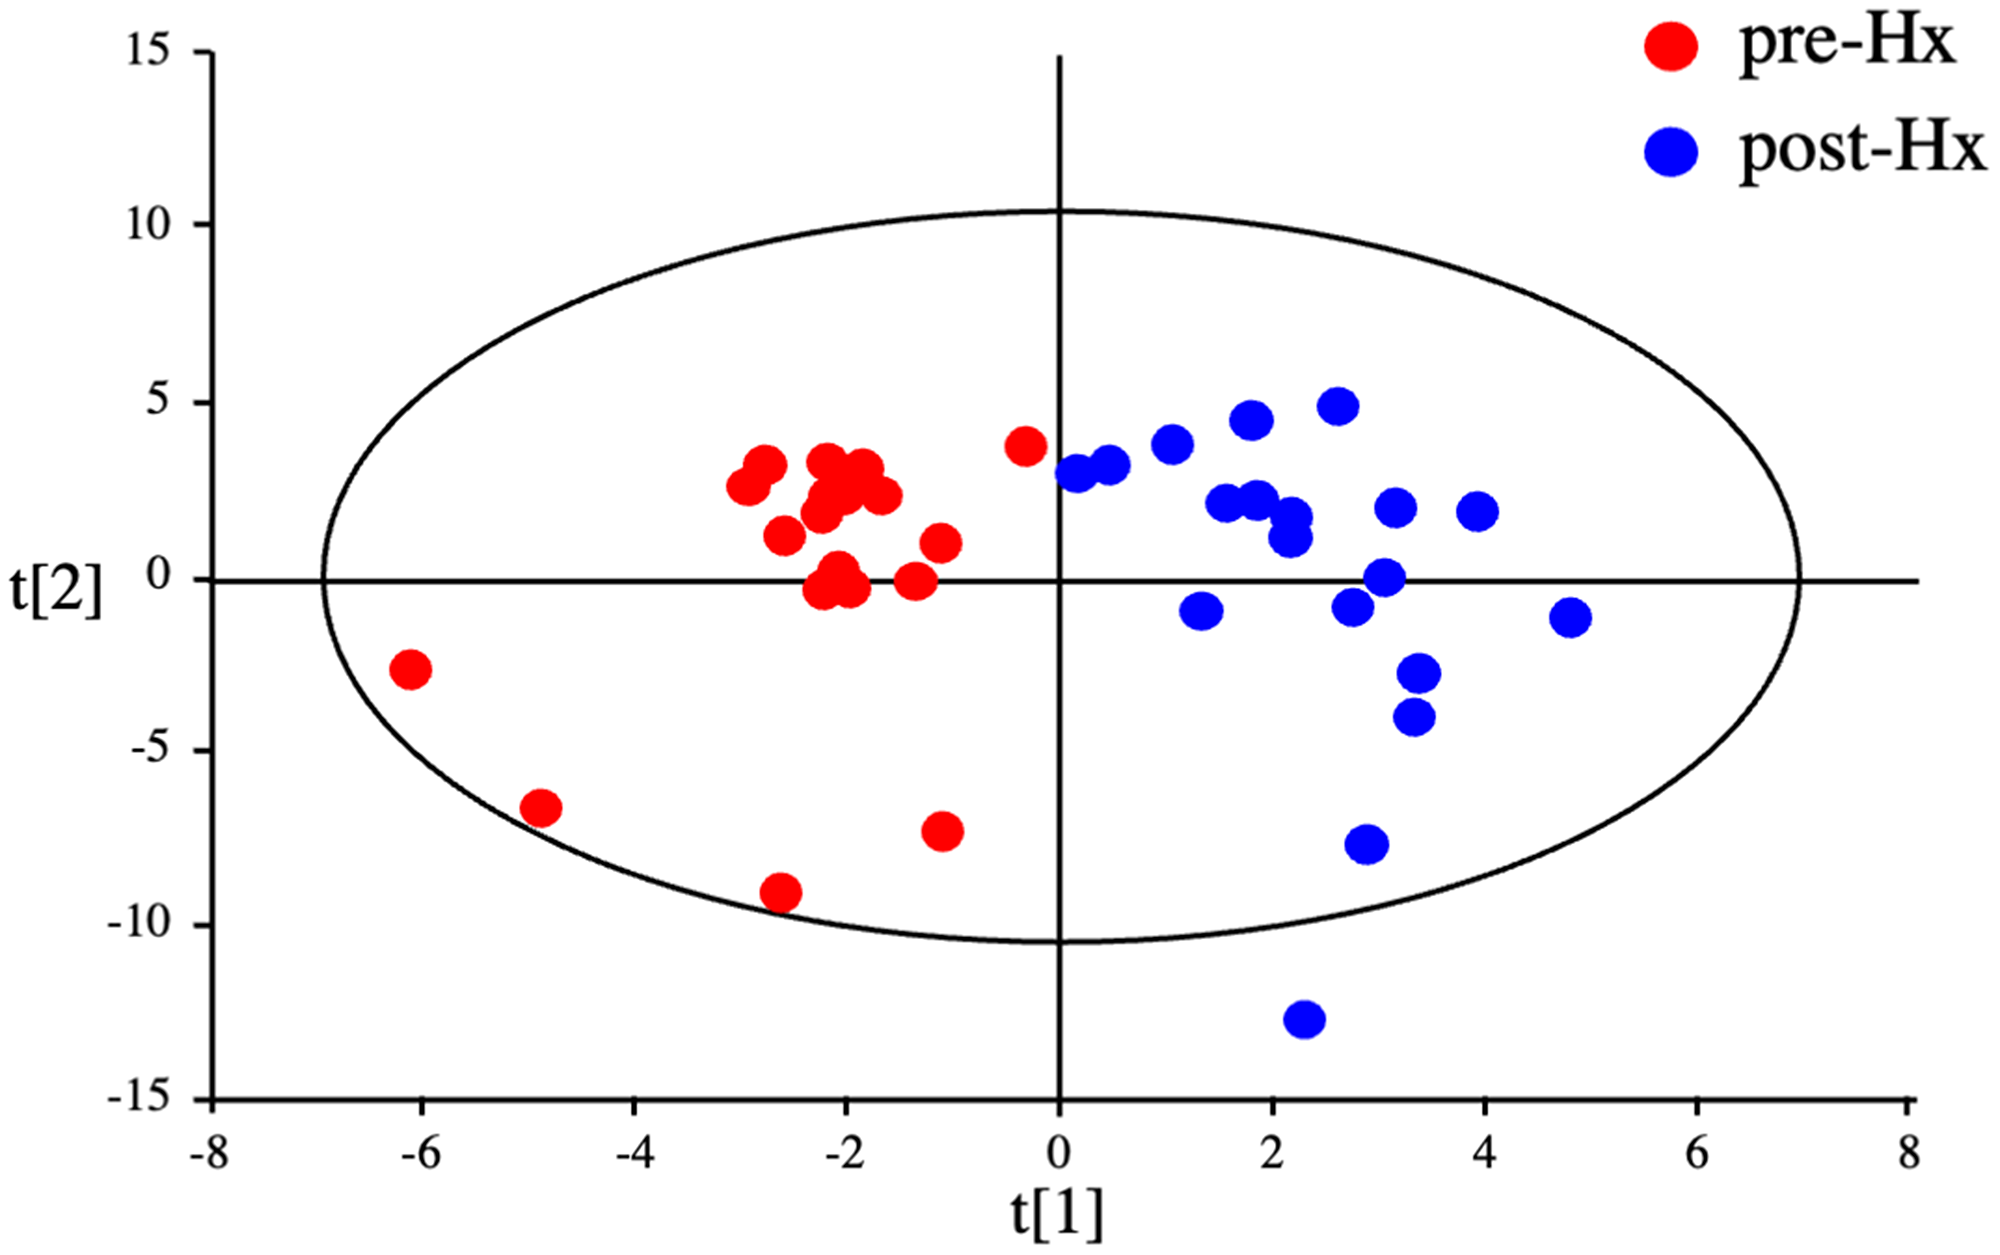
Figure 4: Discrimination between HCC patients before and after hepatectomy by serum metabolomics. OPLS-DA of serum metabolites from HCC patients before and after hepatectomy.
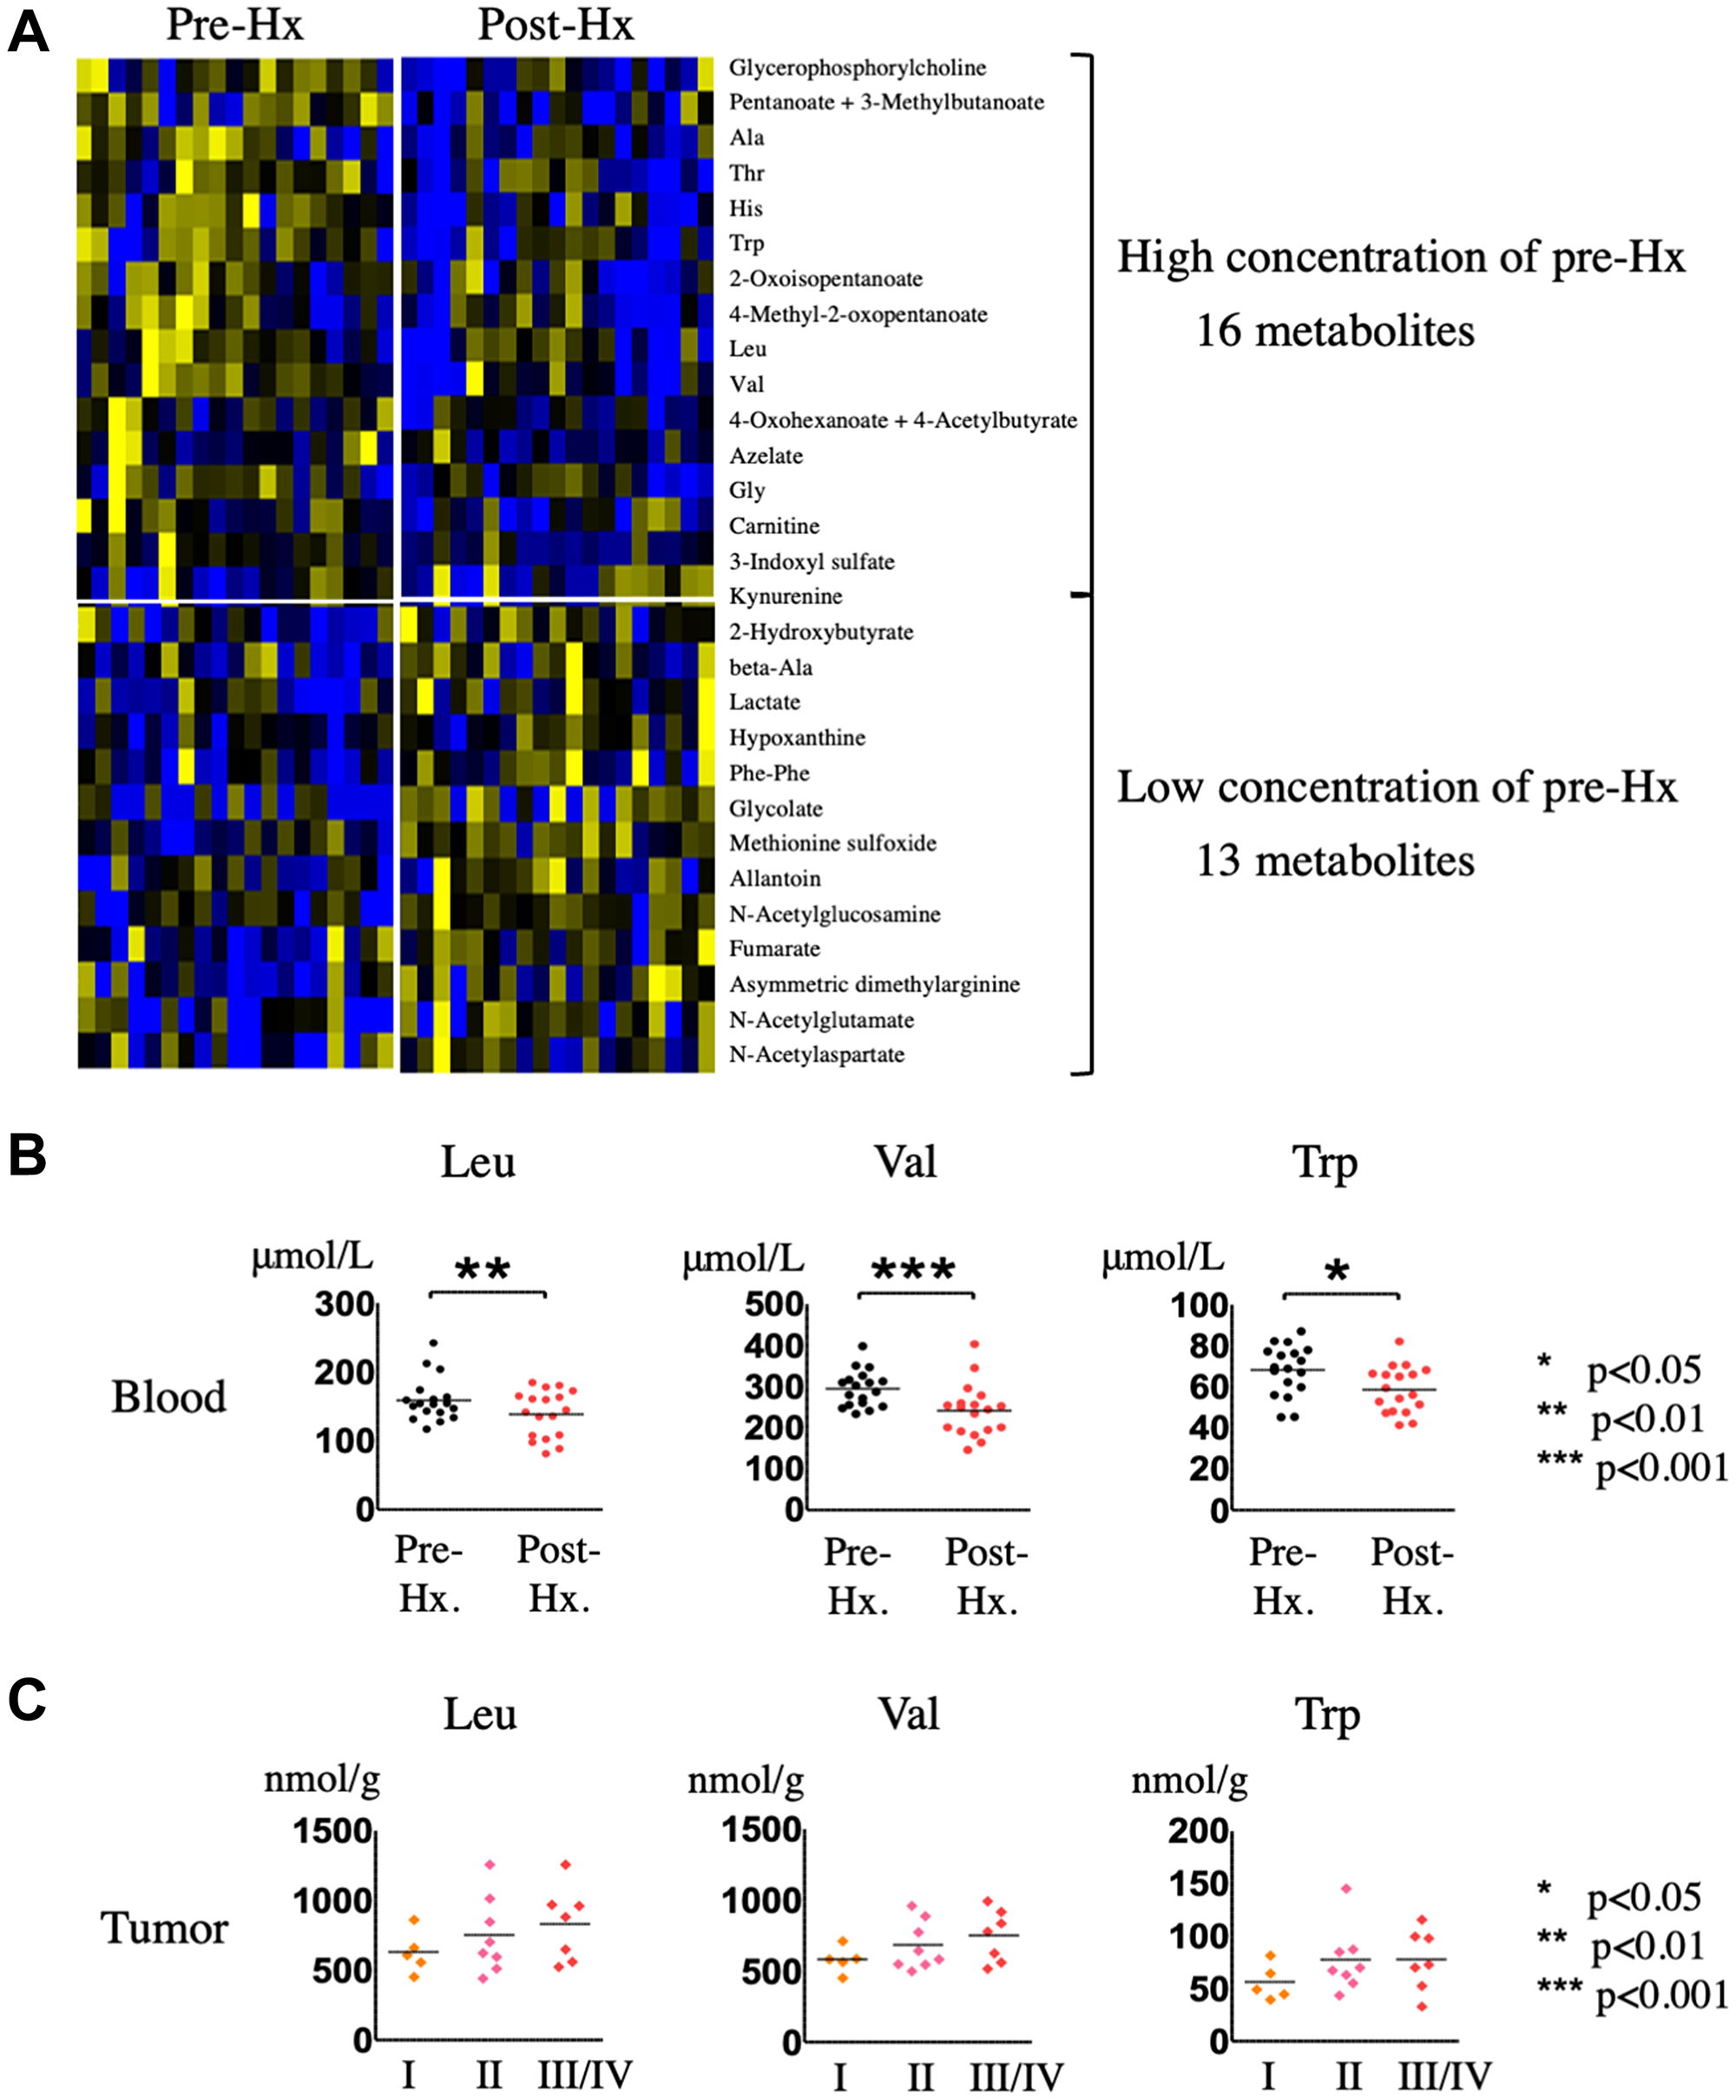
Figure 5: Identification and quantification of serum metabolites in HCC patients before and after hepatectomy. (A) Hierarchical clustering of metabolites in sera from HCC patients after hepatectomy compared with before hepatectomy. (B) Quantification of EAAs in sera from HCC patients after hepatectomy compared with before hepatectomy. (C) Quantification of EAAs in HCC tumor tissues of patients stratified according to HCC staging.
Candidate metabolic biomarkers for hepatocarcinogenesis
To determine whether the metabolites identified here could serve as biomarkers for HCC detection, we focused on the metabolites commonly upregulated in HCC tumor compared with non-tumor tissue and increased in sera from patients pre-Hx compared with post-Hx, which included the three EAAs, leucine (VIP scores: HCC tumor tissue, 1.21722; serum, 1.36857), valine (VIP scores: HCC tumor tissue, 1.18445; serum, 2.07023), and tryptophan (VIP scores: HCC tumor tissue, 1.56405; serum, 1.70211). Figure 5B shows the serum concentrations of the three EAAs, confirming their significant increase before Hx, and significant decrease after Hx. Mean serum concentrations of leucine before and after Hx were 162 ± 32, and 139 ± 33 (μmol/L), respectively. And, mean serum concentrations of valine before and after Hx were 301 ± 51, and 242 ± 62 (μmol/L), respectively. Moreover, mean serum concentrations of tryptophan before and after Hx were 70 ± 13, and 59 ± 11 (μmol/L), respectively. We also investigated whether tumor levels of the EAAs changed as the tumor progressed, and found that leucine, valine, and tryptophan levels did indeed increase with advancing disease stage (Figure 5C). Taken together, these data suggest that leucine, valine, and tryptophan could be potential candidate metabolomic biomarkers for hepatocarcinogenesis.
DISCUSSION
In this study, the major findings were (i) the metabolomic profile of HCC tumors differs not only compared with matched non-tumor liver tissue but also with CRLM tissue, (ii) the serum metabolome of HCC patients is altered by hepatectomy, and (iii) the three EAAs leucine, valine, and tryptophan are candidate metabolomic biomarkers for hepatocarcinogenesis. Notably, however, we found that the metabolic profiles of HCC tumor tissues of differing etiologies (HBV/HCV infection) could not be distinguished, nor could the profiles of non-tumor liver tissue from any of the patient subgroups.
Numerous genomic, transcriptomic, and proteomic studies have been performed with the goal of identifying biomarkers of hepatocarcinogenesis; however, most of the markers discovered have not yet been demonstrated to have clinical utility [27, 28]. Metabolomics could have some advantages over other omics approaches because it can comprehensively identify all low molecular weight metabolites from tissue or blood samples and can identify different phenotypes of various of diseases, including cancer [15–18]. The liver plays a central role in the metabolism of carbohydrates, amino acids, and lipids [29]; therefore, it is not surprising that normal metabolic homeostasis is easily disrupted during liver diseases such as hepatitis virus infection and non-alcoholic steatohepatitis. Metabolic reprograming of tumor cells is a well-documented phenomenon that undoubtedly provides an advantage for tumor cell survival through pathways such as energy generation, macromolecular biosynthesis, and regulation of reactive oxygen species production [24–26]. In this context, metabolomic analysis could be considered an ideal tool to identify the metabolic characteristics that discriminate between healthy subjects and HCC and between patients at different disease HCC stages. Such an ability would facilitate the discovery of reliable early diagnostic and prognostic biomarkers, as well as providing a method to monitor treatment response of patients with HCC.
Several studies have investigated HCC-associated disease signatures using metabolomics [23–26]. Xue et al. established a diagnostic signature of 13 serum metabolites (butanoic acid, ethanimidic acid, glycerol, L-isoleucine, L-valine, aminomalonic acid, D-erythrose, hexadecanoic acid, octadecanoic acid, 9,12-octadecadienoic acid, and 3 unidentified compounds) that could distinguish between HCC patients and healthy subjects [30]. Fitian et al. identified elevated serum levels of 9 kinds of metabolites, including 12-hydroxyeicosatetraenoic acid (12-HETE), 15-HETE, sphingosine, γ-glutamyl oxidative stress-associated metabolites, xanthine, serine, glycine, aspartate, and acylcarnitines, that were strongly associated with hepatocarcinogenesis in patients with HCV-associated cirrhosis [31]. Furthermore, other investigators have compared the metabolomic profiles of HCC tumor tissue and non-tumor tissue. Beyoğlu et al. classified HCC patients into six subgroups according to the presence of HBV infection, p53 mutation, and activation of Wnt/β-catenin signaling, and they found that HCC with HBV infection resulted in markedly reduced tissue concentrations of 1-stearoylglycerol, 1-palmitoylglycerol, and palmitic acid [32]. Huang et al. also demonstrated metabolic alternations associated with HCC. In that study, HCC tumor tissue contained elevated levels of glycolysis, gluconeogenesis, and β-oxidation metabolites and reduced levels of tricarboxylic acid cycle and Δ-12 desaturase metabolites compared with adjacent non-tumor tissue [33]. Thus, although several studies have investigated the general and tissue metabolomic profiles of HCC patients, the findings have varied considerably in each study.
In the present study, we identified 30 metabolites present at increased levels in HCC tumor tissue compared with non-tumor tissue, of which 10 were amino acids and 7 were EAAs. Amino acids have a variety of biological functions in energy metabolism as well as protein synthesis, and amino acid transporters thus play an important role in the growth, proliferation, and survival of both normal and cancer cells. The increase in amino acid levels observed in HCC tumor tissue may reflect the metabolic remodeling that is a hallmark of cancer cells; for example, elevation of lactate production through the Warburg effect [34] was also identified in the present study. Several investigators have demonstrated that expression and activity of amino acid transporters is increased in cancer cells, including the solute carrier protein superfamily of transporters [35] such as l-type amino acid transporters (LAT1 and LAT3), system ASC amino acid transporter, system X-C transporter-related protein, and amino acid transporter responsible for the activity of system B0,+ (ATB0,+). These transporters have been suggested to be significantly related to tumor malignancy and carcinogenesis [36–39]. LAT1 is critical to cell growth due to its role as the main transporter of the EAAs leucine, valine, isoleucine, tryptophan, methionine, histidine, tyrosine, and phenylalanine, while LAT3 transports the EAAs leucine, valine, isoleucine, and phenylalanine, and ATB0,+ transports virtually the same panel of EAAs targeted by LAT1. Specifically, LAT1 has been identified as an independent prognostic factor in various cancers, including primary liver cancer, and is associated with increased tumor growth via the mammalian target of rapamycin signaling pathway [36, 38, 40, 41]. Similarly, LAT3 has been shown to upregulate the phosphoinositide 3-kinase–AKT signaling pathway via leucine transport in prostate cancer cells [42]. These amino acid transporters are likely to be highly expressed in HCC tumor tissue and may contribute to the increased EAA levels detected in our study. In future, such amino acid transporters will be investigated to elucidate the relationships for amino acids upregulation or tumor malignancy in several cancer cells.
Regarding metabolomic biomarkers for HCC diagnosis, Gao et al. have suggested that serum asparagine and β-glutamate levels may be specific biomarkers for HCC in patients with liver cirrhosis [43]. Soga et al. showed that serum γ-glutamyl dipeptides could distinguish between several liver diseases and discriminate HCC from other liver diseases, thereby serving as reliable diagnostic biomarkers for rapid screening [44]. Likewise, Saito et al. demonstrated that serum γ-glutamyl peptides are potential biomarkers for virus-related HCC [45]. Huang et al. have proposed that serum betaine and propionylcarnitine levels may have potential as complementary diagnostic markers to α-fetoprotein for HCC resulting from chronic hepatitis and cirrhosis [38]. Hence, these serum metabolic biomarkers could be useful in clinical settings in concert with serum α-fetoprotein. In the present study, we identified leucine, valine, and tryptophan as additional potential metabolomic biomarkers for HCC. Previous metabolomics studies also detected changes in serum and/or urine amino acid levels that could distinguish between patients with HCC and healthy subjects, and showed that serum levels of branched chain amino acids and aromatic amino acids are significantly higher before treatment in patients with HCC than in healthy subjects [23, 46]. However, those reports measured serum amino acids at only one time during treatment of HCC patients. In the current study, we investigated changes in the serum metabolic profiles of patients between before and after hepatectomy, and identified increases in the same EAAs that were upregulated in HCC tumor compared with non-tumor tissue. Until now, the standard value of plasma amino acids concentration has been reported in a large Japanese population with 1,890 individuals [47]. In that study, the lower and upper limits of serum concentration of leucine, valine, and tryptophan were revealed as follows; leucine 76.7 to 159.5, valine: 143.0 to 287.0, and tryptophan: 42.9 to 74.4 μmol/L. In the current study, serum concentration of leucine and valine before Hx exceeded each upper limit and that of tryptophan was almost equivalent to its upper limit. Besides, serum concentrations of those three EEAs decreased within normal range after Hx. Therefore, our results suggest that measurement of serum leucine, valine, and tryptophan levels could facilitate the early diagnosis of HCC and also be used as a reliable metabolomic biomarker to monitor disease progression and treatment response.
The current and previous findings provide a rationale for further investigations into the potential utility of leucine, valine, and tryptophan as diagnostic and prognostic biomarkers for HCC. However, our study has several limitations. First, the sample size was small and may not be generalizable. Second, selection bias was possible, because of the retrospective nature of the study. Third, we did not confirm our findings in a second validation set of samples. Finally, we indicated did not prove the role of those three EEAs for hepatocarcinogenesis and tumor malignancy, with in vitro or in vivo study. These issues should be addressed by additional studies to clarify the potential for the three EAAs to serve as reliable metabolomic biomarkers of HCC.
Materials and Methods
Patient selection and sample collection
We enrolled 20 patients with HCC without detectable distant organ metastases who underwent hepatectomy at Tokushima University Hospital, Japan between December 2013 and February 2015. The patients consisted of 16 men and 4 women and ranged in age from 44 years to 78 years (mean 65.5 years) (Supplementary Table 1). An additional cohort of 4 patients with liver metastasis from colorectal cancer (CRLM) were included as a comparison group for the analyses. All 24 patients underwent liver resection as their initial treatment without preoperative chemotherapy or radiotherapy, and curative resection was confirmed by pathological examinations. Also, those included patients did not receive any amino acid preparation during the perioperative period. We excluded patients with intrahepatic cholangiocarcinoma, such as mixed-type liver cancer. Tumor status and stage were defined according to the Classification of Primary Liver Cancer by the Liver Cancer Study Group of Japan [48]. Age, sex, liver function, hepatitis virus infection status, and tumor pathological status were recorded. Tumor and non-tumor tissue samples were obtained immediately after hepatectomy. Blood samples were taken immediately before (pre-Hx) and 14 days after (post-Hx) hepatectomy. The samples were snap frozen at −80°C and stored until analysis. The study protocol was approved by the Institutional Review Board of the University of Tokushima Graduate School (approval no. 2274-1), and all patients provided written informed consent.
Metabolome analysis
Frozen tissue (approximately 40 mg per sample) was added to methanol (500 μL) containing internal standards (20 μmol L−1 each of methionine sulfone and D-camphor-10-sulfonic acid) and homogenized using a bead beater (TOMY Micro Smash MS-100R; Tomy Digital Biology, Tokyo, Japan) at 3000 rpm for 60 s. Chloroform (500 μL) and Milli-Q water (200 μL) were added to the homogenate, which was thoroughly mixed and then centrifuged at 4600 g for 15 min at 4°C. After centrifugation, the aqueous fraction was ultrafiltered using a 5 kDa cutoff ultra-centrifugal filter unit (Ultrafree-MC-PLHCC-HMT; Human Metabolome Technologies Inc., Tsuruoka, Japan). The filtrate was dried using a vacuum centrifuge and dissolved in Milli-Q water (50 μL) containing 200 μmol L-1 of the reference compounds (3-aminopyrrolidine and trimesic acid) prior to CE-TOFMS analysis. Serum samples were obtained by centrifugation of blood samples at 3000 g at 4°C for 10 min. The samples were divided into aliquots and stored at −80°C until extraction of metabolites. CE-TOFMS-based metabolomic profiling and data analysis were carried out essentially as described [21, 49–52].
Statistical analysis
Statistical analyses were carried out using Prism 6.07 for Windows (GraphPad Software Inc., La Jolla, CA, USA). A p value of < 0.05 was considered statistically significant, and data were presented with mean ± standard deviation (SD). The variable importance in the projection (VIP) obtained from multivariate statistical analysis can provide significantly changed variables of surgical specimen between HCC tumor and non-tumor tissue, and serum sample between pre-Hx and post-Hx. HCC tumor and non-tumor tissue value and Pre-Hx and post-Hx values were compared using the Wilcoxon matched-pairs signed-rank test. Heat maps of metabolite levels were generated using hierarchical clustering based on Pearson’s correlation coefficients with Multi Experiment Viewer software (Institute for Genomic Research, Rockville, MD, USA). The data were exported and analyzed by orthogonal partial least squares discriminant analysis (OPLS-DA) and principal component analysis (PCA) using SIMCA-P software 12.0.1 (Umetrics AB, Umea, Sweden) to visualize the metabolic changes between HCC tumor and non-tumor tissue or Pre-Hx and post-Hx after mean centering and unit variance scaling.
Abbreviations
HCC: hepatocellular carcinoma; HBV: hepatitis B virus; HCV: hepatitis C virus; CE-TOFMS: capillary electrophoresis-time-of-flight mass spectrometry; CRLM: colorectal liver metastasis; OPLS-DA: orthogonal partial least squares discriminant analysis; PCA: principal component analysis; VIP: variable importance for projection; EAA: essential amino acid; LAT: l-type amino acid transporter; ATB0,+: amino acid transporter responsible for the activity of system B0,+; Hx: hepatectomy; ICGR15: indocyanine green retention 15; AFP: alpha-fetoprotein; DCP: Des-gamma-carboxy prothrombin.
ACKNOWLEDGMENTS
We thank Anne M. O’Rourke, PhD, from Edanz Group (https://www.edanz.com/) for editing a draft of this manuscript.
CONFLICTS OF INTEREST
The authors declare that they have no conflicts of interest.
Ethical statement and consent
The study protocol was approved by the Institutional Review Board of the University of Tokushima Graduate School (approval no. 2274-1), and all patients provided written informed consent.
FUNDING
This study was partly supported by Research Program on Hepatitis from Japanese foundation for multidisciplinary treatment of cancer, the Japan Agency for Medical Research and Development (AMED) Grant Numbers 22fk0210103h0001 and 22fk0210103s0201, and Grant-in-Aid for Scientific Research (Grant no. 20K08957 to Yuji Morine).
References
1. Forner A, Llovet JM, Bruix J. Hepatocellular carcinoma. Lancet. 2012; 379:1245–55. https://doi.org/10.1016/S0140-6736(11)61347-0. [PubMed].
2. Venook AP, Papandreou C, Furuse J, de Guevara LL. The incidence and epidemiology of hepatocellular carcinoma: a global and regional perspective. Oncologist. 2010 (Suppl 4); 15:5–13. https://doi.org/10.1634/theoncologist.2010-S4-05. [PubMed].
3. Llovet JM, Ricci S, Mazzaferro V, Hilgard P, Gane E, Blanc JF, de Oliveira AC, Santoro A, Raoul JL, Forner A, Schwartz M, Porta C, Zeuzem S, et al, and SHARP Investigators Study Group. Sorafenib in advanced hepatocellular carcinoma. N Engl J Med. 2008; 359:378–90. https://doi.org/10.1056/NEJMoa0708857. [PubMed].
4. Cheng AL, Kang YK, Chen Z, Tsao CJ, Qin S, Kim JS, Luo R, Feng J, Ye S, Yang TS, Xu J, Sun Y, Liang H, et al. Efficacy and safety of sorafenib in patients in the Asia-Pacific region with advanced hepatocellular carcinoma: a phase III randomised, double-blind, placebo-controlled trial. Lancet Oncol. 2009; 10:25–34. https://doi.org/10.1016/S1470-2045(08)70285-7. [PubMed].
5. Ikeda K, Kudo M, Kawazoe S, Osaki Y, Ikeda M, Okusaka T, Tamai T, Suzuki T, Hisai T, Hayato S, Okita K, Kumada H. Phase 2 study of lenvatinib in patients with advanced hepatocellular carcinoma. J Gastroenterol. 2017; 52:512–19. https://doi.org/10.1007/s00535-016-1263-4. [PubMed].
6. Kudo M, Finn RS, Qin S, Han KH, Ikeda K, Piscaglia F, Baron A, Park JW, Han G, Jassem J, Blanc JF, Vogel A, Komov D, et al. Lenvatinib versus sorafenib in first-line treatment of patients with unresectable hepatocellular carcinoma: a randomised phase 3 non-inferiority trial. Lancet. 2018; 391:1163–73. https://doi.org/10.1016/S0140-6736(18)30207-1. [PubMed].
7. Finn RS, Qin S, Ikeda M, Galle PR, Ducreux M, Kim TY, Kudo M, Breder V, Merle P, Kaseb AO, Li D, Verret W, Xu DZ, et al, and IMbrave150 Investigators. Atezolizumab plus Bevacizumab in Unresectable Hepatocellular Carcinoma. N Engl J Med. 2020; 382:1894–905. https://doi.org/10.1056/NEJMoa1915745. [PubMed].
8. Masokano IB, Liu W, Xie S, Marcellin DFH, Pei Y, Li W. The application of texture quantification in hepatocellular carcinoma using CT and MRI: a review of perspectives and challenges. Cancer Imaging. 2020; 20:67. https://doi.org/10.1186/s40644-020-00341-y. [PubMed].
9. Li XQ, Wang X, Zhao DW, Sun J, Liu JJ, Lin DD, Yang G, Liu H, Xia ZY, Jia CY, Li HJ. Application of Gd-EOB-DTPA-enhanced magnetic resonance imaging (MRI) in hepatocellular carcinoma. World J Surg Oncol. 2020; 18:219. https://doi.org/10.1186/s12957-020-01996-4. [PubMed].
10. Chaiteerakij R, Addissie BD, Roberts LR. Update on biomarkers of hepatocellular carcinoma. Clin Gastroenterol Hepatol. 2015; 13:237–45. https://doi.org/10.1016/j.cgh.2013.10.038. [PubMed].
11. Wubetu GY, Utsunomiya T, Ishikawa D, Yamada S, Ikemoto T, Morine Y, Iwahashi S, Saito Y, Arakawa Y, Imura S, Kanamoto M, Zhu C, Bando Y, Shimada M. High STAT4 expression is a better prognostic indicator in patients with hepatocellular carcinoma after hepatectomy. Ann Surg Oncol. 2014 (Suppl 4); 21:S721–28. https://doi.org/10.1245/s10434-014-3861-9. [PubMed].
12. Imura S, Tovuu LO, Utsunomiya T, Morine Y, Ikemoto T, Arakawa Y, Kanamoto M, Iwahashi S, Saito Y, Takasu C, Yamada S, Ishikawa D, Bando Y, Shimada M. Role of Fbxw7 expression in hepatocellular carcinoma and adjacent non-tumor liver tissue. J Gastroenterol Hepatol. 2014; 29:1822–29. https://doi.org/10.1111/jgh.12623. [PubMed].
13. Davaadorj M, Imura S, Saito YU, Morine Y, Ikemoto T, Yamada S, Takasu C, Hiroki T, Yoshikawa M, Shimada M. Loss of SFRP1 Expression Is Associated with Poor Prognosis in Hepatocellular Carcinoma. Anticancer Res. 2016; 36:659–64. [PubMed].
14. Iwahashi S, Shimada M, Utsunomiya T, Imura S, Morine Y, Ikemoto T, Takasu C, Saito Y, Yamada S. Epithelial-mesenchymal transition-related genes are linked to aggressive local recurrence of hepatocellular carcinoma after radiofrequency ablation. Cancer Lett. 2016; 375:47–50. https://doi.org/10.1016/j.canlet.2016.02.041. [PubMed].
15. Psychogios N, Hau DD, Peng J, Guo AC, Mandal R, Bouatra S, Sinelnikov I, Krishnamurthy R, Eisner R, Gautam B, Young N, Xia J, Knox C, et al. The human serum metabolome. PLoS One. 2011; 6:e16957. https://doi.org/10.1371/journal.pone.0016957. [PubMed].
16. Hollywood K, Brison DR, Goodacre R. Metabolomics: current technologies and future trends. Proteomics. 2006; 6:4716–23. https://doi.org/10.1002/pmic.200600106. [PubMed].
17. Wishart DS, Mandal R, Stanislaus A, Ramirez-Gaona M. Cancer Metabolomics and the Human Metabolome Database. Metabolites. 2016; 6:10. https://doi.org/10.3390/metabo6010010. [PubMed].
18. Wishart DS. Current progress in computational metabolomics. Brief Bioinform. 2007; 8:279–93. https://doi.org/10.1093/bib/bbm030. [PubMed].
19. Xie G, Zhang S, Zheng X, Jia W. Metabolomics approaches for characterizing metabolic interactions between host and its commensal microbes. Electrophoresis. 2013; 34:2787–98. https://doi.org/10.1002/elps.201300017. [PubMed].
20. Beyoğlu D, Idle JR. The metabolomic window into hepatobiliary disease. J Hepatol. 2013; 59:842–58. https://doi.org/10.1016/j.jhep.2013.05.030. [PubMed].
21. Saito Y, Morine Y, Iwahashi S, Ikemoto T, Imura S, Yamanaka-Okumura H, Hirayama A, Soga T, Tomita M, Shimada M. Changes of liver metabolites following hepatectomy with ischemia reperfusion towards liver regeneration. Ann Gastroenterol Surg. 2018; 2:204–11. https://doi.org/10.1002/ags3.12058. [PubMed].
22. Wang X, Zhang A, Sun H. Power of metabolomics in diagnosis and biomarker discovery of hepatocellular carcinoma. Hepatology. 2013; 57:2072–77. https://doi.org/10.1002/hep.26130. [PubMed].
23. Kimhofer T, Fye H, Taylor-Robinson S, Thursz M, Holmes E. Proteomic and metabonomic biomarkers for hepatocellular carcinoma: a comprehensive review. Br J Cancer. 2015; 112:1141–56. https://doi.org/10.1038/bjc.2015.38. [PubMed].
24. Safaei A, Arefi Oskouie A, Mohebbi SR, Rezaei-Tavirani M, Mahboubi M, Peyvandi M, Okhovatian F, Zamanian-Azodi M. Metabolomic analysis of human cirrhosis, hepatocellular carcinoma, non-alcoholic fatty liver disease and non-alcoholic steatohepatitis diseases. Gastroenterol Hepatol Bed Bench. 2016; 9:158–73. [PubMed].
25. Fitian AI, Cabrera R. Disease monitoring of hepatocellular carcinoma through metabolomics. World J Hepatol. 2017; 9:1–17. https://doi.org/10.4254/wjh.v9.i1.1. [PubMed].
26. De Matteis S, Ragusa A, Marisi G, De Domenico S, Casadei Gardini A, Bonafè M, Giudetti AM. Aberrant Metabolism in Hepatocellular Carcinoma Provides Diagnostic and Therapeutic Opportunities. Oxid Med Cell Longev. 2018; 2018:7512159. https://doi.org/10.1155/2018/7512159. [PubMed].
27. Woo HG, Park ES, Thorgeirsson SS, Kim YJ. Exploring genomic profiles of hepatocellular carcinoma. Mol Carcinog. 2011; 50:235–43. https://doi.org/10.1002/mc.20691. [PubMed].
28. Pleguezuelo M, Lopez-Sanchez LM, Rodriguez-Ariza A, Montero JL, Briceno J, Ciria R, Muntane J, de la Mata M. Proteomic analysis for developing new biomarkers of hepatocellular carcinoma. World J Hepatol. 2010; 2:127–35. https://doi.org/10.4254/wjh.v2.i3.127. [PubMed].
29. Mitra V, Metcalf J. Metabolic functions of the liver. Anaes Inten Care Med. 2009; 10:334–35. https://doi.org/10.1016/j.mpaic.2009.03.011.
30. Xue R, Lin Z, Deng C, Dong L, Liu T, Wang J, Shen X. A serum metabolomic investigation on hepatocellular carcinoma patients by chemical derivatization followed by gas chromatography/mass spectrometry. Rapid Commun Mass Spectrom. 2008; 22:3061–68. https://doi.org/10.1002/rcm.3708. [PubMed].
31. Fitian AI, Nelson DR, Liu C, Xu Y, Ararat M, Cabrera R. Integrated metabolomic profiling of hepatocellular carcinoma in hepatitis C cirrhosis through GC/MS and UPLC/MS-MS. Liver Int. 2014; 34:1428–44. https://doi.org/10.1111/liv.12541. [PubMed].
32. Beyoğlu D, Imbeaud S, Maurhofer O, Bioulac-Sage P, Zucman-Rossi J, Dufour JF, Idle JR. Tissue metabolomics of hepatocellular carcinoma: tumor energy metabolism and the role of transcriptomic classification. Hepatology. 2013; 58:229–38. https://doi.org/10.1002/hep.26350. [PubMed].
33. Huang Q, Tan Y, Yin P, Ye G, Gao P, Lu X, Wang H, Xu G. Metabolic characterization of hepatocellular carcinoma using nontargeted tissue metabolomics. Cancer Res. 2013; 73:4992–5002. https://doi.org/10.1158/0008-5472.CAN-13-0308. [PubMed].
34. Kim Y, Lin Q, Glazer PM, Yun Z. Hypoxic tumor microenvironment and cancer cell differentiation. Curr Mol Med. 2009; 9:425–34. https://doi.org/10.2174/156652409788167113. [PubMed].
35. Pizzagalli MD, Bensimon A, Superti-Furga G. A guide to plasma membrane solute carrier proteins. FEBS J. 2021; 288:2784–835. https://doi.org/10.1111/febs.15531. [PubMed].
36. Zhang C, Xu J, Xue S, Ye J. Prognostic Value of L-Type Amino Acid Transporter 1 (LAT1) in Various Cancers: A Meta-Analysis. Mol Diagn Ther. 2020; 24:523–36. https://doi.org/10.1007/s40291-020-00470-x. [PubMed].
37. Wang Q, Holst J. L-type amino acid transport and cancer: targeting the mTORC1 pathway to inhibit neoplasia. Am J Cancer Res. 2015; 5:1281–94. [PubMed].
38. Cormerais Y, Vučetić M, Parks SK, Pouyssegur J. Amino Acid Transporters Are a Vital Focal Point in the Control of mTORC1 Signaling and Cancer. Int J Mol Sci. 2020; 22:23. https://doi.org/10.3390/ijms22010023. [PubMed].
39. Nałęcz KA. Amino Acid Transporter SLC6A14 (ATB0,+) - A Target in Combined Anti-cancer Therapy. Front Cell Dev Biol. 2020; 8:594464. https://doi.org/10.3389/fcell.2020.594464. [PubMed].
40. Namikawa M, Kakizaki S, Kaira K, Tojima H, Yamazaki Y, Horiguchi N, Sato K, Oriuchi N, Tominaga H, Sunose Y, Nagamori S, Kanai Y, Oyama T, et al. Expression of amino acid transporters (LAT1, ASCT2 and xCT) as clinical significance in hepatocellular carcinoma. Hepatol Res. 2015; 45:1014–22. https://doi.org/10.1111/hepr.12431. [PubMed].
41. Li J, Qiang J, Chen SF, Wang X, Fu J, Chen Y. The impact of L-type amino acid transporter 1 (LAT1) in human hepatocellular carcinoma. Tumour Biol. 2013; 34:2977–81. https://doi.org/10.1007/s13277-013-0861-5. [PubMed].
42. Zhang BK, Moran AM, Bailey CG, Rasko JEJ, Holst J, Wang Q. EGF-activated PI3K/Akt signalling coordinates leucine uptake by regulating LAT3 expression in prostate cancer. Cell Commun Signal. 2019; 17:83. https://doi.org/10.1186/s12964-019-0400-0. [PubMed].
43. Gao R, Cheng J, Fan C, Shi X, Cao Y, Sun B, Ding H, Hu C, Dong F, Yan X. Serum Metabolomics to Identify the Liver Disease-Specific Biomarkers for the Progression of Hepatitis to Hepatocellular Carcinoma. Sci Rep. 2015; 5:18175. https://doi.org/10.1038/srep18175. [PubMed].
44. Soga T, Sugimoto M, Honma M, Mori M, Igarashi K, Kashikura K, Ikeda S, Hirayama A, Yamamoto T, Yoshida H, Otsuka M, Tsuji S, Yatomi Y, et al. Serum metabolomics reveals γ-glutamyl dipeptides as biomarkers for discrimination among different forms of liver disease. J Hepatol. 2011; 55:896–905. https://doi.org/10.1016/j.jhep.2011.01.031. [PubMed].
45. Fages A, Duarte-Salles T, Stepien M, Ferrari P, Fedirko V, Pontoizeau C, Trichopoulou A, Aleksandrova K, Tjønneland A, Olsen A, Clavel-Chapelon F, Boutron-Ruault MC, Severi G, et al. Metabolomic profiles of hepatocellular carcinoma in a European prospective cohort. BMC Med. 2015; 13:242. https://doi.org/10.1186/s12916-015-0462-9. [PubMed].
46. Xiao JF, Varghese RS, Zhou B, Nezami Ranjbar MR, Zhao Y, Tsai TH, Di Poto C, Wang J, Goerlitz D, Luo Y, Cheema AK, Sarhan N, Soliman H, et al. LC-MS based serum metabolomics for identification of hepatocellular carcinoma biomarkers in Egyptian cohort. J Proteome Res. 2012; 11:5914–23. https://doi.org/10.1021/pr300673x. [PubMed].
47. Yamamoto H, Kondo K, Tanaka T, Muramatsu T, Yoshida H, Imaizumi A, Nagao K, Noguchi Y, Miyano H. Reference intervals for plasma-free amino acid in a Japanese population. Ann Clin Biochem. 2016; 53:357–64. https://doi.org/10.1177/0004563215583360. [PubMed].
48. Liver Cancer Study Group of Japan: The General Rules for the Clinical and Pathological Study of Primary Liver Cancer, ed 6, Rivised Version. Tokyo, Kanehara, 2015.
49. Soga T, Igarashi K, Ito C, Mizobuchi K, Zimmermann HP, Tomita M. Metabolomic profiling of anionic metabolites by capillary electrophoresis mass spectrometry. Anal Chem. 2009; 81:6165–74. https://doi.org/10.1021/ac900675k. [PubMed].
50. Klampfl CW, Buchberger W. Determination of carbohydrates by capillary electrophoresis with electrospray-mass spectrometric detection. Electrophoresis. 2001; 22:2737–42. https://doi.org/10.1002/1522-2683(200108)22:13<2737::AID-ELPS2737>3.0.CO;2-Z. [PubMed].
51. Hirayama A, Kami K, Sugimoto M, Sugawara M, Toki N, Onozuka H, Kinoshita T, Saito N, Ochiai A, Tomita M, Esumi H, Soga T. Quantitative metabolome profiling of colon and stomach cancer microenvironment by capillary electrophoresis time-of-flight mass spectrometry. Cancer Res. 2009; 69:4918–25. https://doi.org/10.1158/0008-5472.CAN-08-4806. [PubMed].
52. Sugimoto M, Wong DT, Hirayama A, Soga T, Tomita M. Capillary electrophoresis mass spectrometry-based saliva metabolomics identified oral, breast and pancreatic cancer-specific profiles. Metabolomics. 2010; 6:78–95. https://doi.org/10.1007/s11306-009-0178-y. [PubMed].