
Introduction
Specific cell-extrinsic and cell-intrinsic anti-mitogenic factors can cause a temporary cell cycle arrest in unicellular and multicellular eukaryotes [1–10]. These cells then enter a reversible G0 state of quiescence [1–10].
Quiescent adult stem cells in metazoans are long-lived because of their resistance to various stresses and toxicities [2, 6, 7, 11–18]. These cells also retain the ability to re-enter the cell cycle and resume proliferation in response to specific pro-mitogenic stimuli [2, 3, 7, 11, 12, 16, 19–29]. Such infrequent proliferation of quiescent adult stem cells allows them to self-renew while maintaining the state of quiescence [2, 3, 7, 11, 12, 16, 19–29]. The infrequent proliferation of quiescent adult stem cells often also yields actively dividing daughter progenitor cells that can undergo a terminal differentiation [2, 3, 7, 11, 12, 16, 19–29].
The maintenance of an appropriate number of quiescent adult stem cells that can sustain the state of quiescence, resist stresses, self-renew and form progenitor cells for terminal differentiation contributes to the growth, development, tissue repair and regeneration, and longevity assurance in metazoans [2, 4, 7, 21, 22, 26, 29–34]. An aging-associated numerical and functional decline of quiescent adult stem cells is an essential contributor to the pathophysiology of many diseases of old age in mammals and humans [7, 11, 13, 14, 21, 30–32, 34–55]. The genetic, dietary, and pharmacological interventions that can slow such decline can also slow cellular and organismal aging and delay the onset of aging-associated diseases [7, 11, 13, 14, 21, 30–32, 34–55].
All microorganisms (including yeasts) in natural environments outside of the laboratory can undergo a reversible transition between the states of cellular quiescence and proliferation in response to the variations in nutrient availability and other environmental cues [1, 3, 56–64]. The yeast Saccharomyces cerevisiae, a unicellular eukaryote amenable to genetic and biochemical analyses, is a valuable model organism for elucidating mechanisms of cellular quiescence under laboratory conditions [1, 3, 60, 62, 65, 66].
Mechanisms of cellular quiescence in S. cerevisiae have been traditionally studied in yeast cells that are not limited in calorie supply. Under these so-called non-caloric restriction (non-CR) conditions, S. cerevisiae cells are aerobically cultured in a nutrient-rich liquid medium initially containing 2% glucose [67–70]. After consuming glucose as a carbon source, these yeast cells slow their growth and enter a diauxic shift period [68, 71]. Some yeast cells in the culture that enters the diauxic shift undergo a cell-cycle arrest at the checkpoint “START A” in late G1, and the culture becomes differentiated into the sub-populations of quiescent (Q) and non-quiescent (NQ) cells [62, 72–74]. The properties of Q and NQ cell sub-populations formed in yeast cultures under non-CR conditions are different. These cell sub-populations differ from each other in size, morphology, density, metabolism, transcriptional pattern, stress resistance, proteostatic control, cytoskeleton arrangement, mitochondrial morphology, signal transduction design, and susceptibility to the apoptotic form of regulated cell death (RCD) [5, 62, 64, 72–91]. An intricate signaling network coordinates the diversification of properties that distinguish the Q and NQ cell sub-populations formed in yeast cultures not limited in calorie supply [1, 82, 92–108]. A body of evidence indicates that the entry into and advancement through a quiescence program taking place in yeast cells under non-CR conditions are essential contributors to their chronological aging [1, 62, 72–75, 80, 82, 85, 88–90, 93, 100, 102, 103, 105, 108].
We have introduced a new yeast model for studying mechanisms linking cellular aging to cellular quiescence [109, 110]. In the new model, these potentially existing mechanisms are studied in yeast cells limited in calorie supply because they are cultured in a nutrient-rich medium initially containing 0.2% glucose. CR is known to delay chronological aging and prolong the longevity of S. cerevisiae [67, 69, 70, 111–113]. This low-calorie diet is a robust geroprotective intervention that extends organisms’ lifespan and health span across phyla [111, 114–123].
We used density gradient centrifugation to purify Q and NQ cells from S. cerevisiae cultured under CR or non-CR conditions [109]. We recovered these cells on different days of the chronological aging process [109]. We found that the CR diet regulates the following four processes that could link cellular aging to cellular quiescence (Figure 1). First, CR creates a stem cell niche of high-density Q cells, arrests their cell cycle and causes their entry into the G0 state at a checkpoint in early G1 (Figure 1, process 1) [109]. In contrast, the formation of such a stem cell niche of high-density Q cells under non-CR conditions occurs by a cell-cycle arrest in late G1 [1, 109]. Second, high-density Q cells undergo conversion into low-density Q cells as early as in the logarithmic (L) growth phase of a yeast culture under CR conditions (Figure 1, process 2) [109]. Yet, such conversion occurs only in the stationary (ST) phase of a yeast culture that is not limited in calorie supply [109]. Third, CR slows the conversion of low-density Q cells into low-density NQ cells (Figure 1, process 3) [109]. This aging-associated process 3 is fast [109]. Fourth, CR decelerates the transformation of high-density Q cells into high-density NQ cells (Figure 1, process 4) [109]. This aging-associated process is slow [109]. An aging-associated decline in quiescence during processes 3 and 4 was assessed by monitoring two fundamental characteristics of Q cells that distinguish them from NQ cells. These characteristics include the following: 1) the clonogenicity (i.e., the ability of a cell to form a colony after being transferred from a nutrient-depleted liquid medium to a surface of a nutrient-rich solid medium) and 2) synchronous cell cycle re-entry (i.e., the ability of a cell population to synchronously re-enter the mitotic cell cycle after being transferred from a nutrient-depleted liquid medium to a nutrient-rich liquid medium) (Figure 1, processes 3 and 4) [109]. The CR-dependent delays of the aging-associated processes 3 and 4 coincide with changes in several key traits of low- and high-density Q cells caused by CR [109]. These CR-driven traits of Q cells include a rise in glycogen and trehalose concentrations, a decline in the concentrations of triacylglycerols (TAG), an increase in cardiolipin (CL) concentrations, a decrease in the concentrations of reactive oxygen species (ROS), an improvement of mitochondrial functionality, reduced oxidative damage to macromolecules, a rise in cell resistance to long-term thermal and oxidative stresses, and a decline in cell susceptibility to apoptotic and liponecrotic forms of regulated cell death (Figure 1A and 1B) [109].
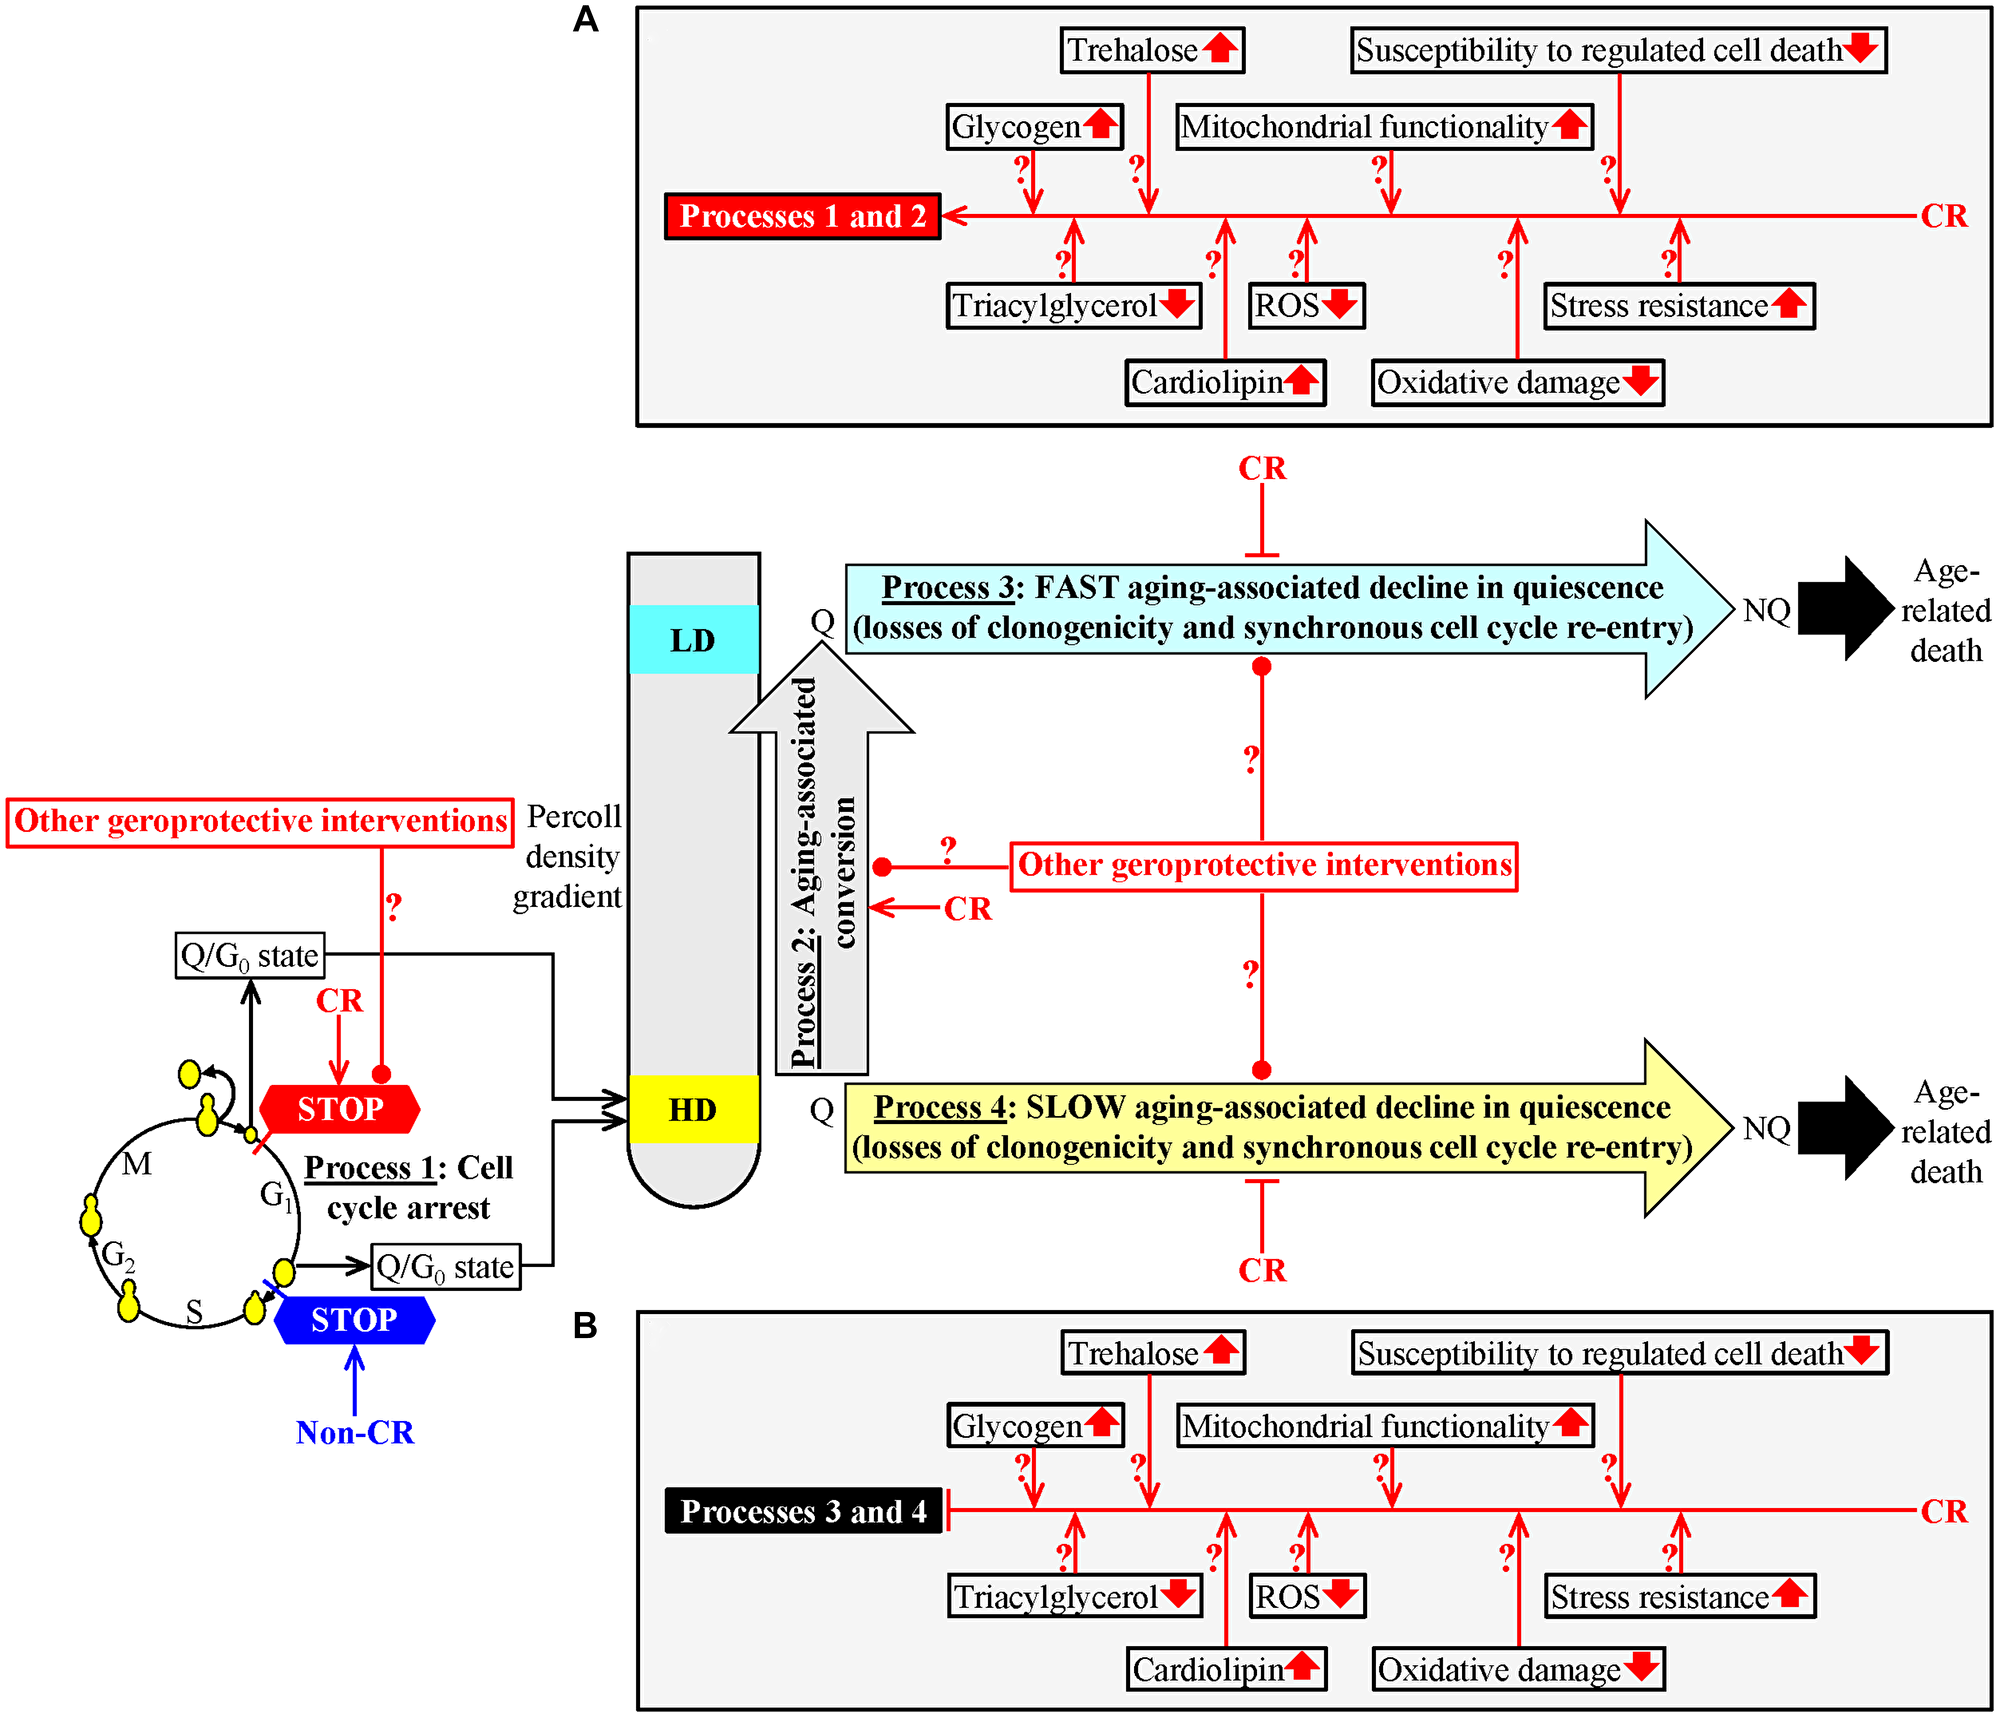
Figure 1: A hypothetical model for the four processes linking cellular aging to cellular quiescence. We hypothesized that these processes converge into a mechanism that links cellular aging to cellular quiescence in chronologically aging budding yeast. To test our hypothesis, we had the following two objectives. The first objective of this study was to investigate how geroprotective interventions other than caloric restriction (CR) affect each of these processes. The second objective of this study was to test how some CR-specific biochemical traits of quiescent (Q) cells contribute to the abilities of CR and LCA to slow down a decline in the cellular quiescence of chronologically aging budding yeast. Process 1: CR creates a sub-population of high-density Q cells by arresting the cell-division cycle of some cells and eliciting their entry into the G0 state in early G1; yet, the development of such a cell sub-population under non-CR conditions happens by a cell-cycle arrest in late G1. Process 2: CR accelerates the conversion of high-density Q cells into low-density Q cells. CR postpones a fast transformation of low-density Q cells into low-density NQ cells (process 3) and a slow conversion of high-density Q cells into high-density NQ cells (process 4). See the text for more details. The metabolic traits of Q cells that can contribute to the different effects of CR and LCA on processes 1 and 2 (A) and their similar effects on processes 3 and 4 (B) are shown. Other Abbreviations: HD: high-density cells; LD: low-density cells. ↑an increase ↓a decrease →→ activation arrows ˧˧inhibition bars.
Based on the above findings, we proposed a hypothesis that processes 1, 2, 3 and 4 converge into a mechanism that links cellular aging to cellular quiescence in chronologically aging budding yeast (Figure 1) [110]. According to our hypothesis, CR delays yeast chronological aging in part because it targets this hypothetical mechanism operating within Q cells (Figure 1) [110]. Our hypothesis also posits that the aging-delaying effects of geroprotective interventions other than CR are partly due to their ability to regulate the four different processes integrated into the mechanism linking cellular aging to cellular quiescence. Our hypothesis further suggests that the aging-delaying effect of CR (and, perhaps, of other geroprotective interventions) is caused by its ability to alter the specific traits characteristic of Q cells, thereby changing the efficiencies of processes 1, 2, 3 and/or 4 (Figure 1A and 1B) [110].
The present study had the following two objectives aimed at testing our hypothesis.
Our first objective was to assess how geroprotective interventions other than CR influence processes 1, 2, 3 and 4 that could link cellular aging to cellular quiescence (Figure 1). To attain this objective, we examined the effects of lithocholic acid (LCA) and the single-gene deletion mutations tor1Δ and ras2Δ on these processes. Each of these geroprotectors delays chronological aging and extends the longevity of S. cerevisiae [124–126]. We tested each of them in yeast cultured under non-CR conditions on 2% glucose, under which all these interventions exhibit strong geroprotective effects [124–126].
In experiments pursuing our first objective, we found that CR and the ras2Δ mutation (if present in yeast cultured under non-CR conditions) influence processes 1 and 2 potentially linking cellular aging to cellular quiescence differently than LCA and the tor1Δ mutation (if added to or present in yeast cultured under non-CR conditions, respectively). Yet, our experiments following the first objective also revealed that each of the four tested geroprotective interventions (i.e., CR, LCA, tor1Δ and ras2Δ) has a similar effect on processes 3 and 4 possibly linking cellular aging to cellular quiescence. Based on these findings, we thought that there are two ways of slowing down yeast chronological aging by the four tested geroprotectors; one way is specific for CR and the ras2Δ mutation, whereas the other way is characteristic for LCA and the tor1Δ mutation. Therefore, we selected CR and LCA as the aging-delaying interventions to further investigate the two ways through which diverse geroprotectors postpone yeast chronological aging by differently targeting the mechanism that could link cellular aging to cellular quiescence.
Our second objective was to test a hypothesis that specific metabolic traits of Q cells can contribute to the different effects of CR and LCA on processes 1 and 2 and their similar effects on processes 3 and 4 (Figure 1A and 1B).
To make a first step toward attaining this objective, we assessed the contributory roles of two CR-specific changes in metabolic traits of Q cells. These traits included the increased intracellular concentrations of glycogen and trehalose within Q cells. We hypothesized that the abilities of CR and LCA to regulate the four processes of a cellular quiescence program are responsible for their abilities to slow yeast chronological aging. Therefore, we assessed the contributions of the increased intracellular concentrations of glycogen and trehalose within Q cells to the CR- and LCA-driven changes in cellular quiescence and to the CR- and LCA-promoted slowdowns of yeast chronological aging. To perform this assessment, we tested the effects of the single-gene deletion mutations differently affecting intracellular glycogen and trehalose on yeast quiescence and longevity.
Results
CR and the ras2Δ mutation influence the formation of high-density Q cells differently than LCA and the tor1Δ mutation
Process 1 linking cellular aging to cellular quiescence could lead to the formation of a stem cell niche of high-density Q cells (Figure 1) [109]. The sub-populations of high-density Q cells contain unbudded cells, especially the sub-populations recovered from yeast cultures that pass the L growth phase [109]. Process 1 consists of a cell-cycle arrest at a checkpoint in the G1 phase [1, 109, 127]. In yeast cultured under non-CR conditions on 2% glucose, process 1 occurs at the checkpoint “START A” in late G1 and results in the formation of large-sized (cell diameter ~ 5–6 μm) high-density Q cells [1, 109, 127]. In yeast cultured under CR conditions on 0.2% glucose, process 1 occurs at a different checkpoint in the early G1 phase. Judging from the small size (cell diameter ~ 3–3.5 μm) of high-density Q cells observed in CR yeast cultures, CR arrests the cell cycle and causes entry into the G0 state of quiescence at a checkpoint in early G1 [109].
We sought to investigate how geroprotective interventions other than CR influence process 1. These additional geroprotective interventions included LCA and the single-gene deletion mutations tor1Δ and ras2Δ. Each of them was assessed in yeast cultured under non-CR conditions on 2% glucose. Of note, all these interventions exhibit strong geroprotective effects under non-CR conditions of culturing [124–126]. We used centrifugation in the Percoll density gradient to purify the sub-populations of high-density Q cells from yeast cultures of different chronological ages. These cell sub-populations were subjected to differential interference contrast (DIC) microscopical examination and subsequent morphometric analysis.
We found that high-density Q cells in CR cultures of wild-type (WT) strain and in non-CR cultures of the untreated ras2Δ mutant strain remain significantly smaller than high-density Q cells in three other cultures tested on any day of cell recovery (Figure 2A and 2B). These three other cultures were the non-CR culture of WT stain without LCA, the non-CR culture of WT stain with LCA and the non-CR culture of the untreated tor1Δ mutant strain (Figure 2A and 2B).
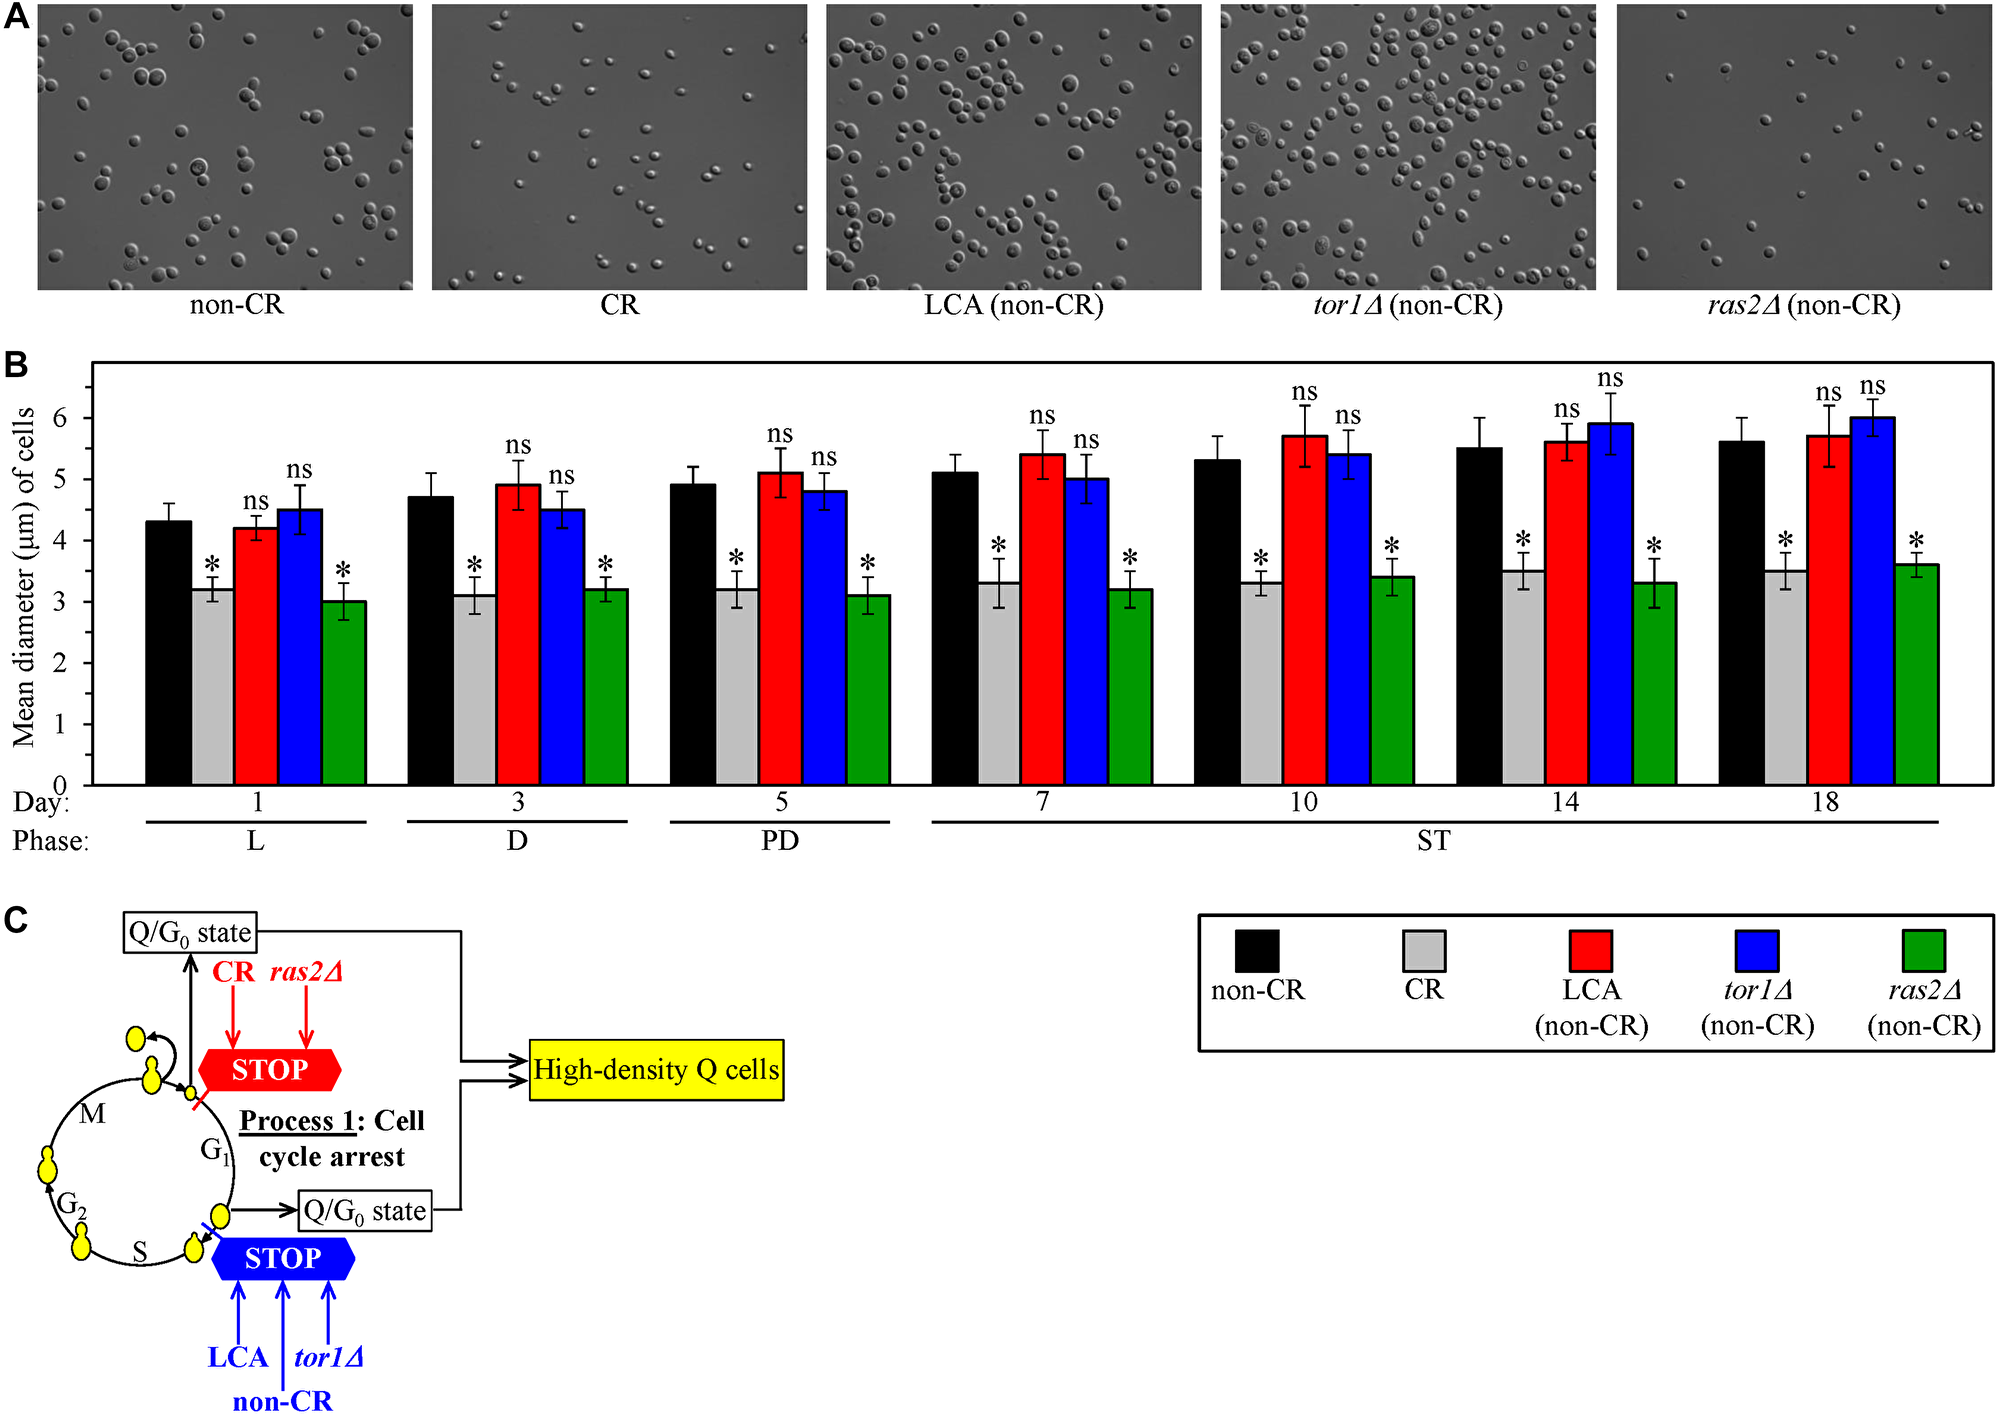
Figure 2: Caloric restriction (CR) and the ras2Δ mutation under non-CR conditions cause the formation of high-density Q cells by arresting the cell cycle at a checkpoint in early G1. In contrast, lithocholic acid (LCA) and the tor1Δ mutation elicit the formation of high-density Q cells under non-CR conditions by arresting the cell cycle at a checkpoint in late G1. Wild-type (WT) yeast cells were cultured in the nutrient-rich YP medium initially containing 0.2% glucose (CR conditions) or 2% glucose (non-CR conditions) with or without LCA. The tor1Δ and ras2Δ mutant cells were cultured in the nutrient-rich YP medium initially containing 2% glucose (non-CR conditions) without LCA. Culture aliquots were recovered from the logarithmic (L), diauxic (D), post-diauxic (PD) or stationary (ST) growth phase. High-density Q cells were purified from these culture aliquots using centrifugation in Percoll density gradient, as described in Materials and Methods. Differential interference contrast micrographs of high-density Q cells recovered from the ST growth phase on day 7 (A) and mean diameters of high-density Q cells recovered from different growth phases (B) are shown. (C) A model for how CR, LCA (under non-CR conditions), tor1Δ (under non-CR conditions) and ras2Δ (under non-CR conditions) cause the formation of high-density Q cells by arresting the cell cycle at specific checkpoints in early (red) or late (blue) G1. Data in B are presented as means ± SEM (n = 3; *p < 0.05; ns, not significant).
Judging from the observed differences in size between high-density Q cells formed in tested cultures, we concluded that the formation of small Q cells in non-CR cultures of the untreated ras2Δ mutant strain is due to the cell-cycle arrest at a checkpoint in early G1. Because high-density Q cells formed in the CR culture of WT strain have a similar small size, it is conceivable that CR and ras2Δ arrest the cell cycle and cause the entry into quiescence at the same checkpoint in early G1 (Figure 2C). Furthermore, the formation of high-density Q cells in non-CR cultures of WT stain treated with LCA and the untreated tor1Δ mutant strain was likely due to the cell-cycle arrest at a checkpoint in late G1. Because high-density Q cells formed in the non-CR culture of untreated WT strain have a similar large size, it is plausible that non-CR conditions, LCA and tor1Δ arrest the cell cycle and elicit the entry into quiescence at the same checkpoint in late G1 (Figure 2C).
CR and the ras2Δ mutation affect the conversion of high-density Q cells into low-density Q cells in a different way than LCA and the tor1Δ mutation
Centrifugation in the Percoll density gradient can separate high-density Q cells from low-density Q cells because these two cell sub-populations have different buoyant densities [109]. Process 2 linking cellular aging to cellular quiescence could result in an age-related conversion of high-density Q cells into low-density Q cells (Figure 1) [109]. We previously found that the percentage of high-density Q cells declines, and the percentage of low-density Q cells rises during chronological aging of yeast cultured under non-CR conditions on 2% glucose [109]. We also found that the age-related conversion of high-density Q cells into low-density Q cells in process 2 is accelerated in yeast cultured under CR conditions on 0.2% glucose [109].
We wanted to explore how LCA and the single-gene deletion mutations tor1Δ and ras2Δ affect process 2. As we mentioned above, each of these three geroprotective interventions was tested under non-CR conditions of culturing. Under such conditions, each o them significantly slows down chronological aging in S. cerevisiae [124–126]. We cultured WT yeast cells under CR conditions on 0.2% glucose, under non-CR conditions on 2% glucose, and under non-CR conditions on 2% glucose with LCA. We also cultured the tor1Δ and ras2Δ mutant cells under non-CR conditions on 2% glucose. Using centrifugation in the Percoll density gradient, we purified the sub-populations of high-density Q cells and low-density Q cells from the above yeast cultures of different chronological ages. We then used a cell counter to determine the percentage of high-density Q cells in these differently aged cell sub-populations.
We found that all five tested cultures contain the sub-populations of high-density Q and low-density Q cells during the logarithmic (L), diauxic (D), post-diauxic (PD) and stationary (ST) growth phases, i.e., through the entire chronological lifespan (CLS) (Figure 3A and 3B). Furthermore, the percentage of high-density Q cells declined with chronological age in all these cultures (Figure 3B). Moreover, since day 3 (the D growth phase) of culturing, the percentage of high-density Q cells in the untreated cultures of WT yeast under CR conditions and of ras2Δ mutant yeast under non-CR conditions was significantly lower than that in the control culture of untreated WT yeast under non-CR conditions (Figure 3B). We also found that, since day 10 (the ST phase) of culturing, the percentage of high-density Q cells in the cultures of WT yeast under non-CR conditions with LCA and of untreated tor1Δ mutant yeast under non-CR conditions exceeds that in the control culture of untreated WT yeast under non-CR conditions (Figure 3B).
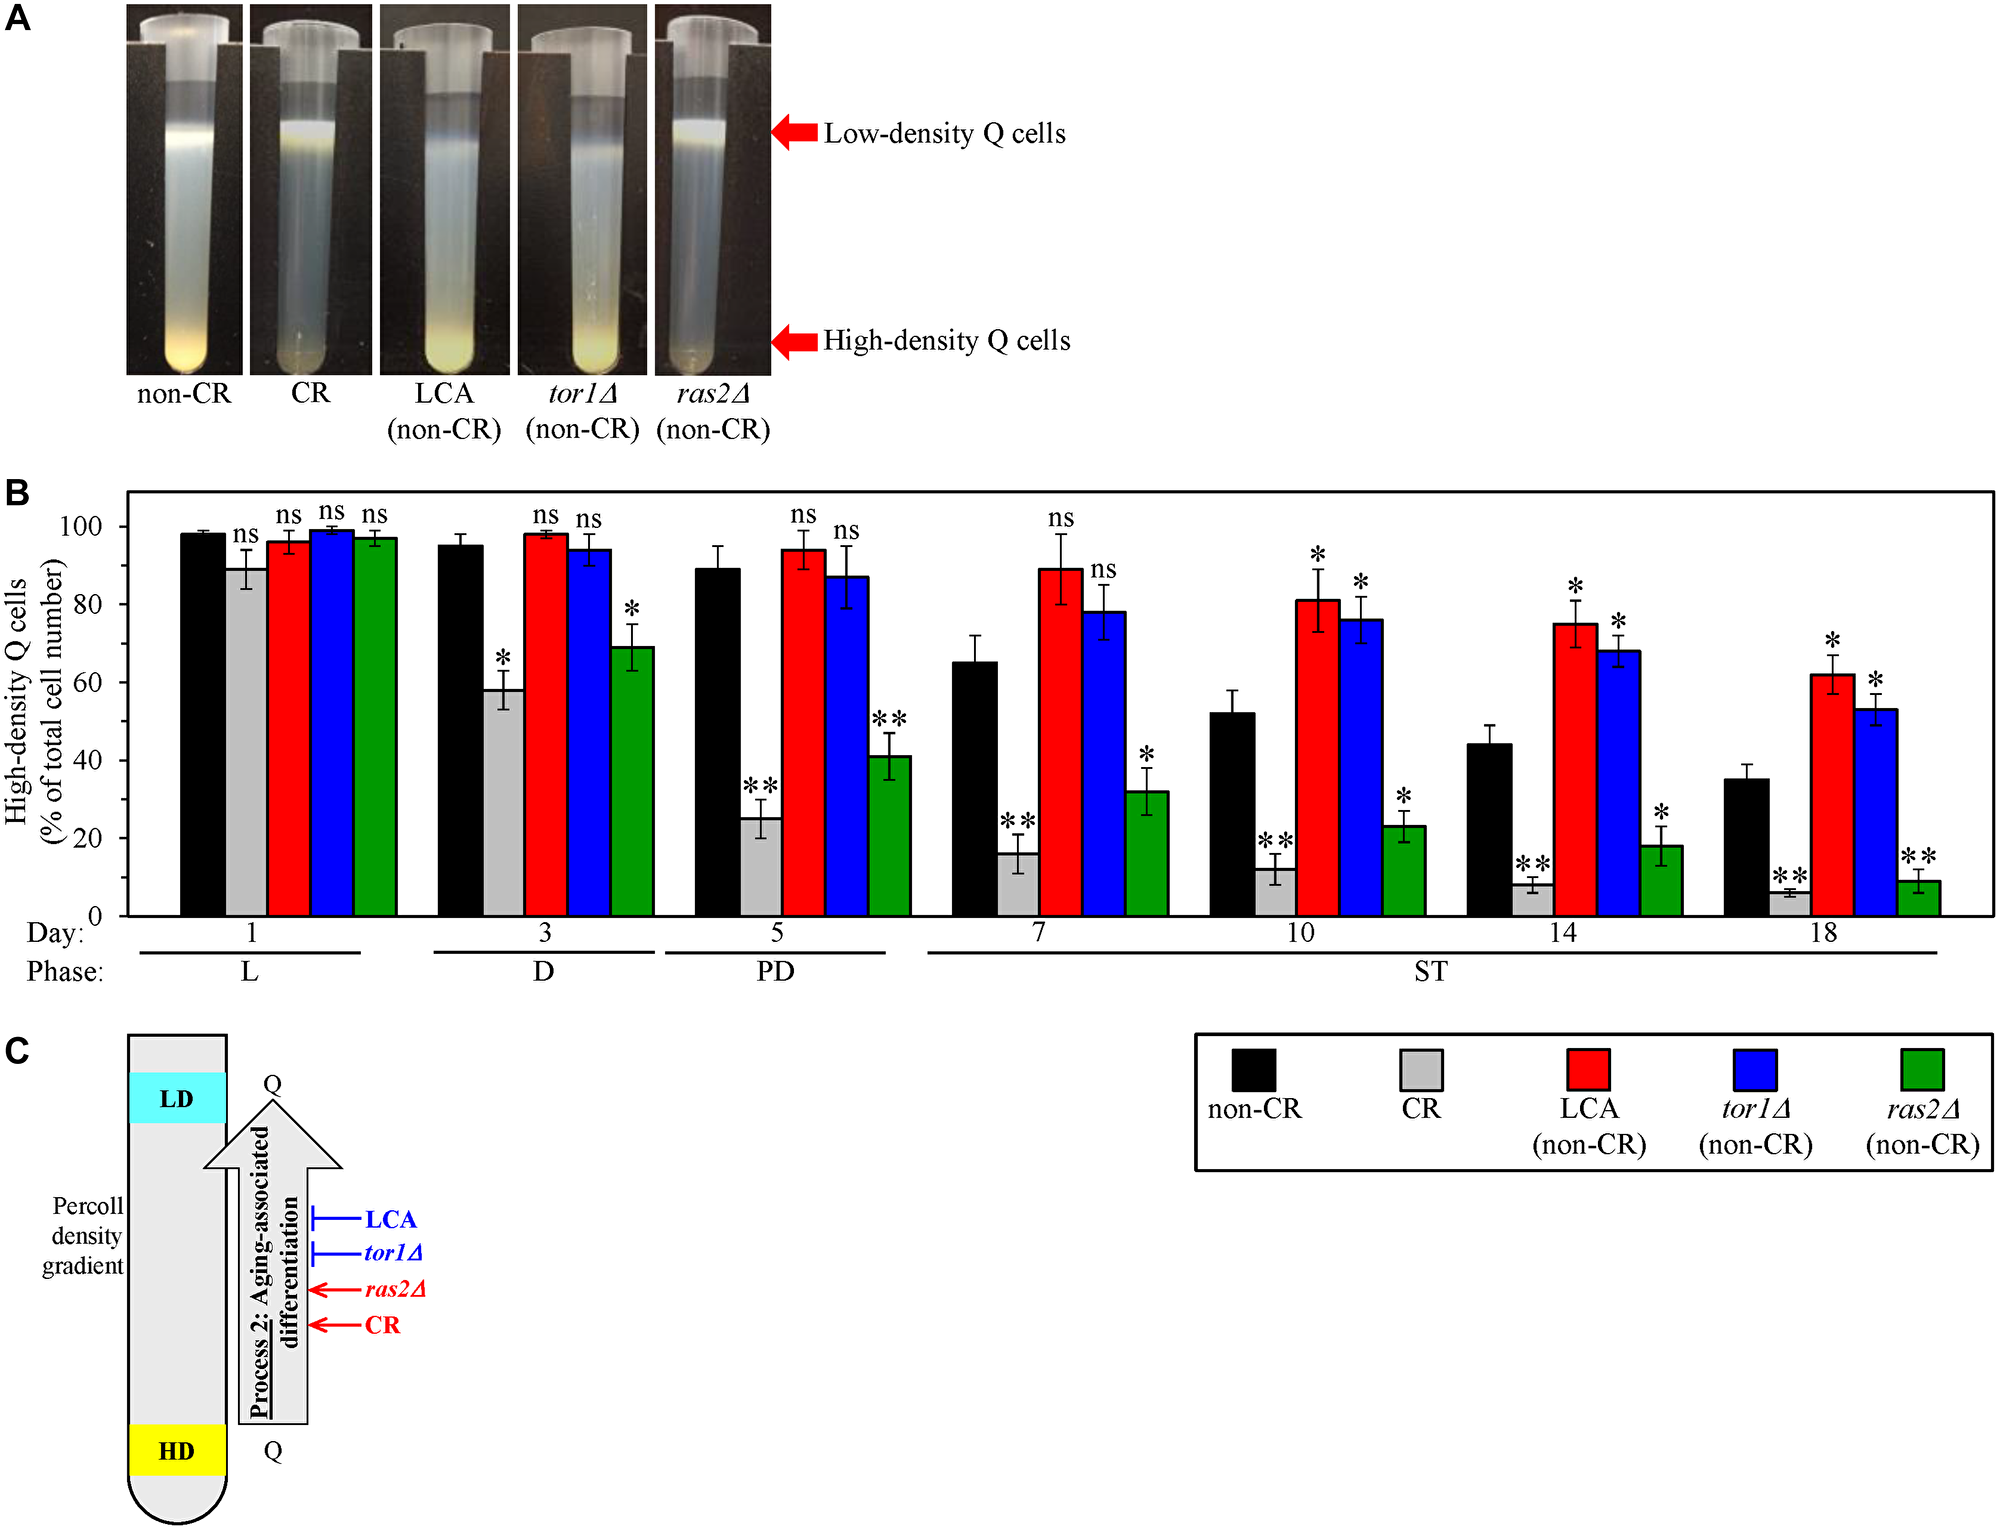
Figure 3: Caloric restriction (CR) and the ras2Δ mutation under non-CR conditions accelerate the process 2 of an age-related conversion of high-density quiescent (Q) cells into low-density Q cells. In contrast, lithocholic acid (LCA) and the tor1Δ mutation slow down process 2 under non-CR conditions. Wild-type (WT) yeast cells were cultured in the nutrient-rich YP medium initially containing 0.2% glucose (CR conditions) or 2% glucose (non-CR conditions) with or without LCA. The tor1Δ and ras2Δ mutant cells were cultured in the nutrient-rich YP medium initially containing 2% glucose (non-CR conditions) without LCA. Aliquots of differently aged cell populations were recovered from the logarithmic (L), diauxic (D), post-diauxic (PD) or stationary (ST) growth phase. High-density Q cells and low-density Q cells were purified from these cell populations with the help of the centrifugation in Percoll density gradient, as described in Materials and Methods. A cell counter was used to determine the percentage of high-density Q cells in each of these differently aged populations. (A) Percoll density gradients used to purify high-density Q cells and low-density Q cells from WT or mutant cell populations recovered on day 10 (the ST growth phase) of culturing are shown. (B) The percentage of high-density Q cells in differently aged WT or mutant cell populations. (C) A model for how CR, LCA (under non-CR conditions), tor1Δ (under non-CR conditions) and ras2Δ (under non-CR conditions) affect the process 2 of an age-related conversion of high-density Q cells into low-density Q cells. Data in B are presented as means ± SEM (n = 3; *p < 0.05; ns, not significant). Other Abbreviations: HD: high-density cells; LD: low-density cells.
Collectively, these findings indicate that CR and ras2Δ (under non-CR conditions) accelerate the process 2 of an age-related conversion of high-density Q cells into low-density Q cells (Figure 3C). In contrast, LCA and tor1Δ (both under non-CR conditions) slow down process 2 (Figure 3C).
All four tested geroprotectors decelerate the aging-associated processes of a fast deterioration in the quiescence of low-density Q cells and a slow decline in the quiescence of high-density Q cells
Process 3 linking cellular aging to cellular quiescence could lead to a fast aging-associated deterioration in the quiescence of low-density Q cells (Figure 1) [109]. Process 4 linking cellular aging to cellular quiescence could cause a slow aging-associated decline in the quiescence of high-density Q cells (Figure 1) [109]. We previously found that processes 3 and 4 are slowed down in yeast cultured under CR conditions on 0.2% glucose [109].
We sought to investigate how LCA and the single-gene deletion mutations tor1Δ and ras2Δ influence processes 3 and 4 under non-CR conditions of culturing.
We first compared the effects of CR, LCA, tor1Δ and ras2Δ on an aging-associated decline in the clonogenicity of low- and high-density Q cells. Clonogenicity is a hallmark of quiescence. Q cells are clonogenic because, unlike NQ cells, they can form a colony after being transferred from a nutrient-depleted liquid medium to a surface of a nutrient-rich solid medium [62, 109].
We cultured WT and mutant yeast strains under the conditions described in the previous section and collected culture aliquots of different chronological ages. We used centrifugation in the Percoll density gradient to purify the sub-populations of high- and low-density Q cells from these aliquots. We then assessed the clonogenicities of these cell sub-populations with the help of a plating assay for reproductive (colony-forming) capability.
We found that, through the entire chronological lifespan, the CR, LCA, tor1Δ and ras2Δ geroprotectors slow down the aging-associated process 3 of a fast deterioration in the clonogenicity (i.e., quiescence) of low-density Q cells (Figure 4A). We also found that, since day 10 (the ST growth phase) of culturing, all these geroprotectors decelerate the aging-associated process 4 of a slow decline in the clonogenicity (i.e., quiescence) of high-density Q cells (Figure 4B).
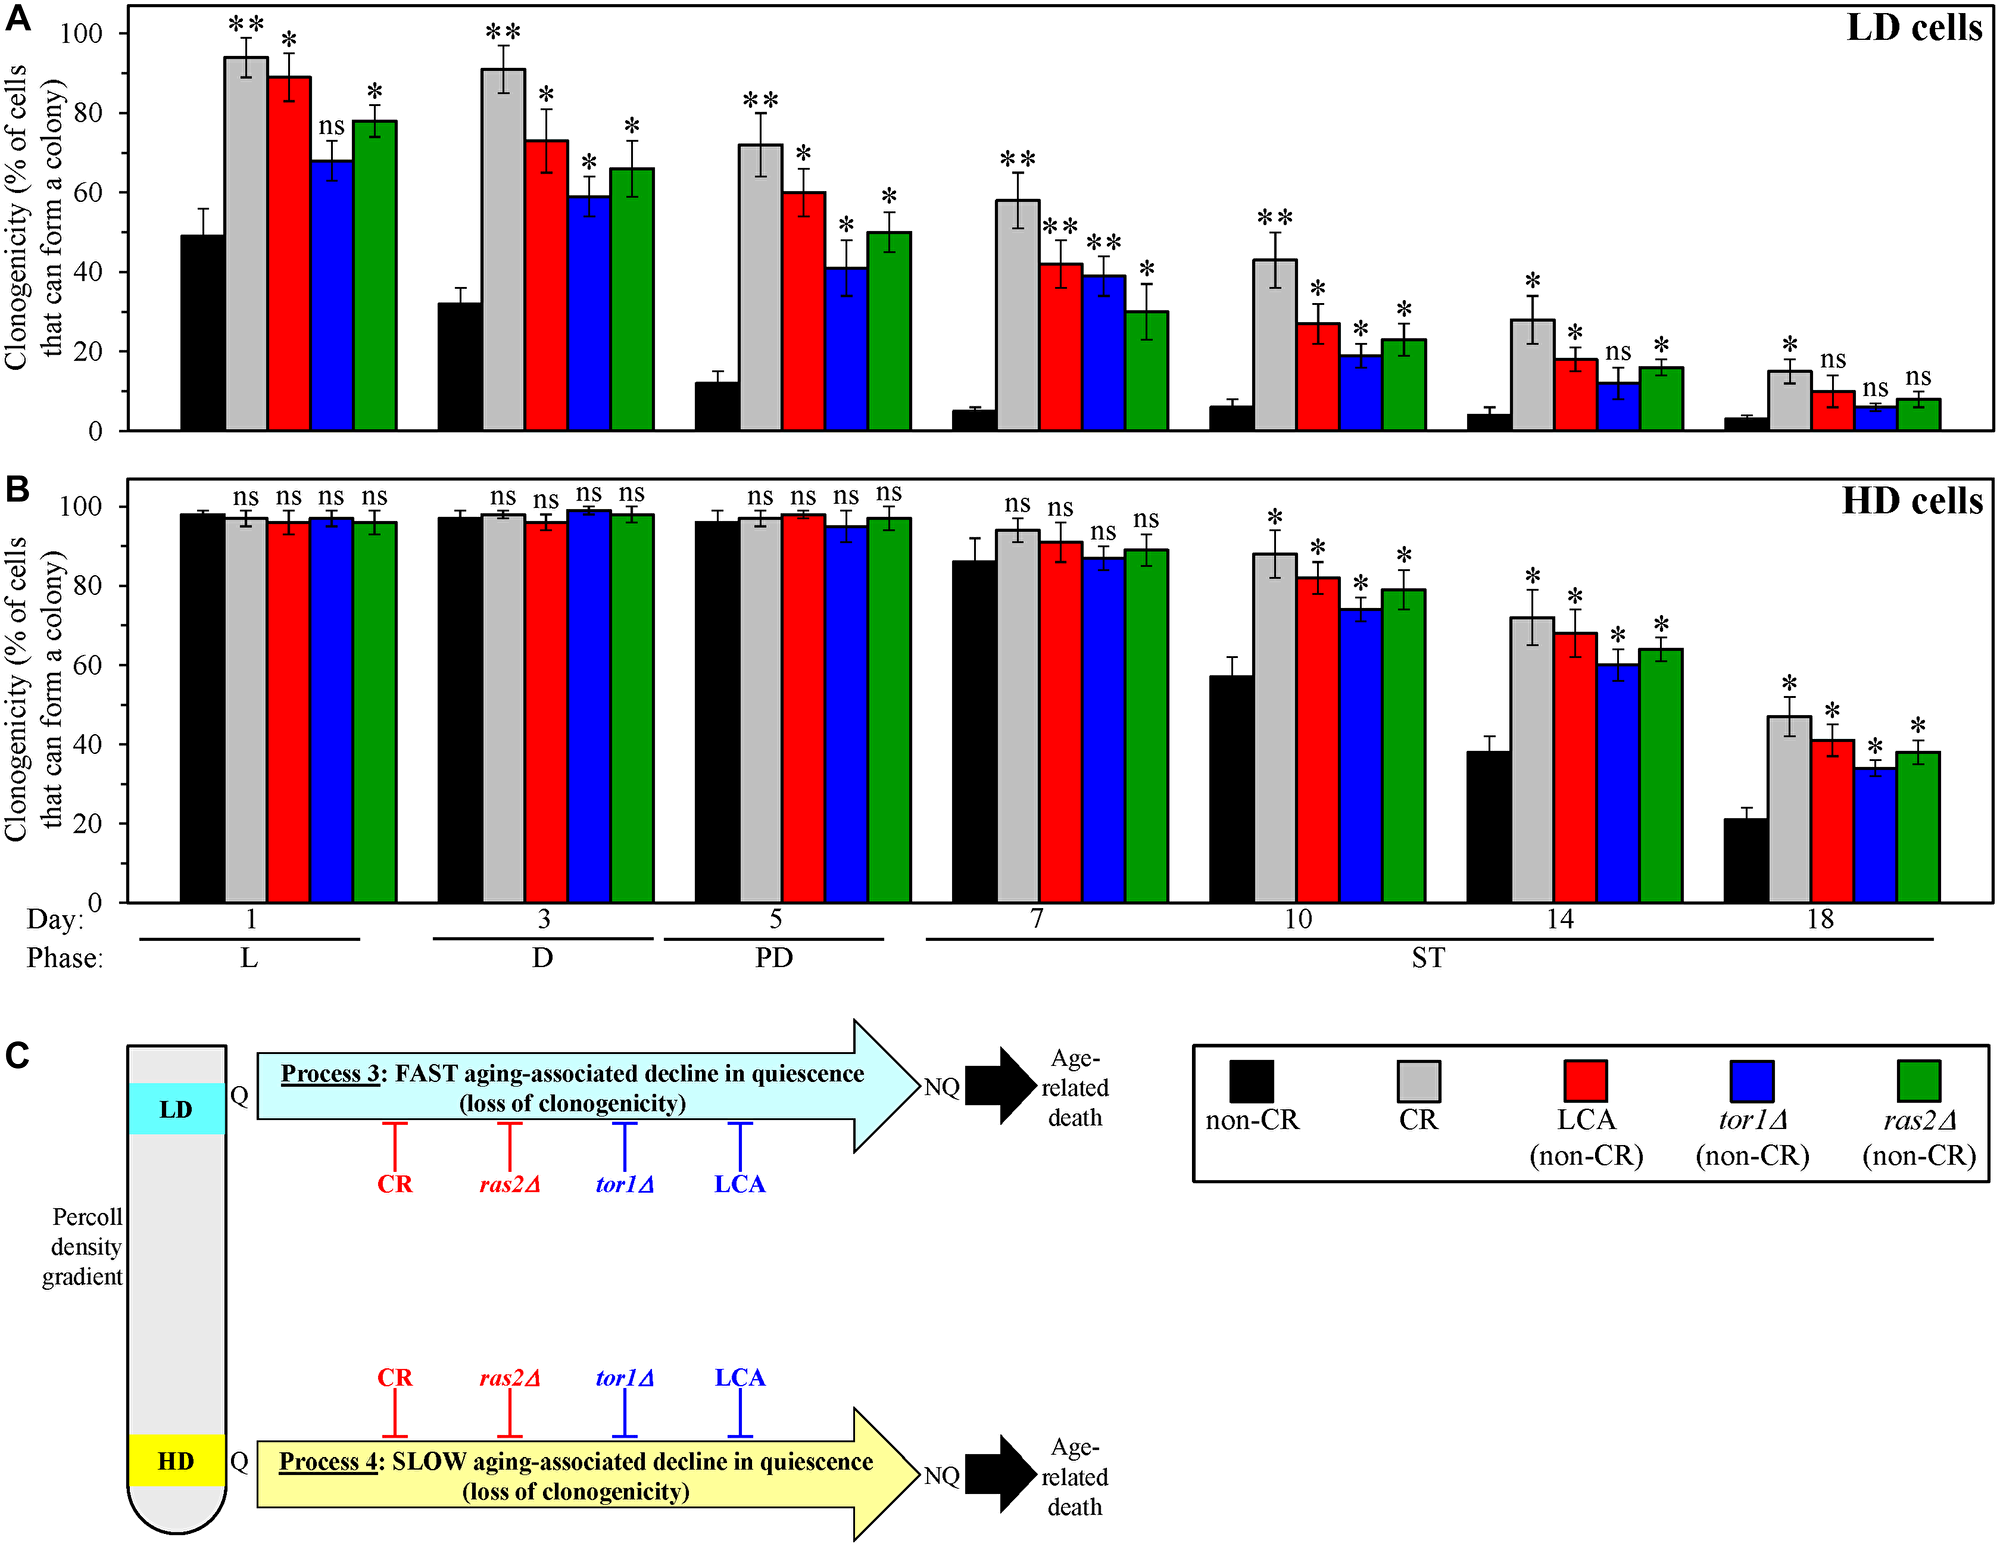
Figure 4: Caloric restriction (CR), lithocholic acid (LCA), the tor1Δ mutation and the ras2Δ mutation postpone an aging-associated decline in the clonogenicities of low-density quiescent (Q) cells and high-density Q cells during processes 3 and 4, respectively. Wild-type (WT) yeast cells were cultured in the nutrient-rich YP medium initially containing 0.2% glucose (CR conditions) or 2% glucose (non-CR conditions) with or without LCA. The tor1Δ and ras2Δ mutant cells were cultured in the nutrient-rich YP medium initially containing 2% glucose (non-CR conditions) without LCA. Aliquots of differently aged cell populations were recovered from the logarithmic (L), diauxic (D), post-diauxic (PD) or stationary (ST) growth phase. High-density Q cells and low-density Q cells were purified from these cell populations with the help of the centrifugation in Percoll density gradient, as described in Materials and Methods. A plating assay for reproductive (colony forming) capability, which is described in Materials and Methods, was used to measure the clonogenicities of low-density Q cells (A) and high-density Q cells (B) in differently aged WT or mutant cell populations. (C) A model for how CR, LCA (under non-CR conditions), tor1Δ (under non-CR conditions) and ras2Δ (under non-CR conditions) affect an aging-associated deterioration in the clonogenicities of low-density Q cells and high-density Q cells during processes 3 and 4, respectively. Data in A and B are presented as means ± SEM (n = 3; *p < 0.05; **p < 0.01; ns, not significant). Other Abbreviations: HD: high-density cells; LD: low-density cells; NQ: non-quiescent cells.
Based on these observations, we concluded that CR, LCA, tor1Δ and ras2Δ slow down an aging-associated deterioration in the clonogenicities of low-density Q cells and high-density Q cells during processes 3 and 4, respectively (Figure 4C).
We also examined how CR, LCA, tor1Δ and ras2Δ influence an aging-associated decline in the abilities of low- and high-density Q cells to synchronously re-enter the mitotic cell cycle after being transferred from a nutrient-depleted liquid medium to a nutrient-rich liquid medium. The synchronous cell cycle re-entry is another hallmark of quiescence [62, 109]. This essential trait of Q cells distinguishes them from NQ cells [62, 109].
WT and mutant yeast strains were cultured under the conditions described in the previous section. Culture aliquots of diverse chronological ages were collected on different days of culturing. The sub-populations of high- and low-density Q cells were purified from these aliquots with the help of Percoll density gradient centrifugation.
We then assessed the effects of CR, LCA, tor1Δ and ras2Δ on the abilities of purified high- and low-density Q cells to synchronously re-enter the mitotic cell cycle after cell transfer into a fresh medium and incubation for 1 to 4 h.
We found that low-density Q cells in control non-CR cultures lose the ability to re-enter the mitotic cell cycle synchronously and become NQ cells since day 5 (the PD growth phase) of culturing (Figure 5A). Yet, the CR, LCA, tor1Δ and ras2Δ geroprotectors slowed down the fast aging-associated loss of such ability by low-density Q cells (Figure 5A).
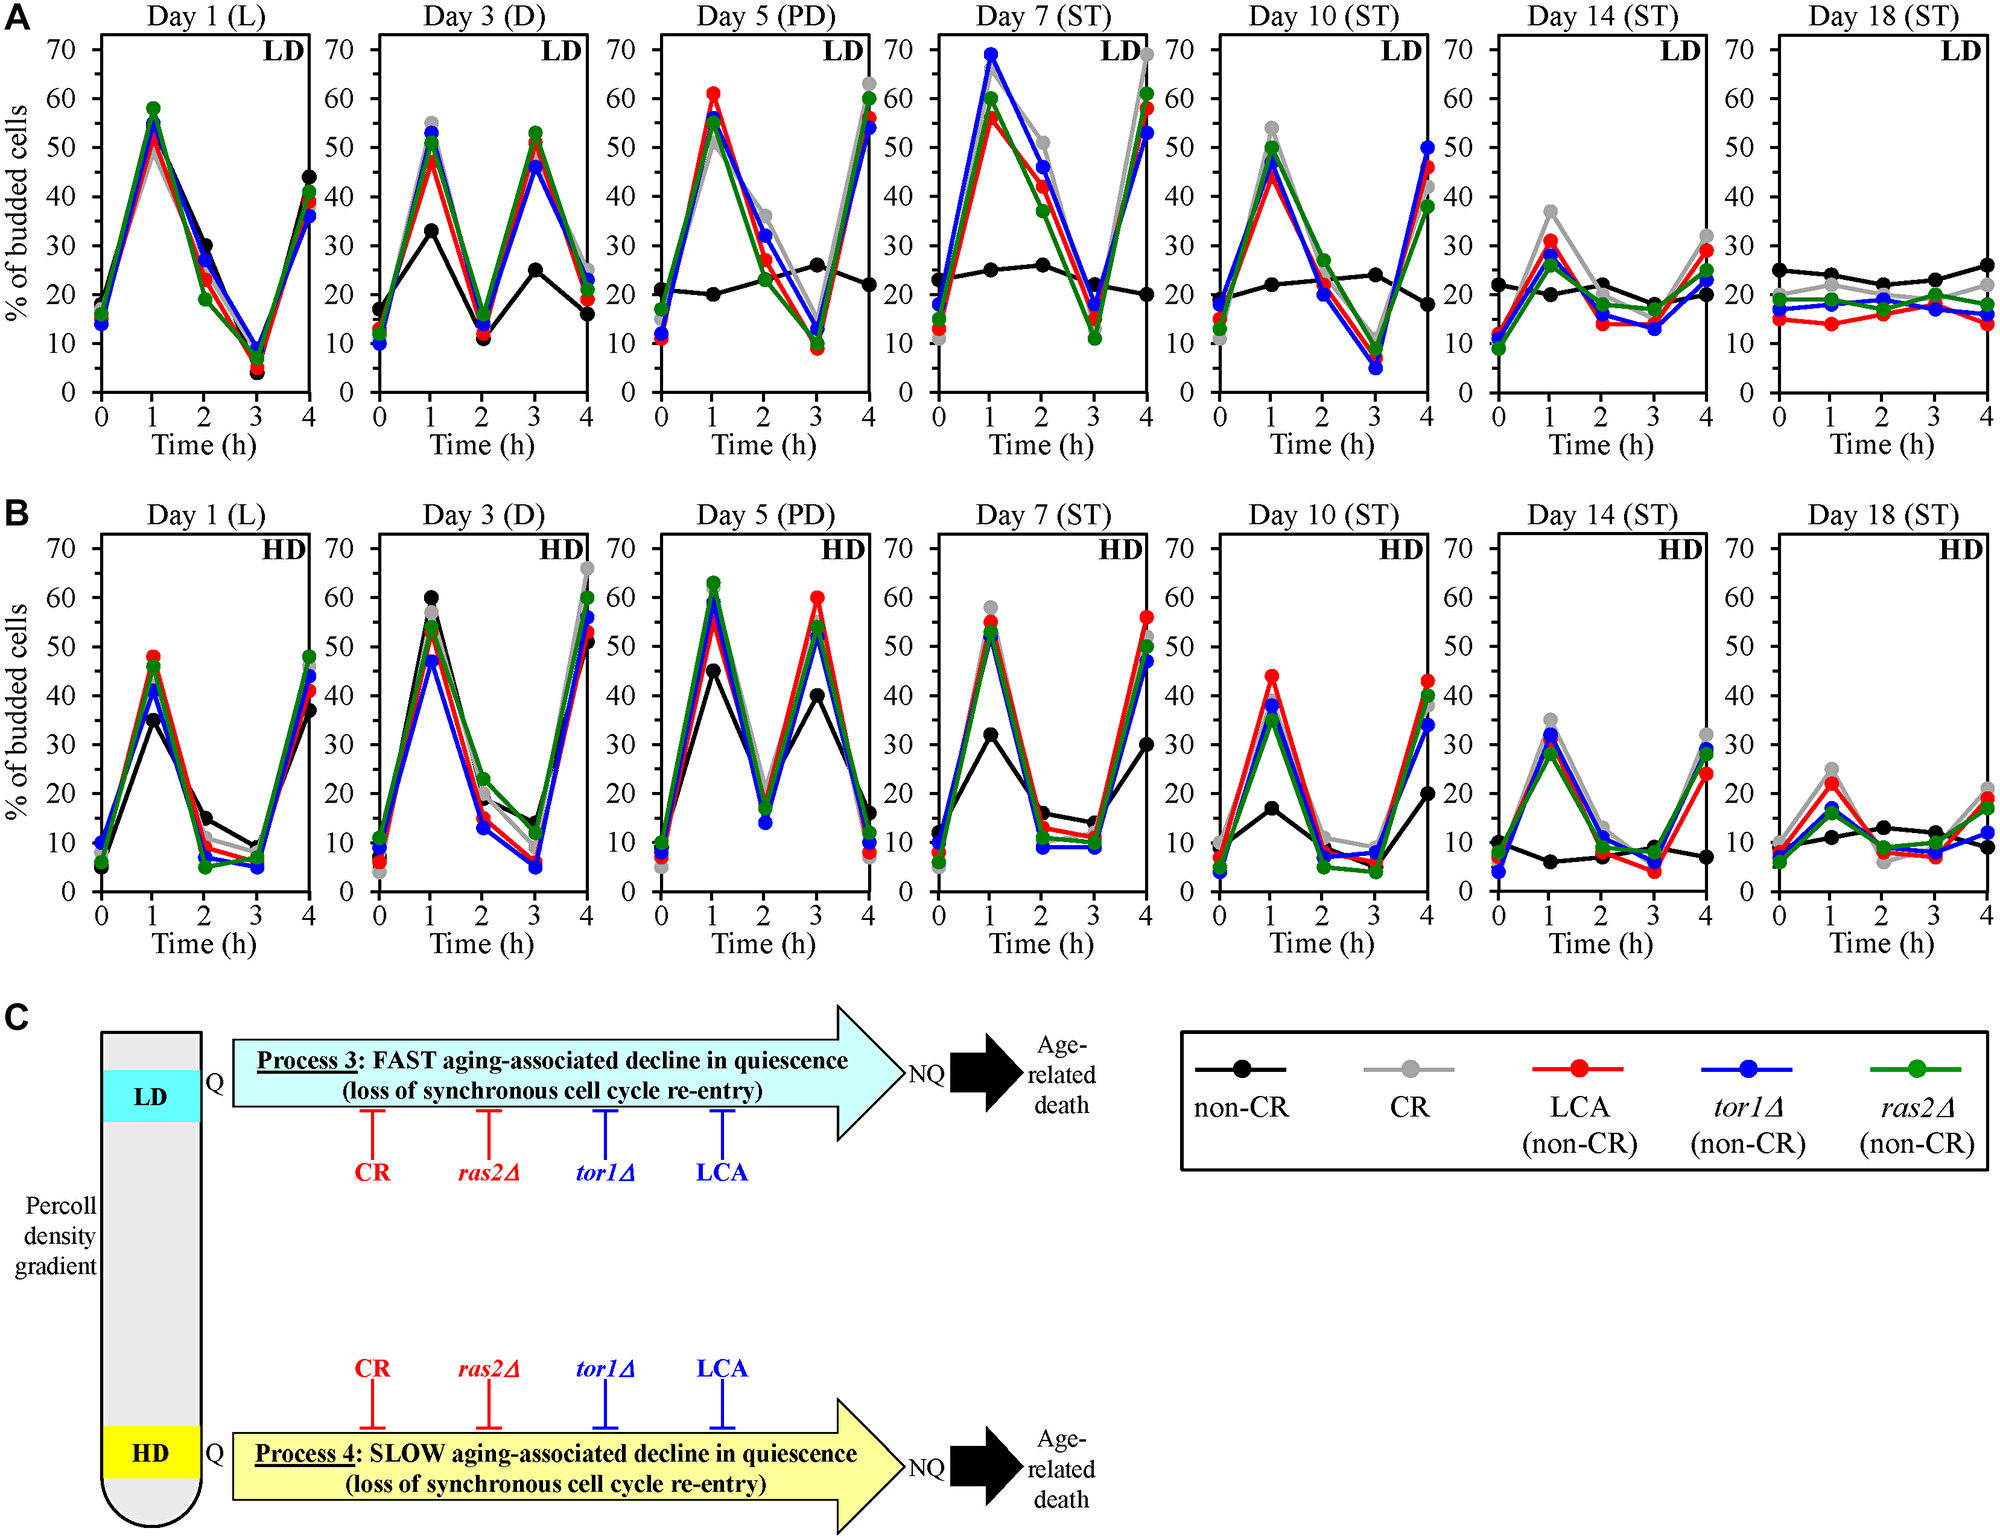
Figure 5: Caloric restriction (CR), lithocholic acid (LCA), the tor1Δ mutation and the ras2Δ mutation delay an aging-associated deterioration in the abilities of low-density quiescent (Q) cells and high-density Q cells to re-enter the mitotic cell cycle synchronously during processes 3 and 4, respectively. Wild-type (WT) yeast cells were cultured in the nutrient-rich YP medium initially containing 0.2% glucose (CR conditions) or 2% glucose (non-CR conditions) with or without LCA. The tor1Δ and ras2Δ mutant cells were cultured in the nutrient-rich YP medium initially containing 2% glucose (non-CR conditions) without LCA. Aliquots of differently aged cell populations were recovered from the logarithmic (L), diauxic (D), post-diauxic (PD) or stationary (ST) growth phase. High-density Q cells and low-density Q cells were purified from these cell populations with the help of the centrifugation in Percoll density gradient, as described in Materials and Methods. A detailed in Materials and Methods assay was used for assessing the abilities of low-density Q cells (A) and high-density Q cells (B) in differently aged WT or mutant cell populations to synchronously re-enter the mitotic cell cycle after cell transfer into fresh medium and incubation for 1 to 4 h. (C) A model for how CR, LCA (under non-CR conditions), tor1Δ (under non-CR conditions) and ras2Δ (under non-CR conditions) influence an aging-associated decline in the synchronous cell cycle re-entry for low-density Q cells and high-density Q cells during processes 3 and 4, respectively. Data in A and B are presented as means (n = 3). Other Abbreviations: HD: high-density cells; LD: low-density cells; NQ: non-quiescent cells.
We also found that high-density Q cells in control non-CR cultures cannot synchronously re-enter the mitotic cell cycle since day 14 (the ST growth phase) of culturing (Figure 5B). However, all four tested geroprotectors delayed the slow aging-associated loss of such ability by high-density Q cells (Figure 5B).
Thus, we concluded that CR, LCA, tor1Δ and ras2Δ slow down an aging-associated decline in the abilities of low-density Q cells and high-density Q cells to re-enter the mitotic cell cycle synchronously during processes 3 and 4, respectively (Figure 5C).
In sum, the findings presented in this section prove that the CR, LCA, tor1Δ and ras2Δ geroprotectors slow down the aging-associated process 3 of a fast deterioration in the quiescence of low-density Q cells (Figure 5C). Furthermore, each of these four geroprotectors also delays the aging-associated process 4 of a slow decline in the quiescence of high-density Q cells (Figure 5C).
Two different ways of delaying yeast chronological aging by geroprotectors that differently affect the mechanism potentially linking cellular aging to cellular quiescence
Our findings described in the previous three sections indicate that CR and the ras2Δ mutation (if present in yeast cultured under non-CR conditions) affect the mechanism that could link cellular aging to cellular quiescence in a different way than LCA and the tor1Δ mutation (if added to or present in yeast cultured under non-CR conditions, respectively). CR and the ras2Δ mutation initiate the formation of a stem cell niche of high-density Q cells (process 1) by arresting the cell cycle in early G1, whereas LCA and the tor1Δ mutation promote process 1 by arresting the cell cycle in late G1 (Figure 6). Furthermore, CR and the ras2Δ mutation speed up an age-related conversion of high-density Q cells into low-density Q cells (process 2), whereas LCA and the tor1Δ mutation slow down process 2 (Figure 6). Yet, each of the four tested geroprotective interventions similarly affects processes 3 and 4. Each of them decelerates a fast aging-associated decline in the quiescence of low-density Q cells (process 3) (Figure 6). They also postpone a slow aging-associated decline in the quiescence of high-density Q cells (process 4) (Figure 6).
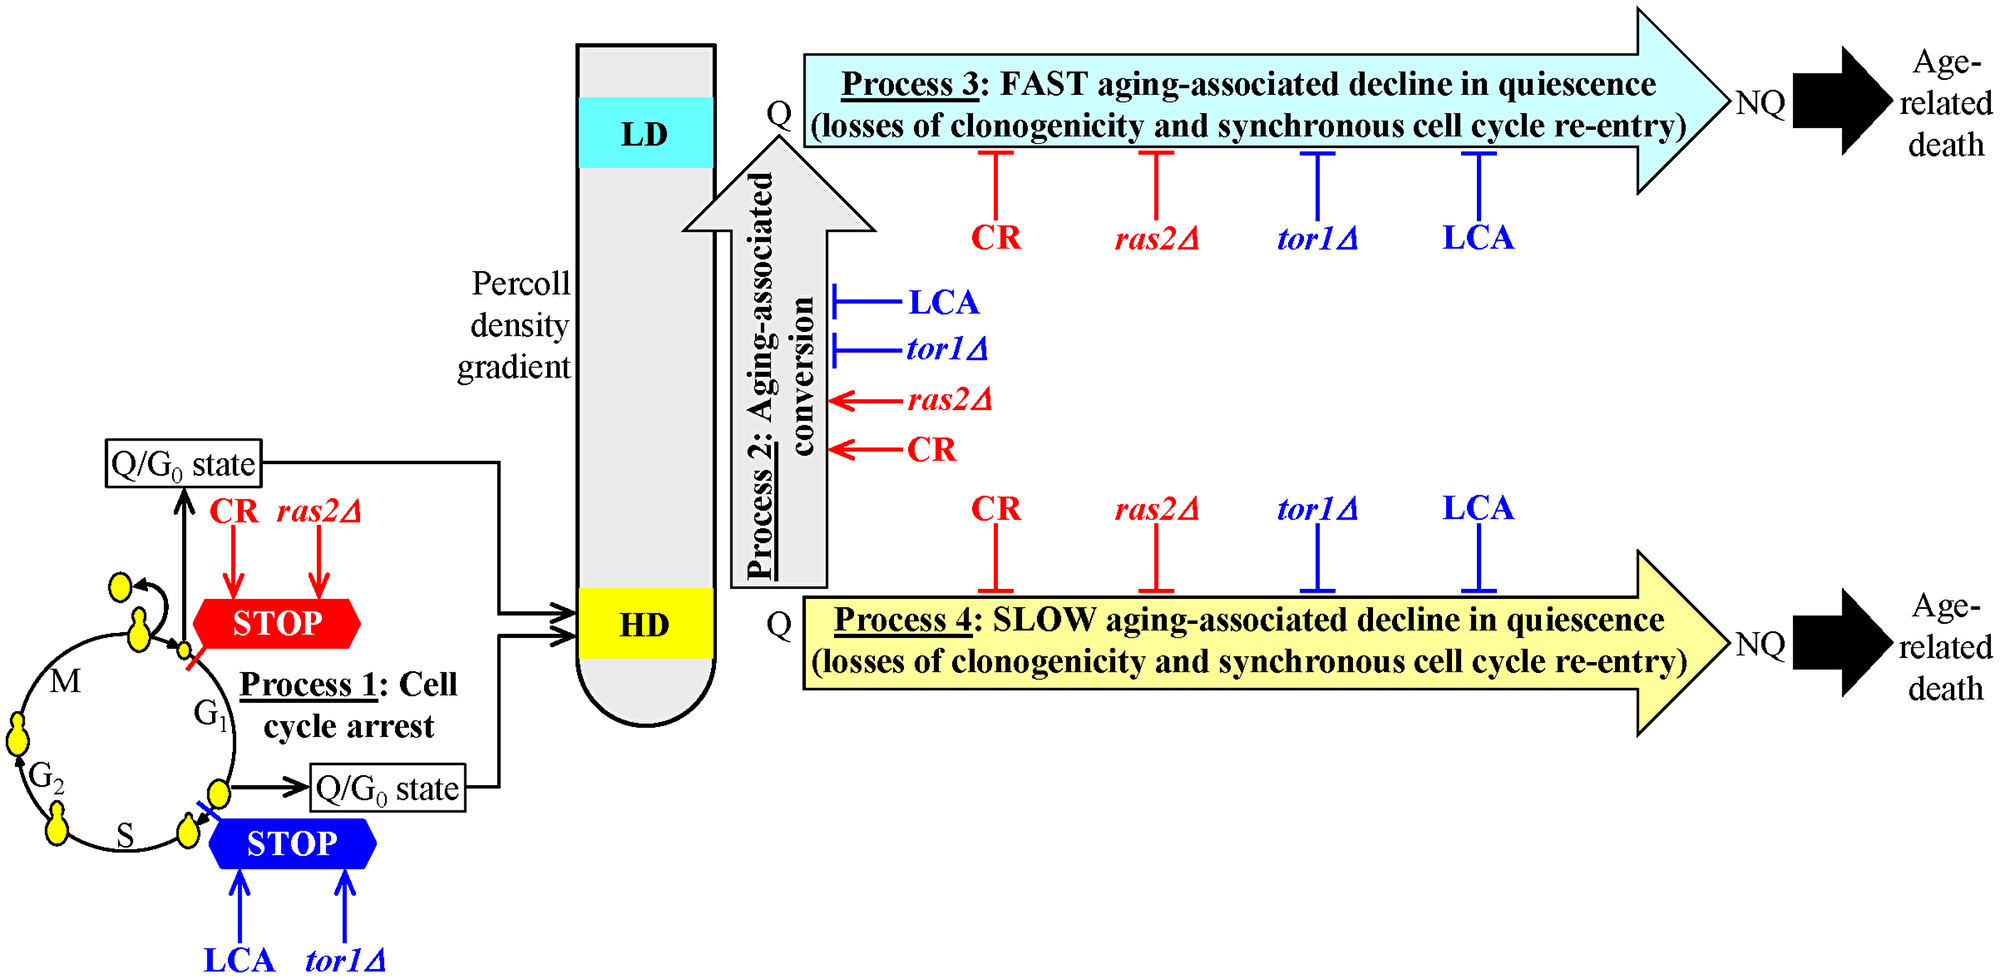
Figure 6: A model for the two different ways of delaying yeast chronological aging by geroprotectors that differently affect the mechanism potentially linking cellular aging to cellular quiescence. The first way is to initiate the formation of high-density quiescent (Q) cells (process 1) by arresting the cell cycle in early G1, speed up an age-related transition of high-density Q cells to low-density Q cells (process 2), slow down a fast aging-associated decline in the quiescence of low-density Q cells (process 3) and decelerate a slow aging-associated decline in the quiescence of high-density Q cells (process 4). Caloric restriction (CR) and the ras2Δ mutation (under non-CR conditions) postpone yeast chronological aging because they operate via the first way of targeting the mechanism that could link cellular aging to cellular quiescence. The second way is to promote the development of high-density Q cells (process 1) by arresting the cell cycle in late G1, postpone an age-related conversion of high-density Q cells into low-density Q cells (process 2), delay a fast aging-associated decline in the quiescence of low-density Q cells (process 3) and decelerate a slow aging-associated decline in the quiescence of high-density Q cells (process 4). Lithocholic acid (LCA) and the tor1Δ mutation (both under non-CR conditions) delay yeast chronological aging because they act via the second way of targeting the mechanism potentially linking cellular aging to cellular quiescence.
Thus, there are the following two ways of slowing down yeast chronological aging by geroprotectors that differently affect processes 1, 2, 3 and 4.
The first way is to promote the formation of high-density Q cells (process 1) by arresting the cell cycle in early G1, accelerate an age-related conversion of high-density Q cells into low-density Q cells (process 2), slow down a fast aging-associated decline in the quiescence of low-density Q cells (process 3) and decelerate a slow aging-associated deterioration in the quiescence of high-density Q cells (process 4) (Figure 6). CR and the ras2Δ mutation postpone yeast chronological aging because they operate via the first way of targeting the mechanism potentially linking cellular aging to cellular quiescence (Figure 6).
The second way is to initiate the formation of high-density Q cells (process 1) by arresting the cell cycle in late G1, slow down an age-related conversion of high-density Q cells into low-density Q cells (process 2), postpone a fast aging-associated decline in the quiescence of low-density Q cells (process 3) and decelerate a slow aging-associated decline in the quiescence of high-density Q cells (process 4) (Figure 6). LCA and the tor1Δ mutation delay yeast chronological aging because they act via the second way of targeting the mechanism that could link cellular aging to cellular quiescence (Figure 6).
We selected CR and LCA to investigate the two ways different geroprotectors postpone yeast chronological aging by differently targeting the mechanism potentially linking cellular aging to cellular quiescence.
A characteristic rise in glycogen within Q cells does not contribute either to aging delay by CR and LCA or to their effects on the mechanism potentially linking cellular aging to cellular quiescence
We hypothesized that certain metabolic traits of Q cells could play essential roles in the abilities of CR and LCA to postpone yeast chronological aging by differently affecting the mechanism that could link cellular aging to cellular quiescence. One such trait is increased glycogen concentration within Q cells under CR conditions of culturing (Figure 1A and 1B) [109]. Therefore, we first assessed how the single-gene deletion mutations that alter the intracellular glycogen concentration influence the extent of aging delay by CR and LCA. We also examined how these mutations affect the efficiencies of processes 1, 2, 3 and 4, all of which are integrated into the mechanism potentially linking cellular aging to cellular quiescence (Figure 1).
The single-gene deletion mutation gph1Δ impairs glycogen debranching to glucose-1-phosphate because it prevents the removal of alpha-1,4-linked glucose units that precede an alpha-1,6-branch point [128–130]. However, it does not affect the Gdb1p-dependent debranching of this storage carbohydrate to glucose [130]. The gph1Δ mutation is known to increase the intracellular concentration of glycogen in yeast cultured under non-CR conditions [128]. We found that gph1Δ also elicits an age-related rise in glycogen concentration in yeast limited in calorie supply (Figure 7A) and yeast cultured under non-CR conditions in the presence of LCA (Figure 7D). It needs to be emphasized that, although the gph1Δ mutation shortened yeast CLS under CR conditions in the absence of LCA (Figure 7B) and non-CR conditions in the presence of LCA (Figure 7E), it did not alter the extent to which yeast CLS was extended by CR (Figure 7C) or by LCA (Figure 7F). Thus, the gph1Δ-dependent increase in glycogen concentration does not affect the efficiency of yeast CLS extension by CR or LCA.
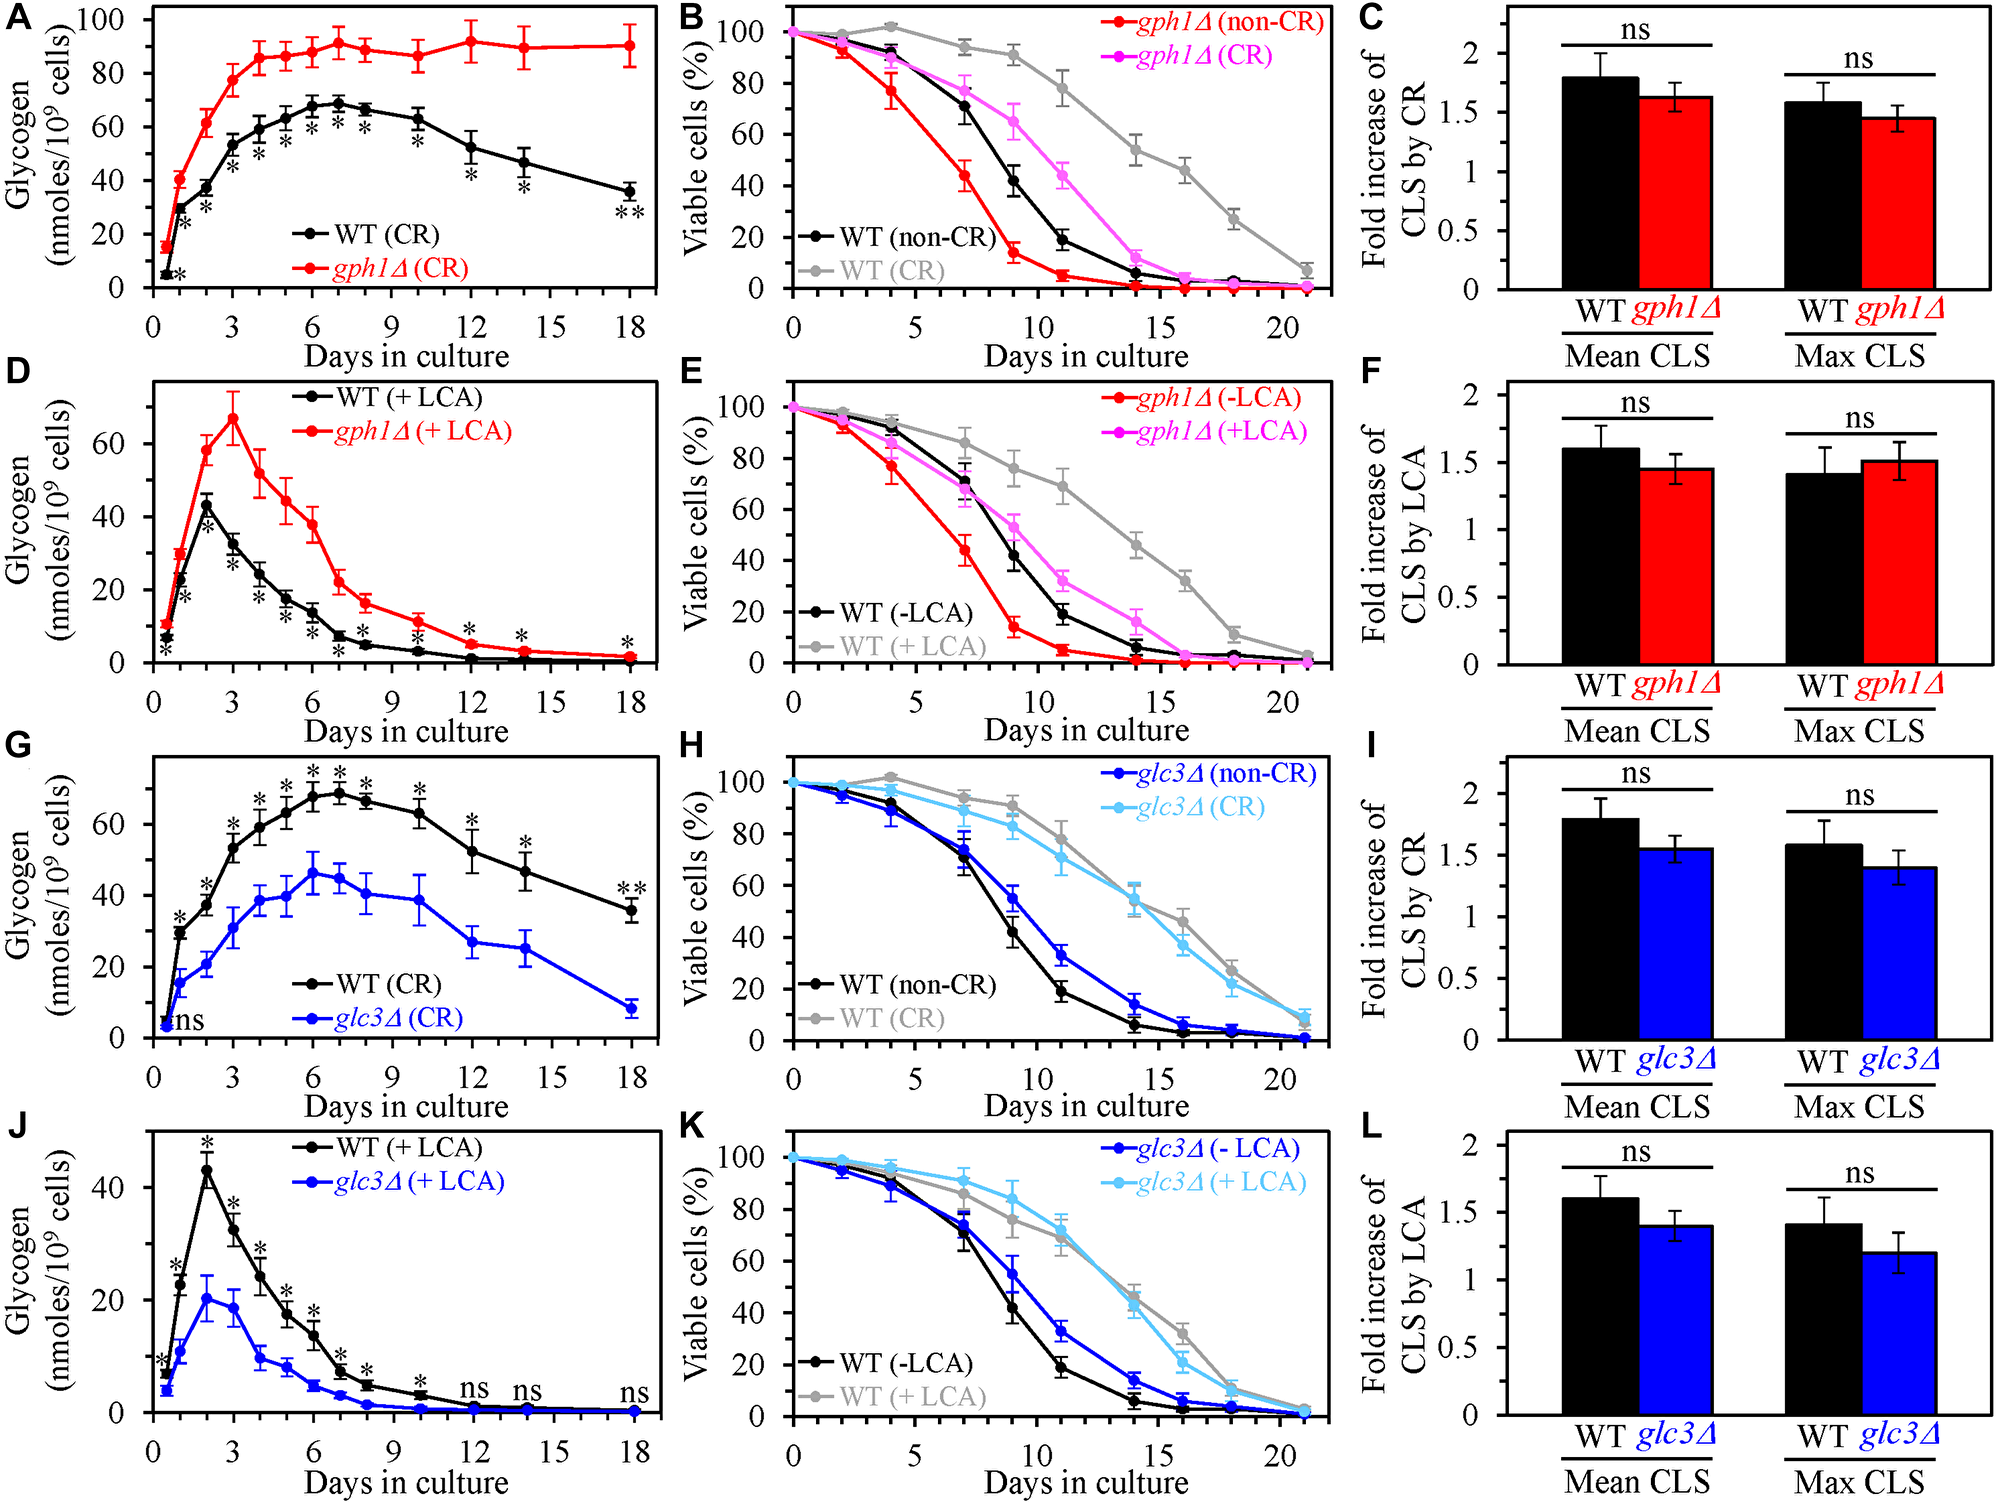
Figure 7: The single-gene deletion mutations that increase or decrease the intracellular glycogen concentration do not affect the efficiency of yeast chronological lifespan (CLS) extension by caloric restriction (CR) or lithocholic acid (LCA). Wild-type (WT), gph1Δ and glc3Δ cells were cultured in the nutrient-rich YP medium initially containing 0.2% glucose (CR conditions) or 2% glucose (non-CR conditions) with or without LCA. (A–C) The concentrations of glycogen in chronologically aging WT and gph1Δ cell cultures grown under CR conditions (A), survival curves of WT and gph1Δ cells cultured under CR or non-CR conditions (B), and the extent to which CR increases the mean and maximum CLS of WT and gph1Δ strains (C) are shown. (D–F) The concentrations of glycogen in chronologically aging WT and gph1Δ cell cultures grown under non-CR conditions with LCA (D), survival curves of WT and gph1Δ cells cultured under non-CR conditions with or without LCA (E), and the extent to which LCA under non-CR conditions increases the mean and maximum CLS of WT and gph1Δ strains (F) are shown. (G–I) The concentrations of glycogen in chronologically aging WT and glc3Δ cell cultures grown under CR conditions (G), survival curves of WT and glc3Δ cells cultured under CR or non-CR conditions (H), and the extent to which CR increases the mean and maximum CLS of WT and glc3Δ strains (I) are shown. (J–L) The concentrations of glycogen in chronologically aging WT and glc3Δ cell cultures grown under non-CR conditions with LCA (J), survival curves of WT and glc3Δ cells cultured under CR conditions without LCA or under non-CR conditions with LCA (K), and the extent to which LCA under non-CR conditions increases the mean and maximum CLS of WT and glc3Δ strains (L) are shown. Data are presented as means ± SEM (n = 3; *p < 0.05; **p < 0.01; ns, not significant; the p values for comparing the means of two in groups were calculated using an unpaired two-tailed t test as described in Materials and Methods).
Moreover, we found that the gph1Δ mutation has no significant effects on processes 1, 2, 3 and 4 (Figure 1) either in yeast cultured under CR conditions without LCA or in yeast cultured under non-CR conditions with LCA. This conclusion is based on the following observations.
First, gph1Δ did not alter the size of high-density Q cells in yeast cultured under either of these two conditions. The high-density Q cells remained small in the gph1Δ strain under CR conditions without LCA (Figure 8A) and continued to be large in this mutant strain under non-CR conditions with LCA (Figure 8B). Based on the observed sizes of high-density Q cells, we concluded that the gph1Δ-dependent increase in glycogen concentration does not affect the ability of CR to initiate the formation of small high-density Q cells (process 1) by arresting the cell cycle and causing entry into quiescence at a checkpoint in early G1. We also concluded that the gph1Δ-driven rise in glycogen concentration does not influence the ability of LCA to promote the formation of large high-density Q cells under non-CR conditions (process 1) by causing the cell cycle arrest and quiescence entry at a checkpoint in late G1.
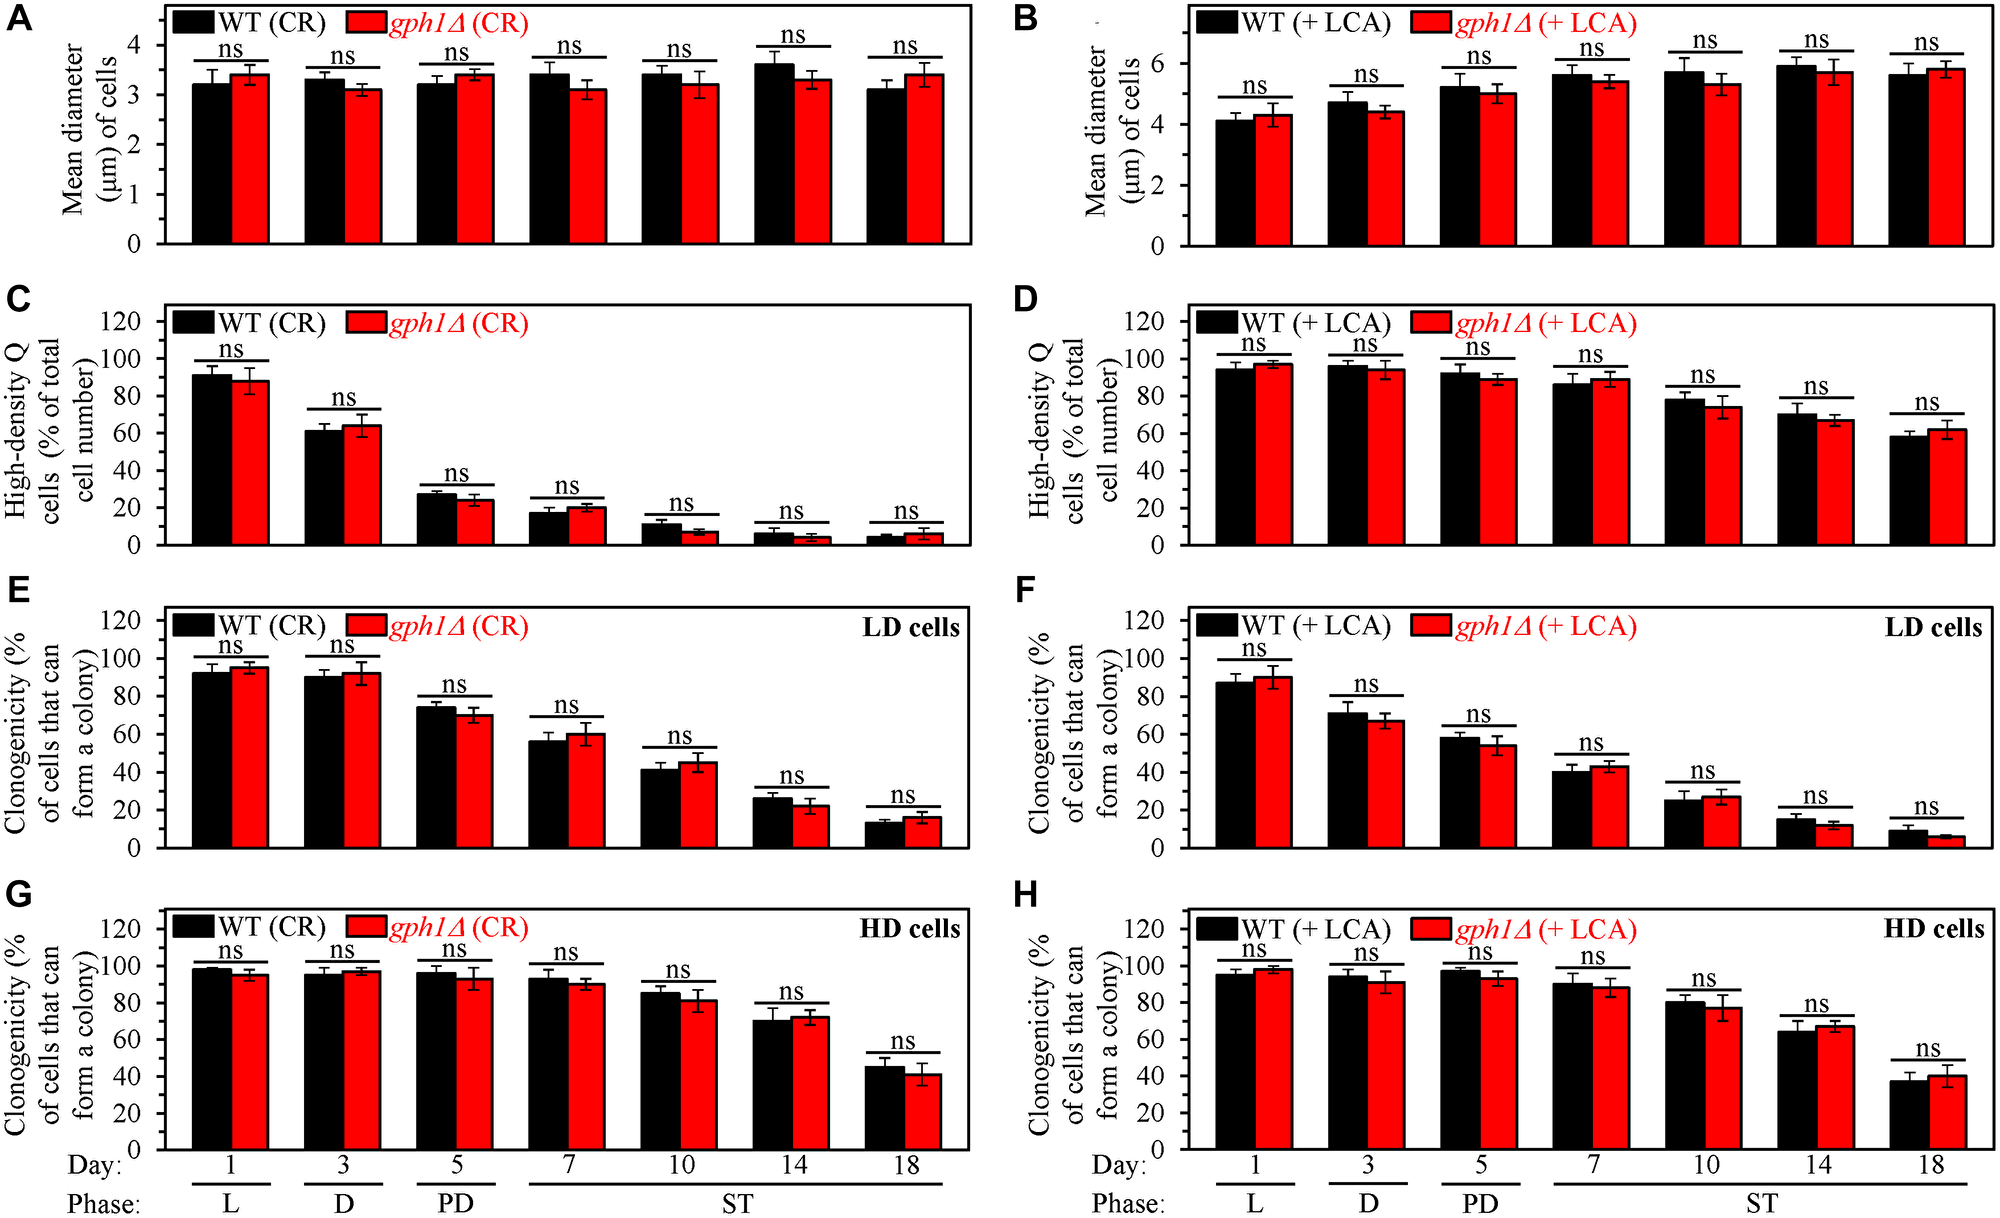
Figure 8: The gph1Δ-dependent increase in glycogen concentration does not affect processes 1, 2, 3 and 4 either in yeast cultured under caloric restriction (CR) conditions without LCA or in yeast cultured under non-CR conditions with lithocholic acid (LCA). Wild-type (WT) and gph1Δ cells were cultured in the nutrient-rich YP medium initially containing 0.2% glucose (CR conditions) or 2% glucose (non-CR conditions) with LCA. Aliquots of differently aged cell populations were recovered from the logarithmic (L), diauxic (D), post-diauxic (PD) or stationary (ST) growth phase. High-density quiescent (Q) cells and low-density Q cells were purified from these cell populations with the help of the centrifugation in Percoll density gradient, as described in Materials and Methods. (A and B) Mean diameters of high-density Q cells recovered from different growth phases are shown for yeast cultured under CR conditions without LCA (A) and yeast cultured under non-CR conditions with LCA (B). Mean diameters of high-density Q cells in A and B were measured using differential interference contrast microscopy and subsequent morphometric analysis, as described in Materials and Methods. (C and D) The values of the percentage of high-density Q cells in each of the differently aged cell populations are shown for yeast cultured under CR conditions without LCA (C) and yeast cultured under non-CR conditions with LCA (D). The percentage of high-density Q cells in C and D was measured with the help of a cell counter, as described in Materials and Methods. (E–H) The clonogenicities of low-density (E, F) and high-density (G, H) cells in each of the differently aged cell populations are shown for yeast cultured under CR conditions without LCA (E, G) and yeast cultured under non-CR conditions with LCA (F, H). The clonogenicities of low- and high-density cells were assessed using a plating assay for reproductive (colony forming) capability, as described in Materials and Methods. Other Abbreviations: HD: high-density cells; LD: low-density cells.
Second, gph1Δ had no significant effect on the fast, age-related conversion of high-density Q cells into low-density Q cells (process 2) under CR conditions without LCA (Figure 8C). This mutation also did not influence the slow, age-related transition from high-density Q cells to low-density Q cells (process 2) under non-CR conditions with LCA (Figure 8D). Thus, the gph1Δ-dependent increase in glycogen concentration does not influence either the ability of CR to speed up process 2 or the ability of LCA to slow down this process under non-CR conditions.
Third, gph1Δ did not influence the extent of the fast, aging-associated decline in the clonogenicity of low-density Q cells (process 3) either under CR conditions in the absence of LCA (Figure 8E) or under non-CR conditions in the presence of LCA (Figure 8F). Also, gph1Δ did not affect the efficiency of the slow, aging-associated deterioration in the clonogenicity of high-density Q cells (process 4) under any of these two conditions (Figure 8G and 8H). Therefore, we concluded that the gph1Δ-dependent increase in glycogen concentration has no significant effect on the abilities of CR and LCA to delay a decline in cellular quiescence during processes 3 and 4.
We then assessed the effects of the single-gene deletion mutation glc3Δ on the extent of aging delay by CR and LCA and processes 1, 2, 3 and 4. This mutation impairs a branching step of glycogen biosynthesis and decreases glycogen concentration in S. cerevisiae cells cultured under non-CR conditions [131, 132]. We found that glc3Δ also causes an age-related decline in glycogen concentration in yeast cultured under CR conditions without LCA (Figure 7G) or under non-CR conditions with LCA (Figure 7J). Despite a minor rise in yeast CLS elicited by glc3Δ under CR conditions without LCA (Figure 7H) and non-CR conditions with LCA (Figure 7K), this mutation did not affect the efficiency of the CLS extension under either of these two conditions of cell culturing (Figure 7I and 7L, respectively). Therefore, we concluded that the glc3Δ-dependent decline in glycogen concentration does not influence the CR- or LCA-driven longevity extension of chronologically aging yeast.
Our findings also indicate that the glc3Δ mutation does not affect processes 1, 2, 3 and 4 (Figure 1) either in yeast cultured under CR conditions in the absence of LCA or yeast cultured under non-CR conditions in the presence of LCA. These findings are described below.
First, a comparison of sizes of high-density Q cells indicates that the glc3Δ-dependent decline in glycogen concentration does not influence the ability of CR to arrest the cell cycle at a checkpoint in early G1, thereby promoting quiescence entry and eliciting the development of small high-density Q cells (process 1) (Figure 9A). The comparison of sizes of high-density Q cells also shows that the glc3Δ-driven decrease in glycogen concentration does not affect the ability of LCA to arrest the cell cycle at a checkpoint in late G1, thus initiating quiescence entry and causing the formation of large high-density Q cells under non-CR conditions (process 1) (Figure 9B).
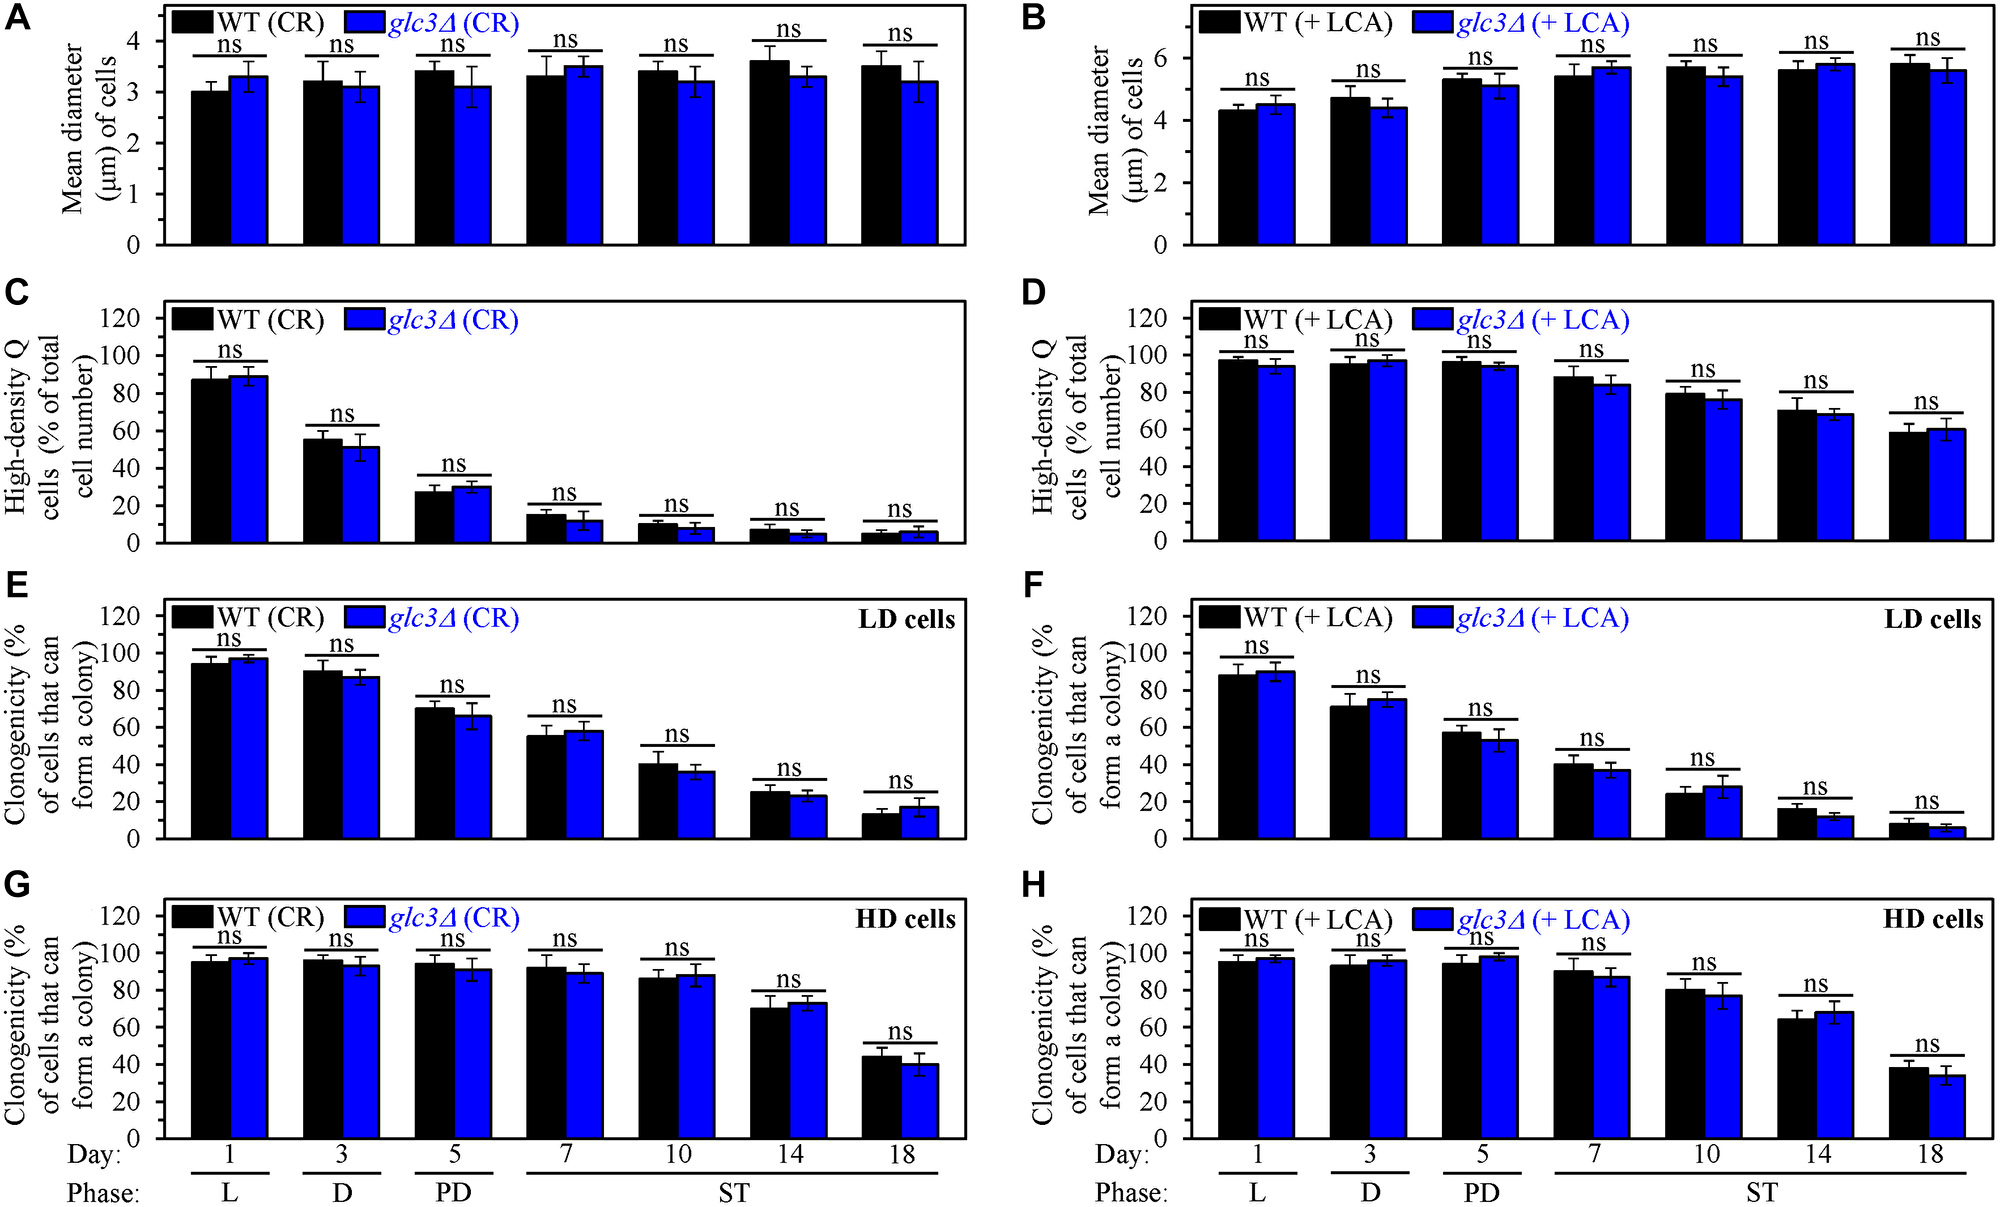
Figure 9: The glc3Δ-dependent decline in glycogen concentration does not affect processes 1, 2, 3 and 4 either in yeast cultured under caloric restriction (CR) conditions without LCA or in yeast cultured under non-CR conditions with lithocholic acid (LCA). Wild-type (WT) and glc3Δ cells were cultured in the nutrient-rich YP medium initially containing 0.2% glucose (CR conditions) or 2% glucose (non-CR conditions) with LCA. Aliquots of differently aged cell populations were recovered from the logarithmic (L), diauxic (D), post-diauxic (PD) or stationary (ST) growth phase. High-density quiescent (Q) cells and low-density Q cells were purified from these cell populations with the help of the centrifugation in Percoll density gradient, as described in Materials and Methods. (A and B) Mean diameters of high-density Q cells recovered from different growth phases are shown for yeast cultured under CR conditions without LCA (A) and yeast cultured under non-CR conditions with LCA (B). Mean diameters of high-density Q cells in A and B were measured using differential interference contrast microscopy and subsequent morphometric analysis, as described in Materials and Methods. (C and D) The values of the percentage of high-density Q cells in each of the differently aged cell populations are shown for yeast cultured under CR conditions without LCA (C) and yeast cultured under non-CR conditions with LCA (D). The percentage of high-density Q cells in C and D was measured with the help of a cell counter, as described in Materials and Methods. (E–H) The clonogenicities of low-density (E, F) and high-density (G, H) cells in each of the differently aged cell populations are shown for yeast cultured under CR conditions without LCA (E, G) and yeast cultured under non-CR conditions with LCA (F, H). The clonogenicities of low- and high-density cells were assessed using a plating assay for reproductive (colony forming) capability, as described in Materials and Methods. Other Abbreviations: HD: high-density cells; LD: low-density cells.
Second, a comparison of the efficiencies with which high-density Q cells are converted into low-density Q cells (process 2) in an age-related manner shows that the glc3Δ mutation does not affect this process either under CR conditions without LCA (Figure 9C) or under non-CR conditions with LCA (Figure 9D). Hence, the glc3Δ-dependent decline in glycogen concentration has no effect either on the acceleration of process 2 by CR or on the deceleration of this process by LCA under non-CR conditions.
Third, we also investigated the effects of the glc3Δ mutation on the fast, aging-associated deterioration in the clonogenicity of low-density Q cells (process 3) and slow, aging-associated decline in the clonogenicity of high-density Q cells (process 4). We found that glc3Δ does not affect processes 3 and 4 either under CR conditions without LCA (Figure 9E and 9G, respectively) or under non-CR conditions with LCA (Figure 9F and 9H, respectively). Based on these findings, we concluded that the glc3Δ-driven reduction in glycogen concentration has no effect on the slowing down of these processes either by CR or by LCA under non-CR conditions.
Collectively, the findings described in this section provide evidence that an increase in the intracellular concentration of glycogen, which is a specific metabolic trait of Q cells, is not essential for the extension of yeast CLS by CR and LCA. These findings also show that a characteristic rise in glycogen within Q cells is not an essential contributor to the effects of CR and LCA on the mechanism potentially linking cellular aging to cellular quiescence.
An increase in trehalose concentration, a metabolic hallmark of Q cells, is an essential contributor to aging delay by CR and LCA and affects the mechanism that could link cellular aging to cellular quiescence
A CR-dependent rise in trehalose concentration is a distinct trait of Q cells (Figure 1A and 1B) [109]. We sought to investigate the role of this Q cell-specific metabolic trait in the delay of yeast chronological aging by CR and LCA. We also wondered if the CR-driven trehalose rise within Q cells may contribute to the specific process (or processes) integrated into the mechanism linking cellular aging to cellular quiescence. To address these challenges, we examined the effects of the single-gene deletion mutations that differently influence the intracellular concentration of trehalose on the efficiencies with which CR and LCA postpone chronological aging in S. cerevisiae. We also assessed how these mutations influence processes 1, 2, 3 and 4, all of which are involved in the mechanism that could link cellular aging to cellular quiescence (Figure 1).
The single-gene deletion mutation ath1Δ impairs intracellular and extracellular trehalose degradation into two glucose molecules by the acid trehalase enzyme Ath1 [133–135]. This mutation has been shown to raise the intracellular concentration of trehalose in yeast cultured under non-CR conditions [135]. Our assessment of intracellular trehalose in yeast cultured under CR conditions revealed that ath1Δ increases trehalose concentration during the L, D and PD growth phases but has an opposite effect on intracellular trehalose during the ST growth phase (Figure 10A) [136]. We also found that the ath1Δ mutation causes a rise in trehalose concentration during all these growth phases (i.e., through the entire CLS) in yeast cultured under non-CR conditions in the presence of LCA (Figure 10D). Noteworthy, ath1Δ extended yeast CLS under CR conditions in the absence of LCA (Figure 10B) and increased the longevity-extending efficiency of CR in chronologically aging yeast (Figure 10B and 10C). Besides, ath1Δ prolonged yeast CLS under non-CR conditions in the presence of LCA (Figure 10E) and amplified the efficiency of yeast CLS extension by LCA under these conditions (Figure 10E and 10F). Based on these findings, we concluded that the ath1Δ-dependent changes in trehalose concentration through the entire CLS define the efficiency of yeast CLS extension by CR. We also deduced that the ath1Δ-driven rise in trehalose concentration through the entire CLS enhances the ability of LCA to prolong yeast CLS under non-CR conditions.
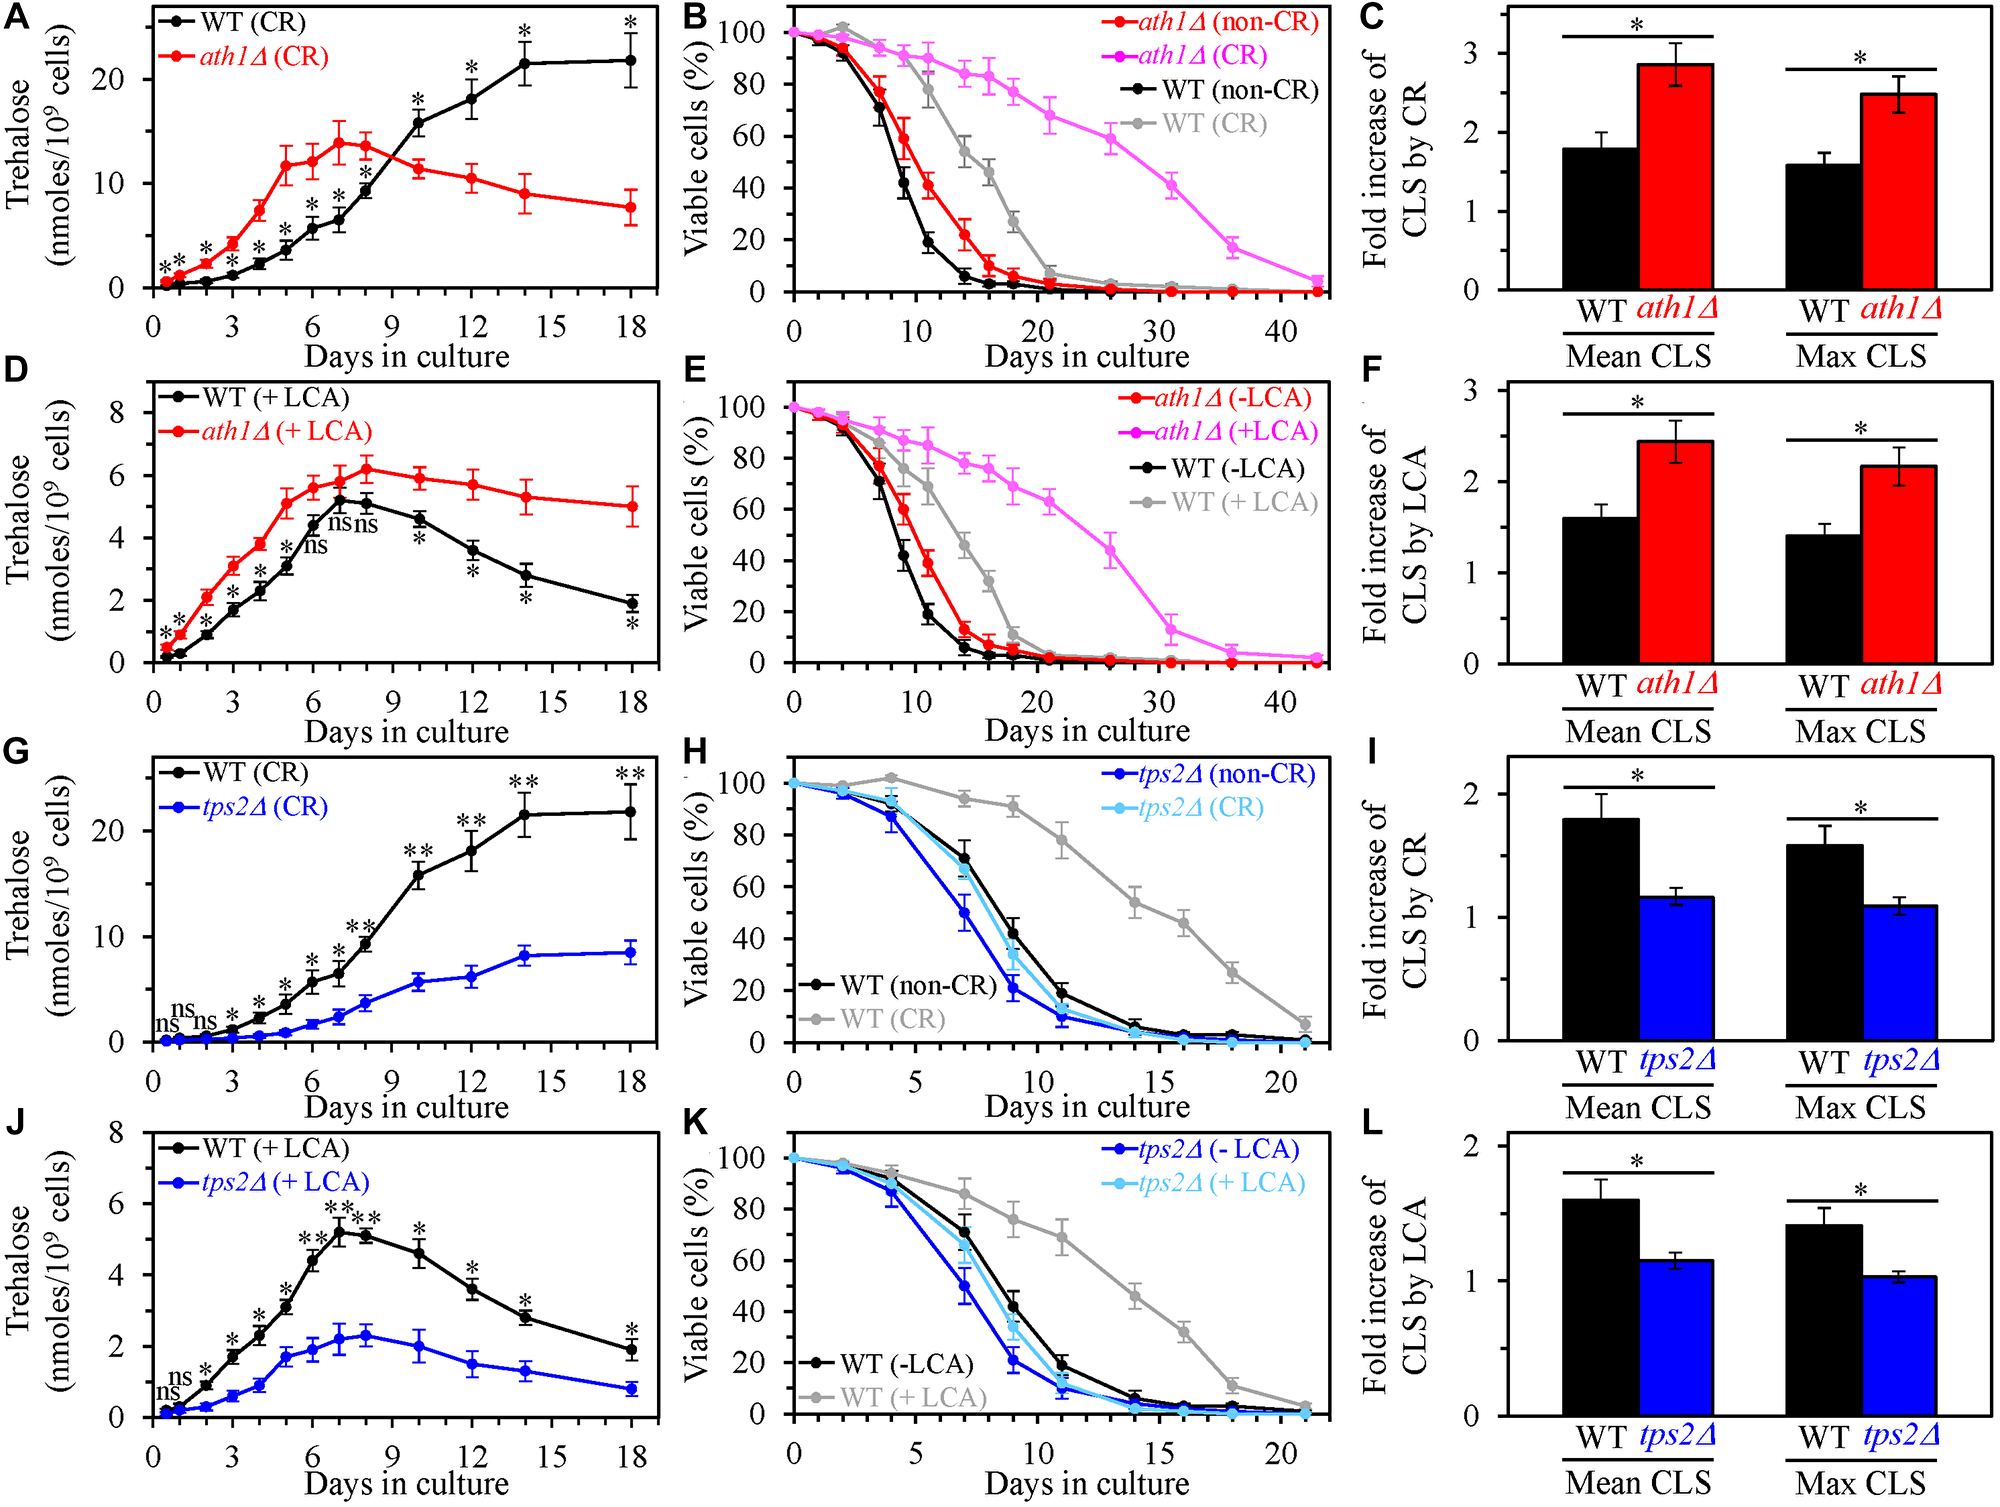
Figure 10: The single-gene deletion mutations that increase or decrease the intracellular concentration of trehalose alter the extent to which caloric restriction (CR) and lithocholic acid (LCA) prolong yeast chronological lifespan (CLS). Wild-type (WT), ath1Δ and tps2Δ cells were cultured in the nutrient-rich YP medium initially containing 0.2% glucose (CR conditions) or 2% glucose (non-CR conditions) with or without LCA. (A–C) The concentrations of trehalose in chronologically aging WT and ath1Δ cell cultures grown under CR conditions (A), survival curves of WT and ath1Δ cells cultured under CR or non-CR conditions (B), and the extent to which CR increases the mean and maximum CLS of WT and ath1Δ strains (C) are shown. (D–F) The concentrations of trehalose in chronologically aging WT and ath1Δ cell cultures grown under non-CR conditions with LCA (D), survival curves of WT and ath1Δ cells cultured under non-CR conditions with or without LCA (E), and the extent to which LCA under non-CR conditions increases the mean and maximum CLS of WT and ath1Δ strains (F) are shown. (G–I) The concentrations of trehalose in chronologically aging WT and tps2Δ cell cultures grown under CR conditions (G), survival curves of WT and tps2Δ cells cultured under CR or non-CR conditions (H), and the extent to which CR increases the mean and maximum CLS of WT and tps2Δ strains (I) are shown. (J–L) The concentrations of trehalose in chronologically aging WT and tps2Δ cell cultures grown under non-CR conditions with LCA (J), survival curves of WT and tps2Δ cells cultured under CR conditions without LCA or under non-CR conditions with LCA (K), and the extent to which LCA under non-CR conditions increases the mean and maximum CLS of WT and glc3Δ strains (L) are shown. Data are presented as means ± SEM (n = 3; *p < 0.05; **p < 0.01; ns, not significant; the p values for comparing the means of two in groups were calculated using an unpaired two-tailed t test as described in Materials and Methods).
We then examined the effects of the ath1Δ mutation on the efficiencies of processes 1, 2, 3 and 4, all of which converge into the mechanism potentially linking cellular aging to cellular quiescence (Figure 1). We found that ath1Δ does not affect process 1 but significantly affects three other processes. Findings that support our conclusion are described below.
First, the high-density Q cells limited in calorie supply and cultured in the absence of LCA were as small in the ath1Δ mutant strain as they were in the WT strain cultured under the same conditions (Figure 11A). Thus, the ath1Δ-dependent changes in trehalose concentrations do not affect the ability of CR to initiate the formation of small high-density Q cells (process 1) by arresting the cell cycle and eliciting entry into quiescence in early G1. The ath1Δ mutation also did not alter the size of the high-density Q cells cultured under non-CR conditions with LCA; these cells in the mutant strain remained as large as they were in the WT strain under the same culturing conditions (Figure 11B). Hence, the ath1Δ-driven rise in trehalose concentration does not influence the ability of LCA to arrest the cell cycle in late G1, instigate quiescence entry and cause the formation of large high-density Q cells under non-CR conditions (process 1).
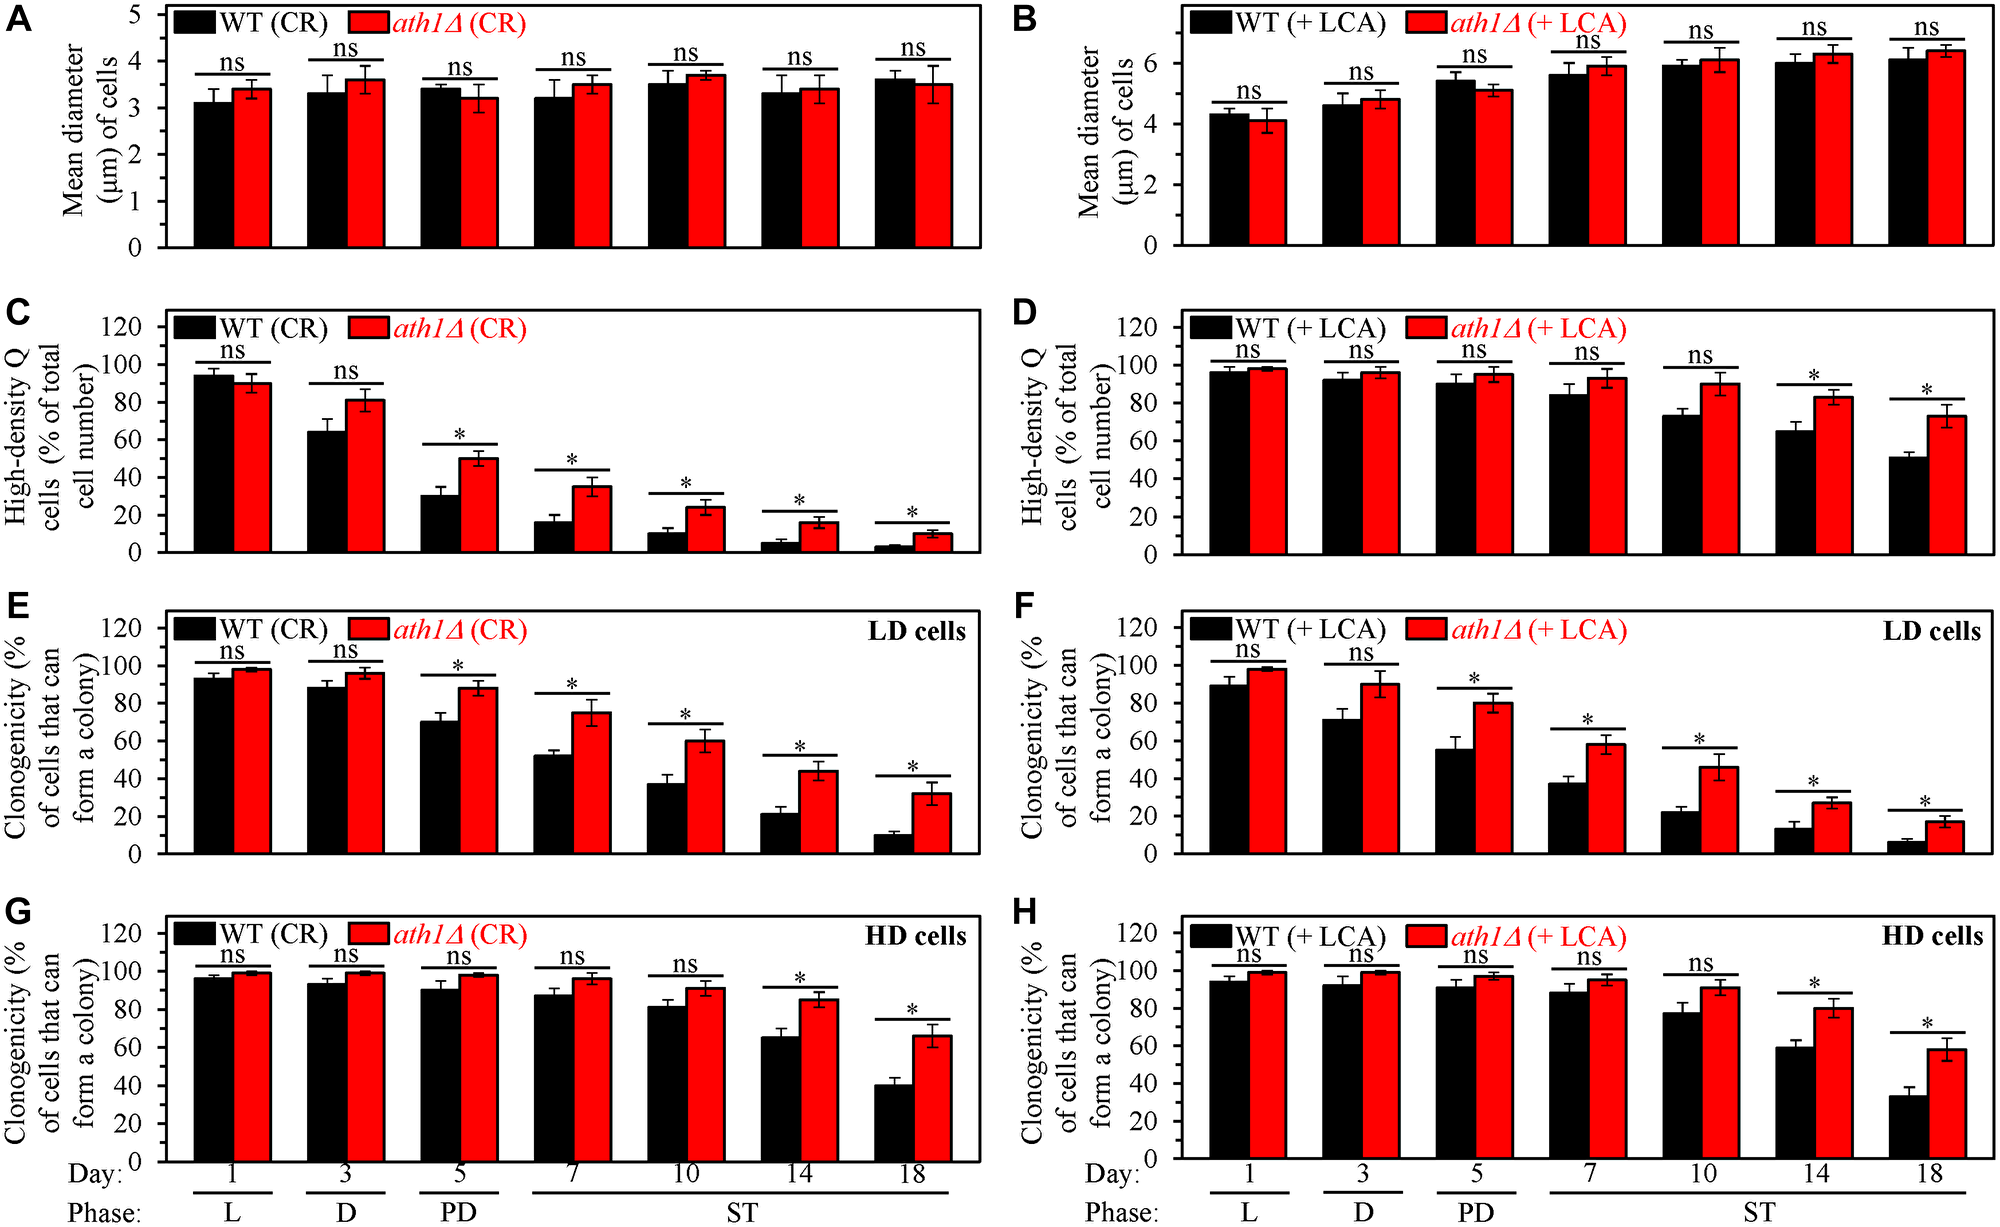
Figure 11: The ath1Δ-dependent changes in trehalose concentration do not affect process 1 but exhibit significant effects on processes 2, 3 and 4 both in yeast cultured under caloric restriction (CR) conditions without LCA and in yeast cultured under non-CR conditions with lithocholic acid (LCA). Processes 1, 2, 3 and 4 converge into the mechanism that could link cellular aging to cellular quiescence. Wild-type (WT) and ath1Δ cells were cultured in the nutrient-rich YP medium initially containing 0.2% glucose (CR conditions) or 2% glucose (non-CR conditions) with LCA. Aliquots of differently aged cell populations were recovered from the logarithmic (L), diauxic (D), post-diauxic (PD) or stationary (ST) growth phase. High-density quiescent (Q) cells and low-density Q cells were purified from these cell populations with the help of the centrifugation in Percoll density gradient, as described in Materials and Methods. (A and B) Mean diameters of high-density Q cells recovered from different growth phases are shown for yeast cultured under CR conditions without LCA (A) and yeast cultured under non-CR conditions with LCA (B). Mean diameters of high-density Q cells in A and B were measured using differential interference contrast microscopy and subsequent morphometric analysis, as described in Materials and Methods. (C and D) The values of the percentage of high-density Q cells in each of the differently aged cell populations are shown for yeast cultured under CR conditions without LCA (C) and yeast cultured under non-CR conditions with LCA (D). The percentage of high-density Q cells in C and D was measured with the help of a cell counter, as described in Materials and Methods. (E–H) The clonogenicities of low-density (E, F) and high-density (G, H) cells in each of the differently aged cell populations are shown for yeast cultured under CR conditions without LCA (E, G) and yeast cultured under non-CR conditions with LCA (F, H). The clonogenicities of low- and high-density cells were assessed using a plating assay for reproductive (colony forming) capability, as described in Materials and Methods. Other Abbreviations: HD: high-density cells; LD: low-density cells.
Second, ath1Δ slowed down the fast, age-related transition from high-density Q cells to low-density Q cells (process 2) under CR conditions without LCA (Figure 11C). This mutation also decelerated the slow, age-related conversion of high-density Q cells into low-density Q cells (process 2) under non-CR conditions with LCA (Figure 11D). Based on these findings, we concluded that the ath1Δ-dependent changes in trehalose concentration contribute to both the acceleration of process 2 by CR and the deceleration of this process by LCA under non-CR conditions.
Third, ath1Δ decelerated the fast, aging-associated decline in the clonogenicity of low-density Q cells (process 3) both under CR conditions in the absence of LCA (Figure 11E) and under non-CR conditions in the presence of LCA (Figure 11F). Moreover, ath1Δ delayed the slow, aging-associated deterioration in the clonogenicity of high-density Q cells (process 4) under both these conditions of cell culturing (Figure 11G and 11H, respectively). Therefore, we concluded that the ath1Δ-driven changes in trehalose concentration play essential roles in the abilities of CR and LCA to slow down an age-related decline in cellular quiescence during processes 3 and 4.
We then assessed the effects of the single-gene deletion mutation tps2Δ on the extent of aging delay by CR and LCA and processes 1, 2, 3 and 4. This mutation impairs intracellular trehalose synthesis by eliminating a phosphatase subunit of the trehalose-6-phosphate synthase/phosphatase complex [130, 137]. tps2Δ is known to decrease trehalose concentration in S. cerevisiae cells cultured under non-CR conditions [137]. We found that tps2Δ also elicits a decline in trehalose concentration throughout the entire CLS in yeast cultured under CR conditions without LCA (Figure 10G) or under non-CR conditions with LCA (Figure 10J). Our investigation of the effects of the tps2Δ mutation on longevity revealed that it shortens yeast CLS under CR conditions without LCA (Figure 10H) and significantly lowers the efficiency of CLS extension by CR (Figure 10H and 10I). We also found that tps2Δ reduces yeast CLS under non-CR conditions with LCA (Figure 10K) and substantially decreases the extent to which LCA postpones yeast CLS under these conditions (Figure 10K and 10L). Hence, the tps2Δ-dependent decline in trehalose concentration through the entire CLS lowers the efficiencies of yeast CLS extension both by CR and LCA (under non-CR conditions).
Our findings also show that the tps2Δ mutation does not influence process 1. However, it affects processes 2, 3 and 4, all of which are integrated into the mechanism linking cellular aging to cellular quiescence (Figure 1). These conclusions are based on the observations described below.
First, we found that the tps2Δ-dependent decline in intracellular trehalose does not affect the abilities of CR and LCA (under non-CR conditions) to regulate process 1. This process leads to cell-cycle arrest, thus initiating quiescence entry and eliciting the formation of high-density Q cells (Figure 1). Indeed, we found that tps2Δ does not influence the ability of CR to arrest the cell cycle in early G1, which is known to promote the development of small high-density Q cells (Figure 12A). Moreover, we also revealed that tps2Δ does not affect the ability of LCA to arrest the cell cycle in late G1, which is known to cause the formation of large high-density Q cells under non-CR conditions (Figure 12B).
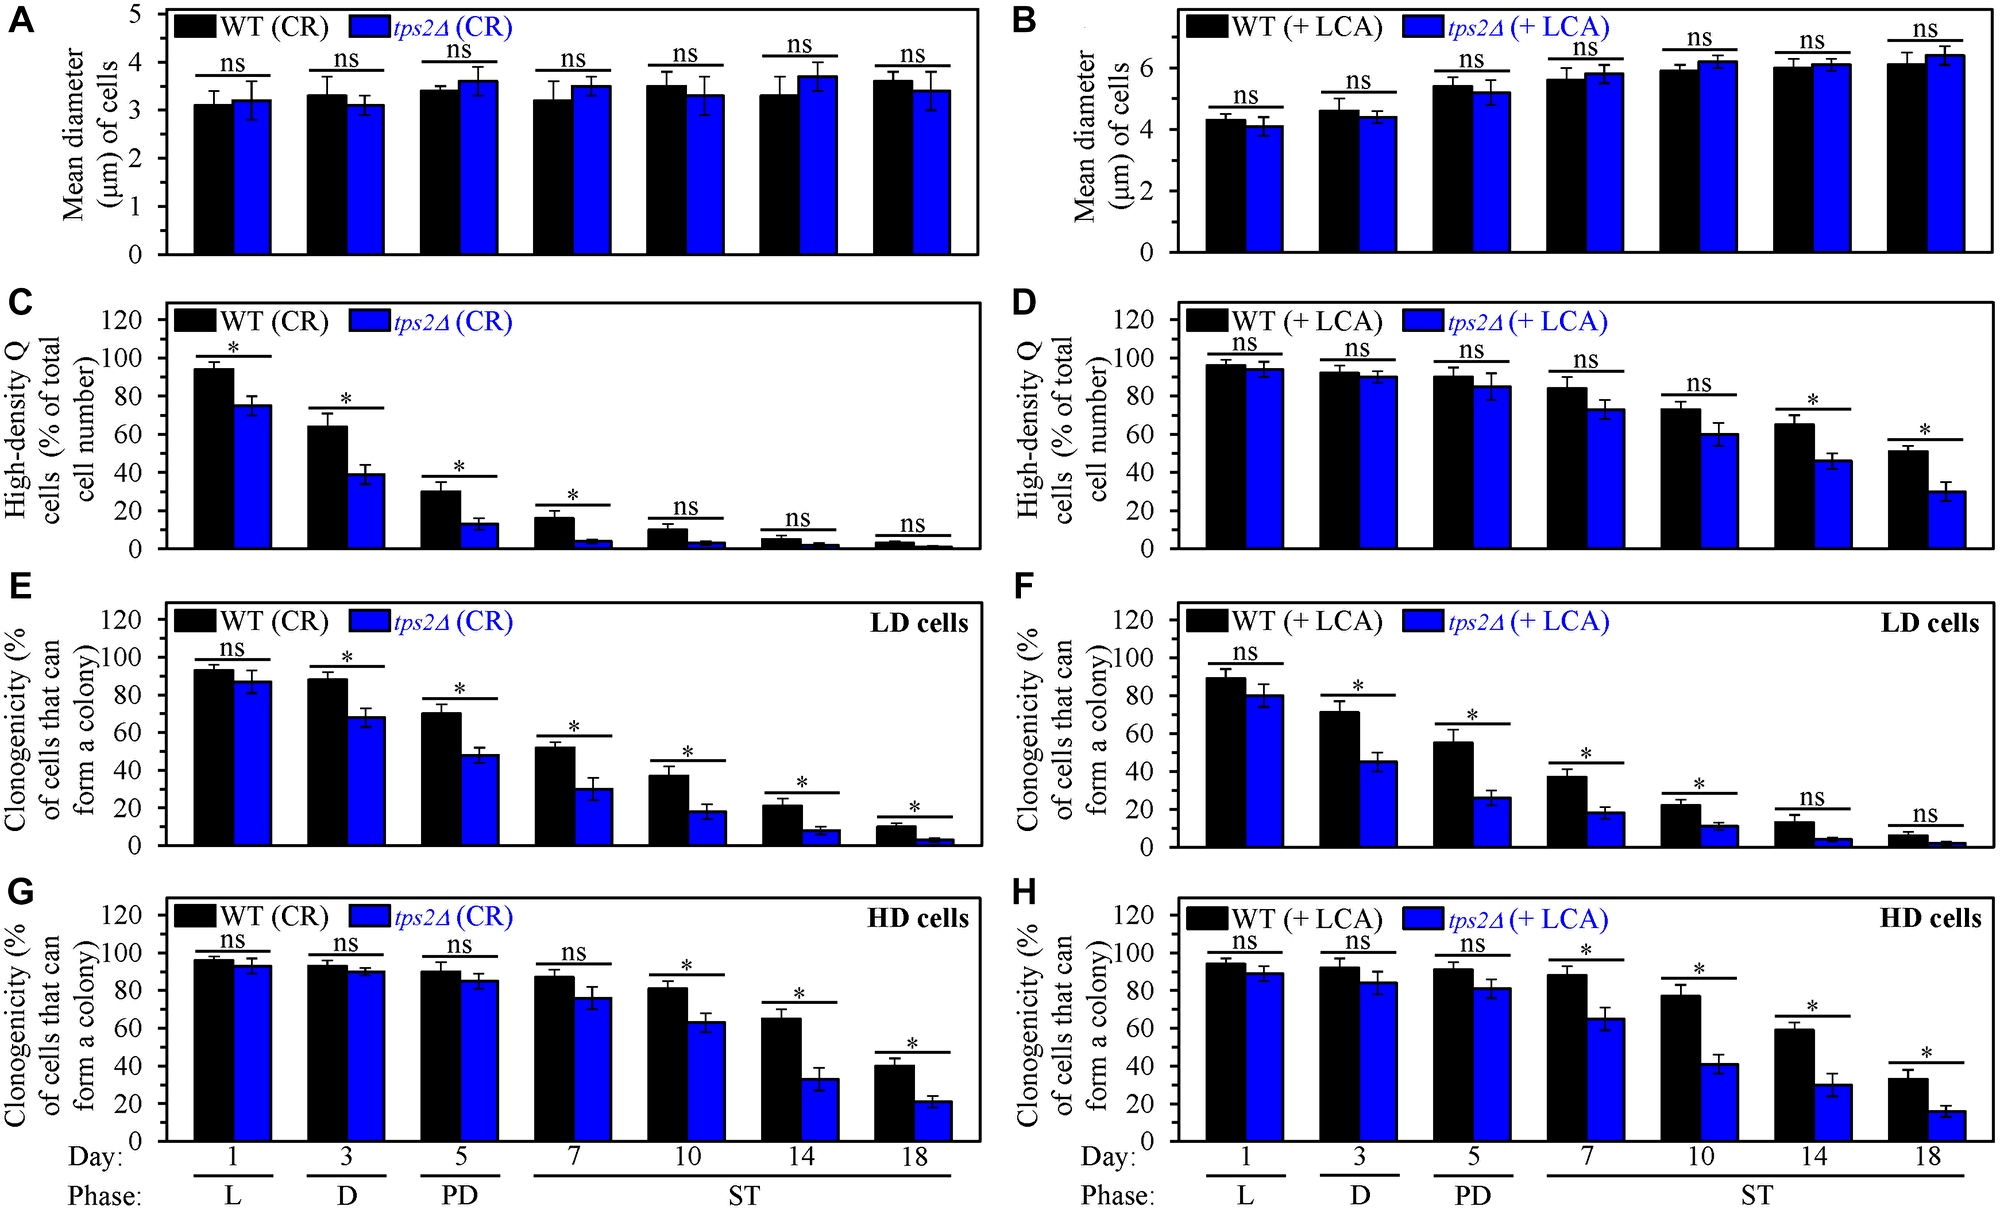
Figure 12: The tps2Δ-driven decline in trehalose concentration does not affect process 1 but exhibits significant effects on processes 2, 3 and 4 both in yeast cultured under caloric restriction (CR) conditions without LCA and in yeast cultured under non-CR conditions with lithocholic acid (LCA). Processes 1, 2, 3 and 4 converge into the mechanism that could link cellular aging to cellular quiescence. Wild-type (WT) and tps2Δ cells were cultured in the nutrient-rich YP medium initially containing 0.2% glucose (CR conditions) or 2% glucose (non-CR conditions) with LCA. Aliquots of differently aged cell populations were recovered from the logarithmic (L), diauxic (D), post-diauxic (PD) or stationary (ST) growth phase. High-density quiescent (Q) cells and low-density Q cells were purified from these cell populations with the help of the centrifugation in Percoll density gradient, as described in Materials and Methods. (A and B) Mean diameters of high-density Q cells recovered from different growth phases are shown for yeast cultured under CR conditions without LCA (A) and yeast cultured under non-CR conditions with LCA (B). Mean diameters of high-density Q cells in A and B were measured using differential interference contrast microscopy and subsequent morphometric analysis, as described in Materials and Methods. (C and D) The values of the percentage of high-density Q cells in each of the differently aged cell populations are shown for yeast cultured under CR conditions without LCA (C) and yeast cultured under non-CR conditions with LCA (D). The percentage of high-density Q cells in C and D was measured with the help of a cell counter, as described in Materials and Methods. (E–H) The clonogenicities of low-density (E, F) and high-density (G, H) cells in each of the differently aged cell populations are shown for yeast cultured under CR conditions without LCA (E, G) and yeast cultured under non-CR conditions with LCA (F, H). The clonogenicities of low- and high-density cells were assessed using a plating assay for reproductive (colony forming) capability, as described in Materials and Methods. Other Abbreviations: HD: high-density cells; LD: low-density cells.
Second, we found that tps2Δ accelerates both the fast, age-related conversion of high-density Q cells into low-density Q cells (process 2) under CR conditions without LCA (Figure 12C) and the slow, age-related transition from high-density Q cells to low-density Q cells (process 2) under non-CR conditions with LCA (Figure 12D). Hence, the tps2Δ-dependent decline in trehalose concentration affects both the acceleration of process 2 by CR and the deceleration of this process by LCA under non-CR conditions.
Third, we found that tps2Δ speeds up both the fast, aging-associated deterioration in the clonogenicity of low-density Q cells (process 3) and the slow, aging-associated decline in the clonogenicity of high-density Q cells (process 4). These effects of the tps2Δ mutation on processes 3 and 4 were observed both under CR conditions in the absence of LCA (Figure 12E and 12G, respectively) and under non-CR conditions in the presence of LCA (Figure 12F and 12H, respectively). Thus, the tps2Δ-driven deterioration in trehalose concentration impairs the abilities of CR and LCA to decelerate an age-related decline in cellular quiescence during processes 3 and 4.
In sum, the data presented in this section show that a rise in intracellular trehalose, which is a metabolic hallmark of Q cells, contributes to the extension of yeast CLS by CR and LCA. Besides, these data indicate that such a rise in trehalose within Q cells plays essential roles in processes 2, 3 and 4, all of which converge into the mechanism potentially linking cellular aging to cellular quiescence.
DISCUSSION
This study and our previously published data [109] provide conclusive evidence for the existence of a mechanism that links cellular aging to cellular quiescence in chronologically aging S. cerevisiae. The mechanism integrates processes 1, 2, 3 and 4 discussed above in the text and schematically depicted in Figures 1 and 6. Two lines of evidence that support our conclusion about the existence of this mechanism are discussed below.
The first line of evidence comes from our observation that all four aging-delaying interventions we tested affect the four processes converged into the mechanism linking cellular aging to cellular quiescence. These geroprotective interventions include CR, LCA and the tor1Δ and ras2Δ mutations. As discussed above in the text, there are two different ways of delaying yeast chronological aging by geroprotectors affecting processes 1, 2, 3 and 4. CR and the ras2Δ mutation decelerate yeast chronological aging because they both stimulate the development of high-density Q cells (process 1) by arresting the cell cycle in early G1, promote an age-related conversion of high-density Q cells into low-density Q cells (process 2), delay a fast aging-associated deterioration in the quiescence of low-density Q cells (process 3) and postpone a slow aging-associated decline in the quiescence of high-density Q cells (process 4) (Figure 6). Yet, LCA and the tor1Δ mutation delay yeast chronological aging because they both promote the development of high-density Q cells (process 1) by arresting the cell cycle in late G1, postpone an age-related conversion of high-density Q cells into low-density Q cells (process 2), slow down a fast aging-associated deterioration in the quiescence of low-density Q cells (process 3) and delay a slow aging-associated decline in the quiescence of high-density Q cells (process 4) (Figure 6).
Therefore, all four geroprotectors tested in this study exhibit a common ability to postpone processes 3 and 4 of the fast and slow quiescence deterioration for low- and high-density Q cells, respectively (Figure 6). Such a common ability of diverse geroprotectors provides strong support for the existence of a mechanism that links cellular aging to cellular quiescence in chronologically aging budding yeast. Indeed, this ability might contribute to the geroprotector-driven delay of yeast chronological aging because it allows Q cells to maintain a pro-longevity cellular pattern longer than Q cells in untreated yeast cultures. This pro-longevity cellular pattern of Q cells includes an enhanced reproductive competence, an increase in glycogen and trehalose concentrations, a decrease in the concentrations of TAG, a rise in CL concentrations, a decline in the concentrations of ROS, an improvement of mitochondrial functionality, lowered oxidative damage to macromolecules, a rise in cell resistance to long-term thermal and oxidative stresses, and a deterioration in cell susceptibility to apoptotic and liponecrotic forms of regulated cell death (Figure 1A and 1B) [109].
A challenge for the future is to investigate and understand how important the abilities of diverse geroprotectors affect processes 1 and 2 for their ability to postpone yeast chronological aging. One possibility is that the different ways through which diverse geroprotectors regulate processes 1 and 2 do not contribute to the aging-delaying capabilities of these geroprotectors. An alternative possibility is that there are two different ways of employing geroprotector-dependent changes in processes 1 and 2 to decelerate yeast chronological aging.
The second line of evidence for the existence of a mechanism linking cellular aging to cellular quiescence comes from our observation that an increase in intracellular trehalose within Q cells is an essential contributor to both chronological aging and quiescence maintenance in S. cerevisiae. We have previously demonstrated that such an increase in trehalose is a metabolic trait characteristic of Q cells in budding yeast [109]. In this study, we found that mutations altering trehalose concentration affect the extent of yeast CLS extension by CR or LCA and the efficiencies of processes 2, 3 and 4 in yeast exposed to any of these two geroprotectors. Future studies will need to examine what other hallmarks of Q cells (Figure 1A and 1B) play essential roles in yeast chronological aging and yeast quiescence maintenance.
In conclusion, because the mechanisms of cellular aging and cellular quiescence are evolutionarily conserved [1, 3, 62, 66], this study makes an important next step toward the understanding of how the knowledge-based targeting of cellular quiescence can be used for slowing down cellular and organismal aging and for delaying the onset of aging-associated diseases.
Materials and Methods
Yeast strains, media and growth conditions
The wild-type strain Saccharomyces cerevisiae BY4742 (MATα his3Δ1 leu2Δ0 lys2Δ0 ura3Δ0) and single-gene-deletion mutant strains in the BY4742 genetic background (all from Thermo Scientific/Open Biosystems) were grown in YP medium (1% yeast extract, 2% peptone, both from Fisher Scientific; #BP1422-2 and #BP1420-2, respectively) initially containing 0.2% or 2% glucose (#D16-10; Fisher Scientific) as carbon source, with or without 50 μM lithocholic acid. Cells were cultured at 30°C with rotational shaking at 200 rpm in Erlenmeyer flasks at a “flask volume/medium volume” ratio of 5:1.
Separation of quiescent and non-quiescent cells by centrifugation in Percoll density gradient
1 ml of 1.5 M NaCl (#S7653; Sigma-Aldrich) was placed into a 50-ml conical polypropylene centrifuge tube (#055398; Fisher Scientific), and 8 ml of the Percoll solution (#P1644; Sigma-Aldrich) was added to this tube. The NaCl and Percoll solutions were then mixed by pipetting. 4 ml of the NaCl/Percoll mixture was placed into each of the two polyallomer tubes for an MLS-50 rotor for an Optima MAX ultracentrifuge (all from Beckman Coulter, Inc.). The tubes were centrifuged at 25,000 × g (16,000 rpm) for 15 min at 4°C in an Optima MAX ultracentrifuge. A sample of yeast cells was taken from a culture at a certain time point. A sample fraction was diluted to determine the total number of cells per ml of culture using a hemacytometer (#0267110; Fisher Scientific). For each Percoll density gradient, 1 × 10⁹ yeast cells were placed into a 15-ml conical polypropylene centrifuge tube (#0553912; Fisher Scientific) and then pelleted by centrifugation at 5,000 rpm for 7 min at room temperature in an IEC Centra CL2 clinical centrifuge (Thermo Electron Corporation). Pelleted cells were resuspended in 500 μl of 50 mM Tris/HCl buffer (pH 7.5), overlaid onto the preformed Percoll gradient and centrifuged at 2,300 × g (5,000 rpm) for 30 min at 25°C in an Optima MAX ultracentrifuge. The upper and lower fractions of cells were collected with a pipette, Percoll was removed by washing cells twice with 50 mM Tris/HCl buffer (pH 7.5) and cells were resuspended in 50 mM Tris/HCl buffer (pH 7.5) for subsequent assays.
Reproductive (colony-forming) capability assay for quiescent and non-quiescent cells separated by centrifugation in Percoll density gradient
An aliquot of the upper or lower fraction of cells recovered from the Percoll gradient and washed twice with 50 mM Tris/HCl buffer (pH 7.5) was diluted to determine the total number of cells per fraction using a hemacytometer (#0267110; Fisher Scientific). Serial dilutions (1:102 to 1:105) of cells were also plated onto YEPD (1% yeast extract, 2% peptone, 2% glucose) plates in duplicate to count the number of viable cells per ml of each cell fraction. 100 μl of diluted culture was plated onto each plate. After 48-h incubation at 30°C, the number of colonies per plate was counted. The number of colony-forming units (CFU) equals the number of reproductively capable cells in a sample. Therefore, the number of reproductively capable cells was calculated as follows: the number of CFU × dilution factor × 10 = the number of reproductively capable cells per ml. For each cell fraction assayed, the % reproductive capability of the cells was calculated as follows: number of CFU per ml/total number of cells per ml × 100%.
Synchronous reentry into mitosis assay for quiescent and non-quiescent cells separated by centrifugation in Percoll density gradient
5 × 10⁶ cells recovered in the upper or lower fraction of the Percoll gradient and washed twice with 50 mM Tris/ HCl buffer (pH 7.5) were harvested by centrifugation for 1 min at 21,000 × g at room temperature. Pelleted cells were washed twice with water and then inoculated into 50 ml of YP medium (1% yeast extract, 2% peptone; both from Fisher Scientific; #BP1422-2 and #BP1420- 2, respectively) initially containing 0.2% or 2% glucose (#D16-10; Fisher Scientific) as carbon source. Cells were cultured for 4 h at 30°C with rotational shaking at 200 rpm in Erlenmeyer flasks at a “flask volume/medium volume” ratio of 5:1. A sample of cells was taken from a culture at a certain time-point and examined microscopically for the percentage of cells with new buds. At least 500 cells were examined per time point, and the budding percentage was calculated as follows: (number of cells with new buds per ml/total number of cells per ml) × 100%.
Chronological lifespan measurement
A sample of cells was taken from a culture at a certain time point. A sample fraction was diluted to determine the total number of cells using a hemacytometer (#0267110; Fisher Scientific). Another fraction of the cell sample was diluted, and serial dilutions of cells were plated in duplicate onto YP plates containing 2% glucose as a carbon source. After 2 days of incubation at 30°C, the number of CFU per plate was counted. The number of CFU was defined as the number of viable cells in a sample. For each culture, the percentage of viable cells was calculated as follows: (number of viable cells per ml/total number of cells per ml) × 100. The percentage of viable cells in the mid-logarithmic phase was set at 100%.
Measurement of glycogen and trehalose concentrations
2 × 10⁹ cells were harvested by centrifugation for 1 min at 16,000 × g at 4°C. The cell pellet was washed three times in ice-cold PBS (20 mM KH2PO4/KOH (pH 7.5) and 150 mM NaCl) and then resuspended in 200 μl of ice-cold SHE solution (50 mM NaOH and 1 mM EDTA [#E9884; Sigma-Aldrich]). 800 μl of ice-cold SHE solution were added to the cell suspension. The resulting alkali extract was incubated at 60°C for 30 min to destroy endogenous enzyme activities and pyridine nucleotides. The extract was neutralized by adding 500 μl of THA solution (100 mM Tris/HCl (pH 8.1) and 50 mM HCl). The extract was then divided into 150 μl aliquots, quickly frozen in liquid nitrogen and stored at –80°C before use.
To measure glycogen concentration, 50 μl of alkali extract were added to 500 μl of glycogen reagent (50 mM sodium acetate (pH 4.6) and 0.02% bovine serum albumin (BSA) [#A9418; Sigma-Aldrich] with and without of 10 μg/ml amyloglucosidase 6 U/mg [#11202367001; Sigma-Aldrich]). The mixture was incubated for 30 min at 25°C. 500 μl of glucose reagent (100 mM Tris/HCl (pH 8.1), 2 mM MgCl2, 1 mM 1,4-Dithiothreitol (DTT) [#D9163; Sigma-Aldrich], 1 mM ATP [#A7699; Sigma-Aldrich], 0.2 mM NADP+ [#10128040001; Sigma-Aldrich], and mixture of hexokinase (7 U; [11426362001; Sigma-Aldrich]) and glucose-6-phosphate dehydrogenase (8 U; [#G6378; Sigma-Aldrich]) were added, and the mixture was incubated for 30 min at 25°C. The NADPH generated from NADP+ was measured fluorimetrically (excitation at 365 nm, emission monitored at 460 nm).
To measure trehalose concentration, 50 μl of alkali extract were added to 150 μl of trehalose reagent (25 mM KH2PO4/KOH (pH 7.5) and 0.02% BSA [#A9418; Sigma-Aldrich] with or without 15 mU trehalase [#T8778; Sigma-Aldrich]). The mixture was incubated for 60 min at 37°C. 800 μl of glucose reagent (100 mM Tris/HCl (pH 8.1), 2 mM MgCl2, 1 mM DTT [#D9163; Sigma-Aldrich], 1 mM ATP [#A7699; Sigma-Aldrich], 0.2 mM NADP+ [#10128040001; Sigma-Aldrich], and mixture of hexokinase (7 U; [11426362001; Sigma-Aldrich]) and glucose-6-phosphate dehydrogenase (8 U) [#G6378; Sigma-Aldrich]) were added, and the mixture was incubated for 30 min at 25°C. The NADPH generated from NADP+ was measured fluorimetrically (excitation at 365 nm, emission monitored at 460 nm).
Statistical analysis
Statistical analysis was performed using Microsoft Excel’s (2010) Analysis ToolPak - VBA. All data are presented as mean ± SEM. The p values for comparing the means of two groups using an unpaired two-tailed t test were calculated with the help of the GraphPad Prism 7 statistics software.
Abbreviations
BSA: bovine serum albumin; CFU: colony-forming units; CL: cardiolipin; CLS: chronological lifespan; CR: caloric restriction; D: diauxic growth phase; DIC: differential interference contrast; DTT: 1,4-Dithiothreitol; HD: high-density cells; L: logarithmic growth phase; LCA: lithocholic acid; LD: low-density cells; NQ: non-quiescent cells; PD: post-diauxic growth phase; Q: quiescent cells; RCD: regulated cell death; ROS: reactive oxygen species; ST: stationary growth phase; TAG: triacylglycerols; YP: 1% yeast extract + 2% peptone; WT: wild-type strain; ΔΨm: mitochondrial membrane potential.
ACKNOWLEDGMENTS
We are grateful to current and former members of the Titorenko laboratory for discussions. We acknowledge the Centre for Structural and Functional Genomics and the Centre for Microscopy and Cellular Imaging (both at Concordia University) for outstanding services.
CONFLICTS OF INTEREST
The authors have no conflict of interests to declare.
FUNDING
This study was supported by grants from the Richard and Edith Strauss Foundation and the Natural Sciences and Engineering Research Council (NSERC) of Canada (RGPIN 2014-04482). A.L. was supported by the NSERC Postgraduate Doctoral Scholarship Award, A.P. by the Canadian Institutes of Health Research (CIHR) Frederick Banting and Charles Best Canada Master’s Scholarship Award, A.A-C. by the NSERC Postgraduate Doctoral Scholarship Award, J.A.B.J. by the Concordia University Merit Award, E.O. by the Concordia University Merit Award, and K.M. by the Concordia University Armand C. Archambault Fellowship and the Concordia University Dean of Arts and Sciences Award of Excellence.
References
1. De Virgilio C. The essence of yeast quiescence. FEMS Microbiol Rev. 2012; 36:306–39. https://doi.org/10.1111/j.1574-6976.2011.00287.x. [PubMed].
2. Cheung TH, Rando TA. Molecular regulation of stem cell quiescence. Nat Rev Mol Cell Biol. 2013; 14:329–40. https://doi.org/10.1038/nrm3591. [PubMed].
3. Dhawan J, Laxman S. Decoding the stem cell quiescence cycle--lessons from yeast for regenerative biology. J Cell Sci. 2015; 128:4467–74. https://doi.org/10.1242/jcs.177758. [PubMed].
4. Rumman M, Dhawan J, Kassem M. Concise Review: Quiescence in Adult Stem Cells: Biological Significance and Relevance to Tissue Regeneration. Stem Cells. 2015; 33:2903–12. https://doi.org/10.1002/stem.2056. [PubMed].
5. Miles S, Breeden L. A common strategy for initiating the transition from proliferation to quiescence. Curr Genet. 2017; 63:179–86. https://doi.org/10.1007/s00294-016-0640-0. [PubMed].
6. Cho IJ, Lui PP, Obajdin J, Riccio F, Stroukov W, Willis TL, Spagnoli F, Watt FM. Mechanisms, Hallmarks, and Implications of Stem Cell Quiescence. Stem Cell Reports. 2019; 12:1190–200. https://doi.org/10.1016/j.stemcr.2019.05.012. [PubMed].
7. Mohammad K, Dakik P, Medkour Y, Mitrofanova D, Titorenko VI. Quiescence Entry, Maintenance, and Exit in Adult Stem Cells. Int J Mol Sci. 2019; 20:2158. https://doi.org/10.3390/ijms20092158. [PubMed].
8. Sagot I, Laporte D. The cell biology of quiescent yeast - a diversity of individual scenarios. J Cell Sci. 2019; 132:jcs213025. https://doi.org/10.1242/jcs.213025. [PubMed].
9. Tümpel S, Rudolph KL. Quiescence: Good and Bad of Stem Cell Aging. Trends Cell Biol. 2019; 29:672–85. https://doi.org/10.1016/j.tcb.2019.05.002. [PubMed].
10. van Velthoven CTJ, Rando TA. Stem Cell Quiescence: Dynamism, Restraint, and Cellular Idling. Cell Stem Cell. 2019; 24:213–25. https://doi.org/10.1016/j.stem.2019.01.001. [PubMed].
11. Ahlqvist KJ, Suomalainen A, Hämäläinen RH. Stem cells, mitochondria and aging. Biochim Biophys Acta. 2015; 1847:1380–86. https://doi.org/10.1016/j.bbabio.2015.05.014. [PubMed].
12. Ito K, Ito K. Metabolism and the Control of Cell Fate Decisions and Stem Cell Renewal. Annu Rev Cell Dev Biol. 2016; 32:399–409. https://doi.org/10.1146/annurev-cellbio-111315-125134. [PubMed].
13. García-Prat L, Sousa-Victor P, Muñoz-Cánoves P. Proteostatic and Metabolic Control of Stemness. Cell Stem Cell. 2017; 20:593–608. https://doi.org/10.1016/j.stem.2017.04.011. [PubMed].
14. Macedo JC, Vaz S, Logarinho E. Mitotic Dysfunction Associated with Aging Hallmarks. Adv Exp Med Biol. 2017; 1002:153–88. https://doi.org/10.1007/978-3-319-57127-0_7. [PubMed].
15. Boya P, Codogno P, Rodriguez-Muela N. Autophagy in stem cells: repair, remodelling and metabolic reprogramming. Development. 2018; 145:dev146506. https://doi.org/10.1242/dev.146506. [PubMed].
16. Ito K, Ito K. Hematopoietic stem cell fate through metabolic control. Exp Hematol. 2018; 64:1–11. https://doi.org/10.1016/j.exphem.2018.05.005. [PubMed].
17. Andréasson C, Ott M, Büttner S. Mitochondria orchestrate proteostatic and metabolic stress responses. EMBO Rep. 2019; 20:e47865. https://doi.org/10.15252/embr.201947865. [PubMed].
18. Fu W, Liu Y, Yin H. Mitochondrial Dynamics: Biogenesis, Fission, Fusion, and Mitophagy in the Regulation of Stem Cell Behaviors. Stem Cells Int. 2019; 2019:9757201. https://doi.org/10.1155/2019/9757201. [PubMed].
19. Eridani S, Sgaramella V, Cova L. Stem cells: From embryology to cellular therapy? An appraisal of the present state of art. Cytotechnology. 2004; 44:125–41. https://doi.org/10.1007/s10616-004-2067-6. [PubMed].
20. Inaba M, Yamashita YM. Asymmetric stem cell division: precision for robustness. Cell Stem Cell. 2012; 11:461–69. https://doi.org/10.1016/j.stem.2012.09.003. [PubMed].
21. Mihaylova MM, Sabatini DM, Yilmaz ÖH. Dietary and metabolic control of stem cell function in physiology and cancer. Cell Stem Cell. 2014; 14:292–305. https://doi.org/10.1016/j.stem.2014.02.008. [PubMed].
22. Pillitteri LJ, Guo X, Dong J. Asymmetric cell division in plants: mechanisms of symmetry breaking and cell fate determination. Cell Mol Life Sci. 2016; 73:4213–29. https://doi.org/10.1007/s00018-016-2290-2. [PubMed].
23. Santoro A, Vlachou T, Carminati M, Pelicci PG, Mapelli M. Molecular mechanisms of asymmetric divisions in mammary stem cells. EMBO Rep. 2016; 17:1700–20. https://doi.org/10.15252/embr.201643021. [PubMed].
24. Shao W, Dong J. Polarity in plant asymmetric cell division: Division orientation and cell fate differentiation. Dev Biol. 2016; 419:121–31. https://doi.org/10.1016/j.ydbio.2016.07.020. [PubMed].
25. Daynac M, Petritsch CK. Regulation of Asymmetric Cell Division in Mammalian Neural Stem and Cancer Precursor Cells. Results Probl Cell Differ. 2017; 61:375–99. https://doi.org/10.1007/978-3-319-53150-2_17. [PubMed].
26. Gallaud E, Pham T, Cabernard C. Drosophila melanogaster Neuroblasts: A Model for Asymmetric Stem Cell Divisions. Results Probl Cell Differ. 2017; 61:183–210. https://doi.org/10.1007/978-3-319-53150-2_8. [PubMed].
27. Moore DL, Jessberger S. Creating Age Asymmetry: Consequences of Inheriting Damaged Goods in Mammalian Cells. Trends Cell Biol. 2017; 27:82–92. https://doi.org/10.1016/j.tcb.2016.09.007. [PubMed].
28. Venkei ZG, Yamashita YM. Emerging mechanisms of asymmetric stem cell division. J Cell Biol. 2018; 217:3785–95. https://doi.org/10.1083/jcb.201807037. [PubMed].
29. Kahney EW, Snedeker JC, Chen X. Regulation of Drosophila germline stem cells. Curr Opin Cell Biol. 2019; 60:27–35. https://doi.org/10.1016/j.ceb.2019.03.008. [PubMed].
30. Ocampo A, Reddy P, Belmonte JCI. Anti-Aging Strategies Based on Cellular Reprogramming. Trends Mol Med. 2016; 22:725–38. https://doi.org/10.1016/j.molmed.2016.06.005. [PubMed].
31. Ocampo A, Reddy P, Martinez-Redondo P, Platero-Luengo A, Hatanaka F, Hishida T, Li M, Lam D, Kurita M, Beyret E, Araoka T, Vazquez-Ferrer E, Donoso D, et al. In Vivo Amelioration of Age-Associated Hallmarks by Partial Reprogramming. Cell. 2016; 167:1719–33.e12. https://doi.org/10.1016/j.cell.2016.11.052. [PubMed].
32. Wu J, Izpisua Belmonte JC. Stem Cells: A Renaissance in Human Biology Research. Cell. 2016; 165:1572–85. https://doi.org/10.1016/j.cell.2016.05.043. [PubMed].
33. Wu J, Ocampo A, Belmonte JCI. Cellular Metabolism and Induced Pluripotency. Cell. 2016; 166:1371–85. https://doi.org/10.1016/j.cell.2016.08.008. [PubMed].
34. Ahmed AS, Sheng MH, Wasnik S, Baylink DJ, Lau KW. Effect of aging on stem cells. World J Exp Med. 2017; 7:1–10. https://doi.org/10.5493/wjem.v7.i1.1. [PubMed].
35. García-Prat L, Sousa-Victor P, Muñoz-Cánoves P. Functional dysregulation of stem cells during aging: a focus on skeletal muscle stem cells. FEBS J. 2013; 280:4051–62. https://doi.org/10.1111/febs.12221. [PubMed].
36. Li M, Izpisua Belmonte JC. Ageing: Genetic rejuvenation of old muscle. Nature. 2014; 506:304–5. https://doi.org/10.1038/nature13058. [PubMed].
37. Sousa-Victor P, Gutarra S, García-Prat L, Rodriguez-Ubreva J, Ortet L, Ruiz-Bonilla V, Jardí M, Ballestar E, González S, Serrano AL, Perdiguero E, Muñoz-Cánoves P. Geriatric muscle stem cells switch reversible quiescence into senescence. Nature. 2014; 506:316–21. https://doi.org/10.1038/nature13013. [PubMed].
38. Goodell MA, Rando TA. Stem cells and healthy aging. Science. 2015; 350:1199–204. https://doi.org/10.1126/science.aab3388. [PubMed].
39. Akunuru S, Geiger H. Aging, Clonality, and Rejuvenation of Hematopoietic Stem Cells. Trends Mol Med. 2016; 22:701–12. https://doi.org/10.1016/j.molmed.2016.06.003. [PubMed].
40. Almada AE, Wagers AJ. Molecular circuitry of stem cell fate in skeletal muscle regeneration, ageing and disease. Nat Rev Mol Cell Biol. 2016; 17:267–79. https://doi.org/10.1038/nrm.2016.7. [PubMed].
41. Chandel NS, Jasper H, Ho TT, Passegué E. Metabolic regulation of stem cell function in tissue homeostasis and organismal ageing. Nat Cell Biol. 2016; 18:823–32. https://doi.org/10.1038/ncb3385. [PubMed].
42. Mahmoudi S, Brunet A. Bursts of Reprogramming: A Path to Extend Lifespan? Cell. 2016; 167:1672–74. https://doi.org/10.1016/j.cell.2016.11.050. [PubMed].
43. Schultz MB, Sinclair DA. When stem cells grow old: phenotypes and mechanisms of stem cell aging. Development. 2016; 143:3–14. https://doi.org/10.1242/dev.130633. [PubMed].
44. Soria-Valles C, López-Otín C. iPSCs: On the Road to Reprogramming Aging. Trends Mol Med. 2016; 22:713–24. https://doi.org/10.1016/j.molmed.2016.05.010. [PubMed].
45. Zhang H, Ryu D, Wu Y, Gariani K, Wang X, Luan P, D’Amico D, Ropelle ER, Lutolf MP, Aebersold R, Schoonjans K, Menzies KJ, Auwerx J. NAD+ repletion improves mitochondrial and stem cell function and enhances life span in mice. Science. 2016; 352:1436–43. https://doi.org/10.1126/science.aaf2693. [PubMed].
46. Artoni F, Kreipke RE, Palmeira O, Dixon C, Goldberg Z, Ruohola-Baker H. Loss of foxo rescues stem cell aging in Drosophila germ line. Elife. 2017; 6:e27842. https://doi.org/10.7554/eLife.27842. [PubMed].
47. Brunet A, Rando TA. Interaction between epigenetic and metabolism in aging stem cells. Curr Opin Cell Biol. 2017; 45:1–7. https://doi.org/10.1016/j.ceb.2016.12.009. [PubMed].
48. García-Prat L, Muñoz-Cánoves P. Aging, metabolism and stem cells: Spotlight on muscle stem cells. Mol Cell Endocrinol. 2017; 445:109–17. https://doi.org/10.1016/j.mce.2016.08.021. [PubMed].
49. Meyer K, Yankner BA. Slowing Down Aging. Cell Metab. 2017; 26:592–93. https://doi.org/10.1016/j.cmet.2017.09.012. [PubMed].
50. Ren R, Ocampo A, Liu GH, Izpisua Belmonte JC. Regulation of Stem Cell Aging by Metabolism and Epigenetics. Cell Metab. 2017; 26:460–74. https://doi.org/10.1016/j.cmet.2017.07.019. [PubMed].
51. Revuelta M, Matheu A. Autophagy in stem cell aging. Aging Cell. 2017; 16:912–15. https://doi.org/10.1111/acel.12655. [PubMed].
52. Solanas G, Peixoto FO, Perdiguero E, Jardí M, Ruiz-Bonilla V, Datta D, Symeonidi A, Castellanos A, Welz PS, Caballero JM, Sassone-Corsi P, Muñoz-Cánoves P, Benitah SA. Aged Stem Cells Reprogram Their Daily Rhythmic Functions to Adapt to Stress. Cell. 2017; 170:678–92.e20. https://doi.org/10.1016/j.cell.2017.07.035. [PubMed].
53. Zhang Y, Kim MS, Jia B, Yan J, Zuniga-Hertz JP, Han C, Cai D. Hypothalamic stem cells control ageing speed partly through exosomal miRNAs. Nature. 2017; 548:52–57. https://doi.org/10.1038/nature23282. [PubMed].
54. Bi S, Wang H, Kuang W. Stem cell rejuvenation and the role of autophagy in age retardation by caloric restriction: An update. Mech Ageing Dev. 2018; 175:46–54. https://doi.org/10.1016/j.mad.2018.07.005. [PubMed].
55. Keyes BE, Fuchs E. Stem cells: Aging and transcriptional fingerprints. J Cell Biol. 2018; 217:79–92. https://doi.org/10.1083/jcb.201708099. [PubMed].
56. Lillie SH, Pringle JR. Reserve carbohydrate metabolism in Saccharomyces cerevisiae: responses to nutrient limitation. J Bacteriol. 1980; 143:1384–94. https://doi.org/10.1128/jb.143.3.1384-1394.1980. [PubMed].
57. Lewis D, Gattie D. Ecology of Quiescent Microbes. U.S. Environmental Protection Agency, Washington, D.C. 1991.
58. Werner-Washburne M, Braun E, Johnston GC, Singer RA. Stationary phase in the yeast Saccharomyces cerevisiae. Microbiol Rev. 1993; 57:383–401. https://doi.org/10.1128/mr.57.2.383-401.1993. [PubMed].
59. Herman PK. Stationary phase in yeast. Curr Opin Microbiol. 2002; 5:602–7. https://doi.org/10.1016/s1369-5274(02)00377-6. [PubMed].
60. Gray JV, Petsko GA, Johnston GC, Ringe D, Singer RA, Werner-Washburne M. “Sleeping beauty”: quiescence in Saccharomyces cerevisiae. Microbiol Mol Biol Rev. 2004; 68:187–206. https://doi.org/10.1128/MMBR.68.2.187-206.2004. [PubMed].
61. Finkel SE. Long-term survival during stationary phase: evolution and the GASP phenotype. Nat Rev Microbiol. 2006; 4:113–20. https://doi.org/10.1038/nrmicro1340. [PubMed].
62. Werner-Washburne M, Roy S, Davidson GS. Aging and the survival of quiescent and non-quiescent cells in yeast stationary-phase cultures. Subcell Biochem. 2012; 57:123–43. https://doi.org/10.1007/978-94-007-2561-4_6. [PubMed].
63. Rittershaus ES, Baek SH, Sassetti CM. The normalcy of dormancy: common themes in microbial quiescence. Cell Host Microbe. 2013; 13:643–51. https://doi.org/10.1016/j.chom.2013.05.012. [PubMed].
64. Roche B, Arcangioli B, Martienssen R. Transcriptional reprogramming in cellular quiescence. RNA Biol. 2017; 14:843–53. https://doi.org/10.1080/15476286.2017.1327510. [PubMed].
65. Wloch-Salamon DM, Fisher RM, Regenberg B. Division of labour in the yeast: Saccharomyces cerevisiae. Yeast. 2017; 34:399–406. https://doi.org/10.1002/yea.3241. [PubMed].
66. Sun S, Gresham D. Cellular quiescence in budding yeast. Yeast. 2021; 38:12–29. https://doi.org/10.1002/yea.3545. [PubMed].
67. Goldberg AA, Bourque SD, Kyryakov P, Gregg C, Boukh-Viner T, Beach A, Burstein MT, Machkalyan G, Richard V, Rampersad S, Cyr D, Milijevic S, Titorenko VI. Effect of calorie restriction on the metabolic history of chronologically aging yeast. Exp Gerontol. 2009; 44:555–71. https://doi.org/10.1016/j.exger.2009.06.001. [PubMed].
68. Broach JR. Nutritional control of growth and development in yeast. Genetics. 2012; 192:73–105. https://doi.org/10.1534/genetics.111.135731. [PubMed].
69. Longo VD, Shadel GS, Kaeberlein M, Kennedy B. Replicative and chronological aging in Saccharomyces cerevisiae. Cell Metab. 2012; 16:18–31. https://doi.org/10.1016/j.cmet.2012.06.002. [PubMed].
70. Arlia-Ciommo A, Leonov A, Piano A, Svistkova V, Titorenko VI. Cell-autonomous mechanisms of chronological aging in the yeast Saccharomyces cerevisiae. Microb Cell. 2014; 1:163–78. https://doi.org/10.15698/mic2014.06.152. [PubMed].
71. Fraenkel DG. Yeast intermediary metabolism. Cold Spring Harbor (NY): Cold Spring Harbor Laboratory Press. 2011.
72. Allen C, Büttner S, Aragon AD, Thomas JA, Meirelles O, Jaetao JE, Benn D, Ruby SW, Veenhuis M, Madeo F, Werner-Washburne M. Isolation of quiescent and nonquiescent cells from yeast stationary-phase cultures. J Cell Biol. 2006; 174:89–100. https://doi.org/10.1083/jcb.200604072. [PubMed].
73. Davidson GS, Joe RM, Roy S, Meirelles O, Allen CP, Wilson MR, Tapia PH, Manzanilla EE, Dodson AE, Chakraborty S, Carter M, Young S, Edwards B, et al. The proteomics of quiescent and nonquiescent cell differentiation in yeast stationary-phase cultures. Mol Biol Cell. 2011; 22:988–98. https://doi.org/10.1091/mbc.E10-06-0499. [PubMed].
74. Miles S, Li L, Davison J, Breeden LL. Xbp1 directs global repression of budding yeast transcription during the transition to quiescence and is important for the longevity and reversibility of the quiescent state. PLoS Genet. 2013; 9:e1003854. https://doi.org/10.1371/journal.pgen.1003854. [PubMed].
75. Aragon AD, Rodriguez AL, Meirelles O, Roy S, Davidson GS, Tapia PH, Allen C, Joe R, Benn D, Werner-Washburne M. Characterization of differentiated quiescent and nonquiescent cells in yeast stationary-phase cultures. Mol Biol Cell. 2008; 19:1271–80. https://doi.org/10.1091/mbc.e07-07-0666. [PubMed].
76. Peters TW, Rardin MJ, Czerwieniec G, Evani US, Reis-Rodrigues P, Lithgow GJ, Mooney SD, Gibson BW, Hughes RE. Tor1 regulates protein solubility in Saccharomyces cerevisiae. Mol Biol Cell. 2012; 23:4679–88. https://doi.org/10.1091/mbc.E12-08-0620. [PubMed].
77. Bontron S, Jaquenoud M, Vaga S, Talarek N, Bodenmiller B, Aebersold R, De Virgilio C. Yeast endosulfines control entry into quiescence and chronological life span by inhibiting protein phosphatase 2A. Cell Rep. 2013; 3:16–22. https://doi.org/10.1016/j.celrep.2012.11.025. [PubMed].
78. Laporte D, Courtout F, Salin B, Ceschin J, Sagot I. An array of nuclear microtubules reorganizes the budding yeast nucleus during quiescence. J Cell Biol. 2013; 203:585–94. https://doi.org/10.1083/jcb.201306075. [PubMed].
79. Li L, Miles S, Melville Z, Prasad A, Bradley G, Breeden LL. Key events during the transition from rapid growth to quiescence in budding yeast require posttranscriptional regulators. Mol Biol Cell. 2013; 24:3697–709. https://doi.org/10.1091/mbc.E13-05-0241. [PubMed].
80. Guidi M, Ruault M, Marbouty M, Loïodice I, Cournac A, Billaudeau C, Hocher A, Mozziconacci J, Koszul R, Taddei A. Spatial reorganization of telomeres in long-lived quiescent cells. Genome Biol. 2015; 16:206. https://doi.org/10.1186/s13059-015-0766-2. [PubMed].
81. McKnight JN, Boerma JW, Breeden LL, Tsukiyama T. Global Promoter Targeting of a Conserved Lysine Deacetylase for Transcriptional Shutoff during Quiescence Entry. Mol Cell. 2015; 59:732–43. https://doi.org/10.1016/j.molcel.2015.07.014. [PubMed].
82. Quan Z, Cao L, Tang Y, Yan Y, Oliver SG, Zhang N. The Yeast GSK-3 Homologue Mck1 Is a Key Controller of Quiescence Entry and Chronological Lifespan. PLoS Genet. 2015; 11:e1005282. https://doi.org/10.1371/journal.pgen.1005282. [PubMed].
83. Rutledge MT, Russo M, Belton JM, Dekker J, Broach JR. The yeast genome undergoes significant topological reorganization in quiescence. Nucleic Acids Res. 2015; 43:8299–313. https://doi.org/10.1093/nar/gkv723. [PubMed].
84. Laporte D, Courtout F, Tollis S, Sagot I. Quiescent Saccharomyces cerevisiae forms telomere hyperclusters at the nuclear membrane vicinity through a multifaceted mechanism involving Esc1, the Sir complex, and chromatin condensation. Mol Biol Cell. 2016; 27:1875–84. https://doi.org/10.1091/mbc.E16-01-0069. [PubMed].
85. Lee HY, Cheng KY, Chao JC, Leu JY. Differentiated cytoplasmic granule formation in quiescent and non-quiescent cells upon chronological aging. Microb Cell. 2016; 3:109–19. https://doi.org/10.15698/mic2016.03.484. [PubMed].
86. Munder MC, Midtvedt D, Franzmann T, Nüske E, Otto O, Herbig M, Ulbricht E, Müller P, Taubenberger A, Maharana S, Malinovska L, Richter D, Guck J, et al. A pH-driven transition of the cytoplasm from a fluid- to a solid-like state promotes entry into dormancy. Elife. 2016; 5:e09347. https://doi.org/10.7554/eLife.09347. [PubMed].
87. Joyner RP, Tang JH, Helenius J, Dultz E, Brune C, Holt LJ, Huet S, Müller DJ, Weis K. A glucose-starvation response regulates the diffusion of macromolecules. Elife. 2016; 5:e09376. https://doi.org/10.7554/eLife.09376. [PubMed].
88. Laporte D, Jimenez L, Gouleme L, Sagot I. Yeast quiescence exit swiftness is influenced by cell volume and chronological age. Microb Cell. 2017; 5:104–11. https://doi.org/10.15698/mic2018.02.615. [PubMed].
89. Kuang Z, Ji H, Boeke JD. Stress response factors drive regrowth of quiescent cells. Curr Genet. 2018; 64:807–10. https://doi.org/10.1007/s00294-018-0813-0. [PubMed].
90. Laporte D, Gouleme L, Jimenez L, Khemiri I, Sagot I. Mitochondria reorganization upon proliferation arrest predicts individual yeast cell fate. Elife. 2018; 7:e35685. https://doi.org/10.7554/eLife.35685. [PubMed].
91. Miles S, Li LH, Melville Z, Breeden LL. Ssd1 and the cell wall integrity pathway promote entry, maintenance, and recovery from quiescence in budding yeast. Mol Biol Cell. 2019; 30:2205–17. https://doi.org/10.1091/mbc.E19-04-0190. [PubMed].
92. Roosen J, Engelen K, Marchal K, Mathys J, Griffioen G, Cameroni E, Thevelein JM, De Virgilio C, De Moor B, Winderickx J. PKA and Sch9 control a molecular switch important for the proper adaptation to nutrient availability. Mol Microbiol. 2005; 55:862–80. https://doi.org/10.1111/j.1365-2958.2004.04429.x. [PubMed].
93. Wanke V, Pedruzzi I, Cameroni E, Dubouloz F, De Virgilio C. Regulation of G0 entry by the Pho80-Pho85 cyclin-CDK complex. EMBO J. 2005; 24:4271–78. https://doi.org/10.1038/sj.emboj.7600889. [PubMed].
94. Rubio-Texeira M, Van Zeebroeck G, Voordeckers K, Thevelein JM. Saccharomyces cerevisiae plasma membrane nutrient sensors and their role in PKA signaling. FEMS Yeast Res. 2010; 10:134–49. https://doi.org/10.1111/j.1567-1364.2009.00587.x. [PubMed].
95. Smets B, Ghillebert R, De Snijder P, Binda M, Swinnen E, De Virgilio C, Winderickx J. Life in the midst of scarcity: adaptations to nutrient availability in Saccharomyces cerevisiae. Curr Genet. 2010; 56:1–32. https://doi.org/10.1007/s00294-009-0287-1. [PubMed].
96. Cai L, Tu BP. Driving the cell cycle through metabolism. Annu Rev Cell Dev Biol. 2012; 28:59–87. https://doi.org/10.1146/annurev-cellbio-092910-154010. [PubMed].
97. Ferretti AC, Larocca MC, Favre C. Nutritional stress in eukaryotic cells: oxidative species and regulation of survival in time of scarceness. Mol Genet Metab. 2012; 105:186–92. https://doi.org/10.1016/j.ymgme.2011.11.007. [PubMed].
98. Conrad M, Schothorst J, Kankipati HN, Van Zeebroeck G, Rubio-Texeira M, Thevelein JM. Nutrient sensing and signaling in the yeast Saccharomyces cerevisiae. FEMS Microbiol Rev. 2014; 38:254–99. https://doi.org/10.1111/1574-6976.12065. [PubMed].
99. Engelberg D, Perlman R, Levitzki A. Transmembrane signaling in Saccharomyces cerevisiae as a model for signaling in metazoans: state of the art after 25 years. Cell Signal. 2014; 26:2865–78. https://doi.org/10.1016/j.cellsig.2014.09.003. [PubMed].
100. Swinnen E, Ghillebert R, Wilms T, Winderickx J. Molecular mechanisms linking the evolutionary conserved TORC1-Sch9 nutrient signalling branch to lifespan regulation in Saccharomyces cerevisiae. FEMS Yeast Res. 2014; 14:17–32. https://doi.org/10.1111/1567-1364.12097. [PubMed].
101. Shashkova S, Welkenhuysen N, Hohmann S. Molecular communication: crosstalk between the Snf1 and other signaling pathways. FEMS Yeast Res. 2015; 15:fov026. https://doi.org/10.1093/femsyr/fov026. [PubMed].
102. Cao L, Tang Y, Quan Z, Zhang Z, Oliver SG, Zhang N. Chronological Lifespan in Yeast Is Dependent on the Accumulation of Storage Carbohydrates Mediated by Yak1, Mck1 and Rim15 Kinases. PLoS Genet. 2016; 12:e1006458. https://doi.org/10.1371/journal.pgen.1006458. [PubMed].
103. Honigberg SM. Similar environments but diverse fates: Responses of budding yeast to nutrient deprivation. Microb Cell. 2016; 3:302–28. https://doi.org/10.15698/mic2016.08.516. [PubMed].
104. Pérez-Hidalgo L, Moreno S. Coupling TOR to the Cell Cycle by the Greatwall-Endosulfine-PP2A-B55 Pathway. Biomolecules. 2017; 7:59. https://doi.org/10.3390/biom7030059. [PubMed].
105. Zhang N, Cao L. Starvation signals in yeast are integrated to coordinate metabolic reprogramming and stress response to ensure longevity. Curr Genet. 2017; 63:839–43. https://doi.org/10.1007/s00294-017-0697-4. [PubMed].
106. Castro A, Lorca T. Greatwall kinase at a glance. J Cell Sci. 2018; 131:jcs222364. https://doi.org/10.1242/jcs.222364. [PubMed].
107. García-Blanco N, Vázquez-Bolado A, Moreno S. Greatwall-Endosulfine: A Molecular Switch that Regulates PP2A/B55 Protein Phosphatase Activity in Dividing and Quiescent Cells. Int J Mol Sci. 2019; 20:6228. https://doi.org/10.3390/ijms20246228. [PubMed].
108. Martín R, Stonyte V, Lopez-Aviles S. Protein Phosphatases in G1 Regulation. Int J Mol Sci. 2020; 21:395. https://doi.org/10.3390/ijms21020395. [PubMed].
109. Leonov A, Feldman R, Piano A, Arlia-Ciommo A, Lutchman V, Ahmadi M, Elsaser S, Fakim H, Heshmati-Moghaddam M, Hussain A, Orfali S, Rajen H, Roofigari-Esfahani N, et al. Caloric restriction extends yeast chronological lifespan via a mechanism linking cellular aging to cell cycle regulation, maintenance of a quiescent state, entry into a non-quiescent state and survival in the non-quiescent state. Oncotarget. 2017; 8:69328–50. https://doi.org/10.18632/oncotarget.20614. [PubMed].
110. Mohammad K, Titorenko VI. Yeast chronological aging is linked to cell cycle regulation. Cell Cycle. 2018; 17:1035–36. https://doi.org/10.1080/15384101.2018.1478670. [PubMed].
111. Sinclair DA. Toward a unified theory of caloric restriction and longevity regulation. Mech Ageing Dev. 2005; 126:987–1002. https://doi.org/10.1016/j.mad.2005.03.019. [PubMed].
112. Lin SJ, Sinclair D. Molecular mechanisms of aging: insights from budding yeast. In: Guarente LP, Partridge L, Wallace DC. (Eds.), Molecular Biology of Aging. Cold Spring Harbor (NY): Cold Spring Harbor Laboratory Press. 2008; 51:483–516.
113. Fontana L, Partridge L, Longo VD. Extending healthy life span--from yeast to humans. Science. 2010; 328:321–26. https://doi.org/10.1126/science.1172539. [PubMed].
114. Masoro EJ. Overview of caloric restriction and ageing. Mech Ageing Dev. 2005; 126:913–22. https://doi.org/10.1016/j.mad.2005.03.012. [PubMed].
115. Mair W, Dillin A. Aging and survival: the genetics of life span extension by dietary restriction. Annu Rev Biochem. 2008; 77:727–54. https://doi.org/10.1146/annurev.biochem.77.061206.171059. [PubMed].
116. Colman RJ, Anderson RM, Johnson SC, Kastman EK, Kosmatka KJ, Beasley TM, Allison DB, Cruzen C, Simmons HA, Kemnitz JW, Weindruch R. Caloric restriction delays disease onset and mortality in rhesus monkeys. Science. 2009; 325:201–4. https://doi.org/10.1126/science.1173635. [PubMed].
117. Colman RJ, Beasley TM, Kemnitz JW, Johnson SC, Weindruch R, Anderson RM. Caloric restriction reduces age-related and all-cause mortality in rhesus monkeys. Nat Commun. 2014; 5:3557. https://doi.org/10.1038/ncomms4557. [PubMed].
118. de Cabo R, Carmona-Gutierrez D, Bernier M, Hall MN, Madeo F. The search for antiaging interventions: from elixirs to fasting regimens. Cell. 2014; 157:1515–26. https://doi.org/10.1016/j.cell.2014.05.031. [PubMed].
119. Lee C, Longo V. Dietary restriction with and without caloric restriction for healthy aging. F1000Res. 2016; 5:F1000. https://doi.org/10.12688/f1000research.7136.1. [PubMed].
120. Mattison JA, Colman RJ, Beasley TM, Allison DB, Kemnitz JW, Roth GS, Ingram DK, Weindruch R, de Cabo R, Anderson RM. Caloric restriction improves health and survival of rhesus monkeys. Nat Commun. 2017; 8:14063. https://doi.org/10.1038/ncomms14063. [PubMed].
121. Madeo F, Carmona-Gutierrez D, Hofer SJ, Kroemer G. Caloric Restriction Mimetics against Age-Associated Disease: Targets, Mechanisms, and Therapeutic Potential. Cell Metab. 2019; 29:592–610. https://doi.org/10.1016/j.cmet.2019.01.018. [PubMed].
122. Pifferi F, Aujard F. Caloric restriction, longevity and aging: Recent contributions from human and non-human primate studies. Prog Neuropsychopharmacol Biol Psychiatry. 2019; 95:109702. https://doi.org/10.1016/j.pnpbp.2019.109702. [PubMed].
123. Wright H, Handu M, Jankeel A, Messaoudi I, Varlamov O. Short-Term Caloric Restriction Attenuates Obesity-Induced Pro-Inflammatory Response in Male Rhesus Macaques. Nutrients. 2020; 12:511. https://doi.org/10.3390/nu12020511. [PubMed].
124. Longo VD. Mutations in signal transduction proteins increase stress resistance and longevity in yeast, nematodes, fruit flies, and mammalian neuronal cells. Neurobiol Aging. 1999; 20:479–86. https://doi.org/10.1016/s0197-4580(99)00089-5. [PubMed].
125. Powers RW 3rd, Kaeberlein M, Caldwell SD, Kennedy BK, Fields S. Extension of chronological life span in yeast by decreased TOR pathway signaling. Genes Dev. 2006; 20:174–84. https://doi.org/10.1101/gad.1381406. [PubMed].
126. Goldberg AA, Richard VR, Kyryakov P, Bourque SD, Beach A, Burstein MT, Glebov A, Koupaki O, Boukh-Viner T, Gregg C, Juneau M, English AM, Thomas DY, Titorenko VI. Chemical genetic screen identifies lithocholic acid as an anti-aging compound that extends yeast chronological life span in a TOR-independent manner, by modulating housekeeping longevity assurance processes. Aging (Albany NY). 2010; 2:393–414. https://doi.org/10.18632/aging.100168. [PubMed].
127. Daignan-Fornier B, Sagot I. Proliferation/Quiescence: When to start? Where to stop? What to stock? Cell Div. 2011; 6:20. https://doi.org/10.1186/1747-1028-6-20. [PubMed].
128. Hwang PK, Tugendreich S, Fletterick RJ. Molecular analysis of GPH1, the gene encoding glycogen phosphorylase in Saccharomyces cerevisiae. Mol Cell Biol. 1989; 9:1659–66. https://doi.org/10.1128/mcb.9.4.1659-1666.1989. [PubMed].
129. Teste MA, Enjalbert B, Parrou JL, François JM. The Saccharomyces cerevisiae YPR184w gene encodes the glycogen debranching enzyme. FEMS Microbiol Lett. 2000; 193:105–10. https://doi.org/10.1111/j.1574-6968.2000.tb09410.x. [PubMed].
130. François J, Parrou JL. Reserve carbohydrates metabolism in the yeast Saccharomyces cerevisiae. FEMS Microbiol Rev. 2001; 25:125–45. https://doi.org/10.1111/j.1574-6976.2001.tb00574.x. [PubMed].
131. Thon VJ, Vigneron-Lesens C, Marianne-Pepin T, Montreuil J, Decq A, Rachez C, Ball SG, Cannon JF. Coordinate regulation of glycogen metabolism in the yeast Saccharomyces cerevisiae. Induction of glycogen branching enzyme. J Biol Chem. 1992; 267:15224–28. [PubMed].
132. Cannon JF, Pringle JR, Fiechter A, Khalil M. Characterization of glycogen-deficient glc mutants of Saccharomyces cerevisiae. Genetics. 1994; 136:485–503. https://doi.org/10.1093/genetics/136.2.485. [PubMed].
133. Destruelle M, Holzer H, Klionsky DJ. Isolation and characterization of a novel yeast gene, ATH1, that is required for vacuolar acid trehalase activity. Yeast. 1995; 11:1015–25. https://doi.org/10.1002/yea.320111103. [PubMed].
134. Alizadeh P, Klionsky DJ. Purification and biochemical characterization of the ATH1 gene product, vacuolar acid trehalase, from Saccharomyces cerevisiae. FEBS Lett. 1996; 391:273–78. https://doi.org/10.1016/0014-5793(96)00751-x. [PubMed].
135. Garre E, Matallana E. The three trehalases Nth1p, Nth2p and Ath1p participate in the mobilization of intracellular trehalose required for recovery from saline stress in Saccharomyces cerevisiae. Microbiology (Reading). 2009; 155:3092–99. https://doi.org/10.1099/mic.0.024992-0. [PubMed].
136. Kyryakov P, Beach A, Richard VR, Burstein MT, Leonov A, Levy S, Titorenko VI. Caloric restriction extends yeast chronological lifespan by altering a pattern of age-related changes in trehalose concentration. Front Physiol. 2012; 3:256. https://doi.org/10.3389/fphys.2012.00256. [PubMed].
137. De Virgilio C, Bürckert N, Bell W, Jenö P, Boller T, Wiemken A. Disruption of TPS2, the gene encoding the 100-kDa subunit of the trehalose-6-phosphate synthase/phosphatase complex in Saccharomyces cerevisiae, causes accumulation of trehalose-6-phosphate and loss of trehalose-6-phosphate phosphatase activity. Eur J Biochem. 1993; 212:315–23. https://doi.org/10.1111/j.1432-1033.1993.tb17664.x. [PubMed].