
Introduction
The most common type of somatic mutations detected in tumor samples is single nucleotide substitutions (SNSs). SNSs in the coding regions lead to missense, silent, or nonsense mutations depending on the type of the substitution and the reading frame position. Size is a strong predictor of the number of SNSs in a gene [1, 2]. The number of mutations also depends on the nucleotide composition of the gene [3]. Mutation rates are context dependent, as they depend on adjacent nucleotides for the same type of nucleotide substitution [4–7]. Mutation rates also depend on the strand (sense/antisense) on which the initial mutational event takes place [8]. Gene features like gene expression level [9] or relative replication time influence its propensity to mutate [10]. It is possible to computationally mutate all nucleotide positions and, therefore, estimate the number of potential sites for missense, nonsense or silent mutations in individual transcripts. This can be done by taking into account the nucleotide context, i.e. the preceding and the subsequent nucleotides relative to a given site.
After missense mutations, silent mutations are the second most common type of somatic mutations produced by SNSs detected in tumor samples. The majority of silent mutations are expected to be neutral since they do not change the amino acid sequence, despite anecdotal examples of functionality (Bali & Bebok, 2015; Pagani, Raponi, & Baralle, 2005). Their selective neutrality makes silent mutations ideal for an unbiased assessment of mutation rate free of effects of selection. In this study, we used silent mutations to estimate nucleotide context-dependent mutation rates for different SNSs. We focused on lung cancer (LC) because it is the top cancer killer worldwide and because LC has one of the highest frequencies of somatic mutations [11–13].
Here we used silent mutations to estimate nucleotide context-dependent mutation rates that were defined as the number of somatic mutations per site per tumor. The expected numbers of missense and nonsense mutations in individual human transcripts were estimated based on the observed numbers of silent mutations and the number of potential sites weighted by the corresponding mutation rates. In other words, the expected numbers of missense and nonsense mutations were estimated under the assumption that they behave like silent (selectively neutral) mutations. A comparison of the observed and expected number of mutations identified genes with an excess of potentially functional missense and/or nonsense mutations. This was done separately for lung adenocarcinoma, squamous cell carcinoma and small cell lung cancer. We identified known as well as novel candidate cancer genes for lung cancer.
Results
The number of missense and nonsense mutations per site per sample
For the 162 possible nucleotide context-dependent single nucleotide substitutions (NCD-SNSs) with available silent and missense mutations there was a strong positive correlation between the number of silent mutations per site per sample and the number of missense mutations per site per sample in all cell types (Figure 1). Pearson’s ρ was similar for adenocarcinoma (0.974, N = 162, p < 10−16) (Figure 1A) and squamous cell carcinoma (0.972, N = 162, p < 10−16) (Figure 1B). For small cell lung cancer, Pearson’s ρ was 0.921. We also observed a significant positive correlation between the number of silent mutations per site per sample and the number of nonsense mutations per site per sample (for small cell lung cancer, 0.818, N = 64, p = 10−9, and even higher for adenocarcinoma and squamous cell carcinoma).
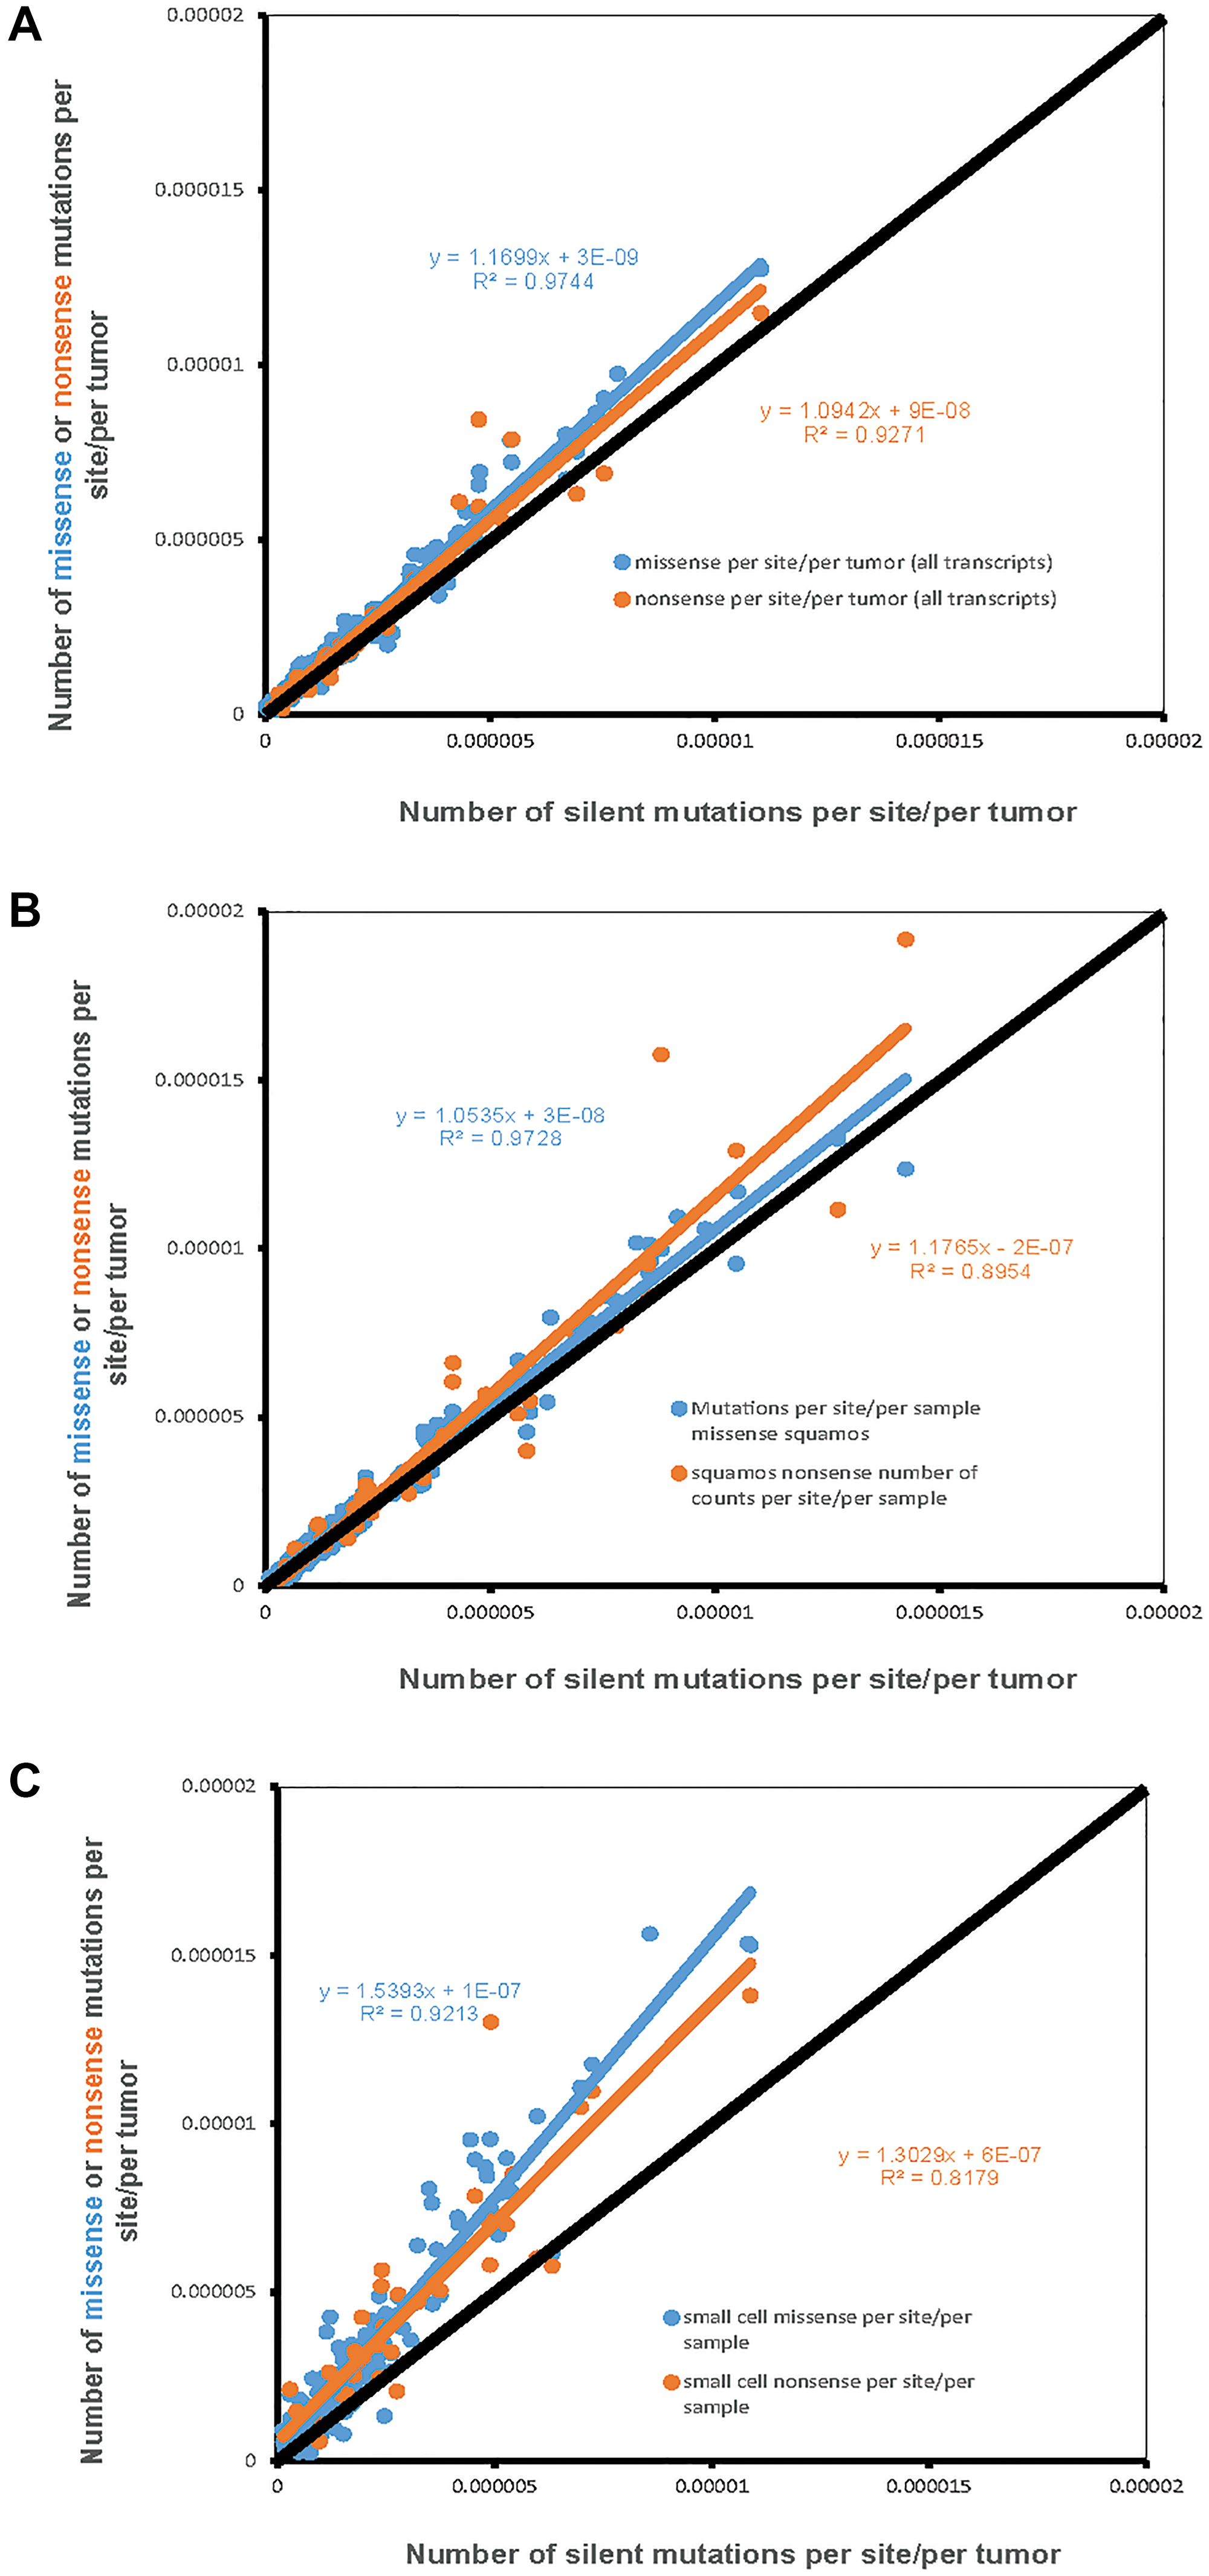
Figure 1: The number of missense and nonsense mutations per site per sample (Y-axis) compared to the number of silent mutations per site per sample (X-axis). Each dot represents one of 192 possible nucleotide context-dependent single nucleotide substitutions (NCD-SNS). Black line represents the expected number of mutations based on the number of silent mutations (per site per sample). (A) Adenocarcinoma, (B) Squamous cell carcinoma, (C) Small cell lung cancer.
The other important observation was that the number of missense and nonsense mutations per site per sample tended to be higher compared to the number of silent mutations per site per sample. The latter is evident from the slope of the linear regression lines for missense and nonsense mutations, placing them above the diagonal. This is further confirmed by the comparison of the mean differences between missense and silent and nonsense and silent mutations. For missense minus silent mutations, the corresponding t-tests for adenocarcinoma, squamous cell carcinoma and small cell carcinomas were: t = 7.7, n = 162, p = 1.5 × 10⁻¹¹, t = 4.4, n = 162, p = 1.7 × 10⁻⁵, t = 11.5, n = 162, p = 1.5 × 10⁻²¹. The corresponding numbers for differences between the number of nonsense mutations per site and the number of silent mutations per site were: t = 2.8, n = 64, p = 0.008 for adenocarcinoma, t = 2.0, n = 64, p = 0.04 for squamous cell carcinoma, and t = 5.8, n = 64, p = 9.9 × 10⁻⁸ for small cell lung cancer.
Mutation rates for 192 NCD-SNSs in adenocarcinoma, squamous cell carcinoma and small cell lung cancer
Supplementary Figure 1 shows mutation rates for 192 NCD-SNSs in adenocarcinoma, squamos cell carcinoma and small cell lung cancer estimated using silent mutations only. There is more than 100× differences in mutation rates for different NCD-SNSs. When different histologies are compared, squamous and small cell lung cancer tend to have higher mutation rates than adenocarcinoma (Figure 2). The estimated mutation rates for 192 NCD-SNSs can be found in Supplementary Table 1.
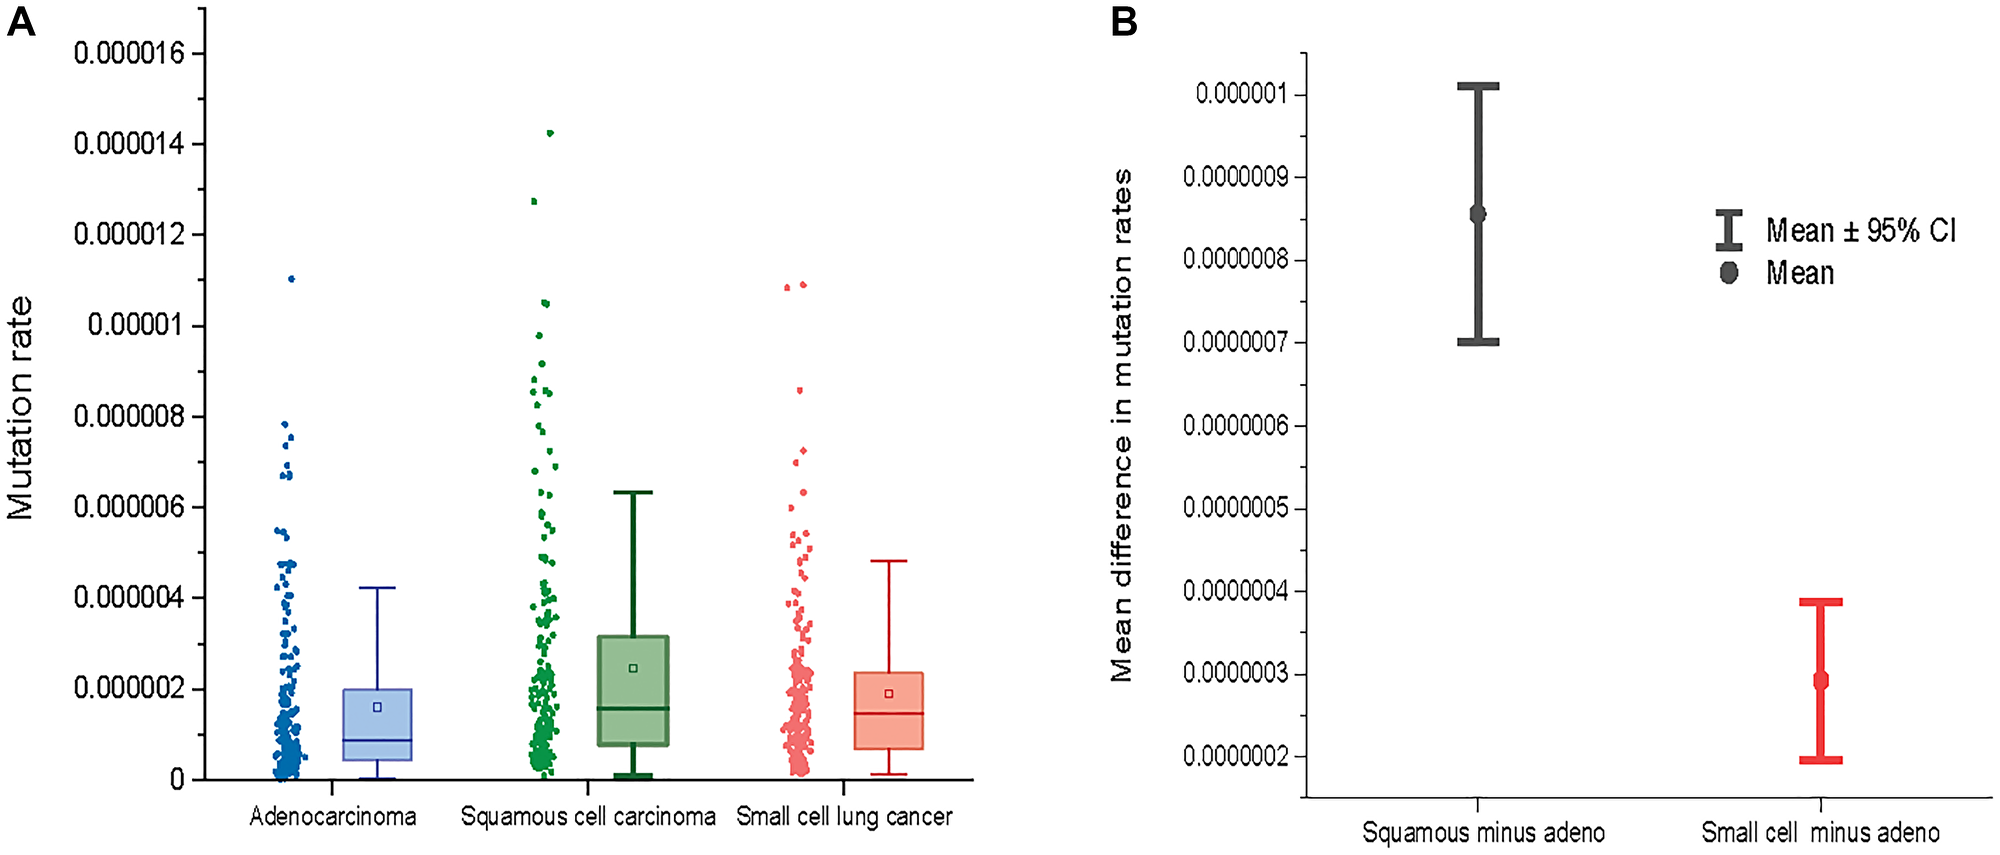
Figure 2: (A) Mutation rates across three major lung cancer cell types. (B) The mean difference between mutation rates for squamous cell lung cancer and adenocarcinoma (left) and between small cell lung cancer and adenocarcinoma (right) across 192 NCD-SNS.
Figure 2 shows a comparison of mutation rates across all the 192 NCD-SNS for the three lung cancer cell types. Lung adenocarcinoma has the lowest mutation rate while mutation rates for squamous and small cell lung cancer are higher (Figure 2A). The mutation rates for squamous cell lung cancer deviates from the mutation rates for adenocarcinoma stronger than does the mutation rate for small cell lung cancer, which is evident from the mean paired differences in mutation rates across the 192 NCD-SNS (Figure 2B).
Accounting for mutation rates predicts the observed number of missense and nonsense mutations better than does the number of potential sites
For each transcript we computed (1) the Pearson’s ρ between the observed number of missense and nonsense mutations and the number of corresponding potential sites across the 192 NCD-SNSs; and (2) the Pearson’s ρ between the observed number of missense and nonsense mutations and the number of potential sites weighted by the corresponding mutation rate as described in Materials and Methods section. Figure 3 shows the distributions of correlation coefficients for missense (left panels) and nonsense (right panels) mutations for the three LC histologies. We observed that the correlation coefficients were higher between the observed number of mutations and the number of potential sites weighted by the mutation rates of the corresponding NCD-SNS compared to the correlations between the observed number of mutations and the number of potential sites only.
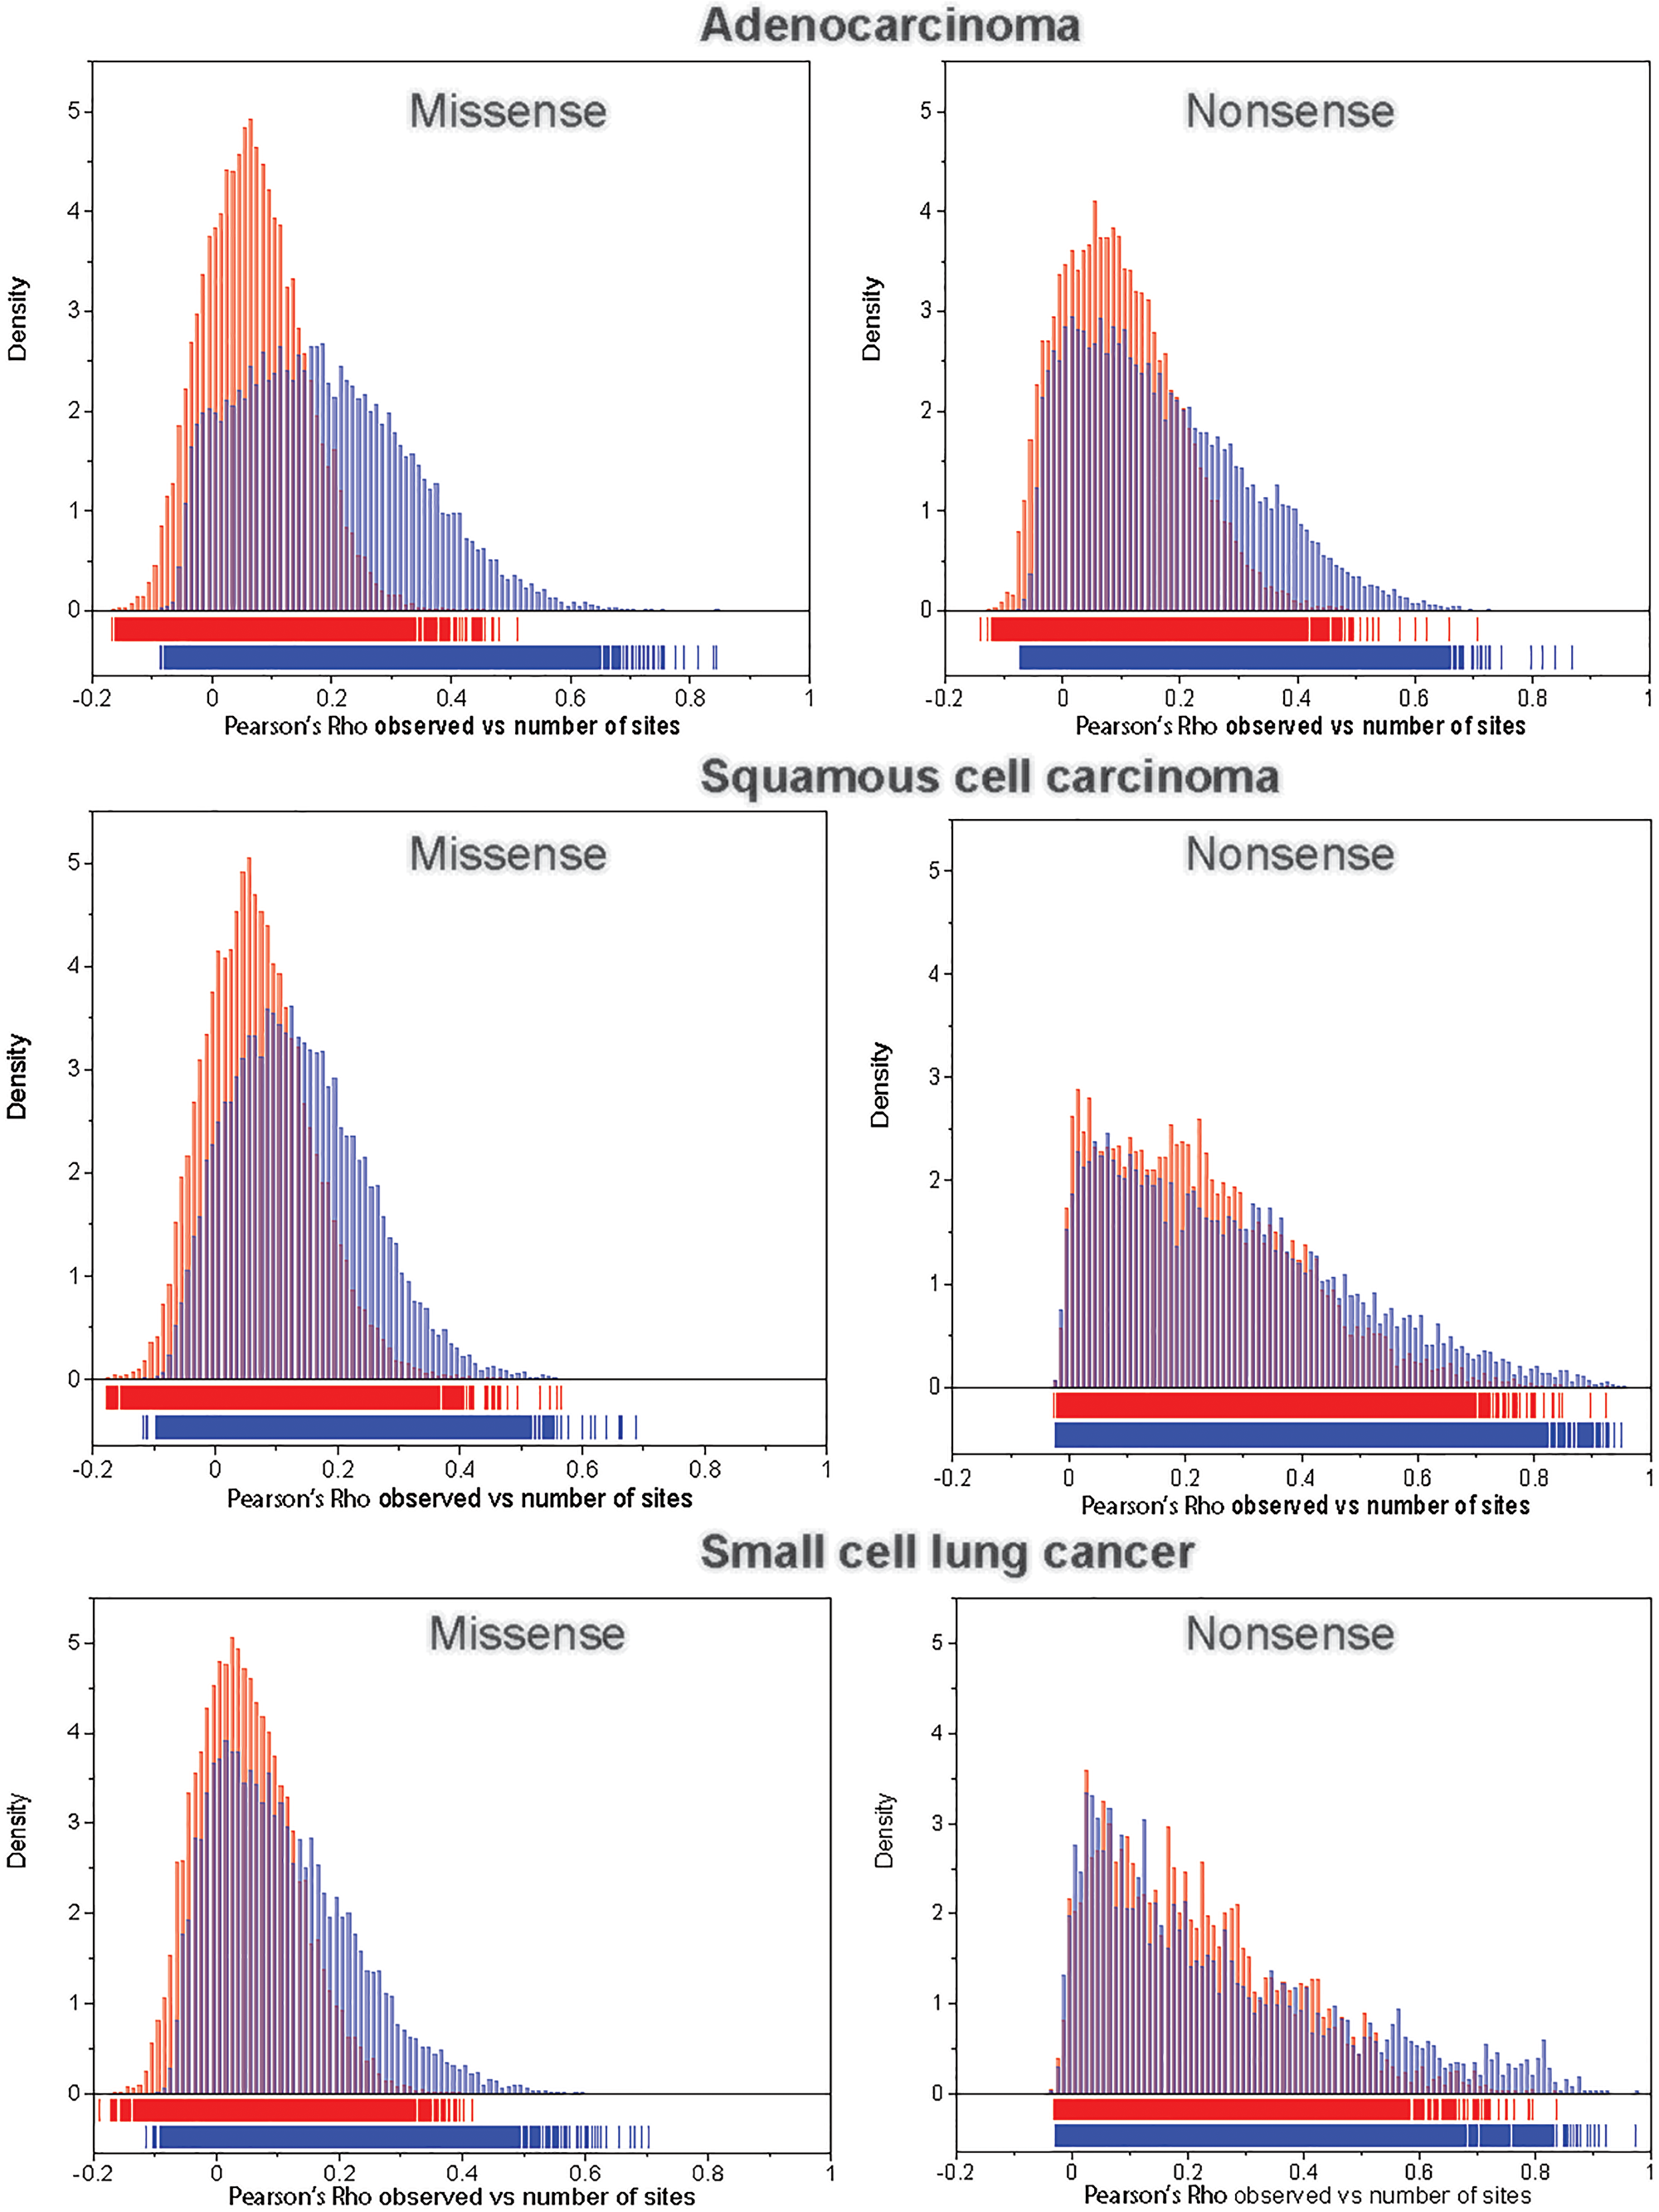
Figure 3: The distribution of Pearson’s correlation coefficient, ρ, between the observed number of mutations and the number of potential sites (red bars) and between the observed number of mutations and the number of potential sites weighted (multiplied) by the corresponding mutation rate (blue bars), for missense (left panel) and nonsense (right panel) mutations across 192 NCD-SNSs.
Genes with the higher than expected number of missense and/or nonsense mutations
Supplementary Figure 2 shows the distributions of the difference LOG(OBS/EXP)mis or non - LOG(OBS/EXP)silent. As a threshold for identification of the genes associated with lung tumorigenesis we used LOG(OBS/EXP)mis or non - LOG(OBS/EXP)silent = 3. The threshold was selected because only a fraction of transcripts, less than 1%, exceeds it and because the majority of known lung cancer related genes exceed this threshold.
Using the threshold of 3 for the difference, 26 candidate genes for lung adenocarcinoma, 26 genes for squamous cell carcinoma and 18 for small cell carcinoma were identified. Table 1 shows the list of genes with the corresponding observed and expected numbers of missense and nonsense mutations and the silent mutation-corrected LOG ratio. Detailed information about candidate genes, additionally including those with the threshold of 2.5, can be found in Supplementary Table 2.
Table 1: List of candidate genes for adenocarcinoma, squamous cell carcinoma and small cell carcinoma identified by excess of missense or nonsense mutations
| Histology | Gene | OBS missense | EXP missense | LOG(OBS/EXP)* | OBS nonsense | EXP nonsense | LOG(OBS/EXP)* |
|---|---|---|---|---|---|---|---|
| Adeno | TP53 | 145 | 1.88 | 5.62 | 24 | 0.16 | 5.14 |
| Adeno | KRAS | 165 | 1.34 | 5.14 | 0 | 0.14 | |
| Adeno | ARID1A | 14 | 19.2 | 2.46 | 13 | 1.43 | 4.56 |
| Adeno | RBM10 | 12 | 7.89 | 1.35 | 17 | 0.71 | 3.71 |
| Adeno | RB1 | 12 | 6.61 | 2.15 | 12 | 0.74 | 3.61 |
| Adeno | STK11 | 28 | 4.12 | 1.43 | 26 | 0.30 | 3.60 |
| Adeno | ENHO | 1 | 0.7 | 0.27 | 1 | 0.03 | 3.42 |
| Adeno | KRTAP19-2 | 1 | 0.43 | 0.68 | 2 | 0.06 | 3.36 |
| Adeno | KRTAP19-4 | 2 | 0.67 | 0.96 | 3 | 0.09 | 3.32 |
| Adeno | KRTAP6-2 | 10 | 0.57 | 3.25 | 0 | 0.07 | |
| Adeno | BRAF | 24 | 6.03 | 3.23 | 2 | 0.62 | 1.40 |
| Adeno | CD109 | 25 | 10.2 | 3.22 | 2 | 1.02 | 1.39 |
| Adeno | DEFB119 | 7 | 0.67 | 3.20 | 0 | 0.06 | |
| Adeno | BICRA | 8 | 15.6 | 0.77 | 4 | 0.70 | 3.18 |
| Adeno | FXYD7 | 1 | 0.68 | 0.43 | 1 | 0.03 | 3.16 |
| Adeno | ARID1B | 23 | 21.41 | 3.16 | 3 | 1.63 | 2.55 |
| Adeno | GNG13 | 6 | 0.55 | 3.14 | 0 | 0.06 | |
| Adeno | RPS29 | 1 | 0.58 | 0.64 | 1 | 0.03 | 3.14 |
| Adeno | HSPA12A | 16 | 5.91 | 3.12 | 1 | 0.47 | 1.21 |
| Adeno | URGCP-MRPS24 | 2 | 1.08 | 0.67 | 3 | 0.11 | 3.10 |
| Adeno | DMXL1 | 27 | 21.7 | 3.09 | 4 | 2.19 | 2.08 |
| Adeno | DACT1 | 19 | 7.71 | 3.08 | 0 | 0.60 | |
| Adeno | ATP5F1E | 0 | 0.35 | 1 | 0.04 | 3.04 | |
| Adeno | ADGRB1 | 18 | 15.8 | 3.04 | 1 | 1.05 | 1.52 |
| Adeno | CHST9 | 5 | 0.52 | 3.03 | 0 | 0.06 | |
| Adeno | SATB2 | 19 | 6.25 | 3.01 | 3 | 0.55 | 2.35 |
| Squamous | CDKN2A | 34 | 2.05 | 3.13 | 27 | 0.09 | 5.79 |
| Squamous | TP53 | 233 | 1.97 | 5.13 | 33 | 0.16 | 4.59 |
| Squamous | RASA1 | 12 | 10.05 | 2.20 | 9 | 0.87 | 3.67 |
| Squamous | SPANXN1 | 9 | 0.65 | 3.60 | 1 | 0.08 | 2.07 |
| Squamous | HLA-A | 7 | 4.26 | 1.86 | 5 | 0.30 | 3.55 |
| Squamous | DEFB110 | 4 | 0.56 | 2.72 | 2 | 0.06 | 3.46 |
| Squamous | DEFB106A | 1 | 0.55 | 0.90 | 1 | 0.03 | 3.43 |
| Squamous | KCNN2 | 24 | 5.85 | 3.39 | 1 | 0.41 | 1.26 |
| Squamous | SLC35G3 | 4 | 3.41 | 1.21 | 3 | 0.18 | 3.37 |
| Squamous | NEFM | 24 | 9.55 | 3.37 | 2 | 1.12 | 1.46 |
| Squamous | LCE3D | 4 | 1.05 | 1.89 | 2 | 0.06 | 3.35 |
| Squamous | BICRA | 3 | 18.11 | 1.11 | 2 | 0.77 | 3.31 |
| Squamous | PASK | 20 | 13.91 | 3.25 | 0 | 1.08 | |
| Squamous | SEC61G | 2 | 0.61 | 1.69 | 1 | 0.03 | 3.23 |
| Squamous | KRTAP21-1 | 8 | 0.78 | 3.20 | 1 | 0.05 | 2.68 |
| Squamous | TSHZ2 | 21 | 10.31 | 3.17 | 3 | 0.86 | 2.45 |
| Squamous | CPAMD8 | 17 | 21.31 | 3.16 | 2 | 1.40 | 2.46 |
| Squamous | ARID1A | 14 | 22.9 | 1.72 | 8 | 1.60 | 3.09 |
| Squamous | KLB | 19 | 10.41 | 3.06 | 0 | 0.86 | |
| Squamous | FOXI2 | 2 | 3.93 | 0.41 | 2 | 0.19 | 3.06 |
| Squamous | CFH | 29 | 11.51 | 3.06 | 6 | 1.33 | 2.41 |
| Squamous | H3F3A | 1 | 1.51 | -0.40 | 2 | 0.08 | 3.05 |
| Squamous | TMPRSS9 | 15 | 11.91 | 3.04 | 2 | 0.76 | 2.56 |
| Squamous | ITGB4 | 16 | 20.62 | 3.02 | 0 | 1.31 | |
| Squamous | SAGE1 | 24 | 8.72 | 3.02 | 2 | 0.62 | 1.81 |
| Squamous | RPL39L | 0 | 0.48 | 1 | 0.04 | 3.02 | |
| Small cell | TP53 | 106 | 0.51 | 6.36 | 19 | 0.04 | 4.74 |
| Small cell | KIAA1211 | 31 | 3.14 | 3.92 | 1 | 0.29 | 0.39 |
| Small cell | SPHKAP | 34 | 3.69 | 3.88 | 1 | 0.31 | 0.37 |
| Small cell | MUC12 | 26 | 12.05 | 3.77 | 1 | 0.82 | 1.05 |
| Small cell | POLR2K | 3 | 0.11 | 3.60 | 0 | 0.01 | |
| Small cell | BLCAP | 0 | 0.19 | 2 | 0.01 | 3.43 | |
| Small cell | KLK8 | 2 | 0.08 | 3.41 | 0 | 0.01 | |
| Small cell | KRTAP23-1 | 3 | 0.13 | 3.33 | 0 | 0.01 | |
| Small cell | FAM47C | 22 | 2.62 | 3.33 | 1 | 0.19 | 0.52 |
| Small cell | OTOF | 19 | 5.07 | 3.30 | 1 | 0.35 | 0.84 |
| Small cell | ZNF208 | 28 | 2.43 | 3.27 | 4 | 0.33 | 1.02 |
| Small cell | NPAS3 | 17 | 2.47 | 3.19 | 0 | 0.16 | |
| Small cell | MYO16 | 17 | 4.28 | 3.15 | 1 | 0.33 | 0.70 |
| Small cell | CACNA1I | 15 | 5.79 | 3.14 | 0 | 0.32 | |
| Small cell | ALG10B | 5 | 0.27 | 3.12 | 0 | 0.02 | |
| Small cell | CD1E | 5 | 0.28 | 3.05 | 1 | 0.02 | 1.71 |
| Small cell | PCDHA3 | 14 | 2.38 | 3.03 | 1 | 0.16 | 0.88 |
| Small cell | HMCN1 | 18 | 11.98 | 3.02 | 3 | 0.97 | 1.89 |
Three candidate genes, ARID1A, BICRA and TP53, were shared by adenocarcinoma and squamous cell carcinoma. Small cell lung cancer shared only TP53 with adenocarcinoma and squamous cell carcinoma (Figure 4, left panel). When the threshold for candidate genes was lowered to 2.5, the number of shared genes increased to 7 for adenocarcinoma and squamous cell carcinoma, and to 4 between adenocarcinoma and small cell lung cancer and between squamous cell carcinoma and small cell lung cancer (Figure 4, right panel).
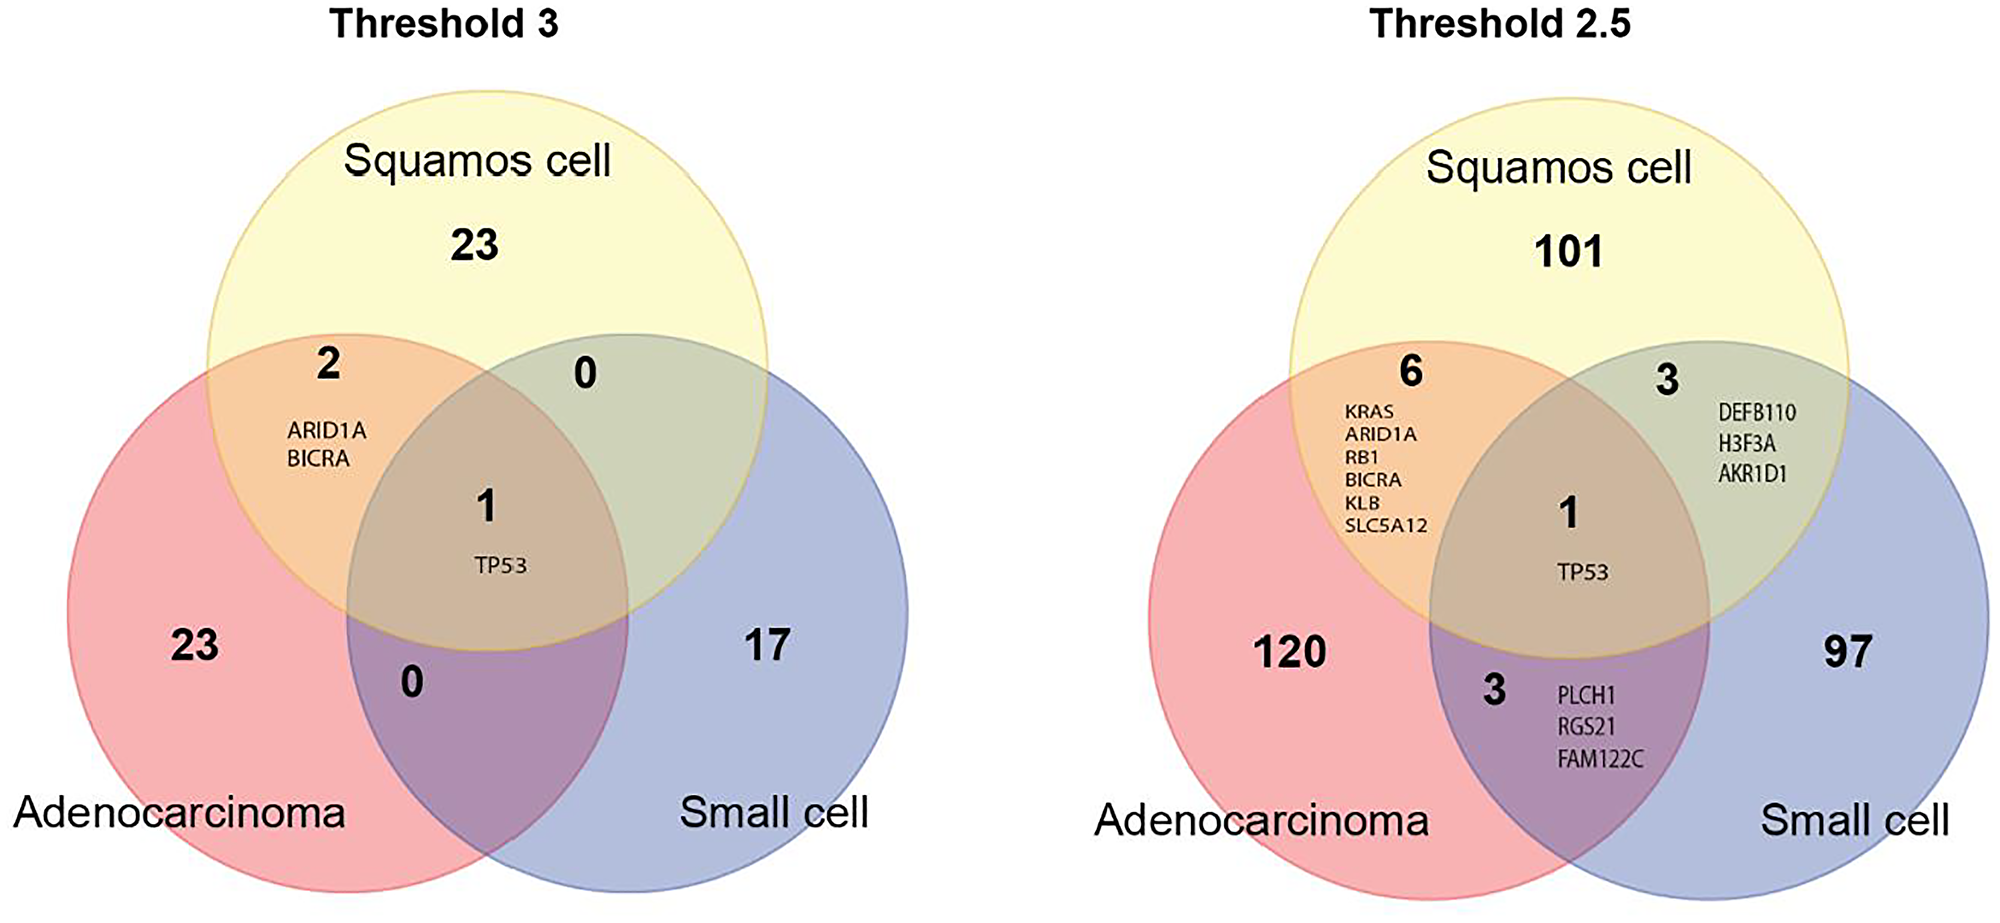
Figure 4: Venn diagram of candidate genes for the three major lung cancer cell types identified using the very strict threshold of 3 (left panel) and a more liberal threshold of 2.5 (right panel).
DISCUSSION
There are two major novel elements in approach we have used in this study: (1) Using the exact number of potential sites for missense, silent and nonsense mutations in individual human transcripts determined by the in silico approach, instead of the size of transcript, a predictor typically used as a proxy for the number of mutation sites. (2) Using only silent mutations rather than all mutations together to estimate nucleotide context-dependent mutability to avoid biases related to selection of functional somatic mutations. These two elements improve the assessment of the expected number of somatic mutations which is critical for the identification of genes with an excess of potentially functional missense and nonsense mutations in them.
We found a two orders of magnitude variation in mutation rates across NCD-SNSs (see Supplementary Figure 1 and Supplementary Table 1). NCD-SNSs with highest mutation rates were G>T_CGG, G>T_CGT, G>T_GGG for adenocarcinoma, C>T_TCG, G>T_CGG, G>A_CGA for squamous cell carcinoma, and G>T_CGG, G>T_CGT, and G>T_CGC for small cell lung cancer. The results are consistent with reported mutation signatures for all histologies analyzed together [14–16].
Squamous cell carcinoma had the highest mutation rate followed by small cell lung cancer and adenocarcinoma. The pattern supports epidemiological conclusions that squamous and small cell lung cancers are more strongly associated with smoking, a well-known mutagenic factor, than adenocarcinoma [17, 18]. This indicates that differences in tobacco smoke exposure contribute to the differences in overall mutation rates among the three major LC cell types.
The observed number of missense and nonsense mutations per site per sample compared to that of silent mutations may be used as a global estimate of selection, a higher mutation density suggesting a positive selection and a lower one – a negative selection. The results of the analysis indicate that both missense and nonsense mutations are positively selected for at an overall similar level [19]. Positive selection for missense and nonsense mutations appears to be stronger in small cell lung cancer compared to adenocarcinoma and squamous cell carcinoma (Figure 1C).
Based on the observed large variation in mutation rates among NCD-SNSs we expected that accounting for the mutation rate might improve the prediction of the number of mutations based on the number of potential sites in the transcript. We found that indeed accounting for the mutation rates improves the estimates of the expected number of missense and nonsense mutations across the three major lung cancer cell types. The excess of potentially functional mutations in a gene indicates that they are positively selected for and that the gene is cancer-relevant. The approach we have used is easily applicable to other cancer types, provided that there are enough somatic mutation data generated by exome wide mutation detection methods.
We found seven genes, TP53, KRAS, ARID1A, RB1, BICRA, KLB and SLC5A12 common for adenocarcinoma and squamous cell carcinoma. TP53 is a known cancer-gene commonly mutated in many cancer types including lung cancer [20]. KRAS plays an important role in lung cancer and other types of cancer [21, 22]. AT-Rich Interaction Domain 1A – ARID1A gene is a member of the SWI/SNF family regulators of transcription by altering the chromatin structure. ARID1A is shown to have a tumor suppressor activity [23], which is consistent with our observation of an excess of nonsense mutations in it. BRD4 Interacting Chromatin Remodeling Complex Associated Protein (BICRA) is a component of SWI/SNF chromatin remodeling complex. So far there is no published evidence that this gene is associated with cancer risk or development. The retinoblastoma susceptibility gene (RB1) is a known tumor suppressor gene involved in lung cancer development [24, 25]. Klotho Beta-Like Protein – KLB gene plays a role in immune response (cytokine signaling) [26]. The literature on the role of KLD in lung cancer is rather limited, though a recent study [27] found that overexpression of KLB inhibits lung tumor growth in vivo. Solute Carrier Family 5 Member 12 - SLC5A12 gene plays a role as an ion and glucose transporter. There is no published evidence that the gene is involved in lung tumorigenesis. However, a recent study [28] found that SLC5A12 is a prognostic marker in head and neck squamous cell carcinoma.
Small cell lung cancer shows less overlap with both adenocarcinoma and squamous cell carcinoma which is consistent with the fact that small cell lung cancer overall differs from non-small lung cancer [29]. We found four genes shared by squamous cell carcinoma and small cell lung cancer: TP53, DEFB110, H3F3A and AKR1D1. Defensin Beta 110 – DEFB110 gene plays a role in innate immune system [30]. The gene may be considered as a novel lung cancer gene candidate since there is no published evidence for its involvement in cancer. H3.3 Histone A – H3F3A gene encodes H3 histone. H3F3A has been shown to promote lung cancer cell migration [31]. Aldo-Keto Reductase Family 1 Member D1 - AKR1D1 gene is involved in synthesis of steroid hormones. At present there is no published evidence that the gene is involved in cancer development.
We found four genes shared by adenocarcinoma and small cell lung cancer: TP53, PLCH1, RGS21 and FAM122C. Phospholipase C Eta 1 – PLCH1 gene plays a key role in inositol synthesis. There is no evidence for the gene’s involvement in cancer. Regulator Of G Protein Signaling 21 – RGS21 gene encodes structural components of G protein-coupled receptor complexes. Currently there is no published evidence that RGS21 is involved in cancer development. PABIR Family Member 3 – FAM122C gene has serine/threonine phosphatase inhibitor activity. There is no published evidence that this gene is associated with cancer risk or development. Therefore, our analysis identified known and novel candidate cancer genes common for three major lung cancer cell types. The complete list of candidate genes for all the three histologies can be found in Supplementary Table 2.
We found that nucleotide context (adjacent nucleotides) strongly influence mutability. We noted a significant variation among the three major lung cancer histologies for the absolute majority of the nucleotide context dependent single nucleotide substitutions (Supplementary Figure 1). These findings emphasize the importance of the cancer and histology type-specific estimates of mutability for the prediction of the expected number of somatic mutations in transcripts.
Limitations of the analysis
Our analysis does not directly include gene characteristic, for example gene expression level, associated with mutability as independent predictors of the number of somatic mutation in the gene.
Materials and Methods
Data used
We used somatic mutations data from the Catalog Of Somatic Mutations In Cancer (COSMIC) database [32, 33]. Only verified mutations (those with confirmed somatic origin) were used. To ensure that all genes were targeted equally, only somatic mutations detected by whole genome/whole exome sequences were used in the analysis. The database was accessed September 15, 2021. Lung cancer somatic mutation data were available for 40,021 transcripts from 18,622 genes. Table 2 shows the number of missense, silent and nonsense mutations for each histology.
Table 2: Numbers of missense, silent and nonsense mutations per sample
| Histology | Number of samples | Number of mutations per sample | |||
|---|---|---|---|---|---|
| Missense | Silent | Nonsense | All | ||
| Adenocarcinoma | 902 | 236.74 | 74.68 | 19.63 | 331.04 |
| Squamous cell carcinoma | 723 | 326.54 | 117.48 | 26.04 | 470.07 |
| Small cell lung cancer | 210 | 379.45 | 85.70 | 29.32 | 494.46 |
The three major histological types of lung cancer, adenocarcinoma, squamous cell carcinoma and small cell carcinoma, were analyzed separately. For adenocarcinoma, data for 902 tumors from 17 studies were used. The corresponding numbers for squamous cell carcinoma were 723 tumors from 8 studies, and for small cell lung cancer, 210 tumors from 8 studies. The PubMed IDs of the published studies whose data were used in this study are shown in Supplementary Materials.
Nucleotide context-dependent single nucleotide substitutions (NCD-SNSs)
It is known that the mutation rate of a given single nucleotide substitution (SNS) depends on the adjacent nucleotides [34, 35]. Therefore, we estimated mutation rates in a nucleotide context-dependent (NCD) way. In total, 64 trinucleotides are possible in the human genome. There are three possible substitutions for the core (middle) nucleotide, which gives the total number of possible NCD-SNSs 64 × 3 = 192. We analyzed these 192 NCD-SNS separately. All mutations were annotated for the sense strand.
Estimating the numbers of potential sites for silent, missense and nonsense mutations generated by individual NCD-SNSs
Reference sequences were downloaded from the Consensus Coding Sequence Database [36]. To estimate the number of potential sites for each mutation type, we considered all possible trinucleotides in each transcript. For each trinucleotide we computationally mutated the core nucleotide into 3 possible SNSs by replacing it with a different nucleotide. SNS may produce missense, silent or nonsense mutations depending on the type of SNS, e.g. A>T, and the position within the trinucleotide. For each of all possible 192 NCD-SNSs we counted the numbers of possible SNSs producing missense, silent and nonsense mutations and used them as the numbers of potential sites for each transcript. Supplementary Figure 3 illustrates the approach of counting the number of potential sites for missense, silent and nonsense mutations for different NCD-SNSs.
Estimation of mutation rates for NCD-SNSs
Mutation rates were computed as the ratio of the observed number of silent mutations to the corresponding number of potential sites across the whole genome, divided by the total number of analyzed samples. For 30 NCD-SNSs it is impossible to generate silent mutations, and the number of potential sites for silent mutations for such NCD-SNSs equals zero. The list of these NCD-SNSs is shown in Supplementary Text. We used missense mutations to estimate mutation rates for NCD-SNS with zero numbers of potential sites for silent mutations. To do this we applied a linear regression model. For 162 NCD-SNSs for which both missense and silent mutations are available, we built a linear regression model with the mutation frequency based on the analysis of silent mutations as the outcome and the mutation frequency based on the analysis of missense mutations as the predictor. We used the regression equation to predict mutation rates for the 30 NCD-SNSs unable to produce silent mutations.
Analysis of the association between the number of potential sites and the observed number of likely functional missense and nonsense mutations
For each transcript, Pearson’s correlation coefficients (ρ) between the number of potential sites and the observed number of mutations were computed across 192 NCD-SNSs. This was done separately for missense and nonsense mutations. We also computed the correlations between the observed numbers of mutations and the number of sites for NCD-SNS weighted (multiplied) by the corresponding mutation rate. Supplementary Figure 4 shows how the correlations were computed. As the next step, we compared the distributions of ρ for the weighted and unweighted number of sites. The goal of the comparison was to test if accounting for the mutation rate improves the prediction of the observed number of mutations.
The expected numbers of missense and nonsense mutations in a transcript
The expected number of somatic mutations was computed assuming that the chances to find missense and nonsense mutations are the same as chances for silent mutations. To compute the expected number of mutations in a transcript, the numbers of sites for missense and nonsense mutations were multiplied by the corresponding mutation rates. The sum of the products across the 192 NCD-SNSs gives the expected number of mutations in the transcript:
Logarithms of the ratios of the observed to the expected number of mutations
Our hypothesis was that genes with the excess of missense and/or nonsense mutations are cancer-related. We used LOG of the ratio of the observed to the expected numbers of mutations as a measure of the excess of somatic mutations in transcript. To account for gene characteristics that may influence the mutation rate in a gene-specific manner, we adjusted the LOG ratios for missense and nonsense mutations by the LOG ratios for silent mutations. This was done by subtracting LOG ratios for silent mutations from the LOG ratios for missense and nonsense mutations. Our rationale for doing it was that if a gene has a high intrinsic propensity to mutate, this gene will have a high LOG ratio for silent mutations, so subtracting it from the LOG ratio for missense or nonsense mutations will provide an adjustment for the gene’s overall higher propensity to mutate.
ACKNOWLEDGMENTS
We would like to thank members of the Institute for Clinical & Translational Research (Baylor College of Medicine) for helpful discussion of the study. This work was supported in part by the National Institutes of Health https://www.nih.gov/grant U19 CA148127 to CIA, Cancer Prevention and Research Institute of Texas RR170048 to CIA, R01 CA231141 to OYG, and P01 CA206980-01A1 to IPG.
CONFLICTS OF INTEREST
The authors declare no conflicts of interest. The funders had no role in the design of the study; in the collection, analyses, or interpretation of data; in the writing of the manuscript, or in the decision to publish the results.
References
1. Lawrence MS, Stojanov P, Polak P, Kryukov GV, Cibulskis K, Sivachenko A, Carter SL, Stewart C, Mermel CH, Roberts SA, Kiezun A, Hammerman PS, McKenna A, et al. Mutational heterogeneity in cancer and the search for new cancer-associated genes. Nature. 2013; 499:214–18. https://doi.org/10.1038/nature12213. [PubMed].
2. Martincorena I, Campbell PJ. Somatic mutation in cancer and normal cells. Science. 2015; 349:1483–89. https://doi.org/10.1126/science.aab4082. [PubMed].
3. Gorlov IP, Pikielny CW, Frost HR, Her SC, Cole MD, Strohbehn SD, Wallace-Bradley D, Kimmel M, Gorlova OY, Amos CI. Gene characteristics predicting missense, nonsense and frameshift mutations in tumor samples. BMC Bioinformatics. 2018; 19:430. https://doi.org/10.1186/s12859-018-2455-0. [PubMed].
4. Alexandrov LB, Nik-Zainal S, Siu HC, Leung SY, Stratton MR. A mutational signature in gastric cancer suggests therapeutic strategies. Nat Commun. 2015; 6:8683. https://doi.org/10.1038/ncomms9683. [PubMed].
5. Chevalier A, Yang S, Khurshid Z, Sahelijo N, Tong T, Huggins JH, Yajima M, Campbell JD. The Mutational Signature Comprehensive Analysis Toolkit (musicatk) for the Discovery, Prediction, and Exploration of Mutational Signatures. Cancer Res. 2021; 81:5813–17. https://doi.org/10.1158/0008-5472.CAN-21-0899. [PubMed].
6. Lawrence L, Kunder CA, Fung E, Stehr H, Zehnder J. Performance Characteristics of Mutational Signature Analysis in Targeted Panel Sequencing. Arch Pathol Lab Med. 2021; 145:1424–31. https://doi.org/10.5858/arpa.2020-0536-OA. [PubMed].
7. Li XC, Wang MY, Yang M, Dai HJ, Zhang BF, Wang W, Chu XL, Wang X, Zheng H, Niu RF, Zhang W, Chen KX. A mutational signature associated with alcohol consumption and prognostically significantly mutated driver genes in esophageal squamous cell carcinoma. Ann Oncol. 2018; 29:938–44. https://doi.org/10.1093/annonc/mdy011. [PubMed].
8. Haradhvala NJ, Polak P, Stojanov P, Covington KR, Shinbrot E, Hess JM, Rheinbay E, Kim J, Maruvka YE, Braunstein LZ, Kamburov A, Hanawalt PC, Wheeler DA, et al. Mutational Strand Asymmetries in Cancer Genomes Reveal Mechanisms of DNA Damage and Repair. Cell. 2016; 164:538–49. https://doi.org/10.1016/j.cell.2015.12.050. [PubMed].
9. Xia B, Yanai I. Gene expression levels modulate germline mutation rates through the compound effects of transcription-coupled repair and damage. Hum Genet. 2021 Sep 5. [Epub ahead of print]. https://doi.org/10.1007/s00439-021-02355-3. [PubMed].
10. Koren A, Polak P, Nemesh J, Michaelson JJ, Sebat J, Sunyaev SR, McCarroll SA. Differential relationship of DNA replication timing to different forms of human mutation and variation. Am J Hum Genet. 2012; 91:1033–40. https://doi.org/10.1016/j.ajhg.2012.10.018. [PubMed].
11. Campbell JD, Lathan C, Sholl L, Ducar M, Vega M, Sunkavalli A, Lin L, Hanna M, Schubert L, Thorner A, Faris N, Williams DR, Osarogiagbon RU, et al. Comparison of Prevalence and Types of Mutations in Lung Cancers Among Black and White Populations. JAMA Oncol. 2017; 3:801–9. https://doi.org/10.1001/jamaoncol.2016.6108. [PubMed].
12. Izumi M, Oyanagi J, Sawa K, Fukui M, Ogawa K, Matsumoto Y, Tani Y, Suzumura T, Watanabe T, Kaneda H, Mitsuoka S, Asai K, Ohsawa M, et al. Mutational landscape of multiple primary lung cancers and its correlation with non-intrinsic risk factors. Sci Rep. 2021; 11:5680. https://doi.org/10.1038/s41598-021-83609-y. [PubMed].
13. Lusk CM, Watza D, Dyson G, Craig D, Ratliff V, Wenzlaff AS, Lonardo F, Bollig-Fischer A, Bepler G, Purrington K, Gadgeel S, Schwartz AG. Profiling the Mutational Landscape in Known Driver Genes and Novel Genes in African American Non-Small Cell Lung Cancer Patients. Clin Cancer Res. 2019; 25:4300–8. https://doi.org/10.1158/1078-0432.CCR-18-2439. [PubMed].
14. Govindan R, Ding L, Griffith M, Subramanian J, Dees ND, Kanchi KL, Maher CA, Fulton R, Fulton L, Wallis J, Chen K, Walker J, McDonald S, et al. Genomic landscape of non-small cell lung cancer in smokers and never-smokers. Cell. 2012; 150:1121–34. https://doi.org/10.1016/j.cell.2012.08.024. [PubMed].
15. Osoegawa A, Takada K, Okamoto T, Sato S, Nagahashi M, Tagawa T, Tsuchida M, Oki E, Okuda S, Wakai T, Mori M. Mutational signatures in squamous cell carcinoma of the lung. J Thorac Dis. 2021; 13:1075–82. https://doi.org/10.21037/jtd-20-2602. [PubMed].
16. Rizvi NA, Hellmann MD, Snyder A, Kvistborg P, Makarov V, Havel JJ, Lee W, Yuan J, Wong P, Ho TS, Miller ML, Rekhtman N, Moreira AL, et al. Cancer immunology. Mutational landscape determines sensitivity to PD-1 blockade in non-small cell lung cancer. Science. 2015; 348:124–28. https://doi.org/10.1126/science.aaa1348. [PubMed].
17. Barbone F, Bovenzi M, Cavallieri F, Stanta G. Cigarette smoking and histologic type of lung cancer in men. Chest. 1997; 112:1474–79. https://doi.org/10.1378/chest.112.6.1474. [PubMed].
18. Kenfield SA, Wei EK, Stampfer MJ, Rosner BA, Colditz GA. Comparison of aspects of smoking among the four histological types of lung cancer. Tob Control. 2008; 17:198–204. https://doi.org/10.1136/tc.2007.022582. [PubMed].
19. García-Nieto PE, Morrison AJ, Fraser HB. The somatic mutation landscape of the human body. Genome Biol. 2019; 20:298. https://doi.org/10.1186/s13059-019-1919-5. [PubMed].
20. Bouaoun L, Sonkin D, Ardin M, Hollstein M, Byrnes G, Zavadil J, Olivier M. TP53 Variations in Human Cancers: New Lessons from the IARC TP53 Database and Genomics Data. Hum Mutat. 2016; 37:865–76. https://doi.org/10.1002/humu.23035. [PubMed].
21. Ferrer I, Zugazagoitia J, Herbertz S, John W, Paz-Ares L, Schmid-Bindert G. KRAS-Mutant non-small cell lung cancer: From biology to therapy. Lung Cancer. 2018; 124:53–64. https://doi.org/10.1016/j.lungcan.2018.07.013. [PubMed].
22. Herdeis L, Gerlach D, McConnell DB, Kessler D. Stopping the beating heart of cancer: KRAS reviewed. Curr Opin Struct Biol. 2021; 71:136–47. https://doi.org/10.1016/j.sbi.2021.06.013. [PubMed].
23. Sun X, Wang SC, Wei Y, Luo X, Jia Y, Li L, Gopal P, Zhu M, Nassour I, Chuang JC, Maples T, Celen C, Nguyen LH, et al. Arid1a Has Context-Dependent Oncogenic and Tumor Suppressor Functions in Liver Cancer. Cancer Cell. 2017; 32:574–89.e6. https://doi.org/10.1016/j.ccell.2017.10.007. [PubMed].
24. Offin M, Chan JM, Tenet M, Rizvi HA, Shen R, Riely GJ, Rekhtman N, Daneshbod Y, Quintanal-Villalonga A, Penson A, Hellmann MD, Arcila ME, Ladanyi M, et al. Concurrent RB1 and TP53 Alterations Define a Subset of EGFR-Mutant Lung Cancers at risk for Histologic Transformation and Inferior Clinical Outcomes. J Thorac Oncol. 2019; 14:1784–93. https://doi.org/10.1016/j.jtho.2019.06.002. [PubMed].
25. Arakawa S, Yoshida T, Shirasawa M, Takayanagi D, Yagishita S, Motoi N, Ohe Y. RB1 loss induced small cell lung cancer transformation as acquired resistance to pembrolizumab in an advanced NSCLC patient. Lung Cancer. 2021; 151:101–3. https://doi.org/10.1016/j.lungcan.2020.11.016. [PubMed].
26. Ming AY, Yoo E, Vorontsov EN, Altamentova SM, Kilkenny DM, Rocheleau JV. Dynamics and Distribution of Klothoβ (KLB) and fibroblast growth factor receptor-1 (FGFR1) in living cells reveal the fibroblast growth factor-21 (FGF21)-induced receptor complex. J Biol Chem. 2012; 287:19997–20006. https://doi.org/10.1074/jbc.M111.325670. [PubMed].
27. Li F, Li X, Li Z, Ji W, Lu S, Xia W. βKlotho is identified as a target for theranostics in non-small cell lung cancer. Theranostics. 2019; 9:7474–89. https://doi.org/10.7150/thno.35582. [PubMed].
28. Chen L, He X, Yi S, Liu G, Liu Y, Ling Y. Six Glycolysis-Related Genes as Prognostic Risk Markers Can Predict the Prognosis of Patients with Head and Neck Squamous Cell Carcinoma. Biomed Res Int. 2021; 2021:8824195. https://doi.org/10.1155/2021/8824195. [PubMed].
29. Rudin CM, Brambilla E, Faivre-Finn C, Sage J. Small-cell lung cancer. Nat Rev Dis Primers. 2021; 7:3. https://doi.org/10.1038/s41572-020-00235-0. [PubMed].
30. Machado LR, Ottolini B. An evolutionary history of defensins: a role for copy number variation in maximizing host innate and adaptive immune responses. Front Immunol. 2015; 6:115. https://doi.org/10.3389/fimmu.2015.00115. [PubMed].
31. Park SM, Choi EY, Bae M, Kim S, Park JB, Yoo H, Choi JK, Kim YJ, Lee SH, Kim IH. Histone variant H3F3A promotes lung cancer cell migration through intronic regulation. Nat Commun. 2016; 7:12914. https://doi.org/10.1038/ncomms12914. [PubMed].
32. Forbes SA, Tang G, Bindal N, Bamford S, Dawson E, Cole C, Kok CY, Jia M, Ewing R, Menzies A, Teague JW, Stratton MR, Futreal PA. COSMIC (the Catalogue of Somatic Mutations in Cancer): a resource to investigate acquired mutations in human cancer. Nucleic Acids Res. 2010; 38:D652–57. https://doi.org/10.1093/nar/gkp995. [PubMed].
33. Tate JG, Bamford S, Jubb HC, Sondka Z, Beare DM, Bindal N, Boutselakis H, Cole CG, Creatore C, Dawson E, Fish P, Harsha B, Hathaway C, et al. COSMIC: the Catalogue Of Somatic Mutations In Cancer. Nucleic Acids Res. 2019; 47:D941–47. https://doi.org/10.1093/nar/gky1015. [PubMed].
34. Carlson J, Locke AE, Flickinger M, Zawistowski M, Levy S, Myers RM, Boehnke M, Kang HM, Scott LJ, Li JZ, Zöllner S, and BRIDGES Consortium. Extremely rare variants reveal patterns of germline mutation rate heterogeneity in humans. Nat Commun. 2018; 9:3753. https://doi.org/10.1038/s41467-018-05936-5. [PubMed].
35. Dietlein F, Weghorn D, Taylor-Weiner A, Richters A, Reardon B, Liu D, Lander ES, Van Allen EM, Sunyaev SR. Identification of cancer driver genes based on nucleotide context. Nat Genet. 2020; 52:208–18. https://doi.org/10.1038/s41588-019-0572-y. [PubMed].
36. Pujar S, O’Leary NA, Farrell CM, Loveland JE, Mudge JM, Wallin C, Girón CG, Diekhans M, Barnes I, Bennett R, Berry AE, Cox E, Davidson C, et al. Consensus coding sequence (CCDS) database: a standardized set of human and mouse protein-coding regions supported by expert curation. Nucleic Acids Res. 2018; 46:D221–28. https://doi.org/10.1093/nar/gkx1031. [PubMed].