

Introduction
Barrett’s esophagus (BE) develops as a complication of long lasting gastroesophageal reflux disease and represents a premalignant condition, a precursor of distal esophageal adenocarcinoma (EAC). Diagnostic criteria of BE vary in different countries. The British Society of Gastroenterologists [1] and international consensus BOBCAT [2] define BE as any type of columnar metaplasia in the distal esophagus. But the American Gastroenterologist Association [3] and Russian Society of Pathologists [4] require only presence of intestinal metaplasia (IM) for diagnosis of BE. This is due to the fact that 90% of EAC are seen developing form sights of IM [4, 5]. On the other hand, some studies demonstrated that the frequency of malignant progression in gastric metaplasia and IM doesn’t differ [6, 7]. Moreover molecular and genetic profiling revealed that EAC evolves from cardiac metaplasia and not from IM [8].
GC are mature, well differentiated cells, unable to proliferate, which is why they cannot act as neoplasm precursors [9]. Takubo K. et al. [10] were the first to demonstrate that minute EAC are more likely to arise at background of cardiac then intestinal type metaplasia. Watanabe G. et al. [11] suggest that GC (and IM) are an epiphenomenon rather than source of EAC. Development of IM in the distal esophagus is associated with long lasting and intense exposure to acid and bile reflux [6, 12]. Thus, IM developed in 54,8% patients with gastric metaplasia after 5 years of surveillance and in 90,8% patients after 10 years of surveillance [6]. The frequency of IM detection grows with increase of segment length [6, 12–14]. Most likely it’s due to more intense acid [15–17] and bile reflux [17] observed in long segment compared with short segment of BE, as GC are known to represent a protective mechanism against harsh reflux environment in distal esophagus [18, 19]. All these data demonstrate that metaplasia in distal esophagus evolves from gastric (cardiac and oxynto-cardiac) to intestinal in time and space [20–22].
Few studies evaluated the morphometric parameters of GC in BE. Chandrasoma P.T. et al. [23] showed the presence of GC in 100% of biopsy samples taken from the most proximal part of the segment compared with 69% that of the distal part of BE. A high number of crypts containing GC was also demonstrated in the most proximal part compared with the distal segment (65,625% vs. 3,125%) [23].
Using semi-quantitative assessment, Theodorou D. et al. [24] showed that the level of intraluminal pH increases with extension of segment length and is accompanied by a growing number of crypts containing GC. This is influenced by the gradient of solubility of bile acids that is dependent on a mid-pH. The latter is higher in the most proximal part of the segment and causes the most prominent injury to esophageal mucosa. In this area, the number of crypts containing GC is the highest. In the middle portion of the gastral esophageal segment the number of crypts with GC is medium and in the lower portion the number of crypts with GC is the least. Bansal A. et al. [25] established a weak correlation of segment length and number of GC (p < 0,01). Morphometric evaluation of GC count in BE without dysplasia and in dysplastic BE revealed that a lower count of GC is associated with dysplasia and EAC [18, 26, 27].
There are several morphological types BE dysplasia. The most common is adenomatous (intestinal), identified in more than 90% of dysplasia. Rare types of dysplasia include foveolar, serrated and pyloric dysplasia [28–30]. Adenomatous dysplasia is characterized by crowded glands lined with tall columnar epithelium with pencil-like hyperchromatic nuclei with pronounced nuclear stratification, GC presence in dysplastic foci and adjacent mucosa. Foveolar dysplasia may develop on background of gastric metaplasia of distal esophagus, but GC are identified in 57–100% of cases [31, 32]. Foveolar dysplasia consists of tubular glands lined with cuboidal cells with pale clear cytoplasm and round to oval nuclei with hyperchromatosis. In the other study [33], associated adenomatous dysplasia is found in 94% of cases. Serrated dysplasia shares morphological features of conventional adenomatous dysplasia, but is distinct due to the presence of a serrated surface [28]. Pyloric dysplasia demonstrates densely packed glands, lined with cuboidal epithelium with pale eosinophilic cytoplasm with ground-glass features and round nuclei [29, 30].
Though some types of dysplasia may arise from foci of gastric metaplasia, a morphometric study of GC in adjacent mucosa may elicit a possible relationship between GC parameters and type of dysplasia. The aim of our study was to perform morphometric analysis of GC count in patients with different segment length, both with and without dysplasia.
Results
Cohort characteristics
Age of patients in Group 1 ranged from 22 to 81 years, median 50,5 years (40, 75–65, 25 years), including 12 Males and 16 Females (Male-to-Female ratio 1:1,33). Segment length ranged from C0M0,5 to C0M0,9.
Group 2 included 43 patients aged from 18 to 94 years, median 46 years (32, 5–62 years), including 21 males and 22 females (Male-to-Female ratio 1:1,05). Segment length varied from C0M1 to C2M5.
Group 3 included 50 patients, 26 to 93 years of age, median 63 years (51, 25–70 years), 32 males and 18 females (Male-to-Female ratio 1,78:1). Segment length was in range of C0M1 to C15M15.
Group 4 included 18 patients with distal esophageal dysplasia, aged 39 to 80 years, median 68 years (56–70 years), including 13 Males and 5 Females (Male-to-Female ratio 2,6:1). Segment length varied from C2M2 to C13M14. A short segment was seen in 5 patients.
Dysplasia characteristics
Low-grade dysplasia (Figures 1 and 2) was observed in 16 patients and 2 patients showed high-grade dysplasia (Figures 3 and 4). Dysplasia was diagnosed in 17 patients with BE and 1 patient with gastric metaplasia (high-grade dysplasia). Though, patients with gastric type metaplasia and associated foveolar high-grade dysplasia showed foveolar low-grade dysplasia and scarce GC on surveillance biopsy 18 month after baseline EGS.
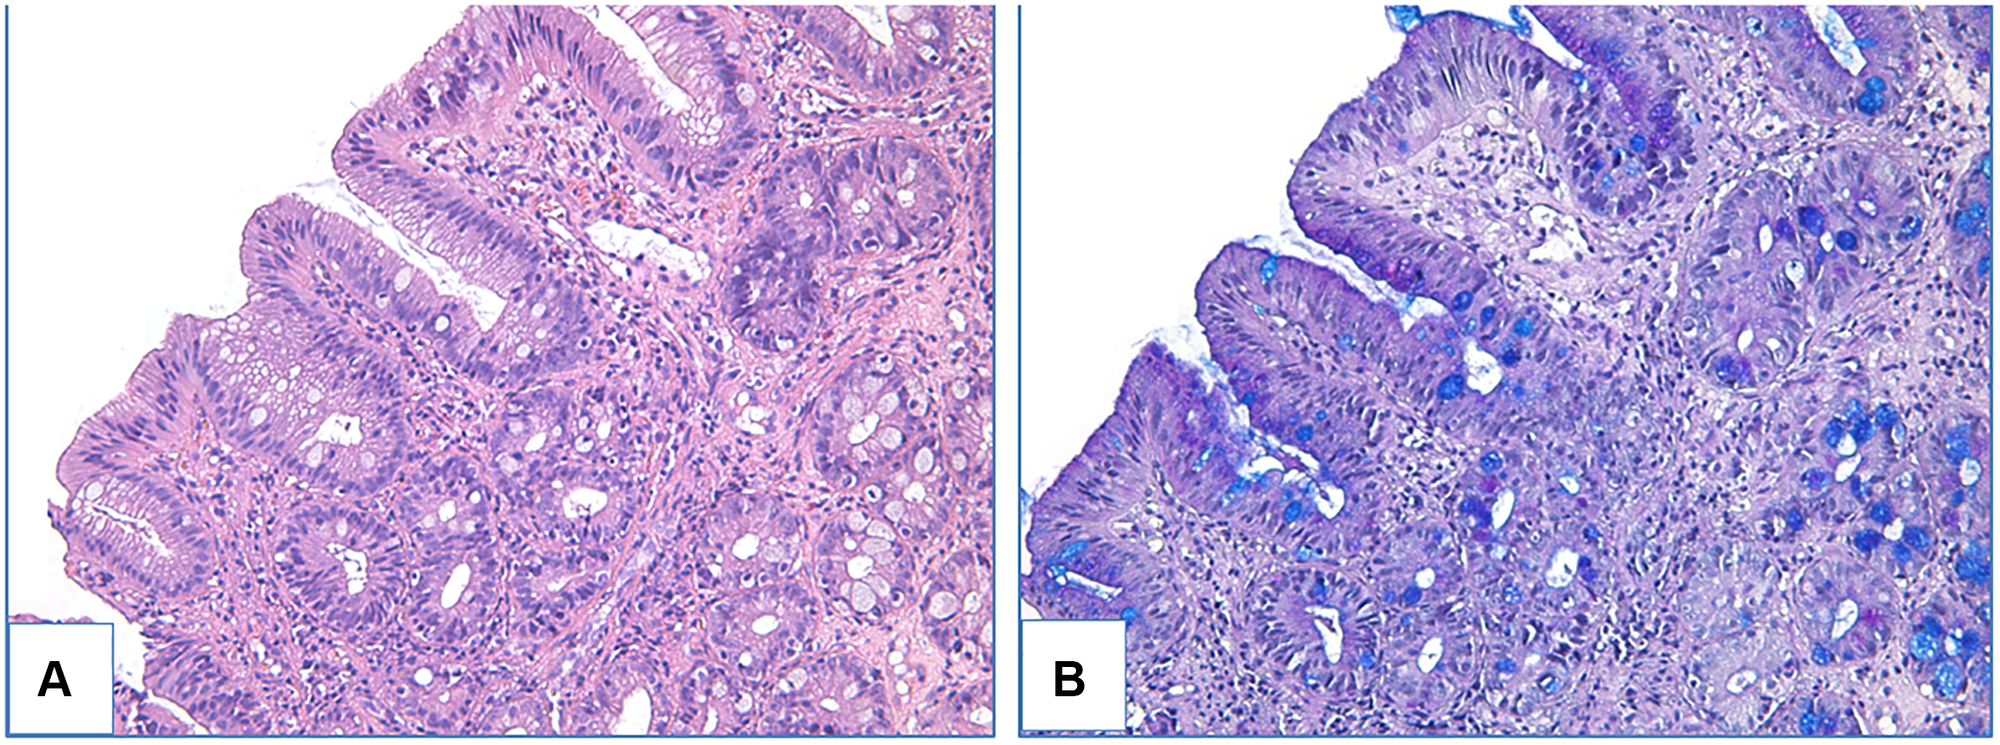
Figure 1: Adenomatous low-grade dysplasia in patient with BE. (A) haematoxylin and eosin staining, (B) PAS-reaction combined with alcian blue staining, magnification ×200.
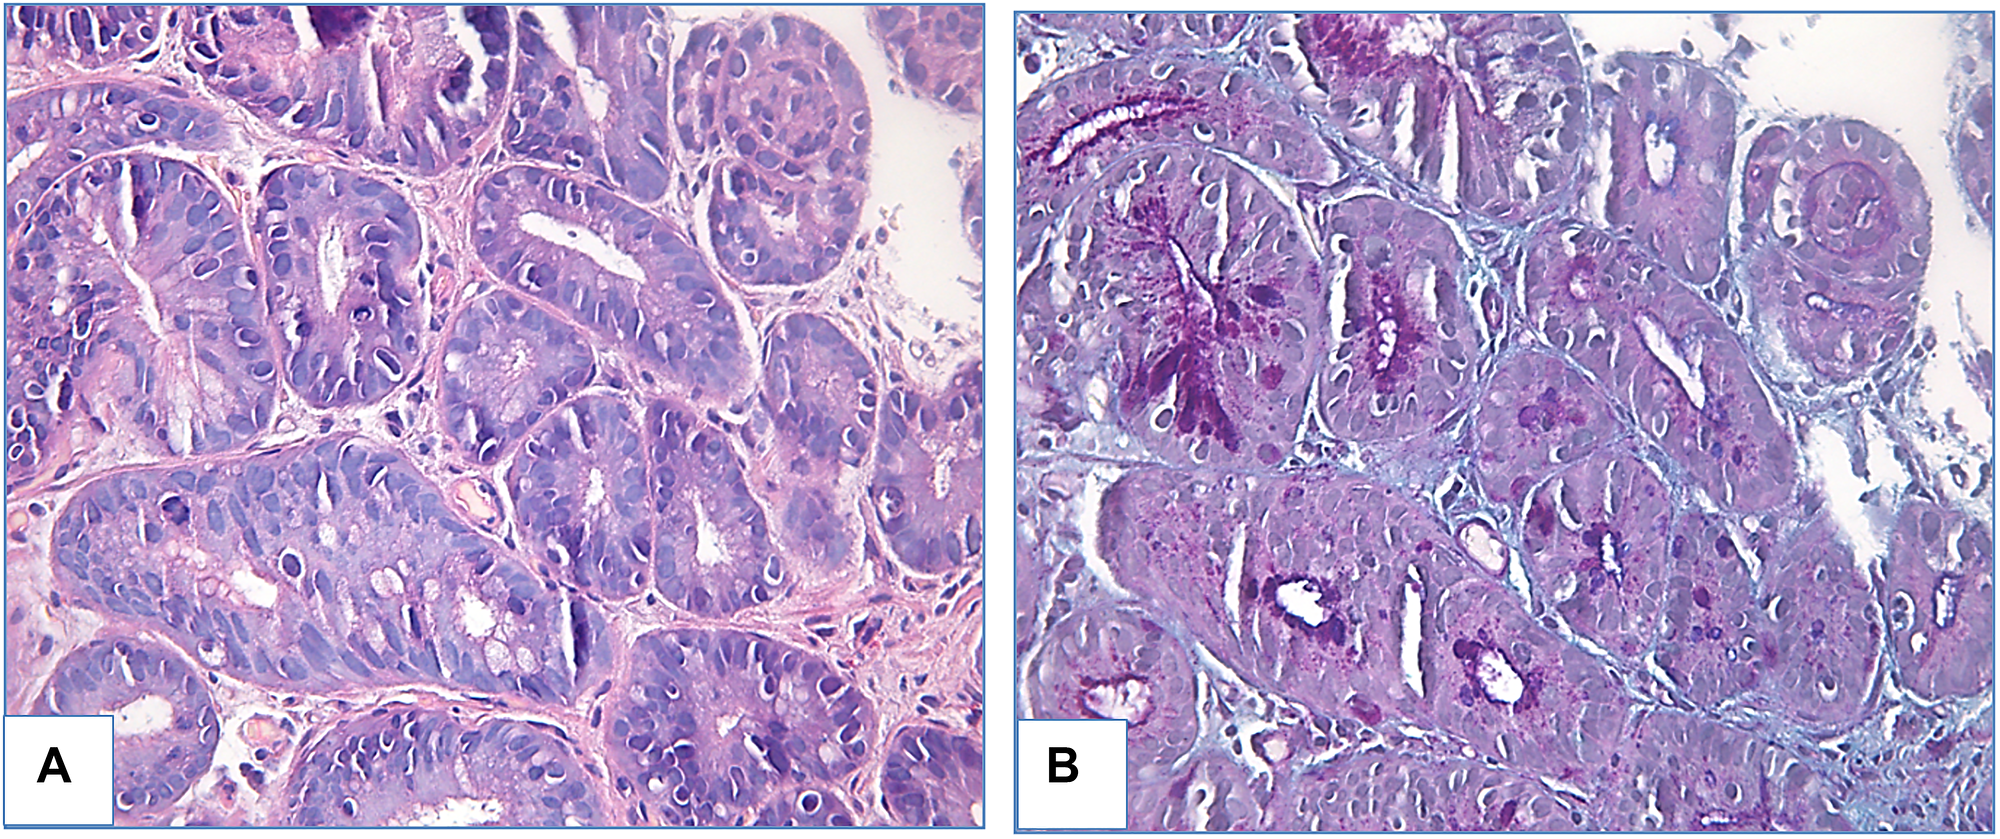
Figure 2: Foveolar low-grade dysplasia in patient with BE. (A) haematoxylin and eosin staining, (B) PAS-reaction combined with alcian blue staining, magnification ×400.
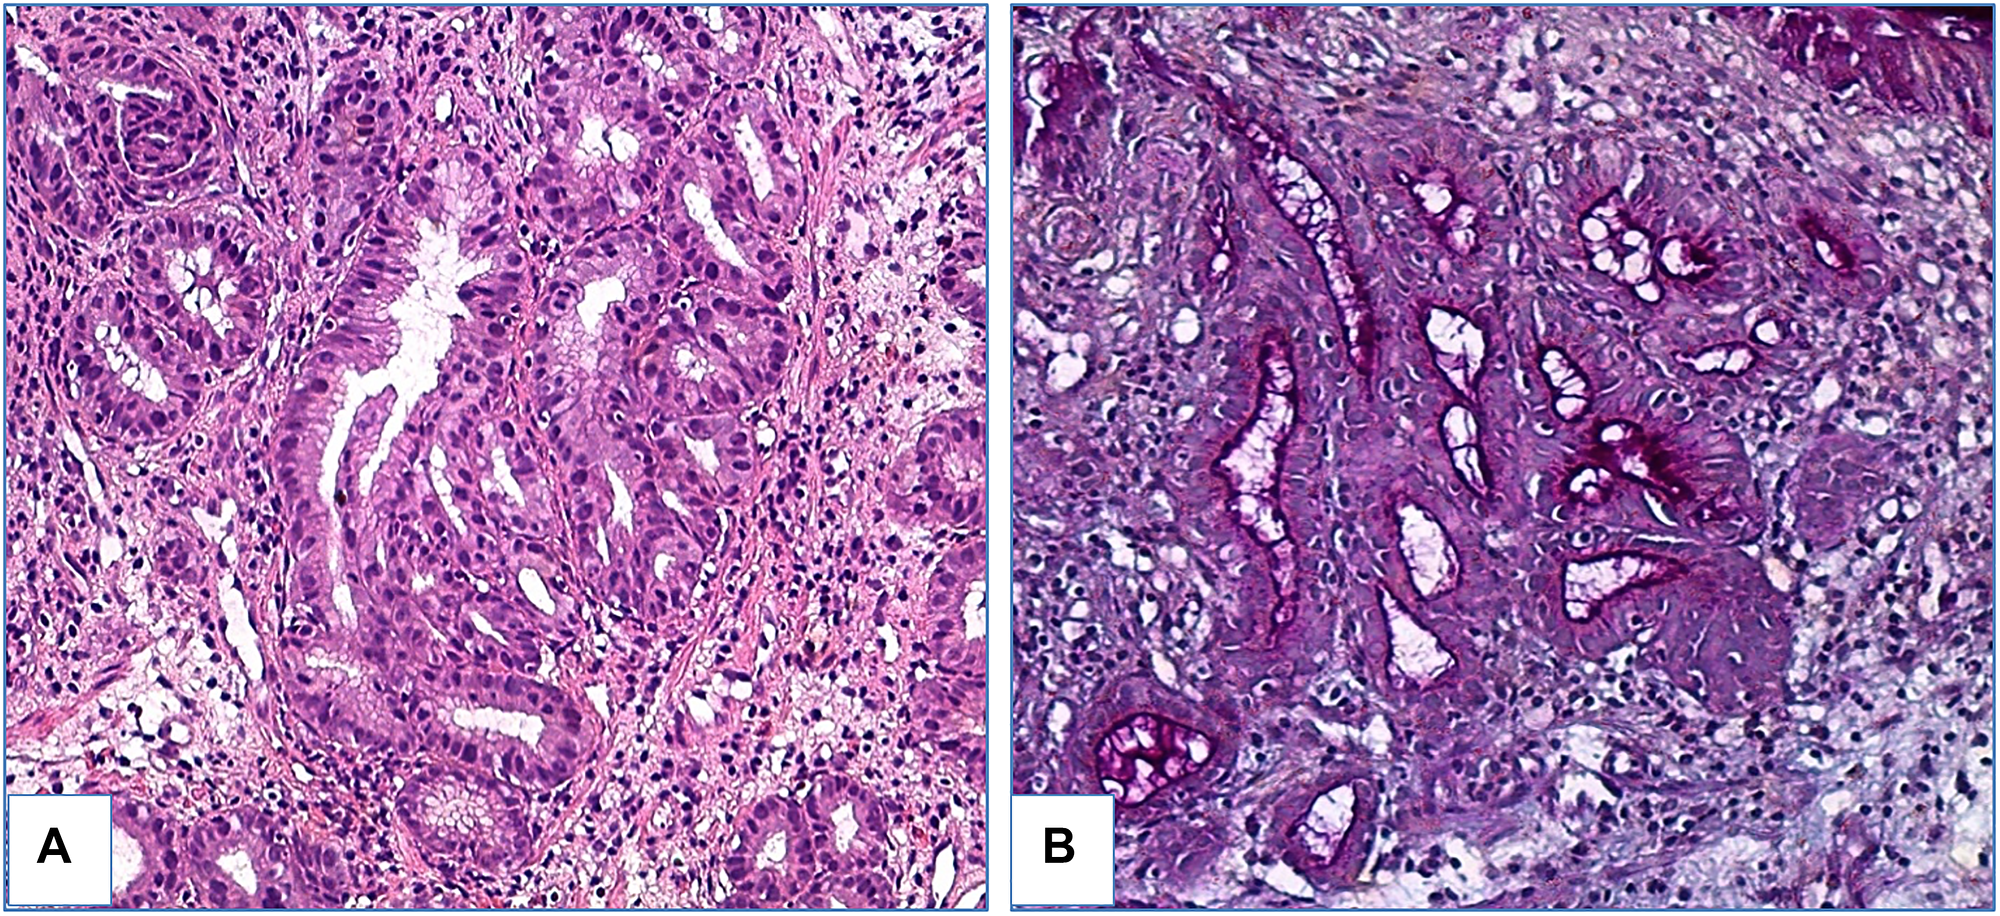
Figure 3: Foveolar high-grade dysplasia in patient with gastric metaplasia. (A) haematoxylin and eosin staining, (B) PAS-reaction combined with alcian blue staining, magnification ×200.
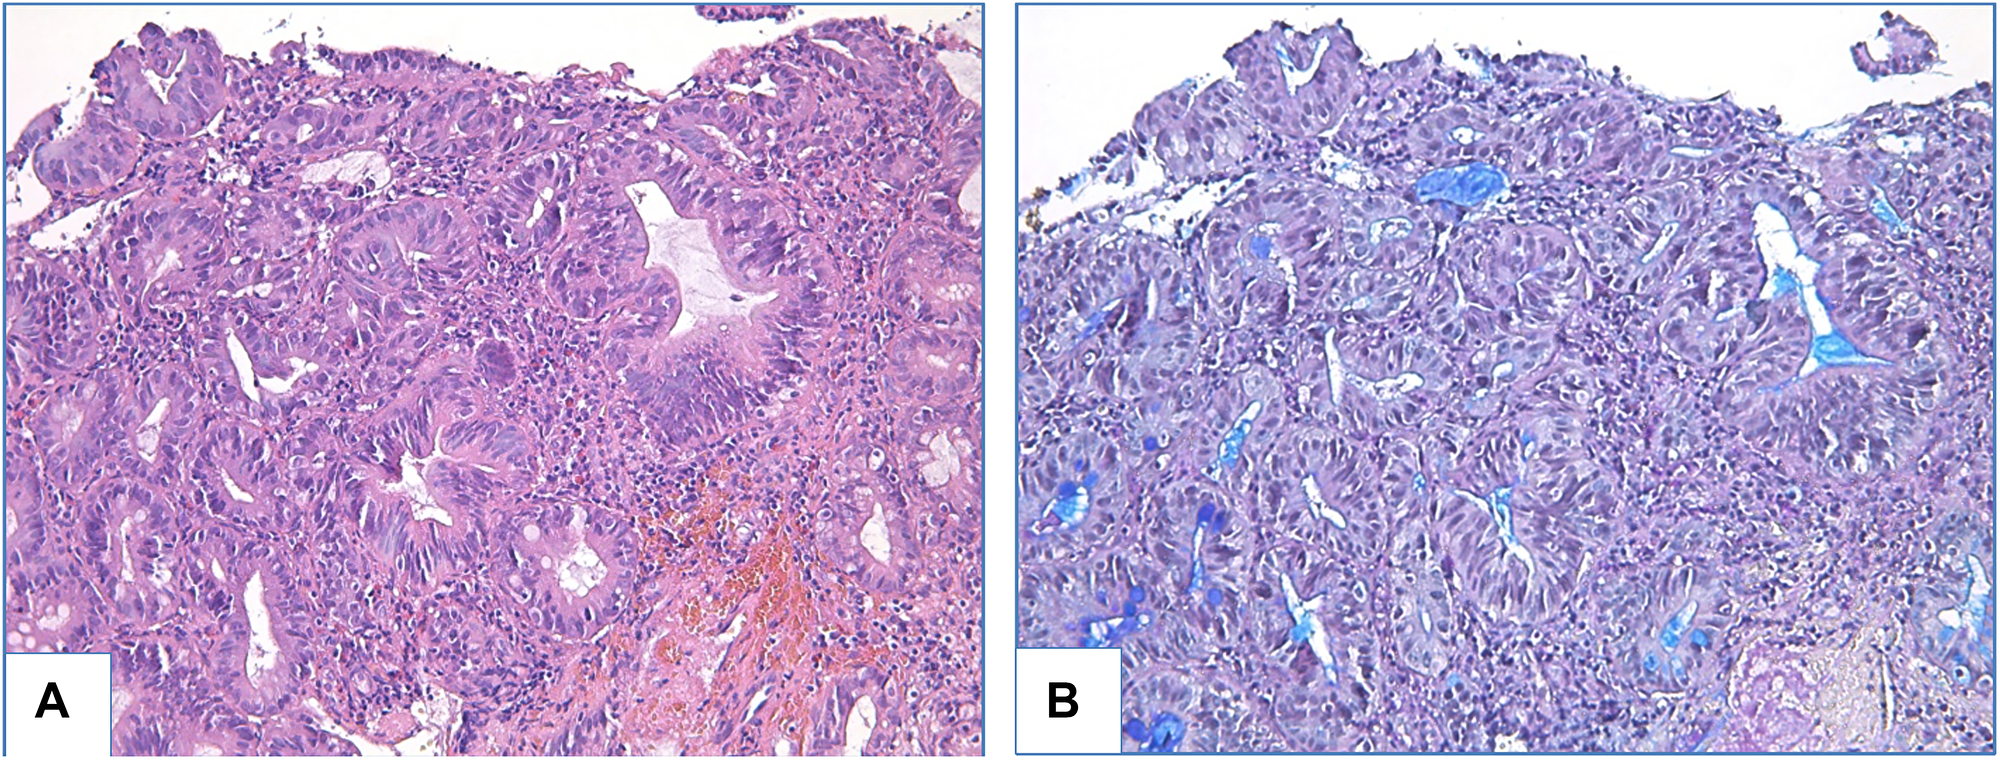
Figure 4: Adenomatous high-grade dysplasia in patient with BE. (A) haematoxylin and eosin staining, (B) PAS-reaction combined with alcian blue staining, magnification ×200.
Foveolar dysplasia
Morphological features specific to foveolar dysplasia were identified in 1 patient with high-grade dysplasia (gastric metaplasia) and in 2 patients with low-grade dysplasia (BE). In foveolar dysplasia glands were lined with cuboidal epithelium, the nuclei were enlarged, round to oval shape, with signs of mitoses and lack of stratification. GC were absent, or rarely seen (FGC). IHC examination showed prominent expression of MUC5AC and MUC6, but absent or scarce expression of MUC2 (<1% of epithelial cells) (Figures 3, 5 and 6).
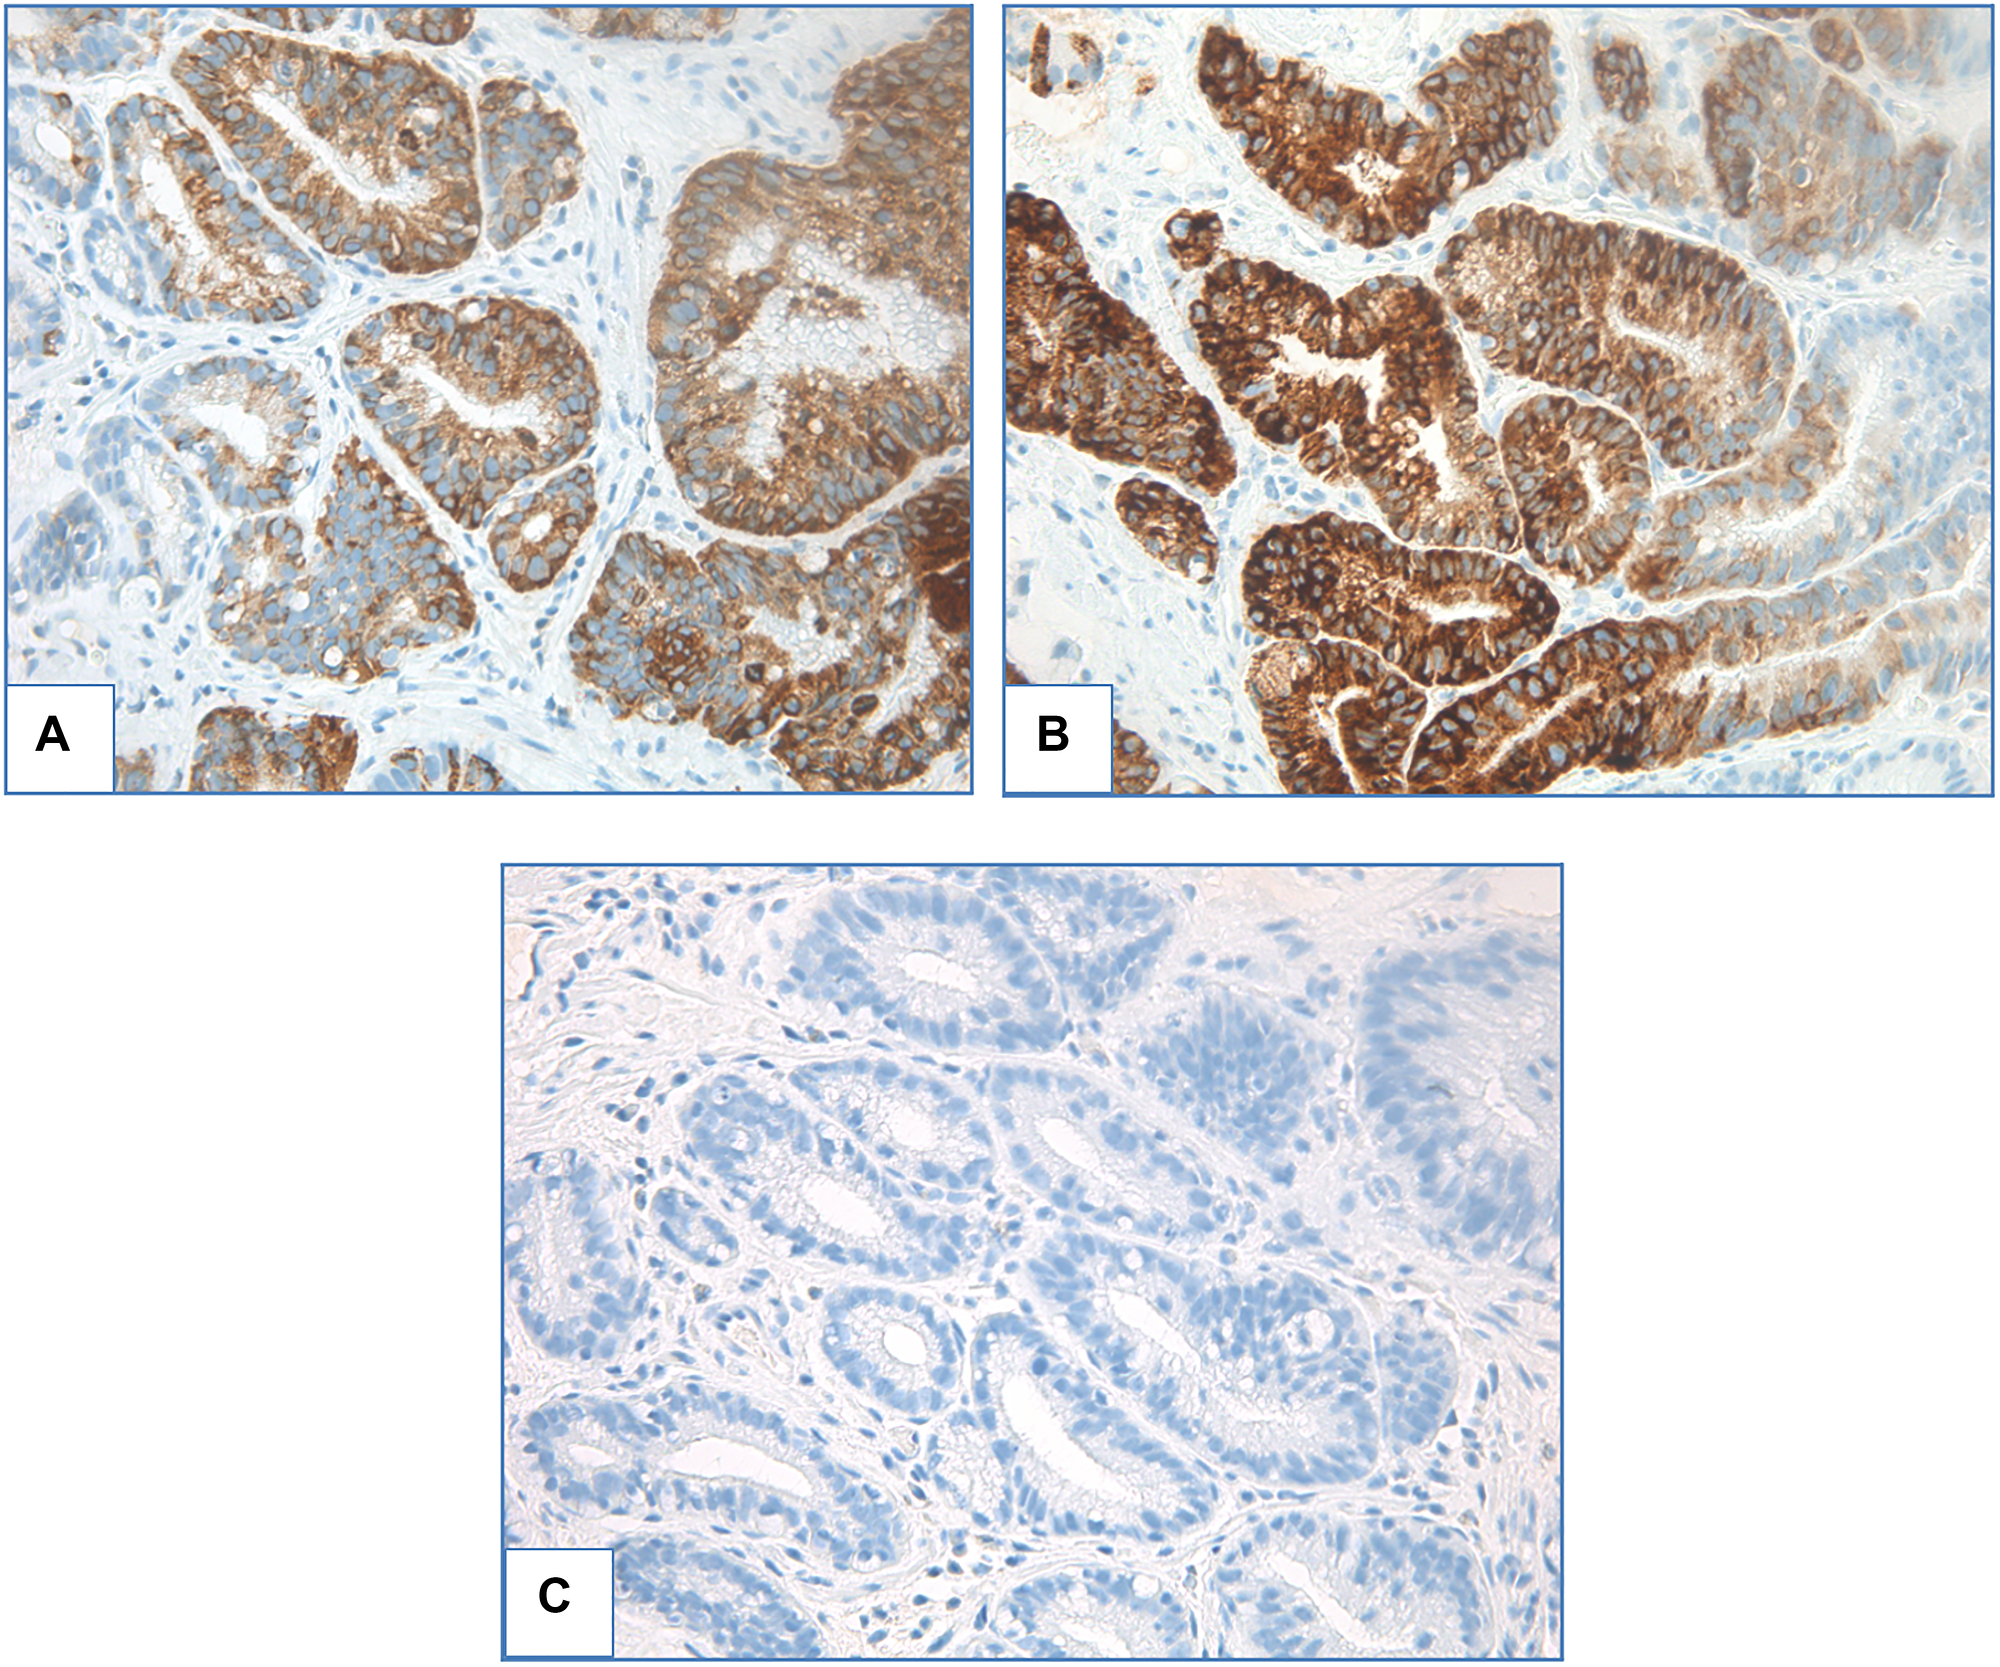
Figure 5: Foveolar low-grade dysplasia. (A) ICH staining with MUC5AC, (B) ICH staining with MUC6, (C) ICH staining with MUC2, magnification ×400.
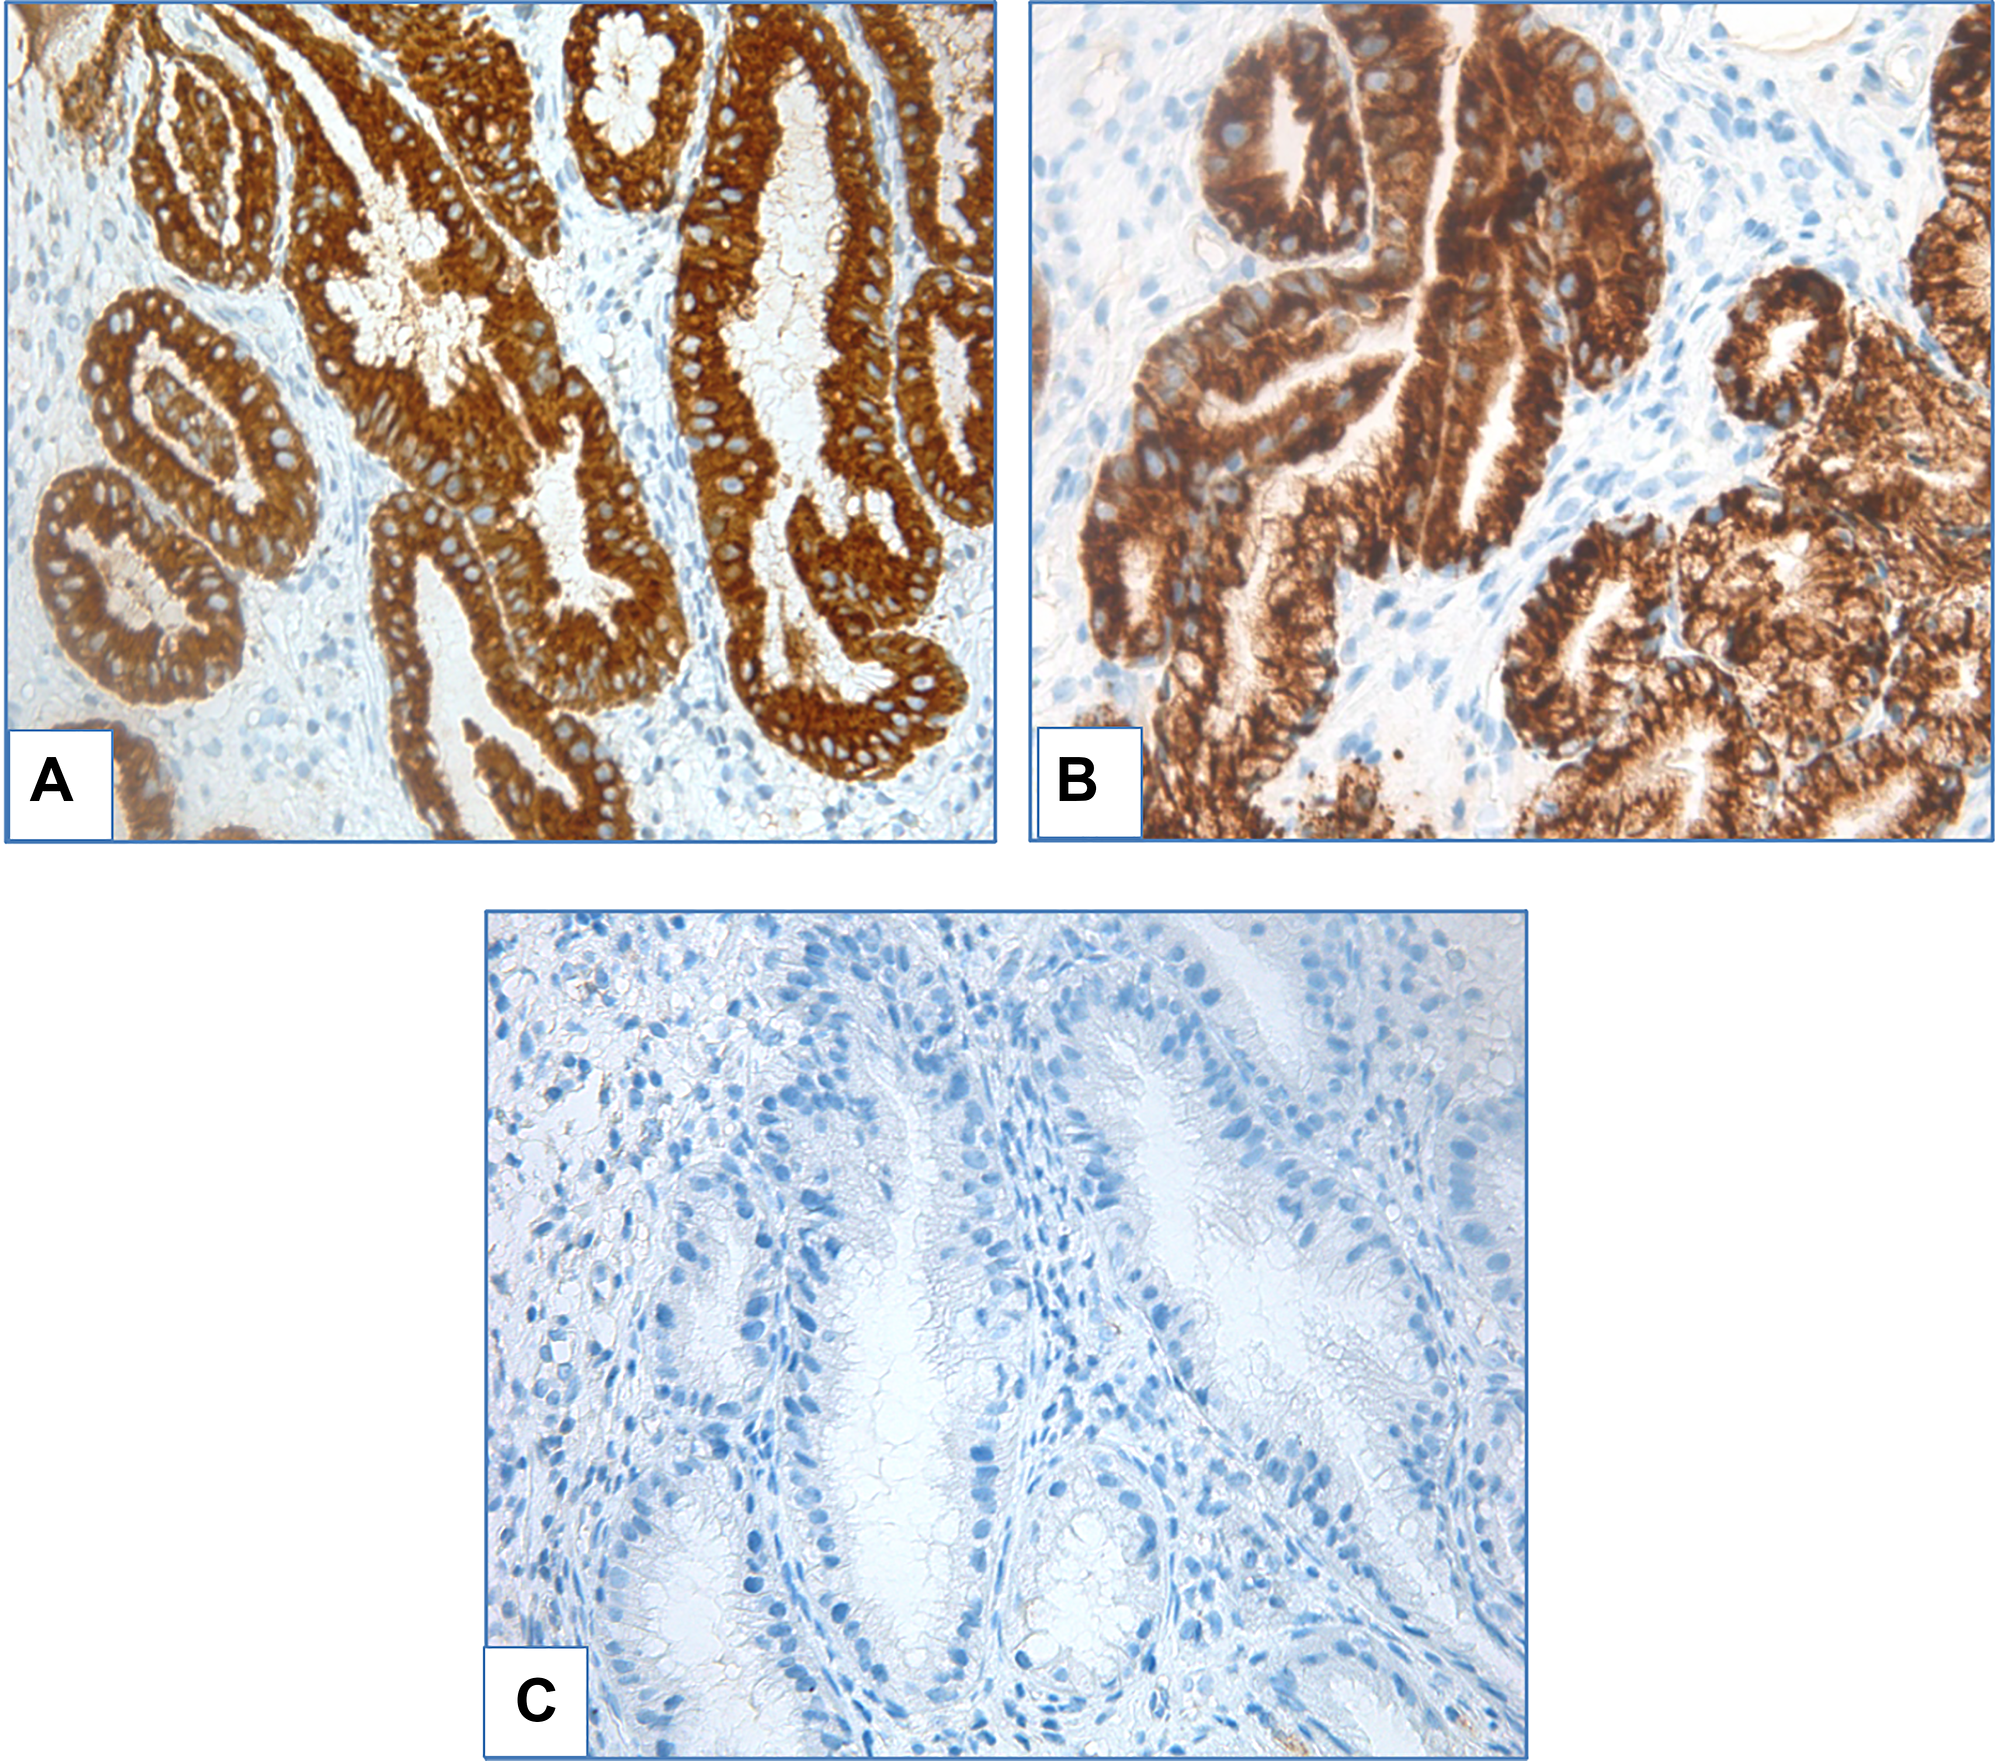
Figure 6: Foveolar high-grade dysplasia. (A) ICH staining with MUC5AC, (B) ICH staining with MUC6, (C) ICH staining with MUC2, magnification ×400.
Intestinal dysplasia
The remaining 15 patients from Group 4 exhibited intestinal dysplasia. Dysplastic glands were lined with tall columnar epithelium with various GC count, enlarged nuclei, elongated, with hyperchromatosis, stratification and mitoses. Density of GC in areas without dysplasia ranged from low to high. IHC examination revealed prominent expression of both gastric (MUC5AC, MUC6) and intestinal (MUC2) markers (Figures 7 and 8).
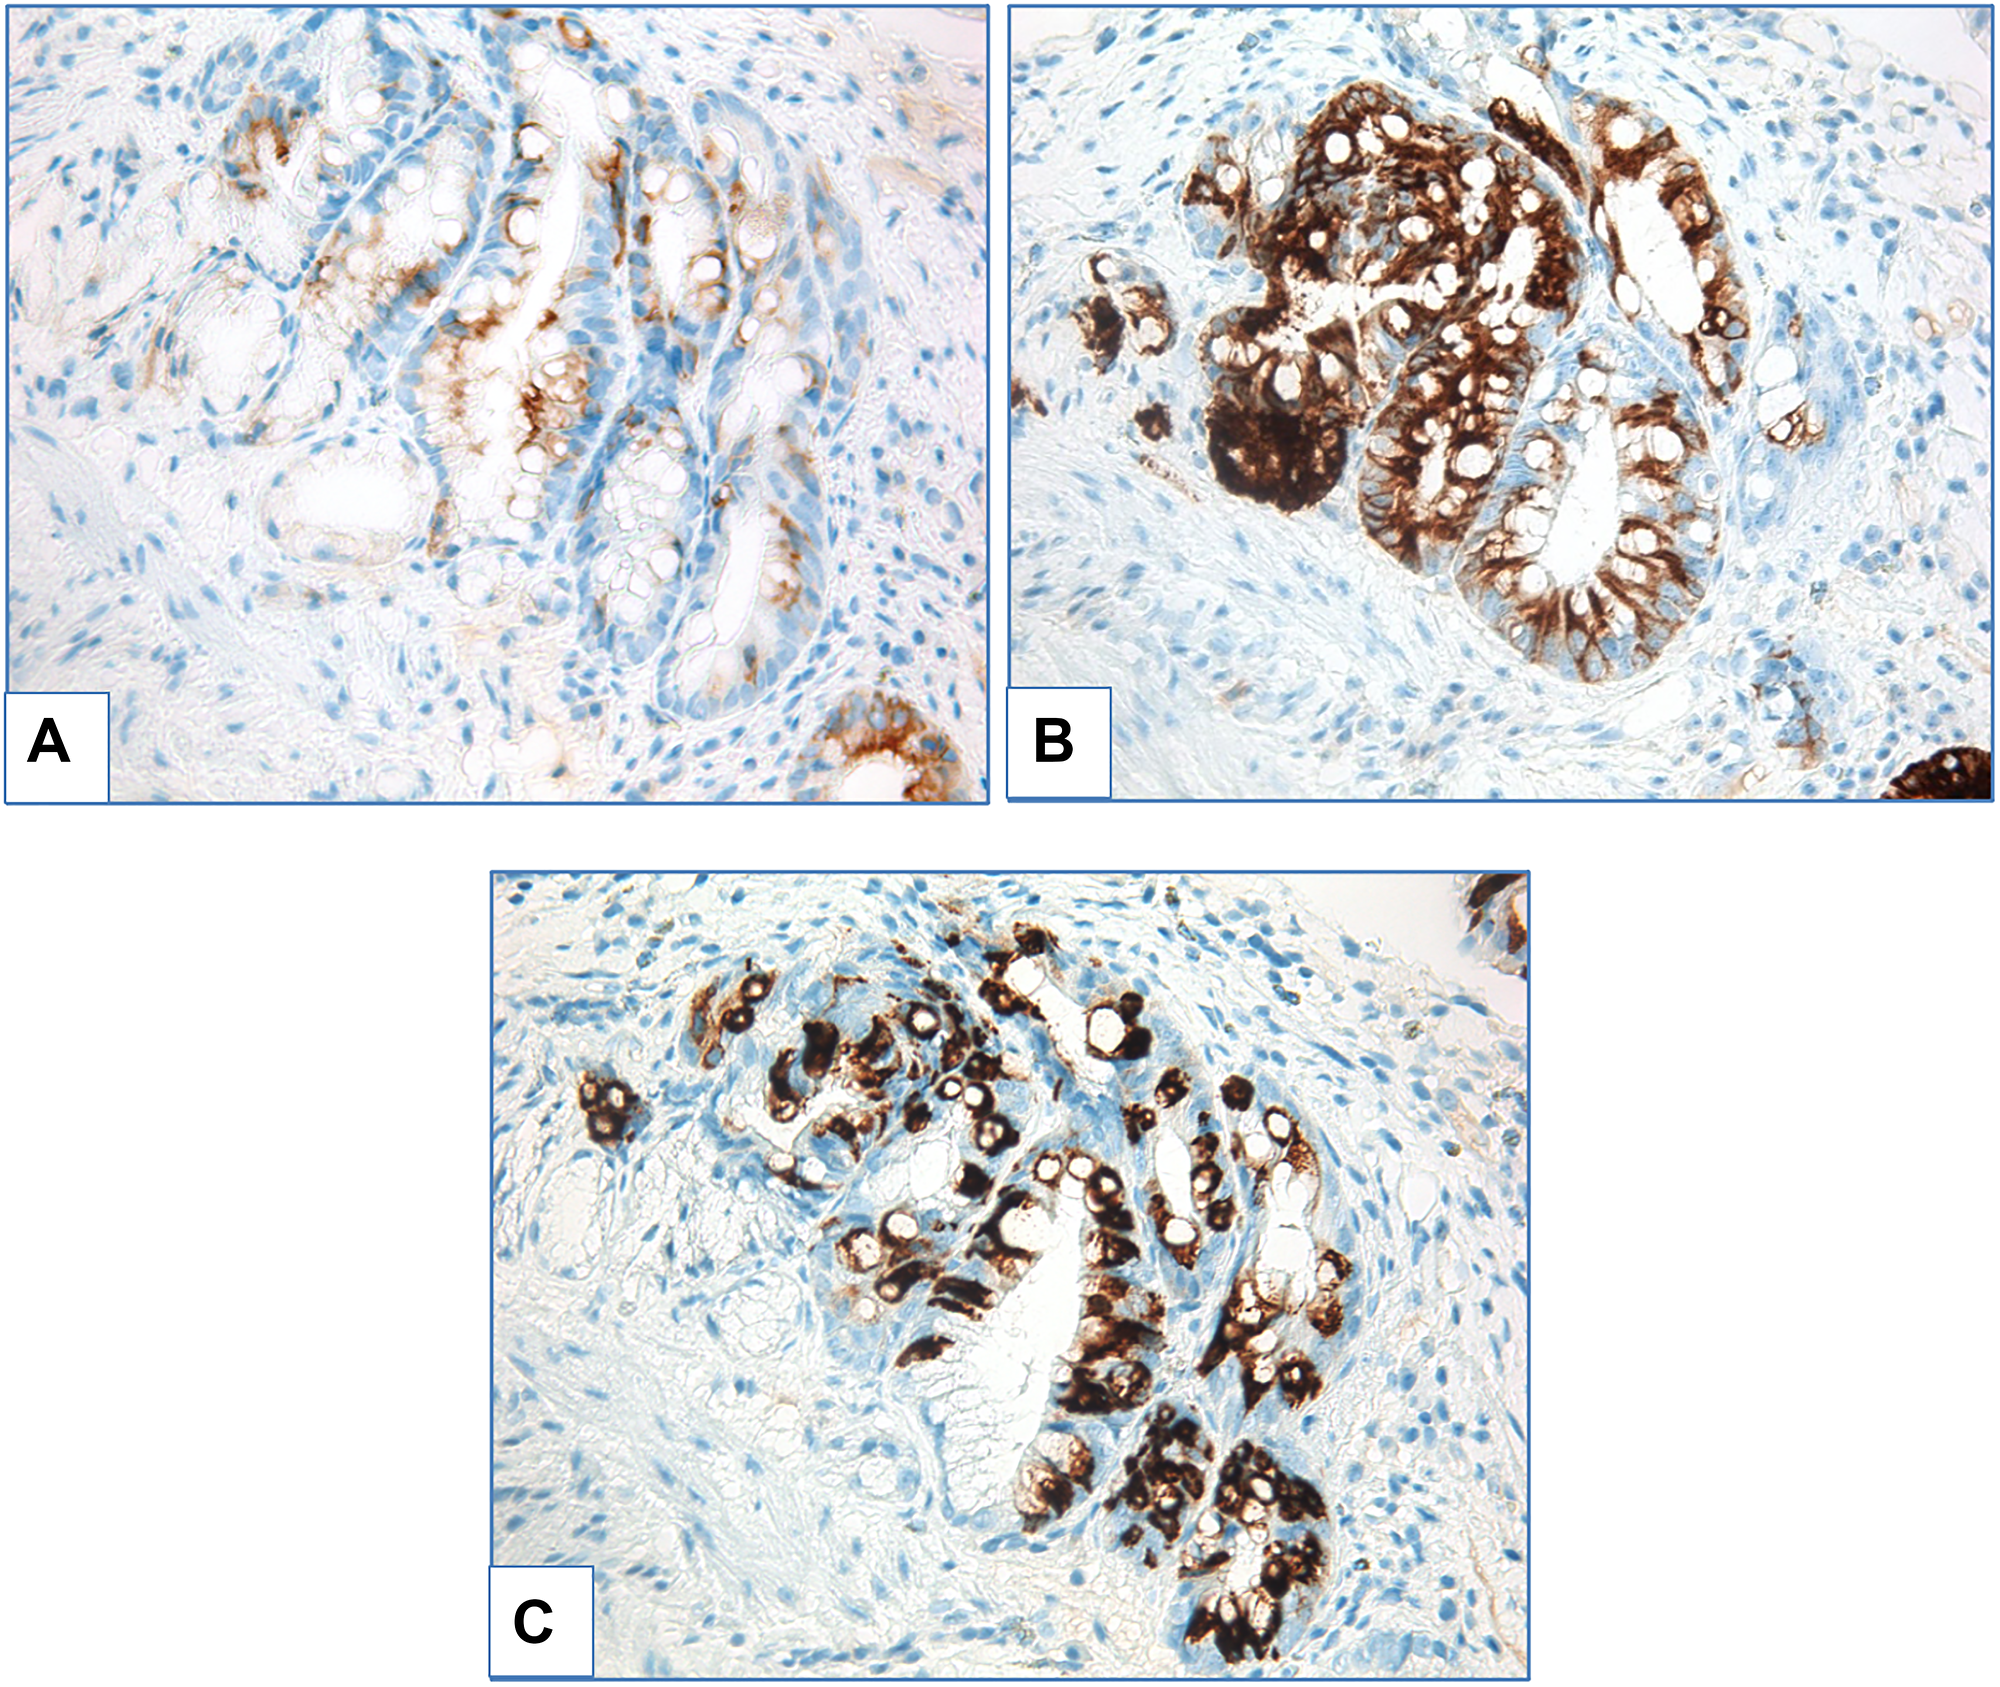
Figure 7: Adenomatous low-grade dysplasia. (A) ICH staining with MUC5AC, (B) ICH staining with MUC6, (C) ICH staining with MUC2, magnification ×400.
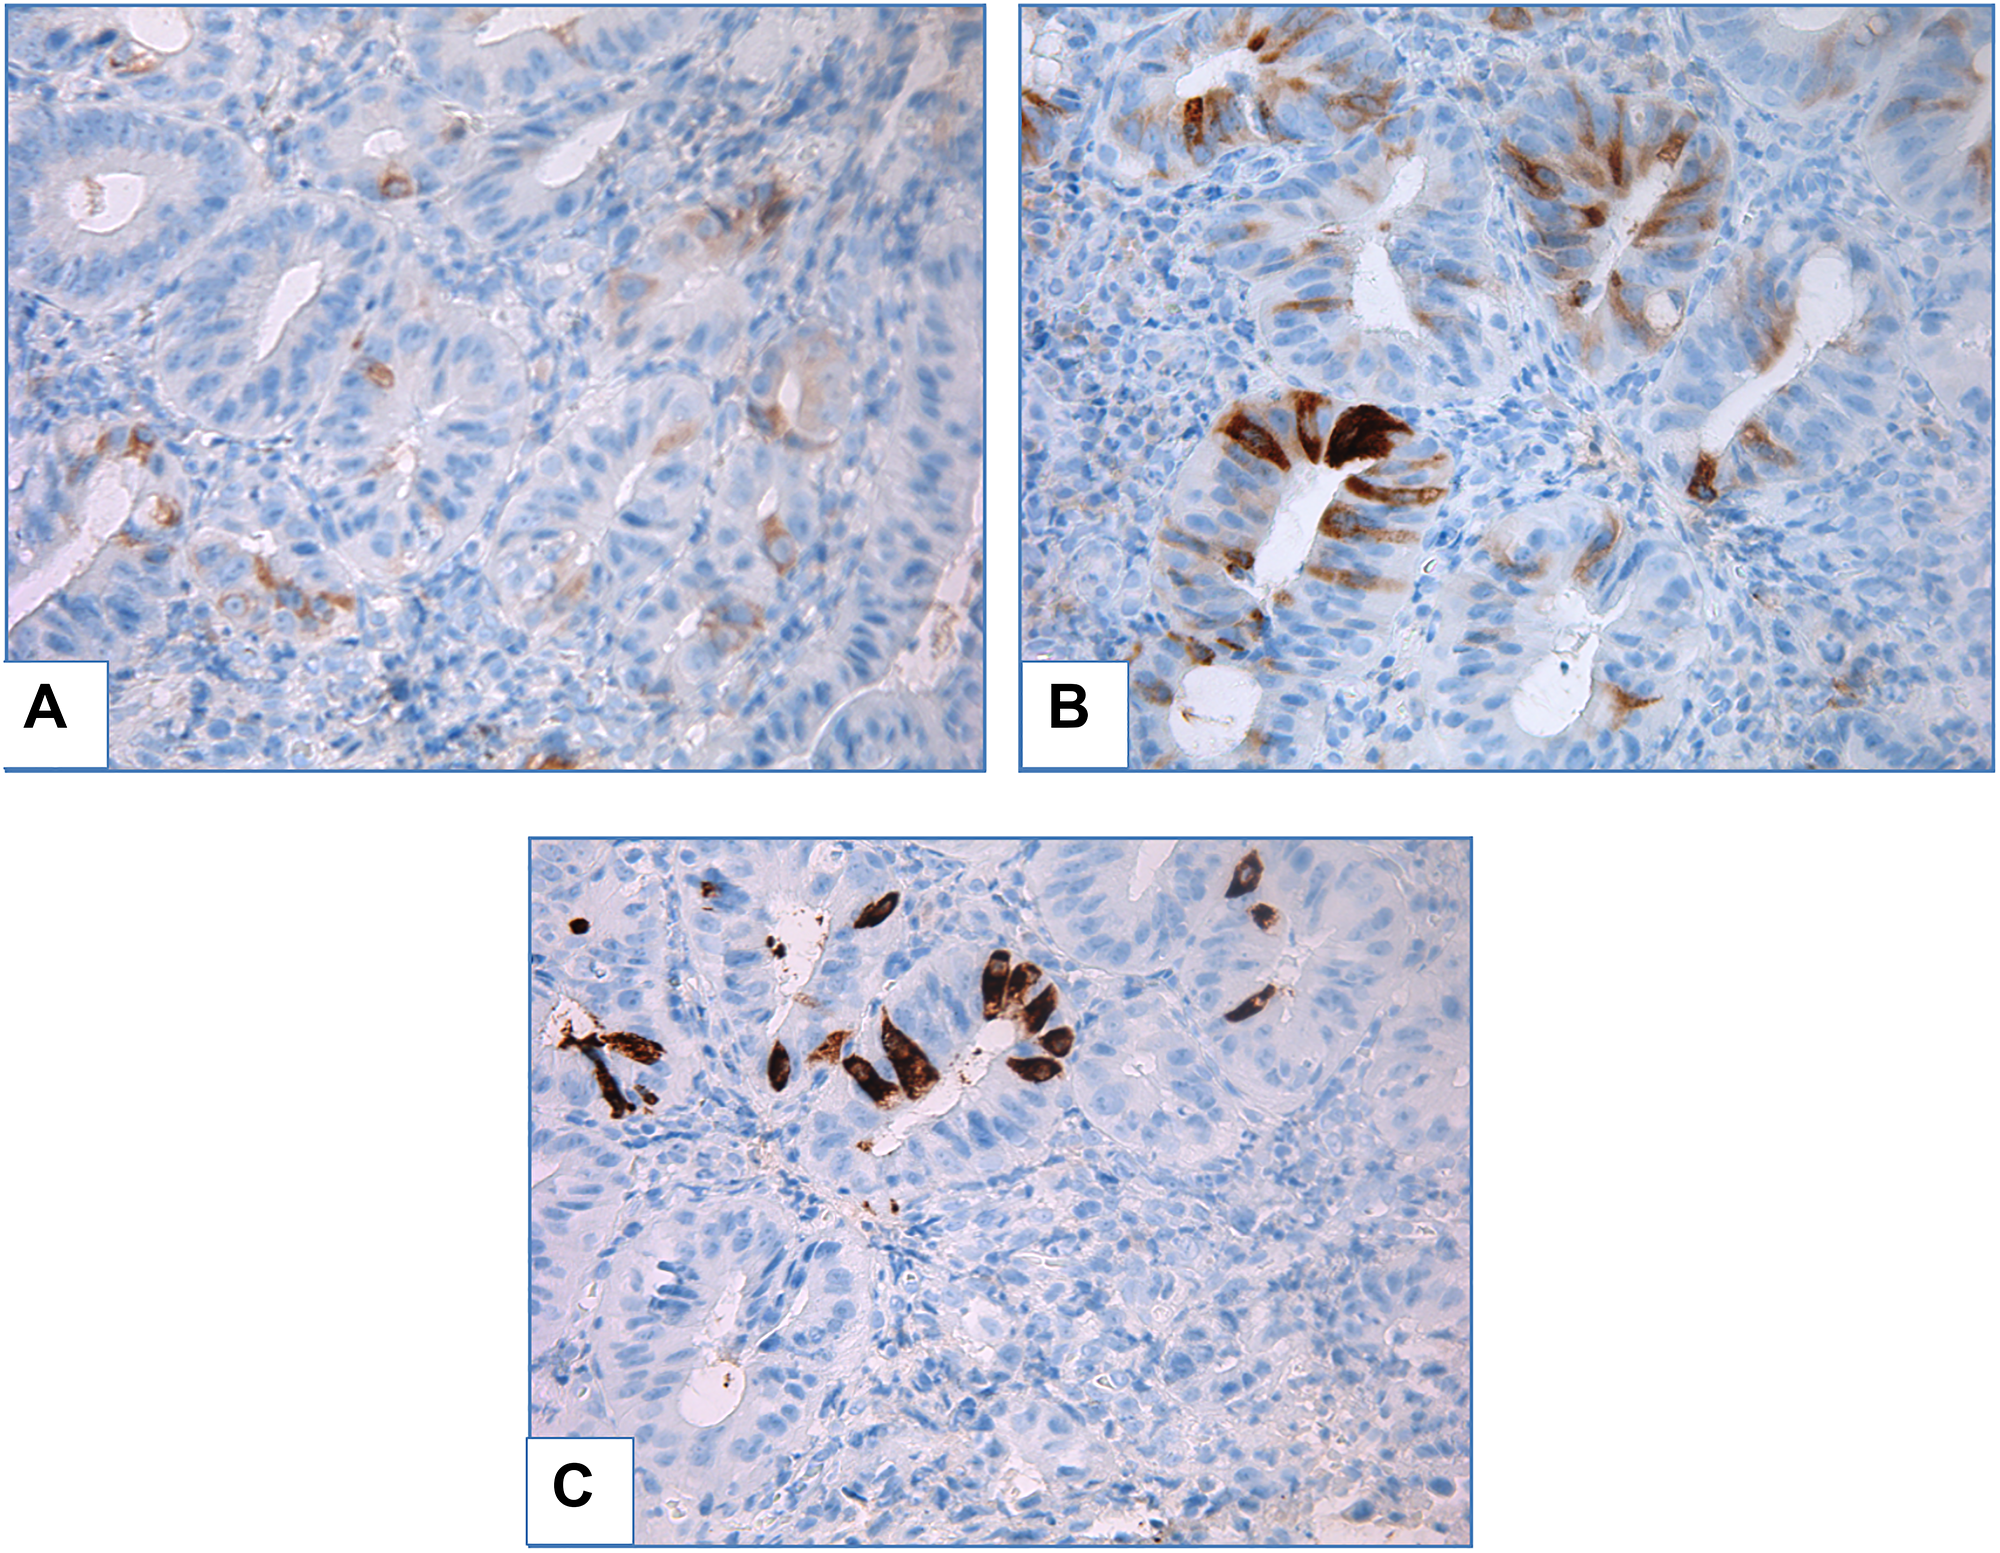
Figure 8: Adenomatous high-grade dysplasia in patient with BE. (A) ICH staining with MUC5AC, (B) ICH staining with MUC6, (C) ICH staining with MUC2, magnification ×400.
Association of metaplasia type and distance from GEJ
In Group 1, gastric metaplasia was seen in 20 cases and IM – in 8 cases. In Group 2 gastric metaplasia was observed in 40 patients at a length of 1–3 cm, and in 3 patients at a distance of greater than 3 cm. Group 3 included 35 patients with IM at a length of 1–3 cm, and 15 patients with IM at a length of over 3 cm. Group 4 included 1 patient with gastric dysplasia at > 3 cm, and 17 patients with intestinal type dysplasia: 5 at ≤ 3 cm and 12 at > 3 cm. As such, increase of segment length resulted in rising frequency of IM detection from 28,57% in metaplasia < 1 cm above GEJ to 46,67% in short segment and to 88,89% in long segment of metaplasia (Figure 9). IM was detected more frequently in the longer segments than in shorter segments (p < 0,0001), OR (long/short segment) 9,143 (p < 0,05).
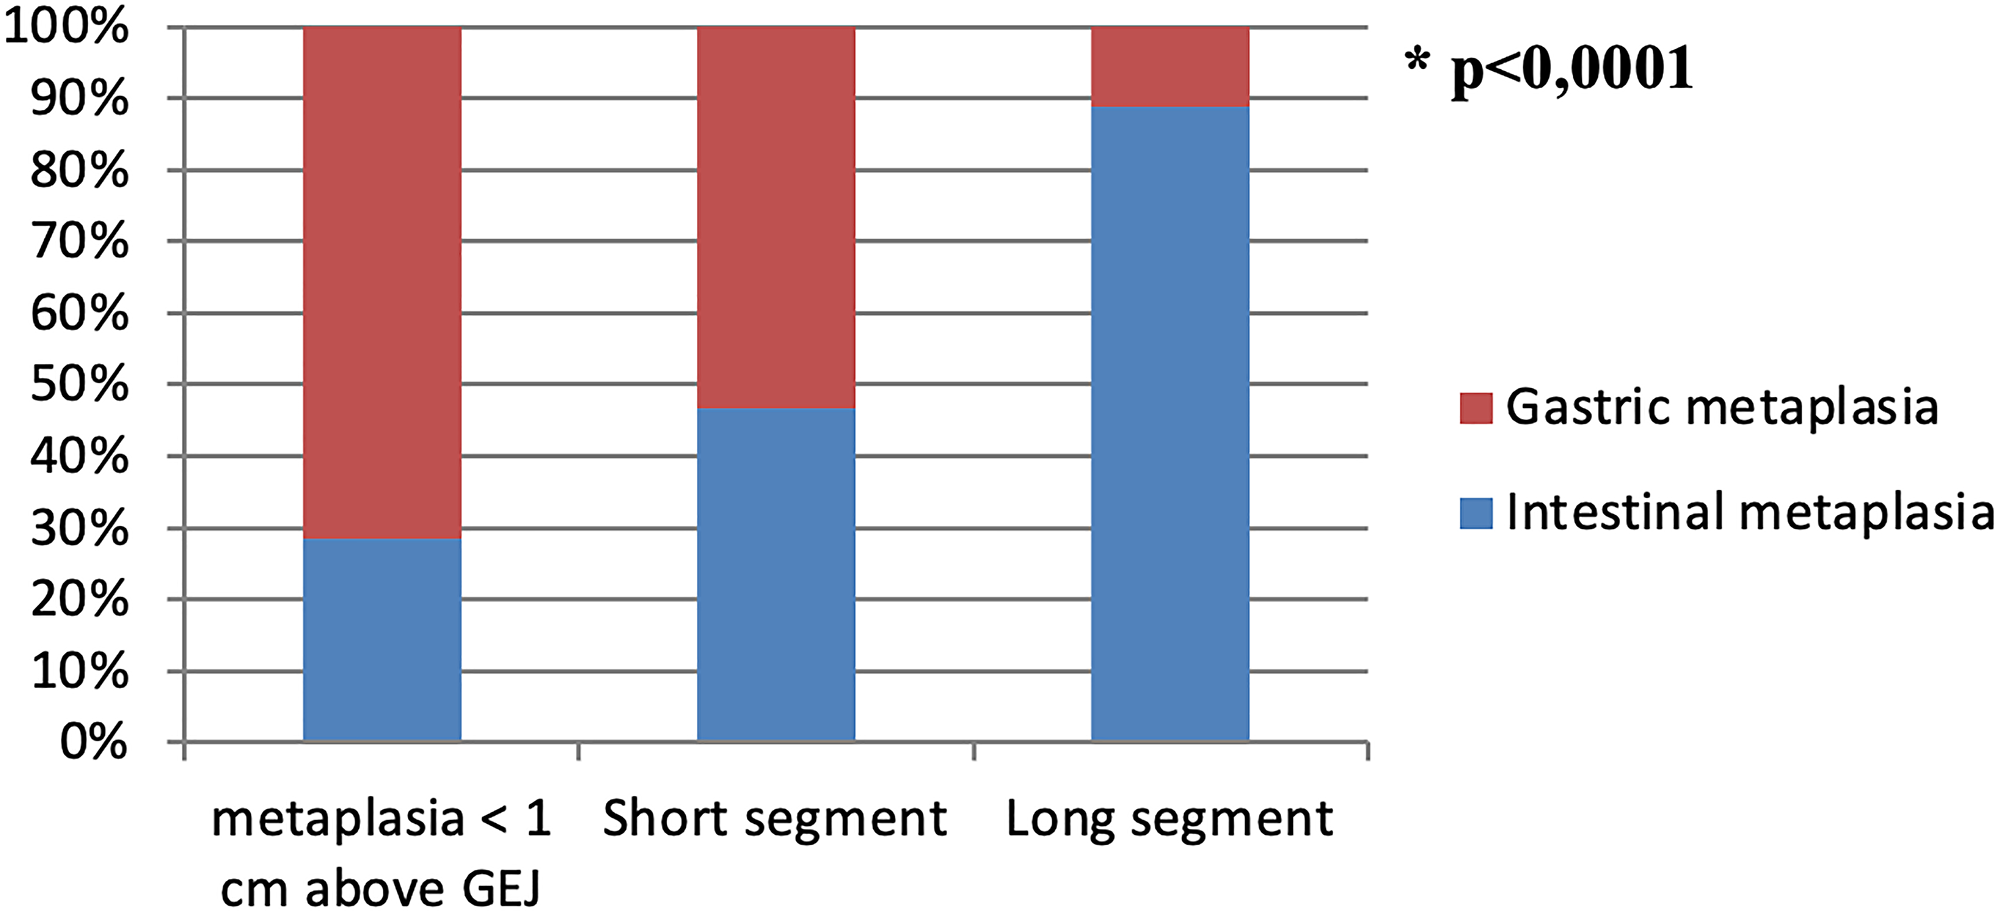
Figure 9: Metaplasia types distribution subject to different segment length.
GC density distribution
An increase in segment length resulted not only in IM detection increase, but also in growth of GC density. FGC and LDGC were seen with equal frequency in Group 1. LDGC was detected more frequently at 1–3 cm from GEJ and HDGC prevailed in BE at > 3 cm above GEJ (p < 0,0001) (Table 1, Figure 10). Ratio of identification of HDGC at > 3 cm and 1–3 cm was 5,52 (p < 0,05).
Table 1: GC density distribution in patients with different segment length
| < 1 cm above GEJ | 1–3 cm above GEJ | > 3 cm above GEJ | |
|---|---|---|---|
| FGC, n (%) | 4 (50%) | 10 (28,57%) | 2 (6,25%) |
| LDGC, n (%) | 4 (50%) | 16 (45,72%) | 9 (28,125%) |
| HDGC, n (%) | 0 | 9 (25,71%) | 21 (65,625%) |
| Total, n (%) | 8 (100%) | 35 (100%) | 32 (100%) |
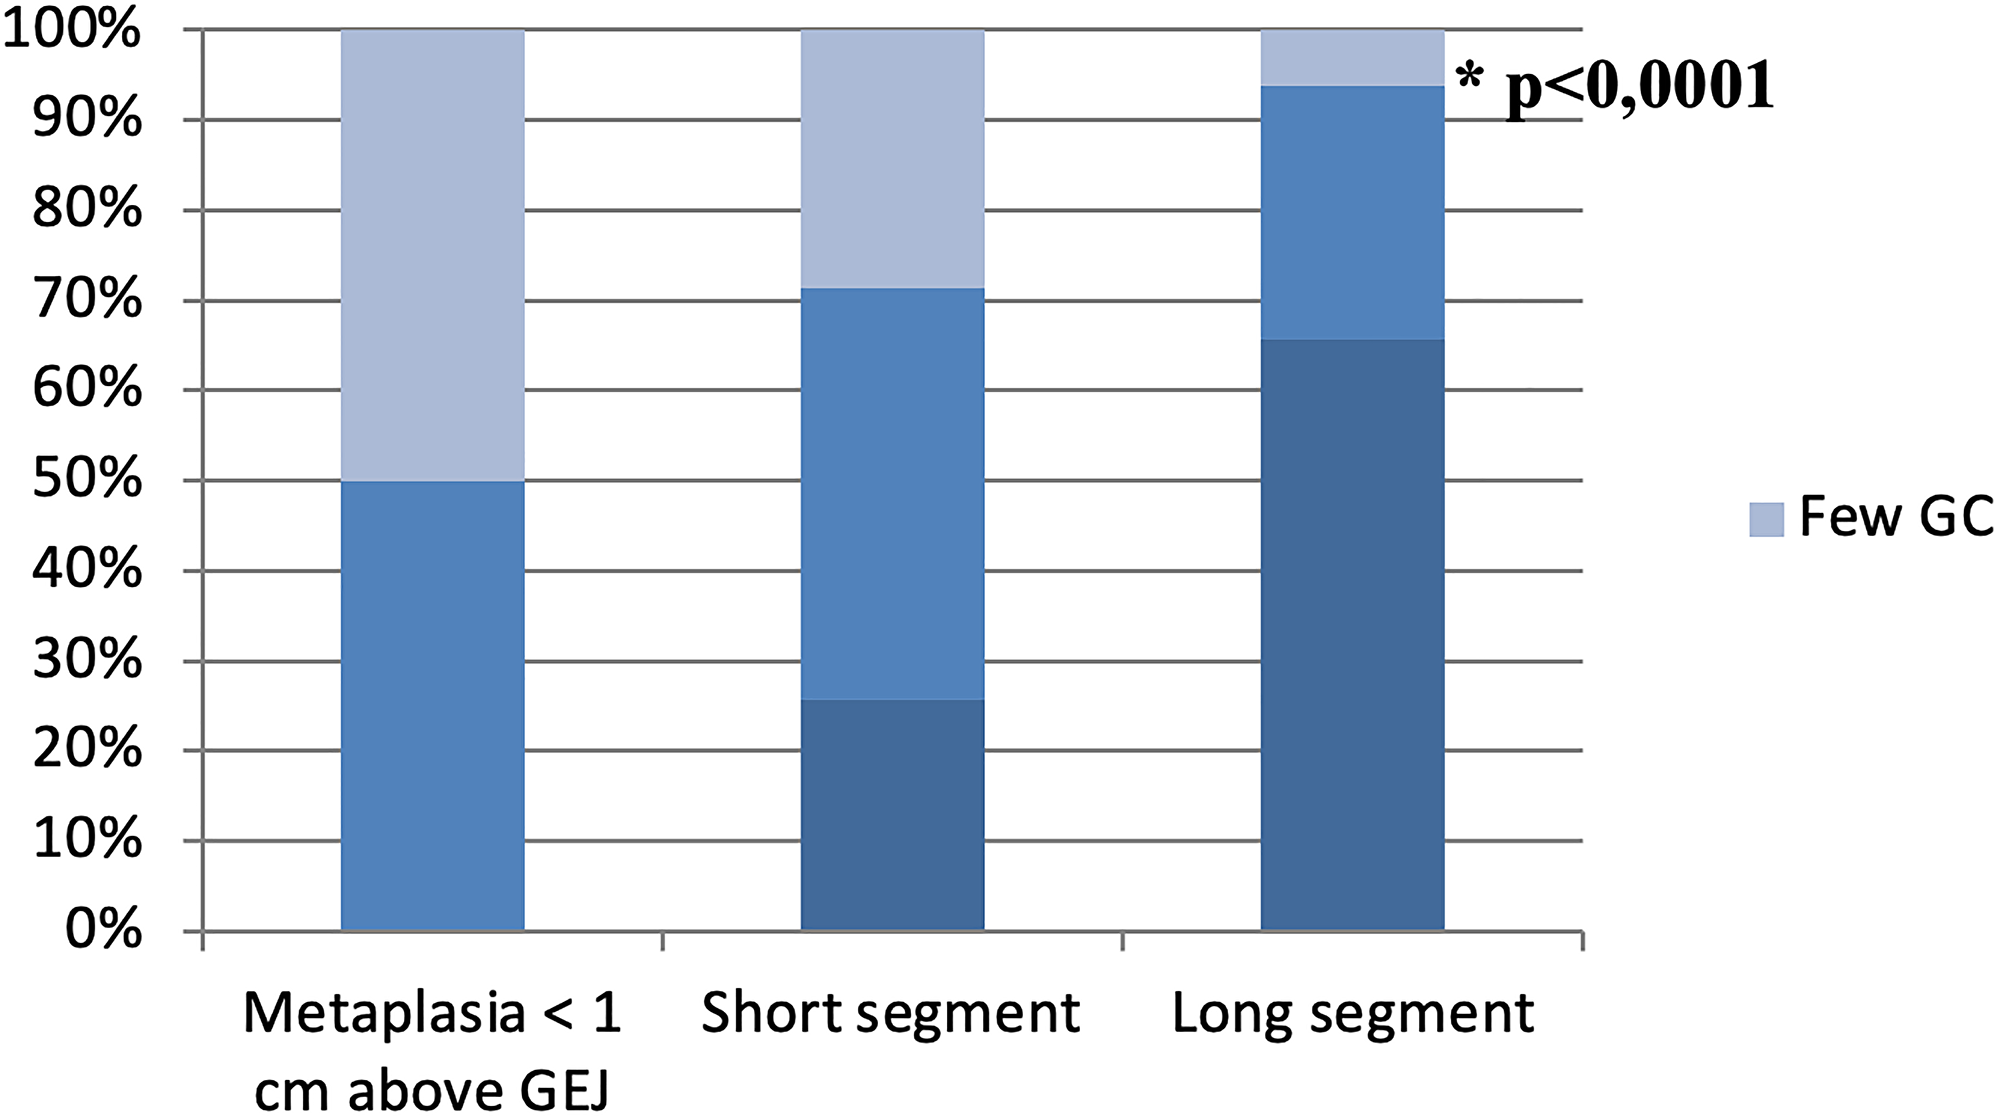
Figure 10: GC density distribution in patients with different segment length.
Separate analysis of DBE and NDBE revealed that in DBE patients with a long segment, lower GC density was found more frequently (p = 0,0119) (Table 2).
Table 2: Distribution of patients with short and long segment dysplastic and non-dysplastic BE subject to GC density
| Short segment (1–3 cm from GEJ) | Long segment (> 3 cm from GEJ) | |||
|---|---|---|---|---|
| NDBE | DBE | NDBE | DBE | |
| FGC, n | 9 | 1 | 0 | 3 |
| LDGC, n | 14 | 2 | 5 | 4 |
| HDGC, n | 7 | 2 | 15 | 6 |
| p = 0,1331 | *p = 0,0119 | |||
Correlation of morphometric parameters of GC and BE segment length
As segment length increased, all morphometric parameters of GC increased as well: the total number of GC, density of GC and percentage of crypts containing GCs (Table 3).
Table 3: Morphometric parameters of GC subject to segment length
| NDBE | DBE | |||
|---|---|---|---|---|
| < 1 cm above GEJ | 1–3 cm above GEJ | > 3 cm above GEJ | ||
| Total count of GC, Me (L-H) | 19 (15,75–76,5) | 50,5 (12,75–78,75) | 184 (154,75–224,25) | 143 (57–184) |
| GC density, Me (L-H) | 0,30 (0,17–1,23) | 0,76 (0,25–1,74) | 2,73 (2,02–3,28) | 1,96 (1,13–2,80) |
| Percentage of crypts containing GC, Me (L-H) | 0,15 (0,07–0,42) | 0,31 (0,10–0,52) | 0,59 (0,51–0,70) | 0,53 (0,30–0,70) |
A strong positive correlation of all morphometric parameters (total number of GC, density of GC and percentage of crypts containing GC) was established (Table 4). Acquired data shows that the increase of total number of GC causes growth of percentage of crypts containing GC and increased GC density. A positive moderate correlation of GC morphometric parameters and segment length in NDBE was also seen. The biggest positive correlation was obtained for total number of GC and circular segment length (r = 0,67) and for total number of GC and maximal extension of metaplasia (r = 0,64). GC density and circular segment length; GC density and maximal extension of metaplasia are directly correlated (p < 0,0001). No correlation between GC morphometric parameters and segment length in DBE were seen (p > 0,05).
Table 4: Results of Spearman’s rank correlation of segment length and morphometric parameters in NDBE
| Total number of GC | GC density | Percentage of crypts containing GC | |
|---|---|---|---|
| GC density | 0,84* | ||
| Percentage of crypts containing GC | 0,78* | 0,92* | |
| Length of circular segment (C) | 0,67* | 0,62* | 0,50* |
| Maximal extension of metaplasia (M) | 0,64* | 0,60* | 0,48* |
DISCUSSION
In our study frequency of different metaplasia types and quantitative parameters of GC were compared in patients with different segment length (<1 cm, 1–3 cm and > 3 cm above GEJ) in cases with and without dysplasia. The extension of segment length showed direct association with an increase in the frequency of GC detection (p < 0,0001). This data is consistent with previous studies [6, 12–14]. Chandrasoma P.T. et al. [23] revealed that high percentage of crypts containing GCs is more frequently observed in the most proximal part compared to the most distal part of the segment (65,625% vs. 3,125%). Theodorou D. et al. [24] showed that a higher proportion of crypts containing GC is associated with a longer segment and higher level of intraluminal pH in the esophagus. The percentage of crypts containing GC has been shown to depend on the bile solubility gradient along the segment and reflects adaptation of esophageal mucosa to aggressive environment of acid and bile reflux. The percentage of crypts containing GCs was assessed semi-quantitatively in both studies. Bansal et al. [25] applied quantitative evaluation (number of GCs in 1 field of view) and demonstrated only weak positive correlation of this parameter to segment length (Spearman’s rank test: r = 0,1, p = 0,01).
Our study is the first to show moderate positive correlation of morphometric parameters (total number, density and percentage of crypts containing GC) and length of non-dysplastic BE segment. More so, we showed that there is no correlation of morphometric parameters and segment length found in dysplastic BE. Despite this, our results show that GC density is associated with the morphological type of dysplasia: foveolar dysplasia developed in absence or few GCs, while intestinal type dysplasia was observed in patients with low and high density of GCs. These results are similar to Brown I.S. et al. [31], who showed that GCs were absent in 53% cases of foveolar dysplasia, focal or intermediate in 37% and diffuse only in 11% cases, while in adenomatous dysplasia GCs were absent in 9%, focal or intermediate in 18% and diffuse in 64% cases.
While in NDBE extension of segment length was associated with an increase of morphometric parameters of GC, DBE samples with long segments of metaplasia exhibited few or low density of GC more frequently compared to NDBE (p = 0,0119). Similarly studies by Srivastava A. et al. [18], Schellnegger R. et al. [26] and Kunze B. et al. [27] demonstrated that development of high-grade dysplasia and EAC is associated with low values of GC morphometric parameters. Thus, alteration of esophageal mucosa adaptation mechanism leads to reduction of GC count and development of dysplasia and EAC. This is defined by specific ploidity alterations (aneuploidy, tetraploidy) [18], an increase in stem cells marker expression [26] and activation of Notch-signaling pathways that drive carcinogenesis [27]. In contrast, high density of GC represents a protective mechanism against neoplasia. Induction of GC differentiation by gamma-secretase inhibitor (downregulation of Notch signaling) may become a potential therapeutic target for neoplasia prevention in BE [19]. Although recent studies demonstrated that only 45–49, 9% EAC harbor GC and demonstrate BE and these malignancies are associated with better prognosis [34, 35]. Phenotype of EAC devoid GC is likely to develop from foveolar dysplasia that may arise in gastric type metaplasia of distal esophagus that supports studies of Takubo K. et al. [10], Brown I.S. et al. [31], Khor T.S. et al. [36] and Watanabe G. et al. [11]. Keeping in mind that gastric metaplasia is the earliest change in distal esophagus [6, 20–22], it’s eligible to hypothesize, that these aggressive tumors, associated with poor prognosis, emerge and rapidly progress before distal esophagus mucous develops GC as a protection from reflux injury. Further studies of pathways leading to development of dysplasia and EAC are needed to elaborate specific predictors of progression in patients with BE.
Materials and Methods
Study characteristics
The study included 139 consecutive patients who underwent examination at the 31st City Hospital in Moscow from January 2018 to December 2020 and was approved by the Local Ethics Committee at the Research Institute of Human Morphology and conducted in accordance with the ethical standards as laid down in the 1964 Declaration of Helsinki and its later amendments and local guidelines. Patient age varied from 18 to 94 years. All patients underwent high-resolution white light endoscopy (WLE) and narrow-band imaging (NBI) endoscopy using Olympus Medical Systems Corporation EVIS EXERA III and additional chromoscopy with 1.5% acetic acid. Targeted biopsies were obtained from suspicious areas, which were identified in accordance with recommendations of the BING [37] and PREDICT [38] classifications. Biopsy samples were taken a) at sites with endoscopic pattern, characteristic for IM, b) sites, suspicious for dysplasia and c) from BE top circumferential area and tongue. All targeted biopsies were placed in separate containers and marked with levels of segment length from where they were obtained. According to the Prague classification [39], the lower measurement boundary was formed by the proximal cardial notch, and the two upper measurement boundaries were marked by the proximal limit of the circumferential segment (C) and the longest tongue of metaplasia (M).
Four groups of patients were formed according to morphological features and segment distance from GEJ: Group 1 (28 patients with metaplasia < 1 cm from GEJ), Group 2 (43 patients with gastric metaplasia without dysplasia > 1 cm from GEJ), Group 3 (50 patients with BE without dysplasia > 1 cm from GEJ) and Group 4 (18 patients with dysplasia seen > 1 cm from GEJ).
GC identification
Biopsy samples were fixed in 10% neutral buffered formaldehyde and routinely stained with haematoxylin and eosin. During pathological evaluation attention was paid to detection of esophageal derivatives (squamous epithelium over crypts, esophageal mucous glands and their ducts) [40]. This is important particularly in biopsy samples obtained in Group 1 patients, as the probability of contamination with stomach tissue is high. Combined Periodic Acid-Schiff (PAS) reaction with alcian blue staining and MUC2 immunohistochemical (IHC) evaluation (clon Ccp58, Leica Novocastra, dilution 1:125) was performed for identification of GC.
Morphometric evaluation of GC was conducted using the approach, described by Srivastava A. et al. [18], in areas without dysplasia. Total number, density and number of crypts containing GC were measured. The density of GC was defined as the ratio GC to crypts. Samples were characterized as having few GC (FGC) when density of GC was < 0,25; low density of GC (LDGC) when density of GC was 0,25-2; and high density of GC (HDGC) when density of GC was > 2 (Figure 11). Percentage of crypts containing GC was calculated as the ratio of crypts containing GC to the total number of crypts.
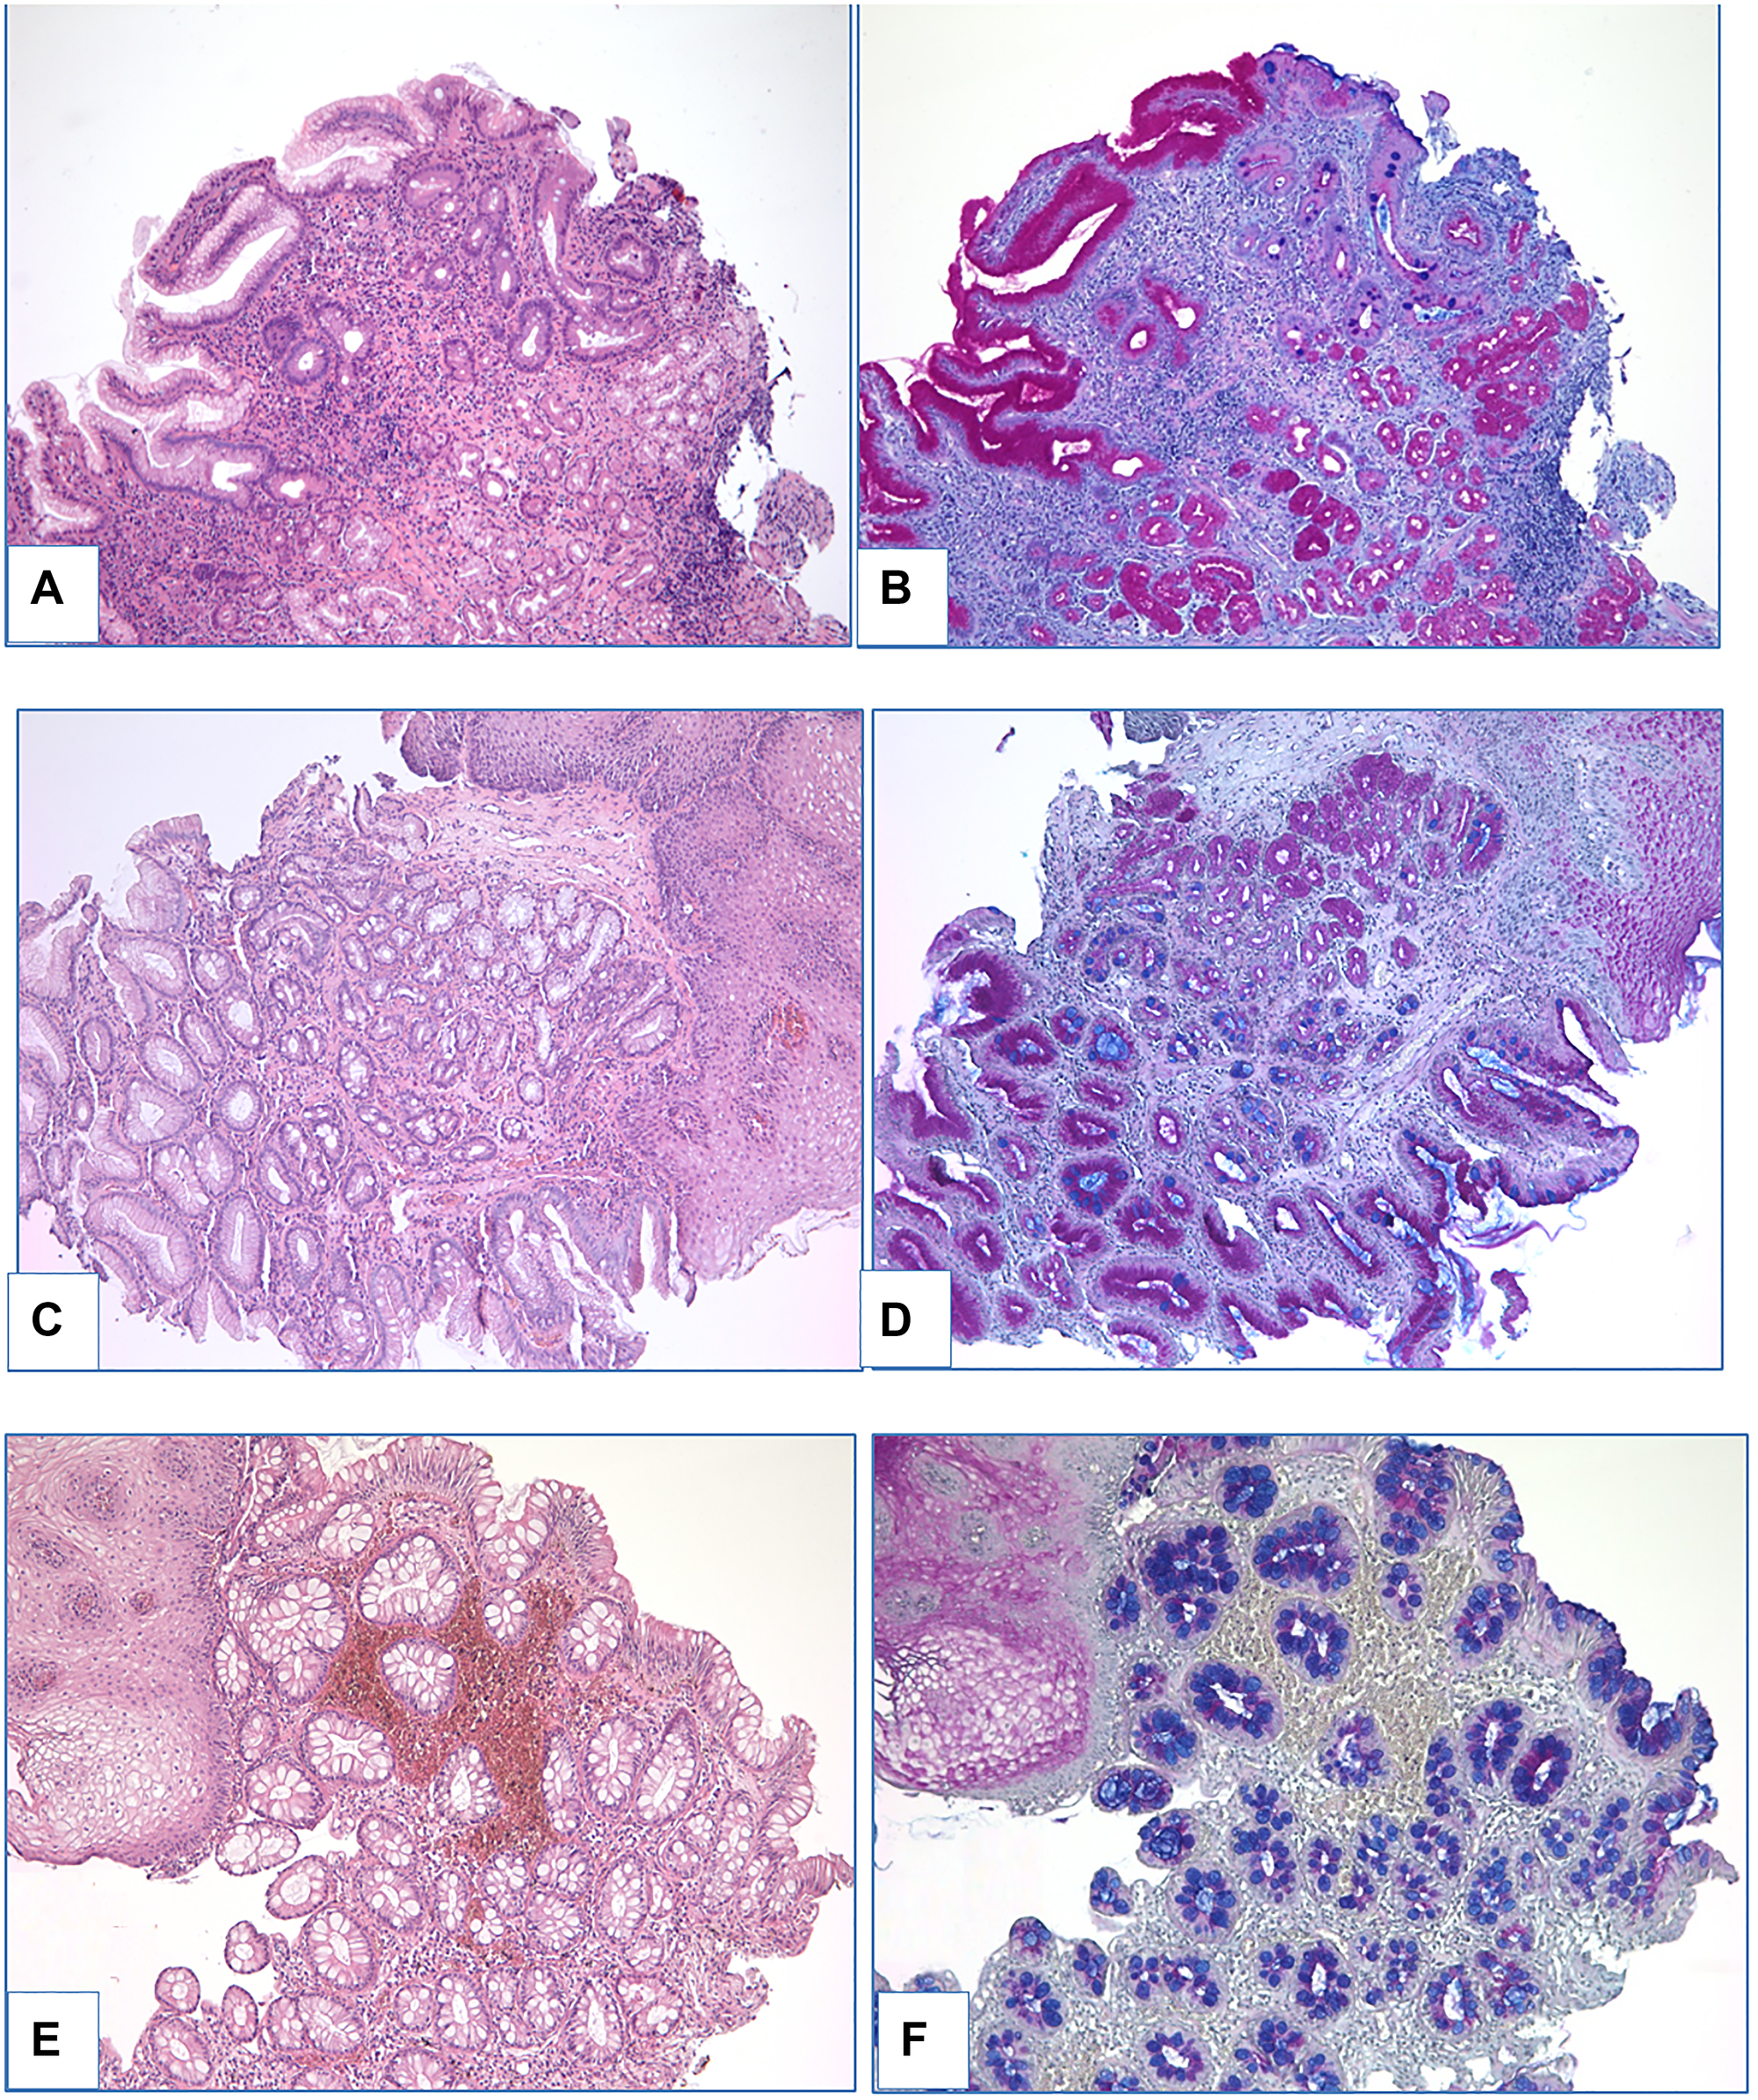
Figure 11: Different density of GC (A–B: few GC; C–D: low density of GC; E–F: high density of GC). (A, C, E) – heamatoxylin and eosin staining, (B, D, F) – PAS-reaction with alcian blue staining, magnification ×100.
Dysplasia grading
Assessment of dysplasia was made by two independent pathologists. Only cases of dysplasia verified by both pathologists were enrolled in the study. IHC evaluation with gastric markers MUC5AC (CLH2, Leica Novocastra, 1:100) and MUC6 (MRQ-20, Ventana, ready to use) and intestinal marker MUC2 was performed in specimens with dysplasia in order to compare immunostaining in foveolar and adenomatous types as it was described by Brown I.S. et al. [31], Khor T.S. et al. [36]. Evaluation of IHC reactions was conducted in a semi-quantitative manner: grade 0 — expression in 0–4% epithelial cells, +1 — expression in 5–50% epithelial cells, +2 – expression in 51–75% epithelial cells, +3 – expression in >75% epithelial cells.
Statistical evaluation
Statistical analysis was performed using Statistica 10.0 software (StatSoft Inc., USA). Nonparametric methods were applied. Fisher’s exact test and odds ratio (OR) were used for qualitative variables. Spearman’s rank correlation coefficient was calculated for investigation of correlation between quantitative morphometric parameters and segment length. Differences were considered statistically significant when confidence level reached p < 0,05.
Ethics statement
Current research study was approved by the Ethics Committee of the Research Institute of Human Morphology. Written informed consent was obtained from all participants included in the study.
CONFLICTS OF INTEREST
Authors have no conflicts of interest to declare.
References
1. Fitzgerald RC, di Pietro M, Ragunath K, Ang Y, Kang JY, Watson P, Trudgill N, Patel P, Kaye PV, Sanders S, O'Donovan M, Bird-Lieberman E, Bhandari P, et al, and British Society of Gastroenterology. British Society of Gastroenterology guidelines on the diagnosis and management of Barrett's oesophagus. Gut. 2014; 63:7–42. https://doi.org/10.1136/gutjnl-2013-305372. [PubMed].
2. Bennett C, Moayyedi P, Corley DA, DeCaestecker J, Falck-Ytter Y, Falk G, Vakil N, Sanders S, Vieth M, Inadomi J, Aldulaimi D, Ho KY, Odze R, et al, and BOB CAT Consortium. BOB CAT: A Large-Scale Review and Delphi Consensus for Management of Barrett's Esophagus With No Dysplasia, Indefinite for, or Low-Grade Dysplasia. Am J Gastroenterol. 2015; 110:662–82. https://doi.org/10.1038/ajg.2015.55. [PubMed].
3. Shaheen NJ, Falk GW, Iyer PG, Gerson LB, and American College of Gastroenterology. ACG Clinical Guideline: Diagnosis and Management of Barrett’s Esophagus. Am J Gastroenterol. 2016; 111:30–50. https://doi.org/10.1038/ajg.2015.322. [PubMed].
4. Barrett’s Esophagus pathology. Clinical recommendations. Russian Society of Pathology. 2016. http://www.patolog.ru/news/utverzhdennye-rop-klinicheskie-rekomendacii-po-morfologicheskoy-diagnostike-zabolevaniy.
5. Salimian KJ, Waters KM, Eze O, Pezhouh MK, Tarabishy Y, Shin EJ, Canto MI, Voltaggio L, Montgomery EA. Definition of Barrett Esophagus in the United States: Support for Retention of a Requirement for Goblet Cells. Am J Surg Pathol. 2018; 42:264–68. https://doi.org/10.1097/PAS.0000000000000971. [PubMed].
6. Gatenby PA, Ramus JR, Caygill CP, Shepherd NA, Watson A. Relevance of the detection of intestinal metaplasia in non-dysplastic columnar-lined oesophagus. Scand J Gastroenterol. 2008; 43:524–30. https://doi.org/10.1080/00365520701879831. [PubMed].
7. Kelty CJ, Gough MD, Van Wyk Q, Stephenson TJ, Ackroyd R. Barrett's oesophagus: intestinal metaplasia is not essential for cancer risk. Scand J Gastroenterol. 2007; 42:1271–74. https://doi.org/10.1080/00365520701420735. [PubMed].
8. Lavery DL, Martinez P, Gay LJ, Cereser B, Novelli MR, Rodriguez-Justo M, Meijer SL, Graham TA, McDonald SA, Wright NA, Jansen M. Evolution of oesophageal adenocarcinoma from metaplastic columnar epithelium without goblet cells in Barrett's oesophagus. Gut. 2016; 65:907–13. https://doi.org/10.1136/gutjnl-2015-310748. [PubMed].
9. Odze R. Histology of Barrett's Metaplasia: Do Goblet Cells Matter? Dig Dis Sci. 2018; 63:2042–51. https://doi.org/10.1007/s10620-018-5151-z. [PubMed].
10. Takubo K, Aida J, Naomoto Y, Sawabe M, Arai T, Shiraishi H, Matsuura M, Ell C, May A, Pech O, Stolte M, Vieth M. Cardiac rather than intestinal-type background in endoscopic resection specimens of minute Barrett adenocarcinoma. Hum Pathol. 2009; 40:65–74. https://doi.org/10.1016/j.humpath.2008.06.008. [PubMed].
11. Watanabe G, Ajioka Y, Takeuchi M, Annenkov A, Kato T, Watanabe K, Tani Y, Ikegami K, Yokota Y, Fukuda M. Intestinal metaplasia in Barrett's oesophagus may be an epiphenomenon rather than a preneoplastic condition, and CDX2-positive cardiac-type epithelium is associated with minute Barrett's tumour. Histopathology. 2015; 66:201–14. https://doi.org/10.1111/his.12486. [PubMed].
12. Oberg S, Johansson J, Wenner J, Johnsson F, Zilling T, von Holstein CS, Nilsson J, Walther B. Endoscopic surveillance of columnar-lined esophagus: frequency of intestinal metaplasia detection and impact of antireflux surgery. Ann Surg. 2001; 234:619–26. https://doi.org/10.1097/00000658-200111000-00006. [PubMed].
13. Harrison R, Perry I, Haddadin W, McDonald S, Bryan R, Abrams K, Sampliner R, Talley NJ, Moayyedi P, Jankowski JA. Detection of intestinal metaplasia in Barrett's esophagus: an observational comparator study suggests the need for a minimum of eight biopsies. Am J Gastroenterol. 2007; 102:1154–61. https://doi.org/10.1111/j.1572-0241.2007.01230.x. [PubMed].
14. Chandrasoma PT, Der R, Dalton P, Kobayashi G, Ma Y, Peters J, Demeester T. Distribution and significance of epithelial types in columnar-lined esophagus. Am J Surg Pathol. 2001; 25:1188–93. https://doi.org/10.1097/00000478-200109000-00010. [PubMed].
15. Helman L, Biccas BN, Lemme EM, Novais P, Fittipaldi V. Esophageal manometry findings and degree of acid exposure in short and long Barrett's esophagus. Arq Gastroenterol. 2012; 49:64–68. https://doi.org/10.1590/s0004-28032012000100011. [PubMed].
16. Loughney T, Maydonovitch CL, Wong RK. Esophageal manometry and ambulatory 24-hour pH monitoring in patients with short and long segment Barrett's esophagus. Am J Gastroenterol. 1998; 93:916–19. https://doi.org/10.1111/j.1572-0241.1998.00276.x. [PubMed].
17. Pfaffenbach B, Hullerum J, Orth KH, Langer M, Stabenow-Lohbauer U, Lux G. Bile and acid reflux in long and short segment Barrett's esophagus, and in reflux disease. Z Gastroenterol. 2000; 38:565–70. https://doi.org/10.1055/s-2000-7450. [PubMed].
18. Srivastava A, Golden KL, Sanchez CA, Liu K, Fong PY, Li X, Cowan DS, Rabinovitch PS, Reid BJ, Blount PL, Odze RD. High Goblet Cell Count Is Inversely Associated with Ploidy Abnormalities and Risk of Adenocarcinoma in Barrett's Esophagus. PLoS One. 2015; 10:e0133403. https://doi.org/10.1371/journal.pone.0133403. [PubMed].
19. Menke V, van Es JH, de Lau W, van den Born M, Kuipers EJ, Siersema PD, de Bruin RW, Kusters JG, Clevers H. Conversion of metaplastic Barrett's epithelium into post-mitotic goblet cells by gamma-secretase inhibition. Dis Model Mech. 2010; 3:104–10. https://doi.org/10.1242/dmm.003012. [PubMed].
20. Biswas S, Quante M, Leedham S, Jansen M. The metaplastic mosaic of Barrett's oesophagus. Virchows Arch. 2018; 472:43–54. https://doi.org/10.1007/s00428-018-2317-1. [PubMed].
21. McDonald SA, Graham TA, Lavery DL, Wright NA, Jansen M. The Barrett's Gland in Phenotype Space. Cell Mol Gastroenterol Hepatol. 2014; 1:41–54. https://doi.org/10.1016/j.jcmgh.2014.10.001. [PubMed].
22. Quante M, Graham TA, Jansen M. Insights Into the Pathophysiology of Esophageal Adenocarcinoma. Gastroenterology. 2018; 154:406–20. https://doi.org/10.1053/j.gastro.2017.09.046. [PubMed].
23. Chandrasoma PT, Der R, Ma Y, Peters J, Demeester T. Histologic classification of patients based on mapping biopsies of the gastroesophageal junction. Am J Surg Pathol. 2003; 27:929–36. https://doi.org/10.1097/00000478-200307000-00008. [PubMed].
24. Theodorou D, Ayazi S, DeMeester SR, Zehetner J, Peyre CG, Grant KS, Augustin F, Oh DS, Lipham JC, Chandrasoma PT, Hagen JA, DeMeester TR. Intraluminal pH and goblet cell density in Barrett's esophagus. J Gastrointest Surg. 2012; 16:469–74. https://doi.org/10.1007/s11605-011-1776-3. [PubMed].
25. Bansal A, McGregor DH, Anand O, Singh M, Rao D, Cherian R, Wani SB, Rastogi A, Singh V, House J, Jones PG, Sharma P. Presence or absence of intestinal metaplasia but not its burden is associated with prevalent high-grade dysplasia and cancer in Barrett's esophagus. Dis Esophagus. 2014; 27:751–56. https://doi.org/10.1111/dote.12151. [PubMed].
26. Schellnegger R, Quante A, Rospleszcz S, Schernhammer M, Höhl B, Tobiasch M, Pastula A, Brandtner A, Abrams JA, Strauch K, Schmid RM, Vieth M, Wang TC, Quante M. Goblet Cell Ratio in Combination with Differentiation and Stem Cell Markers in Barrett Esophagus Allow Distinction of Patients with and without Esophageal Adenocarcinoma. Cancer Prev Res (Phila). 2017; 10:55–66. https://doi.org/10.1158/1940-6207.CAPR-16-0117. [PubMed].
27. Kunze B, Wein F, Fang HY, Anand A, Baumeister T, Strangmann J, Gerland S, Ingermann J, Münch NS, Wiethaler M, Sahm V, Hidalgo-Sastre A, Lange S, et al. Notch Signaling Mediates Differentiation in Barrett's Esophagus and Promotes Progression to Adenocarcinoma. Gastroenterology. 2020; 159:575–90. https://doi.org/10.1053/j.gastro.2020.04.033. [PubMed].
28. Naini BV, Souza RF, Odze RD. Barrett's Esophagus: A Comprehensive and Contemporary Review for Pathologists. Am J Surg Pathol. 2016; 40:e45–66. https://doi.org/10.1097/PAS.0000000000000598. [PubMed].
29. Montgomery E, Arnold CA, Lam-Himlin D, Salimian K, Waters K. Some observations on Barrett esophagus and associated dysplasia. Ann Diagn Pathol. 2018; 37:75–82. https://doi.org/10.1016/j.anndiagpath.2018.09.013. [PubMed].
30. Montgomery E, Voltaggio L. Biopsy interpretation of thegastrointestinal tract mucosa. Third edition. Philadelphia: Wolters Kluwer. 2018; 2:12–34.
31. Brown IS, Whiteman DC, Lauwers GY. Foveolar type dysplasia in Barrett esophagus. Mod Pathol. 2010; 23:834–43. https://doi.org/10.1038/modpathol.2010.59. [PubMed].
32. Mahajan D, Bennett AE, Liu X, Bena J, Bronner MP. Grading of gastric foveolar-type dysplasia in Barrett's esophagus. Mod Pathol. 2010; 23:1–11. https://doi.org/10.1038/modpathol.2009.147. [PubMed].
33. Rucker-Schmidt RL, Sanchez CA, Blount PL, Ayub K, Li X, Rabinovitch PS, Reid BJ, Odze RD. Nonadenomatous dysplasia in barrett esophagus: a clinical, pathologic, and DNA content flow cytometric study. Am J Surg Pathol. 2009; 33:886–93. https://doi.org/10.1097/PAS.0b013e318198a1d4. [PubMed].
34. Sawas T, Killcoyne S, Iyer PG, Wang KK, Smyrk TC, Kisiel JB, Qin Y, Ahlquist DA, Rustgi AK, Costa RJ, Gerstung M, Fitzgerald RC, Katzka DA, and OCCAMS Consortium. Identification of Prognostic Phenotypes of Esophageal Adenocarcinoma in 2 Independent Cohorts. Gastroenterology. 2018; 155:1720–28.e4. https://doi.org/10.1053/j.gastro.2018.08.036. [PubMed].
35. Sawas T, Azad N, Killcoyne S, Iyer PG, Wang KK, Fitzgerald RC, Katzka DA. Comparison of Phenotypes and Risk Factors for Esophageal Adenocarcinoma at Present vs Prior Decades. Clin Gastroenterol Hepatol. 2020; 18:2710–16.e1. https://doi.org/10.1016/j.cgh.2019.11.014. [PubMed].
36. Khor TS, Alfaro EE, Ooi EM, Li Y, Srivastava A, Fujita H, Park Y, Kumarasinghe MP, Lauwers GY. Divergent expression of MUC5AC, MUC6, MUC2, CD10, and CDX-2 in dysplasia and intramucosal adenocarcinomas with intestinal and foveolar morphology: is this evidence of distinct gastric and intestinal pathways to carcinogenesis in Barrett Esophagus? Am J Surg Pathol. 2012; 36:331–42. https://doi.org/10.1097/PAS.0b013e31823d08d6. [PubMed].
37. Sharma P, Bergman JJ, Goda K, Kato M, Messmann H, Alsop BR, Gupta N, Vennalaganti P, Hall M, Konda V, Koons A, Penner O, Goldblum JR, Waxman I. Development and Validation of a Classification System to Identify High-Grade Dysplasia and Esophageal Adenocarcinoma in Barrett's Esophagus Using Narrow-Band Imaging. Gastroenterology. 2016; 150:591–98. https://doi.org/10.1053/j.gastro.2015.11.037. [PubMed].
38. Kandiah K, Chedgy FJQ, Subramaniam S, Longcroft-Wheaton G, Bassett P, Repici A, Sharma P, Pech O, Bhandari P. International development and validation of a classification system for the identification of Barrett's neoplasia using acetic acid chromoendoscopy: the Portsmouth acetic acid classification (PREDICT). Gut. 2018; 67:2085–91. https://doi.org/10.1136/gutjnl-2017-314512. [PubMed].
39. Sharma P, Dent J, Armstrong D, Bergman JJ, Gossner L, Hoshihara Y, Jankowski JA, Junghard O, Lundell L, Tytgat GN, Vieth M. The development and validation of an endoscopic grading system for Barrett's esophagus: the Prague C & M criteria. Gastroenterology. 2006; 131:1392–99. https://doi.org/10.1053/j.gastro.2006.08.032. [PubMed].
40. Srivastava A, Odze RD, Lauwers GY, Redston M, Antonioli DA, Glickman JN. Morphologic features are useful in distinguishing Barrett esophagus from carditis with intestinal metaplasia. Am J Surg Pathol. 2007; 31:1733–41. https://doi.org/10.1097/PAS.0b013e318078ce91. [PubMed].