
Introduction
Increasing number of studies report that proteins do not work in isolation but are part of a complex network of biomolecules, that may differ at various settings (e.g., different tumor types [1, 2] or stages of tumor progression [3]). Various examples of genes with opposing roles, e.g., during tumorigenesis, have been described in literature [4–7]. DNA methylation may be one of the drivers of these opposing roles. For example, the same DNA methylation mark can lead to very opposite outcomes (embryonic viability versus lethality) depending on which allele is tagged with this modification [8]. Here we will test whether the same epigenetic modification could also orchestrate molecular and phenotypic diversity in non-imprinted genes.
In this study, we will focus on the insulin-like growth factor binding protein 2 (IGFBP2), a recently discovered multitasked gene regulated by DNA methylation which has also been reported to function both as a tumor-promoting and -suppressing gene. IGFBP2 is a secreted protein that competes with IGF-1 and IGF-2 ligands for IGF receptor binding, thereby modulating the downstream cascade of IGF signaling that mediates essential cellular processes such as proliferation and migration. On one hand, it has been described as a tumor suppressor by promoting a p53-dependent IGF-1 and ERK inactivation and therefore leading to proliferation attenuation [9]. Additionally, in cooperation with TGFB1, SERPINE1, and BCL2 it has been shown to induce apoptosis and block migration [10]. On the other hand, IGFBP2 has been shown to act as an oncogene since it promotes invasion through interaction with integrin α5 and β1 [11, 12], it activates the NFkβ-Zeb1 [13] and EGFR/STAT3 axes [14], it promotes vascular mimicry by CD144 and MMP2 [15], and it induces immunosuppression [16].
The diverse phenotypes upon single alterations in cancer driver genes may simply reflect the various roles of these genes in distinct signaling pathways, but it may also be caused by differential gene expression patterns of these genes. For example, the hormone estradiol upregulates the expression levels of IGFBP2 in MCF7 cells whilst in R3230AC mammary adenocarcinoma it leads its downregulation [17–19]. However, it is unknown whether other regulatory mechanisms of gene expression, such as DNA methylation [20], can also lead to opposing expression patterns in different cell types when the levels of DNA methylation remain constant (similarly to the hormone situation). DNA methylation comprises a significant mechanism involved in transcriptomic regulation based on the occupancy of CpG dinucleotides by 5’-methylcytosine chemical groups [21–23]. Whether the consequence of DNA methylation on the expression of the target genes and cell fate is uniform regardless of the cell type or can drive to opposing phenotypes depending on the tumor cell context is still unknown, and it has remained elusive for many years due to the lack of technologies to target DNA methylation in-situ.
Here, we take advantage of the CRISPR/Cas epigenome editing technology [24], and evaluate the contribution of this de-novo epigenetic modification to IGFBP2 transcriptomic regulation and cell plasticity. We report the first CRISPR/dCas9 epigenetic editing of the IGFBP2 promoter showing long-term and bona-fide inheritance of DNA methylation by daughter cells. Our study also highlights that comparable increments of DNA methylation can lead to opposing transcription effects on the expression of the target gene in different tumor cell types and leads to dysregulation of mesenchymal genes and one apoptotic marker. Moreover, we show that DNA methylation can induce a phenotypic switch in migration and cell morphology.
Results
Gene-specific DNA methylation by CRISPR/dCas9/DNMT3ACD module
To target specific DNA methylation sites in-vitro, we used the inactive Cas9 endonuclease (dCas9, the targeting domain, p.D9A and p.H840A) fused to DNMT3ACD. The predicted tethering of the fusion protein to the genomic DNA is depicted in Figure 1A. Two nuclear localization sequences were placed upstream and downstream of the Cas9 sequence to promote an enrichment of the fusion protein into the nucleus. To select positive cells expressing the dCas9-DNMT3ACD construct, eGFP fluorescence sequence was coupled to the 3’-terminus of the DNMT3ACD using a T2A linker. First, we validated our system by targeting the exact differential methylation regions (DMRs) reported by Vojta et al. (2016) regarding the BACH2 gene (Supplementary Figure 1A). Pyrosequencing confirmed the same average levels of DNA methylation in DMR1 as previously reported (Supplementary Figure 1B). Moreover, some individual CpG sites of the DMR2 reached peaks of DNA methylation close to the reported values (e.g., CpG1, 6% when using control sgRNAs and 15% when targeting BACH2 promoter with sgRNA 3). This data shows that our approach to target specific methylation sites works to a comparable extent as it has been reported previously for a similar approach [25].
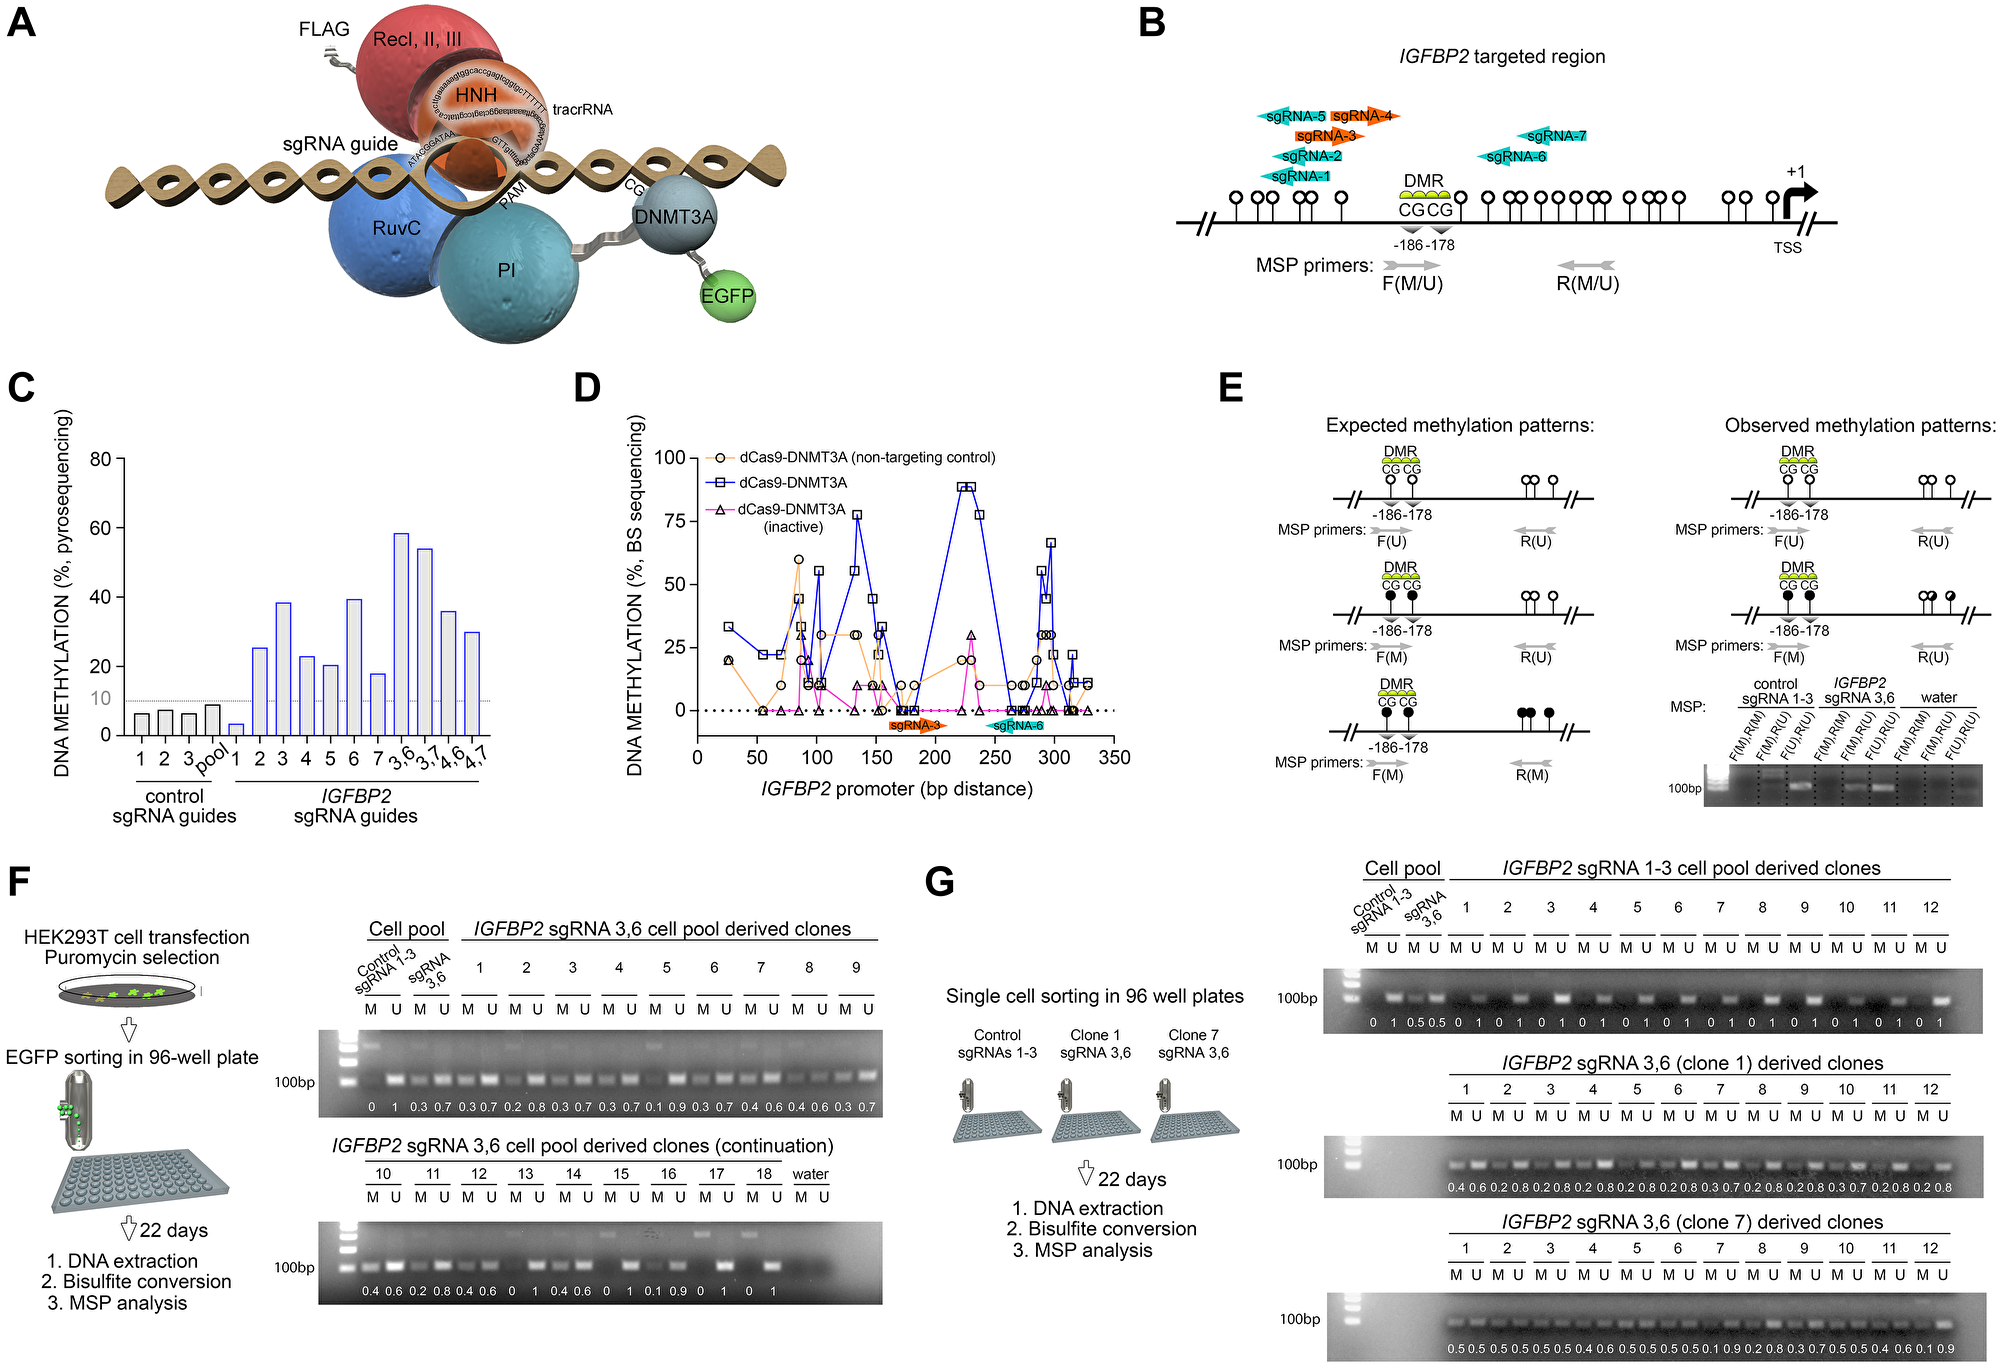
Figure 1: RNA-programmed DNA methylation of IGFBP2 promoter introduces stable and heritable marks across mitotic cell divisions. (A) Predicted structure of the dCas9 protein fused with the DNMT3ACD and DNA-anchoring guided by the sgRNA sequence. The recognition lobe (RecI, II and III domains) and the nuclease lobe (HNH, RuvC and PI domains) of Cas9 protein are also represented. (B) Location of the sgRNA guides in the promoter region of the IGFBP2 gene. The two CpG sites interrogated are denoted as differential methylated region (DMR) and placed according to their distance to the transcription start site (TSS). White lollipops represent adjacent CpG sites. Methyl-specific primer (MSP) location. F/R(M), forward/reverse primer for methylated region; F/R(U), forward/reverse primer for unmethylated region. (C) Pyrosequencing analysis for the evaluation of DNA methylation in HEK293T cells comparing cells targeted with control or IGFBP2-specific guides. Single and pooled sgRNA guides were tested. (D) Increase in CpG methylation level in the IGFBP2 promoter region targeted by either pooled control sgRNAs/dCas9-DNMT3A (active), specific sgRNAs/dCas9-DNMT3A (active), or specific sgRNAs/dCas9-DNMT3A (inactive) constructs. (E) Schematic representation of the expected and observed DNA methylation patterns after CRISPR/dCas epigenetic editing and pyrosequencing. Confirmation of pyrosequencing results by MSP (amplicon size 102 bp). F/R(M), forward/reverse primer for methylated region; F/R(U), forward/reverse primer for unmethylated region. (F) Strategy followed to isolate individual cells from the transfected population for the study of DNA methylation stability. MSP PCR amplifications obtained from cells transfected with a pool of control sgRNA guides 1-3 (gel lanes 1 and 2); a pool of IGFBP2 specific sgRNA guides 3 and 6 (gel lanes 3 and 4); and 18 single clones derived from the targeted cell population (sgRNAs 3,6) after 22 days of cell culture. Gel band densitometries are indicated. (G) Long-term DNA methylation analysis performed on 12 single control clones (derived from the pooled sgRNAs 1-3 cell population) and 12 single IGFBP2 targeted clones derived from Figure 1G clones 1 and 7. Lanes 1-2 (control pooled sgRNAs 1-3) and 3-4 (IGFBP2 targeted pooled sgRNAs 3,6) represent the negative and positive controls for DNA methylation, respectively. Gel band densitometries are indicated.
DNA methylation of IGFBP2 promoter is stable across mitotic cell divisions
Using our validated system, we evaluated the transiently-performed de-novo targeted DNA methylation of IGFBP2 promoter and its stable inheritance across several rounds of mitotic cell divisions. We selected seven sgRNA sequences targeting the IGFBP2 promoter CpG site 1 and 2 (Figure 1B). DNA methylation was targeted in this specific region which represents the binding site of p53, one of the transcription factors involved in IGFBP2 gene expression. HEK293T cells were transfected with the dCas9-DNMT3ACD construct and its expression was evaluated on a protein level detecting a band by western blot at the expected size (210 kDa) using an anti-flag antibody (Supplementary Figure 2A). To target DNA methylation, HEK293T cells were transfected with dCas9-DNMT3ACD construct and the corresponding sgRNA guides. Five days post transfection dCas9-DNMT3ACD-positive cells were selected based on their eGFP expression (Supplementary Figure 2B). Pyrosequencing revealed that the sgRNAs located within a window of 27–30 bp upstream or downstream of the targeted CpG sites rendered the higher increments of DNA methylation in comparison to the control sgRNAs (Figure 1C). Particularly, single sgRNAs 3 and 6 managed the higher individual increments of DNA methylation in the two targeted CpGs (up to 40%). Interestingly, the combination of sgRNAs 3 and 6 or 3 and 7, which target the region of interest in a head-to-head orientation, exhibited the highest DNA methylation efficiencies (up to 60%), demonstrating that the combination of sgRNAs is crucial for more efficient targeting (Figure 1C). Bisulfite sequencing performed on the same genomic locus validated the pyrosequencing data and revealed a clear gain of DNA methylation when the active form of the DNMT3A enzyme is tethered to the targeted region (Figure 1D, Supplementary Figure 3A). Additionally, and confirming previously reported observations [25], bisulfite sequencing showed peaks of DNA methylation occurring on the flanking regions of the dCas9 binding, at 27–30 bp distance from the PAM sequence (Figure 1D, Supplementary Figure 3A).
To measure the stability of DNA methylation inheritance, we set up the methyl-specific primer (MSP) assay for our region of interest. This technique permits to analyze a high number of samples with minimum costs in comparison with pyrosequencing approach. First, MSP tests confirmed that DNA methylation is not gained in the distal downstream CpG sites of the targeted region, but instead in the interrogated CpG sites (Figure 1E), supporting the pyrosequencing data. In order to quantify methylation, we made use of the fact that the downstream CpG sites remained always unmethylated, and carried out all MSP PCR amplifications using an unmethylated-specific reverse primer. When non-specific sgRNAs were transfected, the interrogated CpG sites remained unmethylated, whilst the pooled sgRNAs 3 and 6 provided a MSP PCR amplification pattern in accordance with the DNA methylation levels detected by pyrosequencing and bisulfite sequencing (Figure 1E).
To determine the inheritance of the de-novo epigenetic mark, both pooled control sgRNAs 1–3 and sgRNAs 3 and 6 cell populations were eGFP sorted, single cells were isolated and clonal lines were derived (Figure 1F). After 22 days and hence several rounds of cell divisions, clonal MSP PCR amplifications showed that most of the single clones targeted with pooled sgRNAs 3 and 6 remained methylated (77.8%, 14 out of 18 clones) (Figure 1F). Bisulfite sequencing performed on two randomly selected clones validated the MSP results confirming the hypermethylation of the targeted region after 22 days in culture (Supplementary Figure 3B). Additionally, in order to further characterize the long-term inheritance of this targeted epigenetic mark, two randomly selected CRISPR/dCas IGFBP2 targeted clonal populations (1 and 7) were expanded and seeded again as singles clones by sorting. After another 22 days of expansion, the analysis of 12 derived clones per condition indicated that DNA methylation was fully retained in most of the the interrogated clonal populations targeted with sgRNAs 3 and 6 (Figure 1G). Bisulfite sequencing confirmed the full long-term retention of DNA methylation in one of the randomly selected clones (88%) and a partial retention in a second clone after 44 days in culture (25%, Supplementary Figure 3C). Combined, our data show that the CRISPR/dCas-DNMT3ACD system facilitates specific promoter methylation of the IGFBP2 gene with a 60–89% efficiency and that its retention lasted several round of population doublings in the actively dividing HEK293T cells.
Target DNA methylation on IGFBP2 promoter modifies mRNA levels
After showing that IGFBP2 promoter is epigenetically editable, we next questioned if this could have any impact on the transcriptional levels. We compared four control conditions based on three single non-targeting control sgRNAs (used independently or as a pool), and two different combination of targeting sgRNAs (sgRNAs 3 and 6; and sgRNAs 3 and 7). As expected, by increasing the levels of methylation, we observed a significant reduction in the transcriptional levels of IGFBP2 gene when the active DNMT3A construct was specifically targeted into this locus (Figure 2A). The methylation of IGFBP2 promoter did not led to the transcriptional dysregulation of EMT regulatory genes CDH1, VIM1 or TGFB1. However, we found a significant differential expression of the apoptotic marker BCL2 depending on the levels of methylation of IGFBP2 promoter (Supplementary Figure 4A). In conclusion, in HEK293T cells, targeted DNA methylation on IGFBP2 promoter affects its own transcription and the levels of expression of BCL2 apoptotic regulatory gene.
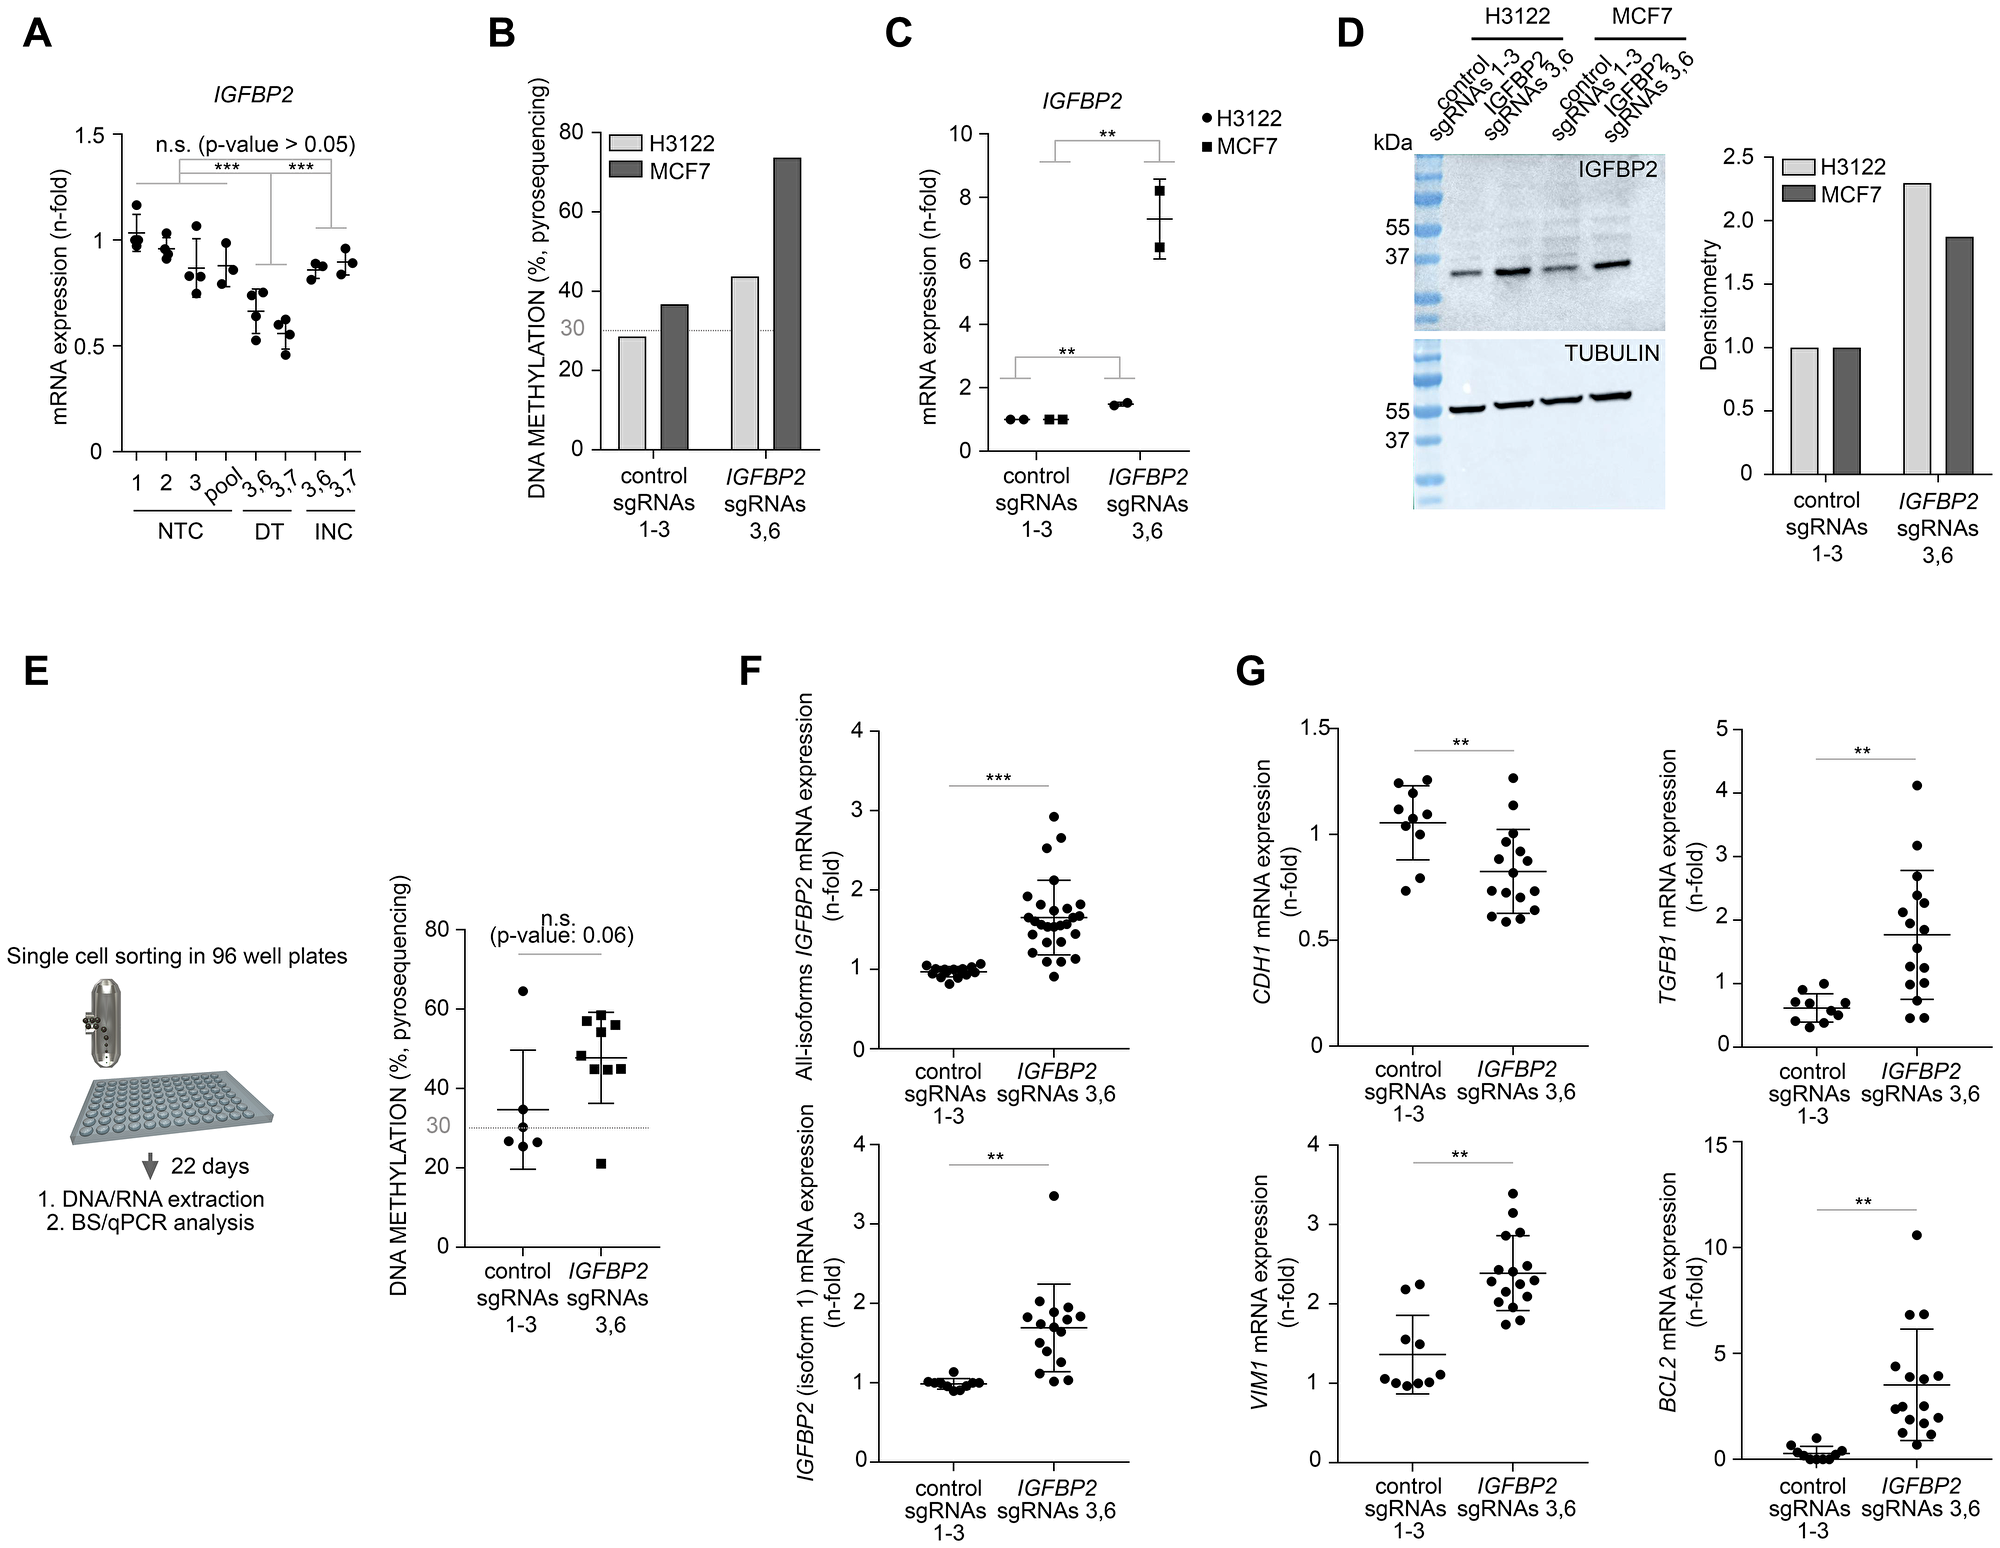
Figure 2: CRISPR/dCas targeted DNA methylation of IGFBP2 promoter affects gene transcription and EMT transcriptomics in cancer cells. (A) qPCR analysis to evaluate the expression of IGFBP2 gene in HEK293T cells. NTC: non-targeting control, DT: direct targeting, INC: DNMT3A inactive control. Comparisons are stablished between 3-4 independent biological replicates [including control populations (both single or pooled control sgRNAs 1–3) and 2 independent IGFBP2 targeted populations (sgRNAs 3,6 and 3,7)]. Data is normalized using first control and housekeeping genes B2M and PPIA (error bars represent SD). Individual p-values were obtained from Tukey’s multiple comparison test. (B) Pyrosequencing analysis for the evaluation of DNA methylation in H3122 and MCF7 cells comparing cells targeted with control or IGFBP2-specific guides 3 and 6. (C) qPCR analysis to evaluate the expression of IGFBP2 in H3122 and MCF7 cells. Data is normalized using first control and housekeeping gene B2M (error bars represent SD of two independent biological replicates). (D) Western blot and densitometry showing the expression of IGFBP2 after CRISPR/dCas editing in H3122 and MCF7 cells. (E) Left panel, strategy followed to isolate individual clones from MCF7 cells transfected with pooled control sgRNAs 1-3 or IGFBP2-specific guides 3 and 6. All derived clones from each condition were evaluated for the levels of DNA methylation by pyrosequencing (right panel). P-value was obtained using Mann-Whitney test. (F) The expression of IGFBP2 all-isoforms (upper panel) and IGFBP2 isoform 1 (lower panel) was evaluated for all single clones from each condition. Statistics were performed comparing 2 independent biological replicates [including 7 independent control clones (pooled control sgRNAs 1–3) and 10 independent IGFBP2 targeted clones (sgRNAs 3,6)]. Data was normalized using first control and housekeeping genes B2M and PPIA (error bars represent SD). (G) qPCR analysis to evaluate the expression of mesenchymal genes (CDH1, VIM1, TGFB1) and apoptotic marker BCL2 in MCF7 clones from Figure 2F. Comparisons are stablished using data from two independent biological replicates (including 7 independent single clones transfected with pooled control sgRNAs 1–3 and 10 independent single clones transfected with IGFBP2-specific sgRNAs 3 and 6). Data is normalized using first control and housekeeping genes B2M and PPIA (error bars represent SD). qPCR statistical analysis were performed using one sample T-test after log2 data transformation. Two–tailed p-values ≤ 0.05, ≤ 0.01, or ≤ 0.001 are considered statistically significant and indicated by an asterisk (*, **, or ***, respectively).
Gain of DNA methylation of IGFBP2 promoter increases expression levels of mesenchymal-like genes in epithelial-like tumor cells
In order to study the effect of targeting IGFBP2 promoter DNA methylation on cell plasticity, we proceeded by conducting similar experiments in two epithelial tumor cells lines (H3122 and MCF7). H3122 is a lung adenocarcinoma cell line and MCF7 cells represent a breast cancer cell line. First, we achieved a significant increase of DNA methylation of 43.8% and 73.7% in H3122 and MCF7 cell lines, respectively (Figure 2B). Bisulfite sequencing validated these results with levels of methylation of 50% and 86% in H3122 and MCF7, respectively (Supplementary Figure 4B and 4C). This epigenetic editing led to a significant dysregulation in the transcriptional levels of IGFBP2 gene. Surprisingly, opposite to what we observed in HEK293T cells, in these epithelial tumor models there was a significant upregulation of the mRNA and protein levels upon CRISPR/dCas targeting with locus-specific sgRNAs (Figure 2C and 2D).
To follow up on this surprising observation, which contradicts the canonical view that DNA methylation on gene promoters downregulate gene expression, we repeated the epigenetic editing using a new batch of MCF7 cells. In these cells we included the inactive DNMT3A construct as an additional control. First, we noticed that the new batch of cells showed a remarkable low basal level of DNA methylation in the IGFBP2 locus compared to the old batch (0% vs 22%, Supplementary Figures 4B and 5A), highlighting epigenetic divergence within the same cell type. By targeting the IGFBP2 locus with the active DNMT3A and unspecific guides or the inactive DNMT3A and locus-specific guides, we observed a modest gain of background methylation (38%), comparable to the old batch. However, direct targeting using the active construct and locus-specific guides managed an increase of DNA methylation up to 69% (Supplementary Figure 5A). This indicates that the locus is epigenetically editable in the new batch of cells but also reveals that the gain of DNA methylation is almost 20% less efficient than using the old batch of cells. As we initially expected, mRNA expression data revealed a non-significant but consistent downregulation of IGFBP2 upon epigenetic editing with the active DNMT3A in the new MCF7 batch (Supplementary Figure 5B). Importantly, cell check validations identified all the cell lines and batches used in this study and confirmed their suspected origin (Supplementary Figure 5C). Overall, our data suggests that the basal levels of DNA methylation and the efficiency of CRISPR/dCas9/DNMT3A targeting could determine the downstream transcriptional effects.
Intrigued by our observation of IGFBP2 upregulation by DNA hypermethylation in two independent tumor cells lines (H3122 and MCF7), we continued exploring in greater detail the old MCF7 batch which showed the highest IGFBP2 mRNA upregulation. First, we took a closer look into the IGFBP2 mRNA isoforms. The IGFBP2 gene contains four mRNA isoforms but only isoform 1 (NM_000597) overlaps with the targeted CpG island. Additionally, to reveal if cell heterogeneity was responsible for these unexpected results, we performed the analysis on 7 (pooled sgRNAs 1–3) and 10 (pooled IGFBP2 sgRNAs 3 and 6) MCF7 single cell clones. Pyrosequencing analysis of individual clones confirmed a clear DNA methylation enrichment when the promoter region of IGFBP2 was targeted by CRISPR/dcas9/DNMT3A (Figure 2E). Importantly, qPCR data revealed that the increase in DNA methylation was specifically associated with the upregulation of IGFBP2 isoform 1 (the more prevalent isoform) in most of the clones tested (Figure 2F). Isoforms 2, 3 and 4 were also analyzed but the expression levels were very low or even absent and did not differ between clones (data not shown). Therefore, the differences in mRNA expression levels between control and targeted clones were mainly explained by the expression of IGFBP2 isoform 1.
Taking advantage of the reported evidences that IGFBP2 can affect the transcriptional levels of EMT [26] and apoptotic markers [10], we interrogated the single clones derived from the MCF7 cell line and could confirm the significant impact of this epigenetic modification on the transcriptional levels of EMT and apoptotic related genes upon IGFBP2 hypermethylation. IGFBP2 hypermethylation led to the downregulation of CDH1 and upregulation of VIM1 and TGFB1 genes (Figure 2G). Additionally, IGFBP2 hypermethylation also induced the upregulation of BCL2 gene (Figure 2G).
To test also for CRISPR/dCas unspecific binding effects, we performed an off-target gene analysis of the most commonly-used guides in this study (sgRNAs 3 and 6). Most of the off-target candidates (FAM184B, QSOX2, SPATC1L, FBRSL1, GATA4, TERT, CD24, ATAD3AB) did not show any difference in expression between the targeted and non-targeted clones (Figure 3A). However, our CRISPR/dCas epigenetic editing clearly upregulated some of the top-ranked off-target genes (VILL, SHC2, KDM4B) (Figure 3A). To test whether this upregulation of those genes could be a consequence of an off-targeted methylation, we performed bisulfite sequencing on one of the off-target regions belonging to the histone demethylase KDM4B/JMJD2B. Surprisingly, this analysis revealed that DNA methylation levels in 4 out of the 9 CpGs of the off-target region of KDM4B/JMJD2B gene (located at 3’ end of intron 18) was decreased (Figure 3B). Overall, the transcription levels of 2 out of the 13 off-target candidates (15%) were significantly changed and bisulfite sequencing data obtained in one of the candidate regions suggests this could be directly orchestrated by an unspecific CRISPR/dCas binding.
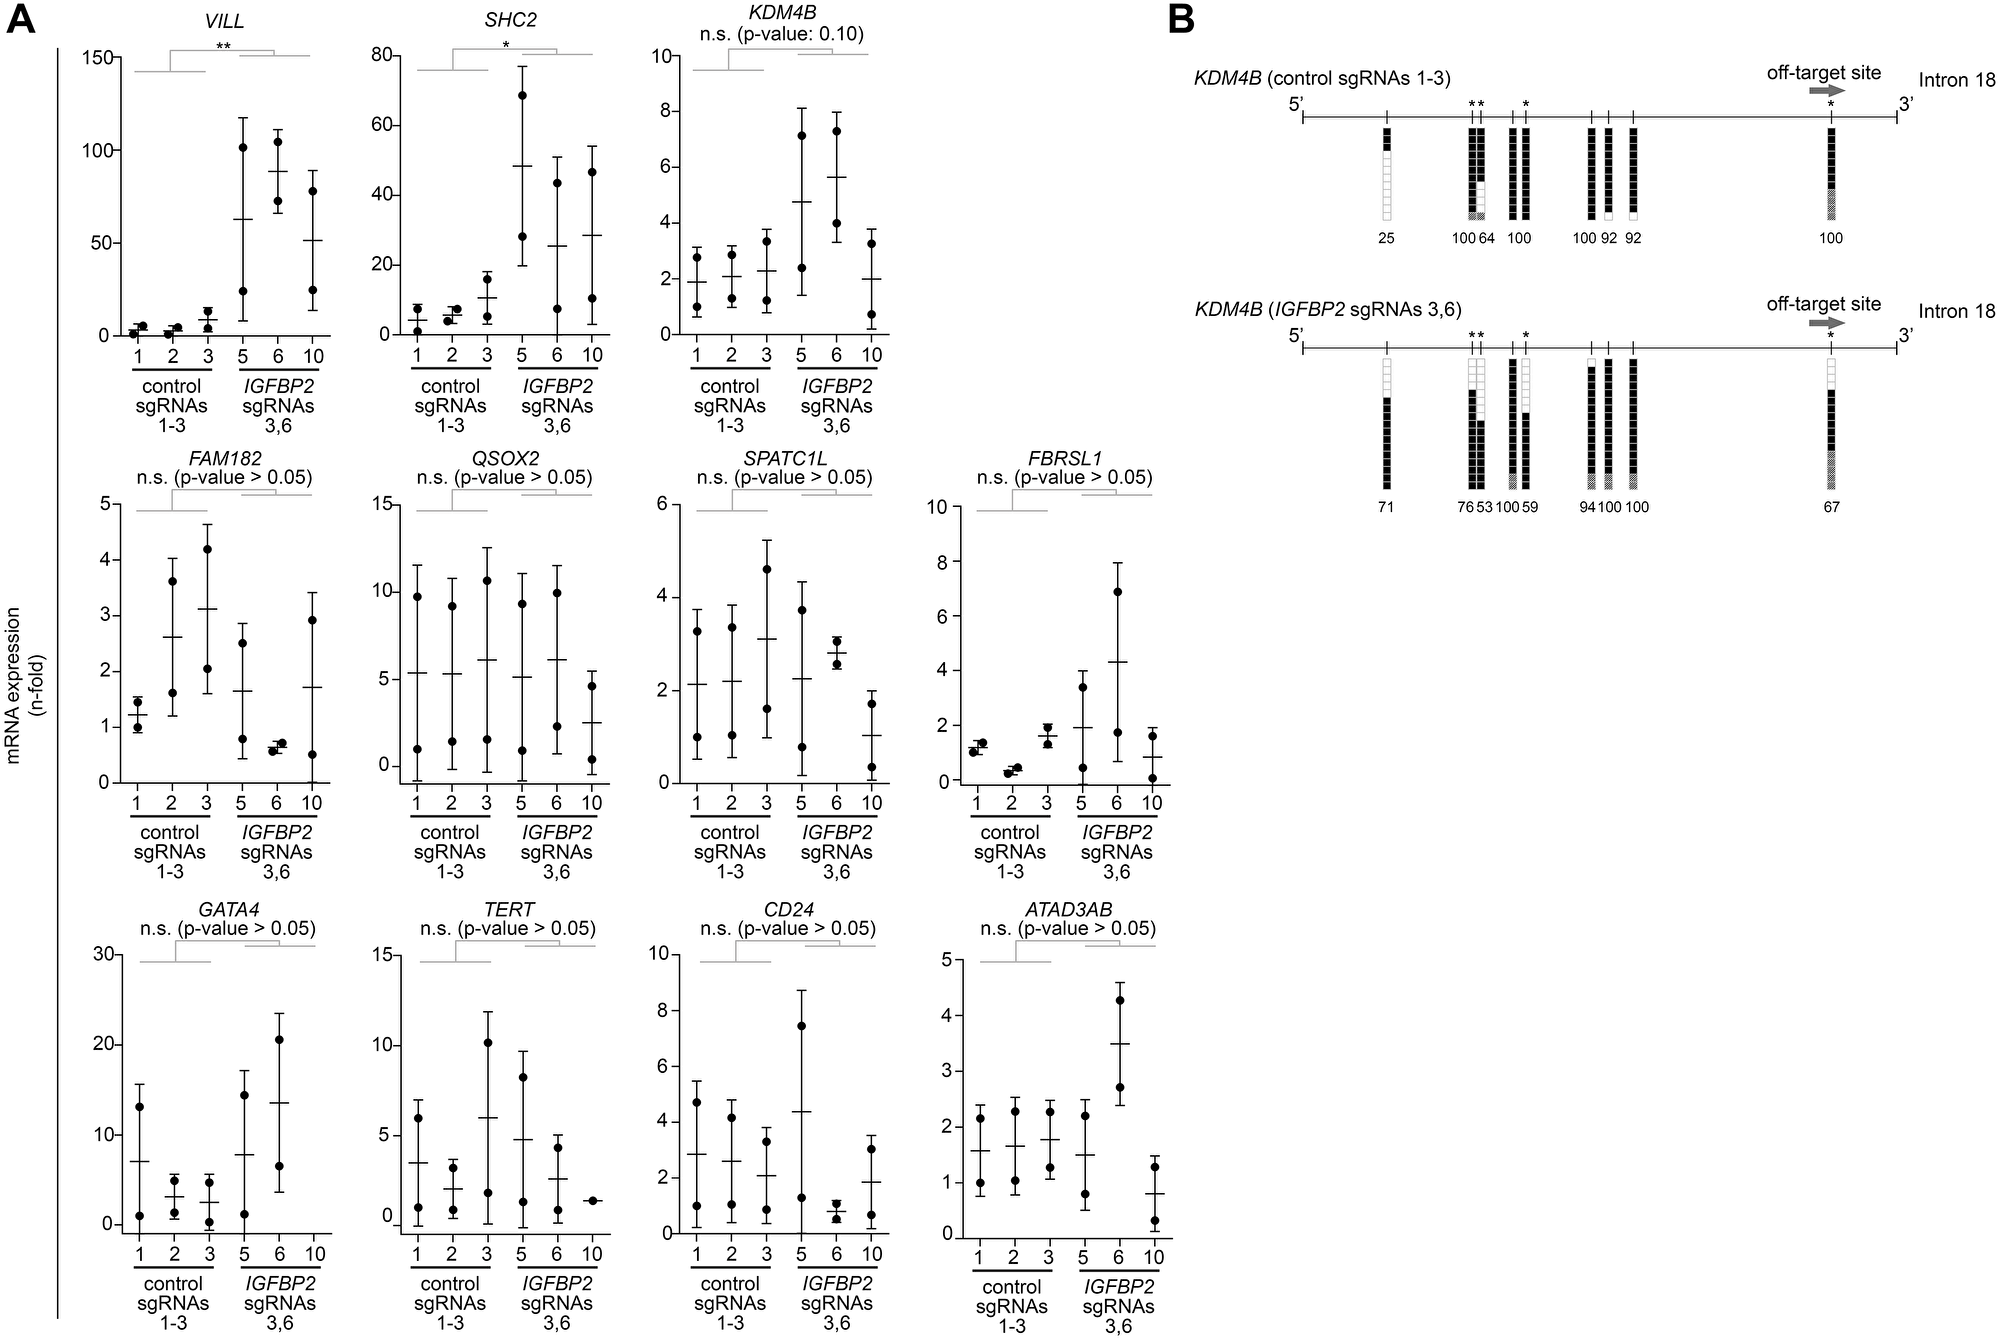
Figure 3: Off-target analysis identified some indirect effects by CRISPR/dCas targeting. (A) qPCR analysis to evaluate the expression of CRISPR/dCas off-target genes for IGFBP2 sgRNA guides 3 and 6. Comparisons are stablished between 2 independent biological replicates [including 3 independent control clones (transfected with pooled control sgRNAs 1-3) and 3 independent IGFBP2 targeted clones (transfected with sgRNAs 3 and 6)]. Data is normalized using first control and housekeeping genes B2M and PPIA (error bars represent SD). Statistical analyses were performed using one sample t-test after log2 data transformation. Two–tailed p-values ≤ 0.05, ≤ 0.01, or ≤ 0.001 are considered statistically significant and indicated by an asterisk (*, **, or ***, respectively). (B) Bisulfite sequencing of the off-target candidate region linked to KDM4B gene. Each vertical line denotes a CpG site within the interrogated region. Bisulfite genomic sequencing was carried out in ≥ 12 individual clones. The presence of a methylated or unmethylated cytosine is indicated by a black or white square, respectively. Gray squares denote CpG sites with unconverted cytosines outside the CpG region so they are not considered for the estimation of the DNA methylation (denoted by numbers, %). Vertical lines highlighted with an asterisk represent CpG sites with a reduction in DNA methylation.
DNA methylation of IGFBP2 promoter alters cell morphology and increases migration velocity in MCF7 cells
Since IGFBP2 promoter DNA methylation leads to alteration of expression in genes related with migration, we tested whether it has functional consequences for this process. Therefore, we set up time-lapse live imaging and characterized migration behavior of the IGBFP2-epigenetically edited epithelial cancer cell line MCF7 in comparison to their controls. In this experiment, three pooled sgRNAs 1–3 control clones and three IGFBP2 pooled sgRNAs 3 and 6 clones were tested. We imaged the cells for 14 hours, and manually tracked the position of each cell. As depicted in the rose plots in Figure 4A and 4B, the IGFBP2 targeted clones migrated significantly faster than the control clones. A detailed analysis of the cell surface highlighted that all IGFBP2 targeted clones experienced a cell morphology transformation with a significant increase in the number and length of cell protrusions (Figure 4C and Supplementary Videos 1–4, white arrows). Overall, these results, in line with the transcriptomic data, support the idea that the epigenetic editing of IGFBP2 gene drives a more migratory phenotype in the breast epithelial cancer cell line MCF7.
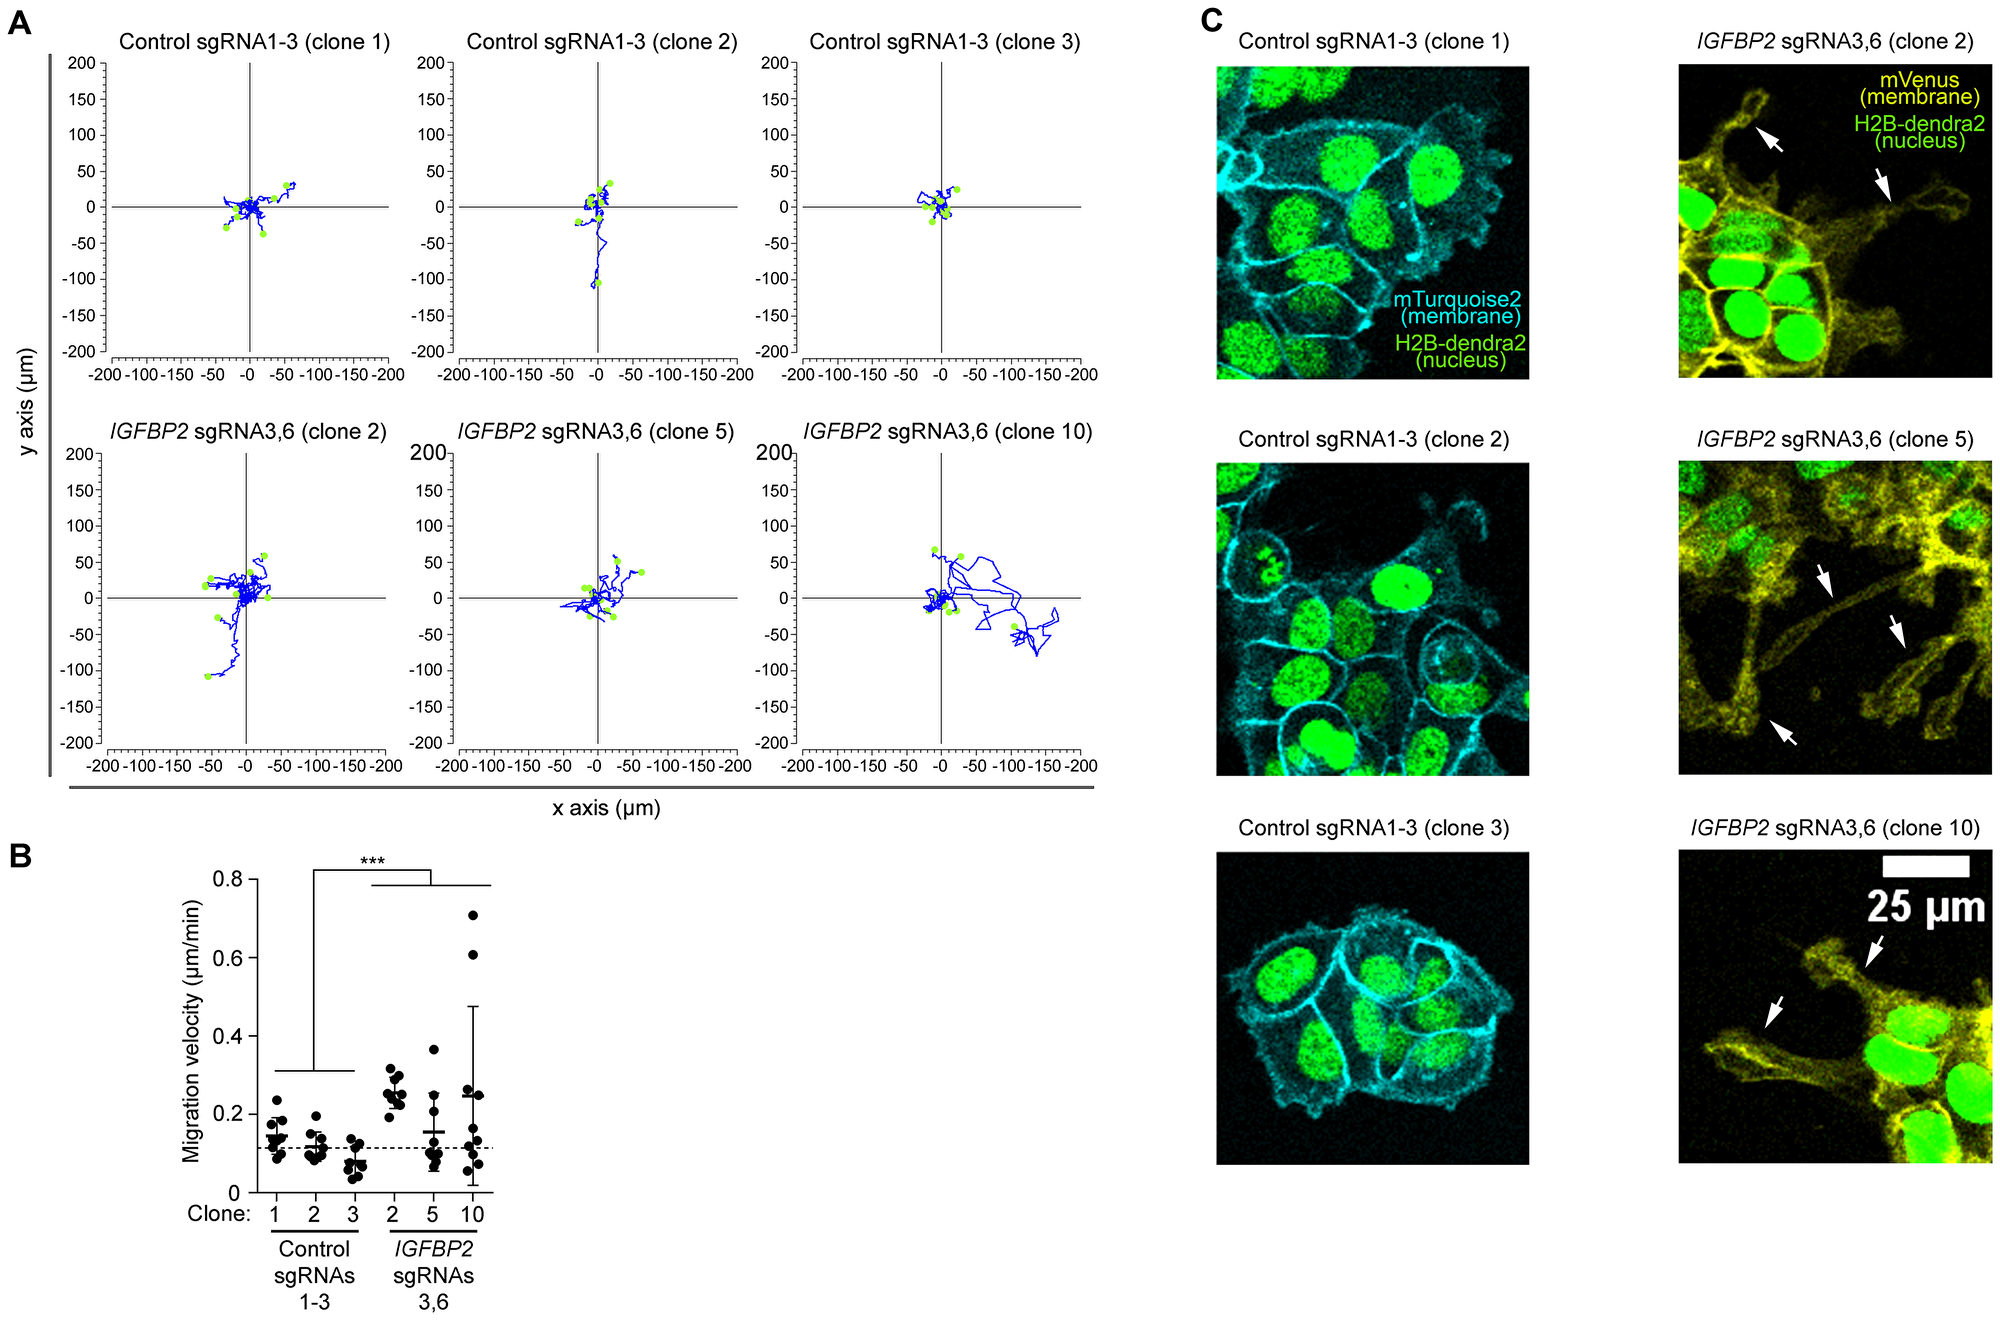
Figure 4: High resolution imaging reveal an increased migration speed of the epithelial cell line MCF7 clones upon CRISPR/dCas IGFBP2 epigenetic editing. (A) Display of 9 independent migratory tracks from 3 pooled control sgRNAs 1-3 clones and 3 pooled IGFBP2 sgRNAs 3 and 6 clones. (B) Distribution of migration velocity from 3 pooled control sgRNAs 1-3 clones and 3 pooled IGFBP2 sgRNAs 3 and 6 clones. Error bars represent the SD of n = 3–9 independent positions. Statistical analysis were performed using Mann-Whitney U test for speed and displacement and T-test for mitotic cell division analysis. p values ≤ 0.05, ≤ 0.01, or ≤ 0.001 are considered statistically significant and indicated by an asterisk (*, **, or ***, respectively). (C) Representative time-lapse images of 3 pooled control sgRNAs 1-3 clones and 3 pooled IGFBP2 sgRNAs 3 and 6 clones. White arrow indicates the appearance of cell protrusions (absent in the control conditions). Images show nuclear marker (H2B-dendra2) to follow cell divisions and migration and membrane markers (mTurquoise-2 and mVenus) to study cell morphology.
DISCUSSION
In this study we revealed the consequence of DNA methylation on the expression of IGFBP2, and we additionally gain some basic insights into on the process of DNA methylation itself. The precise editing of the IGFBP2 promoter locus by CRISPR/dCas/DNMT3ACD technology revealed that the combination of head-to-head oriented sgRNAs targeting adjacent sites of the region of interest enabled methylation at higher levels. Our data also indicates that the maximum peak of DNA methylation is reached at 27–30 bp distance from the PAM sequence and that the methylation efficiency starts to drop after 35 bp, confirming previous results [25, 27]. Moreover, we provide evidence that targeted methylation of DNA, introduced by CRISPR/dCas epigenetic editing, is inherited by daughter cells and stable across multiple cell divisions. To our knowledge, no study has reported to date whether transiently induced CRISPR/dCas edited DNA methylation is stably transmitted from parental-to-daughter cells by performing clonal experiments. Several publications have previously reported that single DNA methylation changes introduced by CRISPR/dCas-DNMT3ACD technology into the mammalian genomes were quickly lost, suggesting the presence of cell counteracting mechanisms to retain the cell specific DNA methylation fingerprint [25, 27]. Here, we showed a substantial stability of DNA methylation transmission from parental-to-daughter cells by studying the clonal inheritance of this epigenetic mark throughout many rounds of mitotic cell divisions. Our results suggest that the edited epigenetic marks are stably kept in the genome of daughter cells for more than 48 cell divisions that occur within more than a month in cell culture. Interestingly, these results line up with the most recent publication describing the programmed long-term inheritance of de-novo DNA methylation by the transient use of the CRISPRoff system [28]. However, we cannot rule out that in other genomic regions rather than promoters, like repetitive element sequences or intergenic regions, retention of ectopic DNA methylation marks could follow different dynamics. In fact, recent reports showed that promoter regions are better preserved in terms of DNA methylation and that non-functional regions, such as those containing repetitive elements, show a higher (epi)variance [29].
Our study also provides new insights into the regulation of IGFBP2 expression. IGFBP2 is a multitasked protein with extracellular and intracellular functions. This oncogene was originally described as a direct target for p53-mediated transcription, blocking the activation of phosphor-ERK expression and therefore inhibiting IGF-I signaling [9]. More recently, many studies identified IGFBP2 as an EMT-driver gene that promotes the proliferation and migration of colorectal cancer cells through E-cadherin inhibition [30] or the hepatocellular carcinoma progression by activation of the NF-κB-ZEB1 signaling axis [13]. In gliobastomas, IGFBP2 affects a myriad of different molecular networks and shaping tumor progression by unbalancing the EGFR-STAT3 signaling and potentiating STAT3 phosphorylation [14], connecting integrins and NF-κB signaling to cell migration [31], and promoting tumor cell trans-differentiation into endothelial cells (vasculogenic mimicry) via expression of vascular-endothelial cadherin CD144 and MMP2 [15]. This literature suggests that the expression of this gene must be tightly regulated in order to guarantee its correct functionality. IGFBP2 levels are regulated by hormones, protease activity, hypoxia and as more recently shown, promoter DNA methylation [32]. Here, we show that IGFBP2 expression can also be regulated by targeted DNA methylation.
Targeted methylation of promoter regions is thought to lead to decreased expression of those genes [33]. Here, we have studied the consequence of targeted methylation of the IGFBP2 promoter, and show that methylation of this promoter lead to opposite transcriptional effects of this gene in different cell types and batches. In HEK293T cells, with only 7% of basal DNA methylation, we find a strong and significant negative correlation between de-novo DNA methylation in two specific CpG sites of IGFBP2 promoter and the expression levels of IGFBP2. Similar observations were obtained with the new batch of MCF7 cells which shows 0% of basal DNA methylation at the interrogated CpG sites. Surprisingly, in another two cell settings (H3122 and old batch MCF7) we found higher levels of basal DNA methylation (~25%) and a positive correlation between de-novo DNA methylation and IGFBP2 expression both at mRNA and protein levels. Our bisulfite sequencing and expression data indicates that the differential basal levels of DNA methylation of IGFBP2 locus in the wild type cells correlates with opposite expression outcomes upon epigenetic editing. This suggests that basal levels of methylation can determine the transcription outcomes derived from the epigenetic editing.
Cell clonal analysis of IGFBP2 mRNA isoforms performed on old batch MCF7 cells confirmed the aforementioned results and additional gene expression measurements revealed a significant positive correlation between the increment of DNA methylation, the downregulation of epithelial marker CDH1 and the upregulation of EMT genes VIM1 and TGFB1. To our knowledge, this is the first report to demonstrate that the DNA methylation of IGFBP2 promoter has an impact on the expression levels of mesenchymal-like markers. By means of CRISPR/dCas IGFBP2 DNA methylation, we observed a significant downregulation of CDH1 and upregulation of VIM1 and TGFB1 expression in all clones interrogated. Moreover, we found that the morphology, migration and therefore growth pattern is severely altered in the epigenetically targeted MCF7 clones. The effects of TGFB1 on growth on estrogen receptor positive cells lines like MCF7 is well-known and is supported by our findings [10]. In the present study, we have also found that DNA methylation, which affects the levels of IGFBP2 expression, also unbalances BCL2 expression in two different tumor cell line models (HEK293T and MCF7). Interestingly, these two genes have in common that they belong to two strong anti-apoptotic systems (IGF-1 and the pro-survival BCL2-like proteins) and their reciprocal modulation has been reported before [34].
In conclusion, our study highlights the significance of exploring the effects of the epigenetic editing in different tumor settings by revealing the important consequences that this can have on transcriptomic regulation and tumor cell behavior.
Materials and Methods
CRISPR/dCas9-DNMT3ACD fusion protein and sgRNAs design
To target specific DNA methylation in-vitro, we focused on the system previously described by Vojta et al. (2016). The catalytic domain of human DNMT3A (amino acids P602-V912; herein, DNMT3ACD) fused with the inactive SpCas9 (upstream) and the T2A-eGFP coding sequences (downstream) were obtained from the plasmid pdCas9-DNMT3A-eGFP (Addgene plasmid #71666). Two substitutions in the coding sequence (D10A and H840A) abolished the nickase activity of the endonuclease. The coding sequence starts with a triple flag-tag followed by a SV40 nuclear localization signal. An additional NLS sequence in frame with a short Gly4Ser linker is placed between the dCas9 and DNMT3A sequences. This cassette was digested with the restriction enzymes AgeI and NotI and cloned into Addgene plasmid #63592 previously digested with XbaI and EcoRI, in order to substitute the CMV promoter with the EF-1alpha promoter. For the final ligation two 50–60 bp adaptors were added following overnight incubation using T4 ligase from NEB (ref. M0202). Vector sequence can be found in Supplementary Material 1.
Guide sequences targeting the locus of interest were designed using the Breaking-Cas web-tool [35] (http://bioinfogp.cnb.csic.es/tools/breakingcas). Only 20 nucleotide length guides with NGG PAM sequence, reaching scores above 85 over 100 were selected. Three non-targeting control guide RNAs with no match in the human genome were taken from the Human GeCKOv2 Library [36]. Forward and reverse primers were re-suspended in water to reach 100 μM. Then 2.5 ul of each primer was added to 120 μl of annealing buffer (100 mM NaCl and 50 mM Tris pH 7.5). The PCR program was as follows: 95°C 5 min for 14 cycles (each cycle the temperature was diminished 5°C, until it reached 25°C) and a final step at 25°C for 20 min. sgRNAs are shown in Supplementary Table 1A.
Cell transfection
Human embryonic kidney cell line HEK293T, H3122, and MFC7 were maintained in Dulbecco’s Modified Eagle Medium (#21885-025, Invitrogen) supplemented with 10% fetal bovine serum, 1% sodium pyruvate (H3122 cells), 100 U/ml penicillin and 100 μg/ml streptomycin. Cells were incubated at 37°C in a humidified 5% CO2 environment.
For cell transfection, cells were seeded at 80–90% of confluence in 6-well plates and 24 hours later cells were transfected with Lipofectamine 2000 as follows: a mixture of plasmids (3 μg of dCas9-DNMT3A-eGFP plasmid and 1 μg of sgRNA guide plasmid) were mixed in 150 μl of Optimem media. For the cases where combination of guides were needed, we used equimolar amounts of each sgRNA guide never exceeding 1 μg of sgRNA in total. In parallel, 10 μl of Lipofectamine 2000 was diluted in 150 μl of Optimen media and incubated at room temperature for 5 min. Then, the plasmid mixture was added to the lipofectamine dilution and incubated at room temperature for 20 min. Finally, cells were refreshed with 2 ml of pre-warmed DMEM+10% FBS media and the transfection mixture was added drop-wise. After 24 hours, cells were harvested and transferred to a 10 cm dish adding 1.5 μg/ml of puromycin to enrich the population in cells expressing the sgRNA guides. Selection was performed for 48 hours. After that, cell culture was refreshed with media and maintain in culture for two days. Finally, cells were harvested and eGFP-FACS was performed.
FACS sorting
Sorting of cells was performed in Aria Fusion (BD Biosciences) upon cell resuspension in FACS buffer containing 2 mM of EDTA and 2% of FBS in PBS. A broad FSC/SSC gate was followed by gates excluding doublets and selection of Topro3-living cells. eGFP+ tumor cells were isolated using stringent gating.
DNA methylation analysis
DNA was extracted from cells by phenol:chloroform method adapted for low number of cells. Briefly, recovered cells from FACS were resuspended in 600 μl of lysis buffer (10 mM Tris-HCl pH7.4, 10 mM EDTA, 200 mM NaCl, 1%SDS) and 15 μl of proteinase K (10 mg/ml). Samples were incubated overnight (ON) at 37°C. After ON incubation, proteinase K was inactivated at 75°C for 15 min and then 2 μl of RNAse (10 mg/ml) was added. After an incubation of 30 min at 37°C, 620 μl of phenol:chloroform:isoamilic (25:24:1) was added and mixed for 10 min in rotation at room temperature. After 30 min centrifugation at 12,000 g (4°C), the acuose phase was put in a new tube, mixed with an equal volume of clorophorm for 5 min at room temperature. After 15 min centrifugation at 12,000 g (4°C), the acuose phase was put in a new tube and 1/10 volumes of NaAc (3M) was added and mixed. Then, an equal volume of isopropanol and 50 μl/ml GlycoBlue (Ambion, AM9515) were added and mixed for 5 min at room temperature. Samples were kept at –20°C ON. Finally, samples were 30 min centrifuged at 12,000 g (4°C) and washed twice with ethanol 70%.
Bisulfite conversion of 100–1000 ng of genomic DNA was performed using an EZ DNA methylation kit (Zymo Research) following the manufacturer’s instructions. Genomic DNA was converted using an EZ DNA Methylation Gold kit (Zymo Research, Orange, CA, USA) and Bibikova et al. (2009) denaturation conditions (initial denaturation step at 98°C 10 min, and 16 cycles at 98°C 30 sec and 50°C for 1 h). DNA methylation was studied by pyrosequencing, which was performed on bisulfite-treated DNA extracted from cells. Pyrosequencing reactions and quantification of DNA methylation were performed in a PyroMark Q24 System version 2.0.6 (QIAGEN) including appropriate controls. Specific primers were designed using the PyroMark Assay Design Software (QIAGEN-version 2.0.01.15) for pyrosequencing to examine the methylation status of particular CG sites covering the candidate genes promoter regions. Pyrosequencing primers are shown in Supplementary Table 1B.
For bisulfite sequencing analysis, bisulfite converted DNA was used as a template in a PCR reaction. BS primers are shown in Supplementary Table 1C. The PCR program was run using the Immolase Taq (Bioline) and adjusted to maximize the PCR product amplification without reaching the saturation point: initial denaturation step at 95°C for 8 min, 31 cycles (95°C 30 sec, 59°C 30 sec, 72°C 25 sec), and a final extension of 72°C 1 min. The 519 bp PCR band was purified from agarose gel and clone into PGEM-T (Promega) vector. Dh5-alpha bacteria colonies containing the insert (white colonies) were selected by IPGT and X-gal and correct integration was confirmed by sequencing.
For MSP analysis, bisulfite converted DNA was used as a template in a PCR reaction. Specific primers for the unmethylated and methylated region were designed using MethylExpress® program (Applied Biosystems). MSP primers are shown in Supplementary Table 1D. The primers contain 2 to 3 CpG sites at the 3’ end of each primer. The PCR program was run using the GoTaq® G2 Hot Start Green Master Mix (Promega, M7421) and adjusted to maximize the PCR product amplification without reaching the saturation point: initial denaturation step at 95°C for 8 min, 31 cycles (95°C 30 sec, 59°C 30 sec, 72°C 25 sec), and a final extension of 72°C 1 min. This approach permits to analyze a high number of samples with minimum costs in comparison with pyrosequencing.
Expression analysis
For qRT–PCR experiments, total RNA was extracted using Trizol® reagent and 1 ug was retrotranscribed using the Kit High Capacity cDNA Reverse Transcription Kit (ref. 4368814). Real time PCR was performed using PowerUp SYBR Green (A25741), and PPIA, B2M and TBP were used as housekeeping genes to enable normalization. Primers were used at 150 nM concentration and sequences are annotated in Supplementary Table 1E. RDML raw data was processed using RDML-Ninja and LinReg softwares to determine the baselines and obtain the empirical primer efficiencies. qPCR fold changes between samples were obtained by ΔΔCt calculations and corrected by primer efficiencies. Average values from the two housekeeping genes were calculated, log2 transformed and plotted. Statistical significance was calculated with GraphPad Prism package using one sample t-test. For immunoblotting assays, total protein was extracted using Laemli 1X (60 mM Tris-HCl, 2% SDS, 10% glycerol, bromophenol blue 0.01%) to quickly preserve the integrity of all the protein phosphorylation sites. Specific antibodies against target proteins are listed in Supplementary Table 1F.
Time-lapse confocal imaging
To characterize the dynamic behavior of epigenetically edited cells six single clones of the MCF7 breast cancer model were used (three pooled sgRNAs 1–3 control clones and three IGFBP2 pooled sgRNAs 3,6 clones). For that, each clone was co-transduced with a cell membrane marker (based on the MARCKS domain) and a nuclear marker (based on the H2B-dendra2 reporter). In order to distinguish control clones from IGFBP2 targeted clones, the former were transduced with MARCKS-mTurquoise2 fluorophore and the latter with MARCKS-mVenus fluorophores. Vector sequences can be found in Supplementary Material 1. Time-lapse was performed using a Leica confocal SP5 inverted microscope with 25X water immersion objective (N.A. 0.95) water objective. In brief, 2,000 cells were plate per well in 8-ibidi glass bottom chambers and kept in their own media preventing moisture drift and guarantying CO2 supply by using an Okolab CO2 chamber. Images were taken every 12 minutes for a total of 14 hours approximately. Images were post-processed using Fiji software. Cell migration track displays, speed, and displacement values were obtained using Chemotaxis and Migration Tool V2.0 (Ibidi) upon retrieving the XY coordinates from Fiji. Statistical analysis were performed with SPSS package using KS and SW normality test and Mann-Whitney U tests (for cell migration speed and displacement) and t-test for independent samples (for cell division).
CRISPR/dCas9 off target analysis
CRISPR/dCas9 off target candidates for IGFBP2 sgRNAs 3 and 6 were obtained using the software package Breaking-Cas web-tool [35] (http://bioinfogp.cnb.csic.es/tools/breakingcas). Off-target candidate regions are annotated in Supplementary Table 2A and 2B. Using NCBI browser (GRCh38) we retrieved for each candidate a genomic sequence including 500 bp (upstream and downstream) from the 20 bp off-target sequence. Then, each sequence was individually interrogated for the presence of enriched CpG regions by using the MethylExpress software. Genes linked to the off-target candidate regions associated to (partial) CpG islands were further characterized by qPCR comparing three control pooled sgRNAs 1–3 clones with three of the IGFBP2 pooled sgRNAs 3 and 6 clones with the most significant dysregulation of cell plasticity genes. Primers are listed on Supplementary Table 1D. Bisulfite sequence of the off-target gene candidate KDM4B was additionally performed as previously described. BS primers are listed on Supplementary Table 1C.
ACKNOWLEDGMENTS
The authors would like to thank the van Rheenen group members for critically reading this manuscript. This work was supported by the European Research Council (consolidator grant 648804 to JvR), Doctor Josef Steiner Foundation (to JvR), and the fellowship from EMBO ALTF 437-2017 (MV).
CONFLICTS OF INTEREST
Authors have no conflicts of interest to declare.
References
1. Gulfidan G, Turanli B, Beklen H, Sinha R, Arga KY. Pan-cancer mapping of differential protein-protein interactions. Sci Rep. 2020; 10:3272. https://doi.org/10.1038/s41598-020-60127-x. [PubMed].
2. Lin CY, Lee CH, Chuang YH, Lee JY, Chiu YY, Wu Lee YH, Jong YJ, Hwang JK, Huang SH, Chen LC, Wu CH, Tu SH, Ho YS, Yang JM. Membrane protein-regulated networks across human cancers. Nat Commun. 2019; 10:3131. https://doi.org/10.1038/s41467-019-10920-8. [PubMed].
3. Chuang HY, Lee E, Liu YT, Lee D, Ideker T. Network-based classification of breast cancer metastasis. Mol Syst Biol. 2007; 3:140. https://doi.org/10.1038/msb4100180. [PubMed].
4. Haricharan S, Brown P. TLR4 has a TP53-dependent dual role in regulating breast cancer cell growth. Proc Natl Acad Sci U S A. 2015; 112:E3216–25. https://doi.org/10.1073/pnas.1420811112. [PubMed].
5. Mikels AJ, Nusse R. Purified Wnt5a protein activates or inhibits beta-catenin-TCF signaling depending on receptor context. PLoS Biol. 2006; 4:e115. https://doi.org/10.1371/journal.pbio.0040115. [PubMed].
6. Torii K, Nishizawa K, Kawasaki A, Yamashita Y, Katada M, Ito M, Nishimoto I, Terashita K, Aiso S, Matsuoka M. Anti-apoptotic action of Wnt5a in dermal fibroblasts is mediated by the PKA signaling pathways. Cell Signal. 2008; 20:1256–66. https://doi.org/10.1016/j.cellsig.2008.02.013. [PubMed].
7. MacLeod RJ, Hayes M, Pacheco I. Wnt5a secretion stimulated by the extracellular calcium-sensing receptor inhibits defective Wnt signaling in colon cancer cells. Am J Physiol Gastrointest Liver Physiol. 2007; 293:G403–11. https://doi.org/10.1152/ajpgi.00119.2007. [PubMed].
8. Barlow DP, Bartolomei MS. Genomic imprinting in mammals. Cold Spring Harb Perspect Biol. 2014; 6:a018382. https://doi.org/10.1101/cshperspect.a018382. [PubMed].
9. Grimberg A, Coleman CM, Shi Z, Burns TF, MacLachlan TK, Wang W, El-Deiry WS. Insulin-like growth factor factor binding protein-2 is a novel mediator of p53 inhibition of insulin-like growth factor signaling. Cancer Biol Ther. 2006; 5:1408–14. https://doi.org/10.4161/cbt.5.10.3455. [PubMed].
10. Perera CN, Chin HG, Duru N, Camarillo IG. Leptin-regulated gene expression in MCF-7 breast cancer cells: mechanistic insights into leptin-regulated mammary tumor growth and progression. J Endocrinol. 2008; 199:221–33. https://doi.org/10.1677/JOE-08-0215. [PubMed].
11. Mendes KN, Wang GK, Fuller GN, Zhang W. JNK mediates insulin-like growth factor binding protein 2/integrin alpha5-dependent glioma cell migration. Int J Oncol. 2010; 37:143–53. https://doi.org/10.3892/ijo_00000662. [PubMed].
12. Han S, Li Z, Master LM, Master ZW, Wu A. Exogenous IGFBP-2 promotes proliferation, invasion, and chemoresistance to temozolomide in glioma cells via the integrin β1-ERK pathway. Br J Cancer. 2014; 111:1400–09. https://doi.org/10.1038/bjc.2014.435. [PubMed].
13. Guo Q, Yu DY, Yang ZF, Liu DY, Cao HQ, Liao XW. IGFBP2 upregulates ZEB1 expression and promotes hepatocellular carcinoma progression through NF-κB signaling pathway. Dig Liver Dis. 2020; 52:573–81. https://doi.org/10.1016/j.dld.2019.10.008. [PubMed].
14. Chua CY, Liu Y, Granberg KJ, Hu L, Haapasalo H, Annala MJ, Cogdell DE, Verploegen M, Moore LM, Fuller GN, Nykter M, Cavenee WK, Zhang W. IGFBP2 potentiates nuclear EGFR-STAT3 signaling. Oncogene. 2016; 35:738–47. https://doi.org/10.1038/onc.2015.131. [PubMed].
15. Liu Y, Li F, Yang YT, Xu XD, Chen JS, Chen TL, Chen HJ, Zhu YB, Lin JY, Li Y, Xie XM, Sun XL, Ke YQ. IGFBP2 promotes vasculogenic mimicry formation via regulating CD144 and MMP2 expression in glioma. Oncogene. 2019; 38:1815–31. https://doi.org/10.1038/s41388-018-0525-4. [PubMed].
16. Liu Y, Song C, Shen F, Zhang J, Song SW. IGFBP2 promotes immunosuppression associated with its mesenchymal induction and FcγRIIB phosphorylation in glioblastoma. PLoS One. 2019; 14:e0222999. https://doi.org/10.1371/journal.pone.0222999. [PubMed].
17. Suzuki A, Urushitani H, Watanabe H, Sato T, Iguchi T, Kobayashi T, Ohta Y. Comparison of estrogen responsive genes in the mouse uterus, vagina and mammary gland. J Vet Med Sci. 2007; 69:725–31. https://doi.org/10.1292/jvms.69.725. [PubMed].
18. Korc-Grodzicki B, Ren N, Hilf R. Effects of estradiol on the expression and production of IGFBP-2 by R3230AC mammary tumor cells. Oncol Res. 1996; 8:473–83. [PubMed].
19. Martin JL, Baxter RC. Expression of insulin-like growth factor binding protein-2 by MCF-7 breast cancer cells is regulated through the phosphatidylinositol 3-kinase/AKT/mammalian target of rapamycin pathway. Endocrinology. 2007; 148:2532–41. https://doi.org/10.1210/en.2006-1335. [PubMed].
20. Huang LE, Cohen AL, Colman H, Jensen RL, Fults DW, Couldwell WT. IGFBP2 expression predicts IDH-mutant glioma patient survival. Oncotarget. 2017; 8:191–202. https://doi.org/10.18632/oncotarget.13329. [PubMed].
21. Ehrlich M. DNA methylation in cancer: too much, but also too little. Oncogene. 2002; 21:5400–13. https://doi.org/10.1038/sj.onc.1205651. [PubMed].
22. van Vlodrop IJ, Niessen HE, Derks S, Baldewijns MM, van Criekinge W, Herman JG, van Engeland M. Analysis of promoter CpG island hypermethylation in cancer: location, location, location! Clin Cancer Res. 2011; 17:4225–31. https://doi.org/10.1158/1078-0432.CCR-10-3394. [PubMed].
23. Song CX, He C. Balance of DNA methylation and demethylation in cancer development. Genome Biol. 2012; 13:173. https://doi.org/10.1186/gb-2012-13-10-2012. [PubMed].
24. Zhao W, Wang Y, Liang FS. Chemical and Light Inducible Epigenome Editing. Int J Mol Sci. 2020; 21:998. https://doi.org/10.3390/ijms21030998. [PubMed].
25. Vojta A, Dobrinić P, Tadić V, Bočkor L, Korać P, Julg B, Klasić M, Zoldoš V. Repurposing the CRISPR-Cas9 system for targeted DNA methylation. Nucleic Acids Res. 2016; 44:5615–28. https://doi.org/10.1093/nar/gkw159. [PubMed].
26. Gao S, Sun Y, Zhang X, Hu L, Liu Y, Chua CY, Phillips LM, Ren H, Fleming JB, Wang H, Chiao PJ, Hao J, Zhang W. IGFBP2 Activates the NF-κB Pathway to Drive Epithelial-Mesenchymal Transition and Invasive Character in Pancreatic Ductal Adenocarcinoma. Cancer Res. 2016; 76:6543–54. https://doi.org/10.1158/0008-5472.CAN-16-0438. [PubMed].
27. McDonald JI, Celik H, Rois LE, Fishberger G, Fowler T, Rees R, Kramer A, Martens A, Edwards JR, Challen GA. Reprogrammable CRISPR/Cas9-based system for inducing site-specific DNA methylation. Biol Open. 2016; 5:866–74. https://doi.org/10.1242/bio.019067. [PubMed].
28. Nuñez JK, Chen J, Pommier GC, Cogan JZ, Replogle JM, Adriaens C, Ramadoss GN, Shi Q, Hung KL, Samelson AJ, Pogson AN, Kim JYS, Chung A, et al. Genome-wide programmable transcriptional memory by CRISPR-based epigenome editing. Cell. 2021; 184:2503–19.e17. https://doi.org/10.1016/j.cell.2021.03.025. [PubMed].
29. Gravina S, Dong X, Yu B, Vijg J. Single-cell genome-wide bisulfite sequencing uncovers extensive heterogeneity in the mouse liver methylome. Genome Biol. 2016; 17:150. https://doi.org/10.1186/s13059-016-1011-3. [PubMed].
30. Zhu H, Zhang Y, Geng Y, Lu W, Yin J, Li Z, Huang L, Liu H, Xu N. IGFBP2 promotes the EMT of colorectal cancer cells by regulating E-cadherin expression. Int J Clin Exp Pathol. 2019; 12:2559–65. [PubMed].
31. Holmes KM, Annala M, Chua CY, Dunlap SM, Liu Y, Hugen N, Moore LM, Cogdell D, Hu L, Nykter M, Hess K, Fuller GN, Zhang W. Insulin-like growth factor-binding protein 2-driven glioma progression is prevented by blocking a clinically significant integrin, integrin-linked kinase, and NF-κB network. Proc Natl Acad Sci U S A. 2012; 109:3475–80. https://doi.org/10.1073/pnas.1120375109. [PubMed].
32. Pickard A, McCance DJ. IGF-Binding Protein 2 - Oncogene or Tumor Suppressor? Front Endocrinol (Lausanne). 2015; 6:25. https://doi.org/10.3389/fendo.2015.00025. [PubMed].
33. Greenberg MVC, Bourc'his D. The diverse roles of DNA methylation in mammalian development and disease. Nat Rev Mol Cell Biol. 2019; 20:590–607. https://doi.org/10.1038/s41580-019-0159-6. [PubMed].
34. Baker NL, Carlo Russo V, Bernard O, D'Ercole AJ, Werther GA. Interactions between bcl-2 and the IGF system control apoptosis in the developing mouse brain. Brain Res Dev Brain Res. 1999; 118:109–18. https://doi.org/10.1016/s0165-3806(99)00136-4. [PubMed].
35. Oliveros JC, Franch M, Tabas-Madrid D, San-León D, Montoliu L, Cubas P, Pazos F. Breaking-Cas-interactive design of guide RNAs for CRISPR-Cas experiments for ENSEMBL genomes. Nucleic Acids Res. 2016; 44:W267–71. https://doi.org/10.1093/nar/gkw407. [PubMed].
36. Sanjana NE, Shalem O, Zhang F. Improved vectors and genome-wide libraries for CRISPR screening. Nat Methods. 2014; 11:783–84. https://doi.org/10.1038/nmeth.3047. [PubMed].