
Introduction
Type 2 diabetes (T2DM) is one of the most serious public health issues in the 21st century and is becoming increasingly prevalent worldwide [1]. T2DM imposes a public health burden of mortality and disability, not only because of T2DM itself, but also its increased incidence and mortality from cancers, cardiovascular events and other diseases [1–3]. In China, the overall prevalence of T2DM in adults was 10.9% according to a study in 2013 [4], and the personal annual direct cost attributable to T2DM without complication, with 1, 2 and 3+complication was US$ 248, US$ 1399, US$ 1705 and US$ 2994, respectively [5].
Body mass index (BMI) is the most important risk factor of T2DM [6–9]. New lifestyle brought by urbanization and globalization such as fast food and sedentary office life has caused a tremendous overweight and obesity population, which significantly increases the incidence of T2DM [7, 9–11]. According to the national survey of obesity and metabolic syndrome, the average BMI in T2DM patients is 25.0 kg/m2, the prevalence of T2DM in BMI from 25.0 kg/m2 to 27.4 kg/m2 and above 27.4 kg/m2 is 12.8% and 18.5%, the prevalence in male adult is 33.7% and 13.7%, and that in female adult is 29.2% and 10.7%, respectively [8]. The BMI threshold associated with increased T2DM is modified by sex and ethnicity [7, 12, 13]. Recommended BMI cut-off point for preventing T2DM in different Asian populations were not consistent. A study based on Thai population derived the BMI cut-point to define T2DM risk by odds ratio as 22 [7]; Another multi-center research found BMI of 25 kg/m2 in Chinese is equivalent of BMI of 24 kg/m2 in South Asian for incidence rate of diabetes [12]. For this reason, it is important to ascertain the high risk BMI range in different populations to make strategy for controlling T2DM. Xinjiang autonomous region of China (Central Asian in geography) composed of 55 ethnic groups, with a prevalence of T2DM approximately 6.1% in rural areas 8.2% in urban areas [14]. It is meaningful in disease prevention to estimate the BMI threshold for increased T2DM based on adults in Xinjiang.
Liver dysfunction is also associated with T2DM, and the association between serum alanine aminotransferase (ALT), aspartate aminotransferase (AST) and T2DM was broadly replicated [15–17]. Recent studies suggested that the upper cut-off values may be lower than 40 U/L [18–21]. A study based on Korean showed the upper limit of normal values of AST were 25.35 U/L and 24.25 U/L for healthy men and women, respectively; and that of ALT were 22.15 U/L and 22.40 U/L for healthy men and women, respectively [20]. Also, a study of 6835 blood donors suggested that the upper limit of aminotransferase values was 31 U/L for men and 19 U/L for women [19]. Many studies reported the association between BMI and liver aminotransferase, and it is modified by sex and age [22–24]. Another study further indicated that T2DM risk attributed to BMI could be influenced by liver aminotransferase: in group of high levels of both AST and ALT and in group of high level of either AST or ALT, high BMI was independently associated with diabetes incidence, and in group of high levels of both AST and ALT, odds ratio was relatively higher than that in group of high levels of either AST and ALT; While in group of low levels of both AST and ALT, high BMI was not an independent risk factor for diabetes [25].
In this study, we aimed to find the cut-off point of BMI associated with high T2DM risk in Xinjiang population; we also aimed to find the difference of cut-off point brought by elevated liver aminotransferase.
Results
During an average follow-up time of 3.71 years of 33346 participants, 1486 developed T2DM, and the incidence density was 1.2/100 person-years. The average baseline BMI of people who developed T2DM was 26.22 (standard deviation (SD) 3.67) kg/m2 and that of people who did not develop T2DM was 24.18 (SD 3.50). After adjusting age, sex and BMI, AST ≥ 20 U/L and ALT ≥ 20 U/L showed statistical difference on T2DM incidence (HR 1.118 P = 0.037), while AST ≥ 20 U/L or ALT ≥ 20 U/L showed no statistical difference (HR 1.113 P = 0.109). For this reason, we define aminotransferase group 1 if AST ≥ 20 U/L and ALT ≥ 20 U/L, and group 2 if AST < 20 U/L or ALT < 20 U/L. Association between Baseline data and T2DM Incidence were shown in Table 1. The T2DM incidence was more than 5% for Aminotransferase group 1; In both aminotransferase group 1 and group 2, T2DM incidence was more than 5% for age over 44 years, male sex and BMI over 25.39 kg/m2.
Table 1: Association between baseline data and T2DM incidence and by aminotransferase
| Total | AST or ALT < 20 | AST and ALT ≥ 20 | |||||||
|---|---|---|---|---|---|---|---|---|---|
| T2DM incidence | % | P | T2DM incidence | % | P | T2DM incidence | % | P | |
| incidence | |||||||||
| Total | 1486/33346 | 4.46 | 701/19383 | 3.62 | 785/13963 | 5.62 | |||
| Age years | |||||||||
| Under 30 | 85/5734 | 1.48 | <0.001 | 30/3702 | 0.81 | 55/2032 | 2.71 | <0.001 | |
| 30~44 | 461/14969 | 3.08 | 216/9063 | 2.38 | 245/5906 | 4.15 | |||
| 45~59 | 663/9644 | 6.87 | 299/5007 | 5.97 | 364/4637 | 7.85 | |||
| 60 or over | 277/2999 | 9.24 | 156/1611 | 9.68 | 121/1388 | 8.72 | |||
| Sex | |||||||||
| Male | 1086/18990 | 5.72 | <0.001 | 477/9137 | 5.22 | 609/9853 | 6.18 | <0.001 | |
| Female | 400/14356 | 2.79 | 224/10246 | 2.19 | 176/4110 | 4.28 | |||
| BMI kg/m2 | |||||||||
| <19.05 | 18/1620 | 1.11 | <0.001 | 14/1296 | 1.08 | <0.001 | 4/324 | 1.23 | <0.001 |
| 19.05~<19.96 | 21/1741 | 1.21 | 14/1314 | 1.07 | 7/427 | 1.64 | |||
| 19.96~<20.66 | 36/1628 | 2.21 | 24/1179 | 2.04 | 12/449 | 2.67 | |||
| 20.66~<21.22 | 35/1653 | 2.12 | 23/1193 | 1.93 | 12/460 | 2.61 | |||
| 21.22~<21.72 | 42/1772 | 2.37 | 27/1239 | 2.18 | 15/533 | 2.81 | |||
| 21.72~<22.22 | 50/1566 | 3.19 | 27/1064 | 2.54 | 23/502 | 4.58 | |||
| 22.22~<22.67 | 44/1699 | 2.64 | 28/1163 | 2.41 | 16/536 | 2.99 | |||
| 22.67~<23.14 | 46/1591 | 2.89 | 24/976 | 2.46 | 22/615 | 3.58 | |||
| 23.14~<23.56 | 55/1750 | 3.14 | 28/1068 | 2.62 | 27/682 | 3.96 | |||
| 23.56~<24.03 | 55/1590 | 3.46 | 26/942 | 2.76 | 29/648 | 4.48 | |||
| 24.03~<24.46 | 76/1733 | 4.39 | 38/1000 | 3.8 | 38/733 | 5.18 | |||
| 24.46~<24.91 | 77/1629 | 4.73 | 34/883 | 3.85 | 43/746 | 5.76 | |||
| 24.91~<25.39 | 74/1690 | 4.38 | 42/906 | 4.64 | 32/784 | 4.08 | |||
| 25.39~<25.91 | 89/1652 | 5.39 | 49/852 | 5.75 | 40/800 | 5 | |||
| 25.92~<26.45 | 104/1744 | 5.96 | 46/807 | 5.7 | 58/937 | 6.19 | |||
| 26.45~<27.10 | 96/1578 | 6.08 | 45/730 | 6.16 | 51/848 | 6.01 | |||
| 27.10~<27.78 | 103/1709 | 6.03 | 37/732 | 5.05 | 66/977 | 6.76 | |||
| 27.78~<28.89 | 145/1674 | 8.66 | 49/737 | 6.65 | 96/937 | 10.25 | |||
| 28.89~<30.45 | 145/1673 | 8.67 | 54/659 | 8.19 | 91/1014 | 8.97 | |||
| ≥30.45 | 175/1654 | 10.58 | 72/643 | 11.2 | 103/1011 | 10.19 | |||
| Aminotransferase | |||||||||
| Group 1* | 785/13963 | 5.62 | <0.001 | NA | NA | NA | NA | ||
| Group 2** | 701/19383 | 3.62 | NA | NA | NA | NA | |||
The risk of T2DM incidence increased as the BMI grow. HR in each BMI group was shown in Table 2. The risk of T2DM incidence in BMI group of 24.03~<24.46 kg/m2 was 2.022 times statistically higher than that in the reference BMI group of 19.96~<20.66 kg/m2. After adjustment for sex, the risk of T2DM incidence in BMI group of 24.46~<24.91 kg/m2 was 1.796 times statistically higher than that in the reference BMI group. After adjustment for sex and age, the risk of T2DM incidence in BMI group of 24.91~<25.39 kg/m2 was 1.901 times statistically higher than that in the reference BMI group.
Table 2: Hazard ratio for T2DM incidence of BMI in overall cohort population
| Hazard Ratio (95% CI) | |||
|---|---|---|---|
| Model 1a | Model 2b | >Model 3c | |
| BMI kg/m2 | |||
| <19.05 | 0.543 (0.308,0.955)* | 0.550 (0.312,0.968)* | 0.601 (0.341,1.059) |
| 19.05~<19.96 | 0.539 (0.315,0.924)* | 0.553 (0.323,0.947)* | 0.583 (0.340,0.999) |
| 19.96~<20.66 | 1 | 1 | 1 |
| 20.66~<21.22 | 0.948 (0.595,1.510 | 0.937 (0.588,1.493) | 0.920 (0.577,1.466) |
| 21.22~<21.72 | 1.038 (0.665,1.620 | 1.009 (0.646,1.575) | 0.935 (0.599,1.461) |
| 21.72~<22.22 | 1.476 (0.961,2.266) | 1.371 (0.891,2.109) | 1.238 (0.804,1.908) |
| 22.22~<22.67 | 1.189 (0.765,1.847) | 1.085 (0.697,1.689) | 0.965 (0.619,1.504) |
| 22.67~<23.14 | 1.298 (0.839,2.007) | 1.076 (0.689,1.681) | 0.998 (0.640,1.556) |
| 23.14~<23.56 | 1.428 (0.938,2.174) | 1.214 (0.790,1.868) | 1.069 (0.693,1.647) |
| 23.56~<24.03 | 1.598 (1.050,2.433) | 1.316 (0.850,2.040) | 1.123 (0.724,1.743) |
| 24.03~<24.46 | 2.022 (1.360,3.007)** | 1.688 (1.113,2.561) | 1.490 (0.982,2.262) |
| 24.46~<24.91 | 2.299 (1.546,3.417)*** | 1.796 (1.179,2.737)** | 1.606 (1.053,2.451) |
| 24.91~<25.39 | 2.184 (1.465,3.256)*** | 1.787 (1.158,2.757)** | 1.395 (0.909,2.139) |
| 25.39~<25.91 | 2.644 (1.794,3.896)*** | 2.295 (1.516,3.473)*** | 1.901 (1.259,2.871)** |
| 25.92~<26.45 | 2.847 (1.948,4.162)*** | 2.425 (1.593,3.691)*** | 1.970 (1.299,2.989)** |
| 26.45~<27.10 | 3.032 (2.063,4.456)*** | 2.694 (1.763,4.117)*** | 2.222 (1.454,3.396)*** |
| 27.10~<27.78 | 2.989 (2.042,4.375)*** | 2.319 (1.524,3.530)*** | 1.940 (1.280,2.939)** |
| 27.78~<28.89 | 4.23 (2.934,6.098)*** | 3.752 (2.535,5.552)*** | 3.080 (2.078,4.565)*** |
| 28.89~<30.45 | 4.559 (3.159,6.578)*** | 3.654 (2.441,5.471)*** | 3.111 (2.081,4.650)*** |
| ≥30.45 | 5.618 (3.918,8.056)*** | 5.202 (3.538,7.650)*** | 4.668 (3.164,6.887)*** |
Tables 3 and 4 showed the HR in each BMI group in group1 and group 2, separately. BMI of 24.03~<24.46 kg/m2 was associated with statistically higher T2DM incidence in both aminotransferase group 1 and group 2. After adjustment for sex, BMI of 24.03~<24.46 kg/m2 began to be associated with statistically higher T2DM incidence in group 1, and of 24.91~<25.39 kg/m2 in group 2. After adjustment for sex and age, BMI of 24.46~<24.91 kg/m2 and 25.39~<25.91 kg/m2 began to be associated with statistically higher T2DM incidence in group 1 and group 2, separately.
Table 3: Hazard ratio for T2DM incidence of BMI in aminotransferase group 1
| Hazard Ratio (95% CI) | |||
|---|---|---|---|
| Model 1a | Model 2b | Model 3c | |
| BMI kg/m2 | |||
| <19.05 | 0.442 (0.143,1.373) | 0.442 (0.142,1.371) | 0.475 (0.153,1.475) |
| 19.05~<19.96 | 0.580 (0.228,1.474) | 0.585 (0.230,1.488) | 0.618 (0.243,1.574) |
| 19.96~<20.66 | 1 | 1 | 1 |
| 20.66~<21.22 | 0.982 (0.441,2.187) | 0.983 (0.442,2.189) | 0.988 (0.444,2.200) |
| 21.22~<21.72 | 1.039 (0.486,2.220) | 1.029 (0.481,2.200) | 0.936 (0.436,2.006) |
| 21.72~<22.22 | 1.776 (0.883,3.570) | 1.755 (0.867,3.554) | 1.696 (0.837,3.437) |
| 22.22~<22.67 | 1.164 (0.550,2.463) | 1.104 (0.518,2.351) | 1.057 (0.497,2.249) |
| 22.67~<23.14 | 1.382 (0.684,2.794) | 1.258 (0.613,2.581) | 1.184 (0.578,2.425) |
| 23.14~<23.56 | 1.502 (0.761,2.965) | 1.364 (0.677,2.746) | 1.271 (0.629,2.570) |
| 23.56~<24.03 | 1.791 (0.914,3.512) | 1.666 (0.831,3.343) | 1.504 (0.748,3.025) |
| 24.03~<24.46 | 2.031 (1.061,3.888)* | 1.996 (1.012,3.937)* | 1.875 (0.950,3.700) |
| 24.46~<24.91 | 2.567 (1.350,4.882)** | 2.361 (1.195,4.666)* | 2.219 (1.119,4.397)* |
| 24.91~<25.39 | 1.694 (0.872,3.292) | 1.639 (0.796,3.375) | 1.439 (0.701,2.954) |
| 25.39~<25.91 | 2.117 (1.110,4.038)* | 2.250 (1.133,4.468)* | 2.007 (1.016,3.963)* |
| 25.92~<26.45 | 2.410 (1.294,4.490)** | 2.512 (1.288,4.899)** | 2.235 (1.150,4.343)* |
| 26.45~<27.10 | 2.530 (1.347,4.751)** | 2.491 (1.266,4.900)** | 2.169 (1.102,4.269)* |
| 27.10~<27.78 | 2.880 (1.555,5.333)** | 2.679 (1.384,5.185)** | 2.372 (1.232,4.568)* |
| 27.78~<28.89 | 4.377 (2.401,7.981)*** | 4.236 (2.271,7.901)*** | 3.842 (2.056,7.178)*** |
| 28.89~<30.45 | 4.101 (2.244,7.496)*** | 3.643 (1.904,6.969)*** | 3.306 (1.733,6.307)*** |
| ≥30.45 | 4.312 (2.371,7.843)*** | 4.061 (2.177,7.577)*** | 3.897 (2.085,7.281)*** |
Table 4: Hazard ratio for T2DM incidence of BMI in aminotransferase group 2
| Hazard Ratio (95% CI) | |||
|---|---|---|---|
| Model 1a | Model 2b | Model 3c | |
| BMI kg/m2 | |||
| <19.05 | 0.591 (0.306,1.143) | 0.599 (0.310,1.158) | 0.653 (0.337,1.263) |
| 19.05~<19.96 | 0.523 (0.271,1.012) | 0.538 (0.278,1.041) | 0.564 (0.291,1.091) |
| 19.96~<20.66 | 1 | 1 | 1 |
| 20.66~<21.22 | 0.931 (0.525,1.651) | 0.908 (0.512,1.610) | 0.884 (0.498,1.567) |
| 21.22~<21.72 | 1.032 (0.595,1.788) | 0.998 (0.575,1.730) | 0.954 (0.550,1.653) |
| 21.72~<22.22 | 1.255 (0.724,2.175) | 1.169 (0.674,2.029) | 0.994 (0.571,1.732) |
| 22.22~<22.67 | 1.188 (0.689,2.050) | 1.095 (0.633,1.891) | 0.928 (0.535,1.612) |
| 22.67~<23.14 | 1.184 (0.672,2.085) | 0.955 (0.537,1.700) | 0.894 (0.503,1.590) |
| 23.14~<23.56 | 1.304 (0.756,2.249) | 1.115 (0.641,1.940) | 0.948 (0.543,1.654) |
| 23.56~<24.03 | 1.362 (0.782,2.373) | 1.062 (0.597,1.891) | 0.887 (0.498,1.581) |
| 24.03~<24.46 | 1.898 (1.138,3.165)* | 1.469 (0.862,2.504) | 1.244 (0.727,2.129) |
| 24.46~<24.91 | 1.926 (1.141,3.248)* | 1.409 (0.813,2.444) | 1.214 (0.699,2.111) |
| 24.91~<25.39 | 2.530 (1.530,4.184)*** | 1.912 (1.116,3.277)* | 1.366 (0.800,2.333) |
| 25.39~<25.91 | 3.015 (1.848,4.920)*** | 2.345 (1.397,3.935)** | 1.874 (1.113,3.154)* |
| 25.92~<26.45 | 3.030 (1.848,4.968)*** | 2.217 (1.286,3.823)** | 1.669 (0.966,2.883) |
| 26.45~<27.10 | 3.307 (2.010,5.443)*** | 2.737 (1.584,4.728)*** | 2.212 (1.278,3.829)** |
| 27.10~<27.78 | 2.694 (1.609,4.510)*** | 1.855 (1.056,3.258)* | 1.514 (0.863,2.657) |
| 27.78~<28.89 | 3.460 (2.119,5.648)*** | 2.913 (1.713,4.954)*** | 2.160 (1.271,3.669)** |
| 28.89~<30.45 | 4.508 (2.780,7.309)*** | 3.506 (2.074,5.927)*** | 2.810 (1.656,4.767)*** |
| ≥30.45 | 6.903 (4.327,11.011)*** | 6.248 (3.805,10.257)*** | 5.142 (3.096,8.539)*** |
The HR of T2DM according to BMI was shown in Figure 1. Figure 1A showed the risk of T2DM incidence according to BMI in aminotransferase group 1 and group 2; The slop of curve increased when BMI exceeded 23.4 kg/m2 in group 2; while the slop of curve decreased when BMI exceeded 28.4 kg/m2. Figure 1B showed the that in the total participants; The slop increased when BMI exceeded 22.0 kg/m2 and then decreased when BMI exceeded 28.5 kg/m2. The turning point of BMI at high risk of T2DM was 25.0 (HR 2.699; 95% CI 1.072~6.642) kg/m2. In aminotransferase group 2, the turning point of BMI was 25.1 (HR 3.213; 95% CI 1.140~9.050) kg/m2, and that in group 1 was 26.1 (HR 4.935; 95% CI 2.041~11.930) kg/m2. These findings suggested that the relationship between BMI and T2DM incidence was greater in those with AST < 20 or ALT < 20.
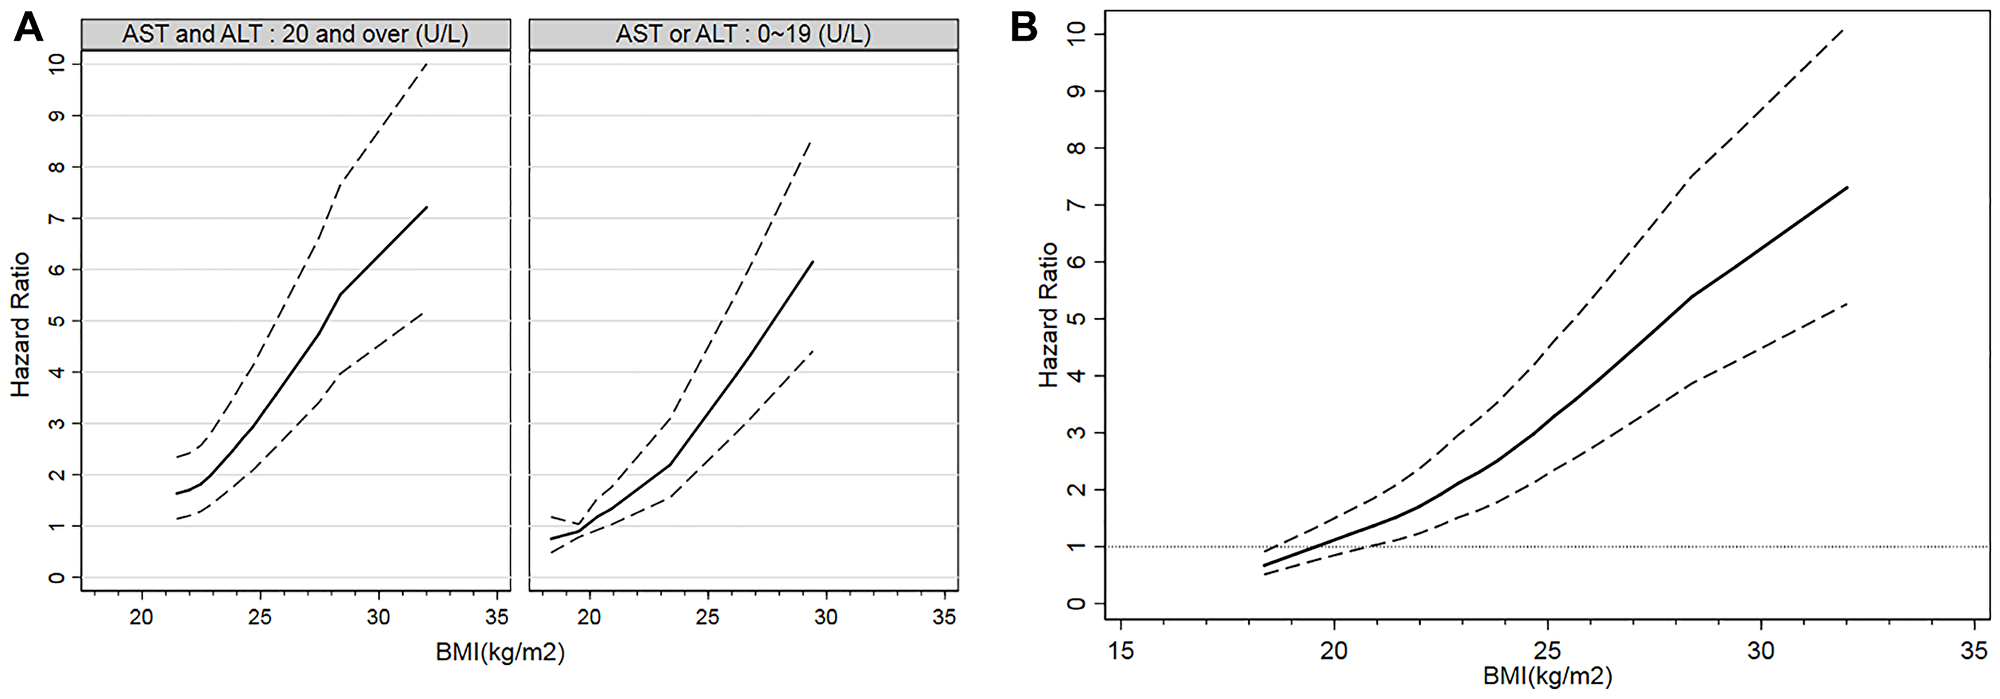
Figure 1: Incidence of T2DM according to BMI. Hazard ratios and 95% CIs of T2DM incidence according to BMI were shown. (A) Incidence of T2DM according to BMI by aminotransferase groups. (B) Incidence of T2DM according to BMI in all participants.
DISCUSSION
BMI control is an issue of concern in T2DM prevention, multiple observational studies has reported the association between BMI and T2DM [7–11, 14, 17, 25]. Consist with the findings in these studies, higher BMI was associated with increased incidence of T2DM in our study. The cumulative incidence of T2DM was less than 2% for BMI < 20.66 kg/m2 and was more than 5% for BMI ≥ 25.39 kg/m2. HR also increased with BMI, and was higher than 2 for BMI over 24.03 kg/m2. Guidelines for the prevention and control of type 2 diabetes in China (2017 Edition) points out that 25.0 kg/m2 was the average BMI for T2DM patients, while the average baseline BMI for T2DM development in our study was 26.22 kg/m2. The probable cause of the difference might be the multiple nationalities in Xinjiang and the geographical location of Central Asia. The Chennai Urban Rural Epidemiology Study suggested a BMI cut-off value of 24.0 associated with increased risk of hypertension, dyslipidemia and diabetes in Chinese adults [26]. In our study, the BMI cut-off value was 25.0 kg/m2, 1.0 kg/m2 higher than the suggested 24.0 kg/m2, indicating a weakened risk of T2DM for the same BMI value in Xinjiang population. Our finding suggested that in Xinjiang population, 25.0 kg/m2 may be an key BMI value in T2DM development. It also suggested that people with BMI over 25 kg/m2 had higher predisposition to T2DM and especially need intervention to loss weight.
Liver plays a major role in the regulation of glucose homeostasis by regulating various pathways of glucose metabolism, including gluconeogenesis, glycogenolysis, glycogenesis and glycolysis [27, 28]. Studies have proved that among the most studied clinical liver serum bio-markers(AST, ALT, gamma-glutamyl transpeptidase, alkaline phosphatase), higher serum AST or ALT is associated with higher T2DM risk [15–17]. In our study, we set 19 U/L as healthy limit for participants and set aminotransferase group 1 as higher level for both AST and ALT. In our study, the rise of both AST and ALT (group 1) was an independent risk factor of T2DM. Since serum AST and ALT are markers of non-alcoholic fatty liver disease (NAFLD), which is a strong independent risk factor of T2DM, this finding can be explained. Elevated serum AST and ALT alone could also increase the risk of T2DM, and is independent of NAFLD [29]. BMI in group 2 showed higher association (higher HR) with T2DM compared with group 1. Also, the cut-off point of BMI in group 1 (26.1 kg/m2) is higher than that in group 2 (25.1 kg/m2), indicating a greater relationship of BMI and T2DM in group 2, probably because of insulin resistance caused by liver dysfunction [28].
Materials and Methods
Study population
We conducted a retrospective cohort study based on check-up patients in Karamay Central Hospital of Xinjiang from 2008 to 2017. Baseline age, sex, fasting blood sugar (FBS), height, weight, AST, ALT and annual FBS were collected. Patients with baseline FBS ≥ 7.0 mmol/L were excluded and 33346 participants with FBS < 7.0 mmol/L were included in the study. Our study was approved by the Ethics Committee of the Karamay Center Hospital of Xinjiang.
Statistical analysis
Baseline BMI were calculated by baseline height and weight, T2DM was diagnosed as FBS ≥ 7.0 mmol/L. Sex group were set as male and female. Age group were set as under 30, 30~44, 45~59 and 60 years old or over. Baseline BMI were divided into 20 groups by percentiles. We divided AST and ALT by 20 U/L. According to AST and ALT, we set aminotransferase group 1 and group 2. All analyses were conducted separately for totality, group 1 and group 2. We analyzed the incidence of T2DM in each sex group, age group, BMI group and aminotransferase group. We also estimated the crude hazard ratio (HR), sex-adjusted HR and age-and-sex-adjusted HR of T2DM for each BMI group. We set BMI categories by 5th 10th 15th 20th 25th 30th 35th 40th 45th 50th 55th 60th 65th 70th 75th 80th 85th 90th 95th 100th percentiles to estimate the non-linear association between BMI and T2DM for totality, group 1 and group 2. We determine the turning point of BMI at high risk of T2DM as the lowest BMI value for which the HR of T2DM was statistically significant with a reference BMI of 20.00 (19.95~<20.05) kg/m2 and the increment was 0.1 kg/m2.
All statistical analysis were conducted by STATA 15.0 and IBM SPSS Statistics 26.0.
Abbreviations
T2DM: type 2 diabetes; BMI: body mass index; FBS: fasting blood sugar; AST: aspartate aminotransferase; ALT: alanine aminotransferase; HR: hazard ratio; SD: standard deviation.
ACKNOWLEDGMENTS
We thank Qi-fan Wu for his help in statistical analysis.
CONFLICTS OF INTEREST
Authors have no conflicts of interest to declare.
FUNDING
This work was supported by Pudong Health Bureau of Shanghai [PWZxk 2017-27], Shanghai Pudong Hospital [YJRCJJ201801], Ministry of Science and Technology of the People’s Republic of China [2018YFC1311504].
References
1. Shlomai G, Neel B, LeRoith D, Gallagher EJ. Type 2 Diabetes Mellitus and Cancer: The Role of Pharmacotherapy. J Clin Oncol. 2016; 34:4261–69. https://doi.org/10.1200/JCO.2016.67.4044. [PubMed].
2. Heintjes EM, Houben E, Beekman-Hendriks WL, Lighaam E, Cremers SM, Penning-van Beest FJA, Stehouwer CDA, Herings RMC. Trends in mortality, cardiovascular complications, and risk factors in type 2 diabetes. Neth J Med. 2019; 77:317–29. [PubMed].
3. Carrillo-Larco RM, Barengo NC, Albitres-Flores L, Bernabe-Ortiz A. The risk of mortality among people with type 2 diabetes in Latin America: A systematic review and meta-analysis of population-based cohort studies. Diabetes Metab Res Rev. 2019; 35:e3139. https://doi.org/10.1002/dmrr.3139. [PubMed].
4. Wang L, Gao P, Zhang M, Huang Z, Zhang D, Deng Q, Li Y, Zhao Z, Qin X, Jin D, Zhou M, Tang X, Hu Y, Wang L. Prevalence and Ethnic Pattern of Diabetes and Prediabetes in China in 2013. JAMA. 2017; 317:2515–23. https://doi.org/10.1001/jama.2017.7596. [PubMed].
5. Wu H, Eggleston KN, Zhong J, Hu R, Wang C, Xie K, Chen Y, Chen X, Yu M. How do type 2 diabetes mellitus (T2DM)-related complications and socioeconomic factors impact direct medical costs? A cross-sectional study in rural Southeast China. BMJ Open. 2018; 8:e020647. https://doi.org/10.1136/bmjopen-2017-020647. [PubMed].
6. Hills AP, Arena R, Khunti K, Yajnik CS, Jayawardena R, Henry CJ, Street SJ, Soares MJ, Misra A. Epidemiology and determinants of type 2 diabetes in south Asia. Lancet Diabetes Endocrinol. 2018; 6:966–78. https://doi.org/10.1016/S2213-8587(18)30204-3. [PubMed].
7. Papier K, D’Este C, Bain C, Banwell C, Seubsman SA, Sleigh A, Jordan S. Body mass index and type 2 diabetes in Thai adults: defining risk thresholds and population impacts. BMC Public Health. 2017; 17:707. https://doi.org/10.1186/s12889-017-4708-7. [PubMed].
8. Surgery CSfMB. Guidelines for surgical treatment of obesity and type 2 diabetes in China. Chinese Journal of Practical Surgery. 2014; 34:1005–10.
9. Society CD. Guidelines for the prevention and control of type 2 diabetes in China. Chinese Journal of Diabetes Mellitus. 2017; 10:4–67. https://doi.org/10.3760/cma.j.issn.1674-5809.2018.01.003.
10. Abdullah A, Peeters A, de Courten M, Stoelwinder J. The magnitude of association between overweight and obesity and the risk of diabetes: a meta-analysis of prospective cohort studies. Diabetes Res Clin Pract. 2010; 89:309–19. https://doi.org/10.1016/j.diabres.2010.04.012. [PubMed].
11. Hruby A, Hu FB. The Epidemiology of Obesity: A Big Picture. Pharmacoeconomics. 2015; 33:673–89. https://doi.org/10.1007/s40273-014-0243-x. [PubMed].
12. Chiu M, Austin PC, Manuel DG, Shah BR, Tu JV. Deriving ethnic-specific BMI cutoff points for assessing diabetes risk. Diabetes Care. 2011; 34:1741–48. https://doi.org/10.2337/dc10-2300. [PubMed].
13. Hunma S, Ramuth H, Miles-Chan JL, Schutz Y, Montani JP, Joonas N, Dulloo AG. Body composition-derived BMI cut-offs for overweight and obesity in Indians and Creoles of Mauritius: comparison with Caucasians. Int J Obes (Lond). 2016; 40:1906–14. https://doi.org/10.1038/ijo.2016.176. [PubMed].
14. Gong H, Pa L, Wang K, Mu H, Dong F, Ya S, Xu G, Tao N, Pan L, Wang B, Shan G. Prevalence of Diabetes and Associated Factors in the Uyghur and Han Population in Xinjiang, China. Int J Environ Res Public Health. 2015; 12:12792–802. https://doi.org/10.3390/ijerph121012792. [PubMed].
15. Kunutsor SK, Apekey TA, Walley J. Liver aminotransferases and risk of incident type 2 diabetes: a systematic review and meta-analysis. Am J Epidemiol. 2013; 178:159–71. https://doi.org/10.1093/aje/kws469. [PubMed].
16. De Silva NMG, Borges MC, Hingorani AD, Engmann J, Shah T, Zhang X, Luan J, Langenberg C, Wong A, Kuh D, Chambers JC, Zhang W, Jarvelin MR, et al, and UCLEB consortium. Liver Function and Risk of Type 2 Diabetes: Bidirectional Mendelian Randomization Study. Diabetes. 2019; 68:1681–91. https://doi.org/10.2337/db18-1048. [PubMed].
17. Wannamethee SG, Shaper AG, Lennon L, Morris RW. Metabolic syndrome vs Framingham Risk Score for prediction of coronary heart disease, stroke, and type 2 diabetes mellitus. Arch Intern Med. 2005; 165:2644–50. https://doi.org/10.1001/archinte.165.22.2644. [PubMed].
18. Piton A, Poynard T, Imbert-Bismut F, Khalil L, Delattre J, Pelissier E, Sansonetti N, Opolon P. Factors associated with serum alanine transaminase activity in healthy subjects: consequences for the definition of normal values, for selection of blood donors, and for patients with chronic hepatitis C. MULTIVIRC Group. Hepatology. 1998; 27:1213–19. https://doi.org/10.1002/hep.510270505. [PubMed].
19. Prati D, Taioli E, Zanella A, Della Torre E, Butelli S, Del Vecchio E, Vianello L, Zanuso F, Mozzi F, Milani S, Conte D, Colombo M, Sirchia G. Updated definitions of healthy ranges for serum alanine aminotransferase levels. Ann Intern Med. 2002; 137:1–10. https://doi.org/10.7326/0003-4819-137-1-200207020-00006. [PubMed].
20. Sohn W, Jun DW, Kwak MJ, Park Q, Lee KN, Lee HL, Lee OY, Yoon BC, Choi HS. Upper limit of normal serum alanine and aspartate aminotransferase levels in Korea. J Gastroenterol Hepatol. 2013; 28:522–29. https://doi.org/10.1111/j.1440-1746.2012.07143.x. [PubMed].
21. Siest G, Schiele F, Galteau MM, Panek E, Steinmetz J, Fagnani F, Gueguen R. Aspartate aminotransferase and alanine aminotransferase activities in plasma: statistical distributions, individual variations, and reference values. Clin Chem. 1975; 21:1077–87. [PubMed].
22. Salvaggio A, Periti M, Miano L, Tavanelli M, Marzorati D. Body mass index and liver enzyme activity in serum. Clin Chem. 1991; 37:720–23. [PubMed].
23. Sull JW, Yun JE, Lee SY, Ohrr H, Jee SH, Guallar E, Samet JM. Body mass index and serum aminotransferase levels in Korean men and women. J Clin Gastroenterol. 2009; 43:869–75. https://doi.org/10.1097/MCG.0b013e3181945956. [PubMed].
24. Hsieh MH, Lin WY, Chien HH, Chien LH, Huang CK, Yang JF, Chang NC, Huang CF, Wang CL, Chuang WL, Yu ML, Dai CY, Ho CK. Waist circumference, body mass index, serum uric acid, blood sugar, and triglyceride levels are important risk factors for abnormal liver function tests in the Taiwanese population. Kaohsiung J Med Sci. 2012; 28:470–76. https://doi.org/10.1016/j.kjms.2012.04.003. [PubMed].
25. Song BM, Kim HC, Kim DJ, Ahn SV, Kim KM, Lee JM, Koh SB, Suh I. Aminotransferase levels, body mass index, and the risk of diabetes: a prospective cohort study. Ann Epidemiol. 2018; 28:675–80.e6. https://doi.org/10.1016/j.annepidem.2018.07.009. [PubMed].
26. Wildman RP, Gu D, Reynolds K, Duan X, He J. Appropriate body mass index and waist circumference cutoffs for categorization of overweight and central adiposity among Chinese adults. Am J Clin Nutr. 2004; 80:1129–36. https://doi.org/10.1093/ajcn/80.5.1129. [PubMed].
27. Arrieta-Cruz I, Gutiérrez-Juárez R. The Role of Circulating Amino Acids in the Hypothalamic Regulation of Liver Glucose Metabolism. Adv Nutr. 2016; 7:790S–97S. https://doi.org/10.3945/an.115.011171. [PubMed].
28. Han HS, Kang G, Kim JS, Choi BH, Koo SH. Regulation of glucose metabolism from a liver-centric perspective. Exp Mol Med. 2016; 48:e218. https://doi.org/10.1038/emm.2015.122. [PubMed].
29. Zhang J, Cheng N, Ma Y, Li H, Cheng Z, Yang Y, He C, Li J, Pu H, Shen X, Ren X, Shi D, Pu R, et al. Liver Enzymes, Fatty Liver and Type 2 Diabetes Mellitus in a Jinchang Cohort: A Prospective Study in Adults. Can J Diabetes. 2018; 42:652–58. https://doi.org/10.1016/j.jcjd.2018.02.002. [PubMed].