
Introduction
Thymic epithelial tumors (TETs) are rare tumors that represent a wide spectrum of disease from the indolent thymoma to the more aggressive thymic carcinoma. The World Health Organization (WHO) has categorized these tumors on the basis of immunophenotypic and histopathologic characteristics. Thymoma subtypes include A (including atypical A variant), AB, B1, B2, B3, and other rare categories; in addition, there are TET subtypes of thymic carcinoma and thymic neuroendocrine tumor [1]. However, there are known pitfalls of the classification system that were addressed to some degree in the 2015 4th edition WHO update. These include only modest inter-observer reproducibility [2], intra-tumoral heterogeneity [3], and a weak correlation with prognosis [4]. Therefore, a more robust classification system of TETs is needed.
Identifying the molecular characteristics of TETs has the potential to result in a more refined classification system and subsequent personalization of therapy. As an example, a 9-gene expression signature using real-time quantitative reverse transcription PCR (qRT-PCR) predicted metastatic behavior for thymomas and was a superior prognostic factor to WHO histologic classification [5]. In another study of 34 thymomas, gene expression analysis identified cancer pathways associated with metastases, including those related to amino acid metabolism, cell cycle checkpoint proteins, and Notch signaling [6]. There have been several molecular analyses performed on TETs [7–9], with the The Cancer Genome Atlas (TCGA) reporting on a comprehensive multi-omic analysis of 117 TETs [10]. The most frequently mutated genes included GTF2I (39%; majority type A and AB thymomas), HRAS (codons 12, 13, 117), NRAS (codon 61) and TP53 (pathogenic loss-of- function). Integrating multi-omic platform results using two different approaches, four subtypes of TETs defined by genomic hallmarks were identified. However, these molecular subtypes correlated to some degree with WHO histologic subtypes as assessed by blinded pathologic review.
Despite the advancement in molecular diagnostics, the molecular aberrations and molecular subtypes discovered from the TCGA have not yet affected therapeutic decisions. Current systemic treatments for TETs rely heavily on chemotherapy options, as studied in small phase II clinical trials and prospective/retrospective cohort studies [11]. Targeted therapies such as sunitinib [12], octreotide [13] and everolimus [14, 15] have resulted in only modest activity for TETs. These results may reflect the unselected patient population enrolled in these studies, including no selection for WHO histologic subtype or molecular aberrations. Despite an increased understanding of TETs, the complex pathology of this rare disease needs to be further elucidated and more biology-driven therapeutic strategies need to be developed.
In this study, we applied computational analyses [16] to the genomic dataset of 102 TETs from the TCGA and the IU-TAB-1 type AB thymoma cell line [17]. The goals were (i) to identify novel molecular subtypes of TETs and examine their association with WHO histologic subtypes, and (ii) to present a proof-of-concept approach of preclinical validation of candidate therapeutics in a molecularly classified cell line for potential further clinical investigation in this rare disease.
Results
Genomic clustering analysis identifies TET molecular subtypes independent of WHO histotypes
The 102 evaluable WHO TET histotypes represented in this study from the TCGA database include thymoma type A (10), AB (37), B1 (13), B2 (23), B3 (13) and thymic carcinoma (6). There were no significant differences observed in the demographic, tumor, and treatment characteristics of this sub-cohort when compared to the overall 117 patient TCGA cohort (Supplementary Table 1). Using this clustering analysis [16], 6 unique TET subtypes were identified from the TCGA dataset: TH1 (12), TH2 (30), TH3 (11), TH4 (19), TH5 (9), TH6 (18) and 3 were un-clustered. There was no significant association between the identified TH molecular subtypes and WHO histotypes (Figure 1 and Supplementary Table 2).
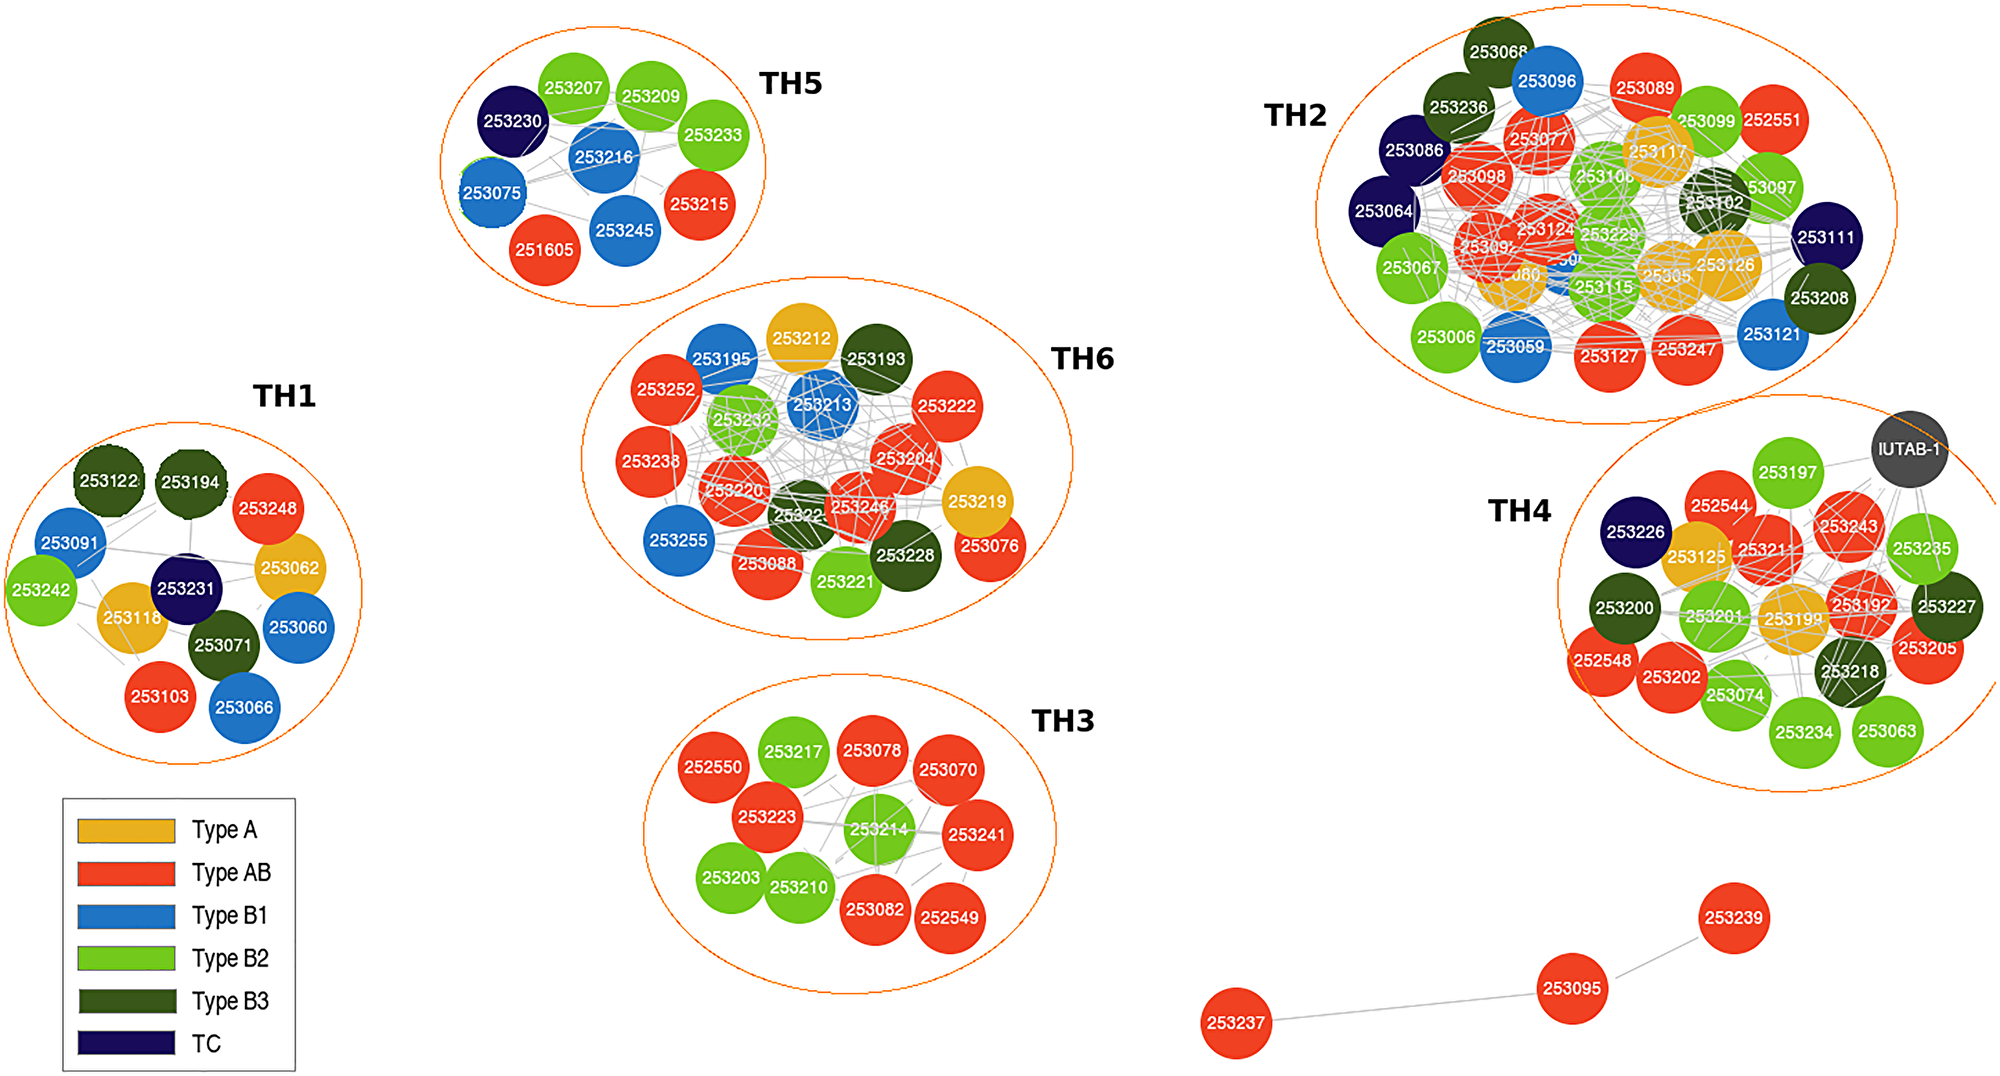
Figure 1: Genomic clustering approach identifies thymic epithelial tumor (TET) molecular subtypes that are independent of World Health Organization (WHO) histotypes.
Features of TET molecular subtypes
Each identified TET molecular subtype was associated with characteristic molecular alterations (Figure 2). The predominant characteristics of each TH subtype includes molecular aberrations present in ≥ 50% of tumors in the subtype (Figure 2 and Table 1). TH subtypes characterized by a GTF2I mutation included TH1, TH4, and TH6 while subtypes characterized by GTF2I wild type included TH2, TH3, and TH5. Previous analyses have demonstrated recurrent missense GTF2I mutations in WHO histologic type A and AB thymomas [7]. In this analysis, subtypes characterized by a GTF2I mutation had the following molecular features that predominated: chromosome 22q deletion (del) in TH1 (e.g., XBP1, CHEK2, NF2, MAPK1); complex cytogenetics in TH4 (e.g., MYC amplification, TXNIP1 amplification and CDKN2A/B del); and chromosome 9p del in TH6 (e.g., CDKN2A/B, VCP, TLN1, PAX5). Among TH subtypes characterized by GTF2I wild type, the following molecular features predominated: complex cytogenetics in TH2 (i.e., multiple cytogenetic aberrations not identified in a specific pattern); chromosome 1 amplification in TH3 (e.g., MCL1, ARNT, ABL2, PTPRC, GADD45A); and HRAS mutation, chromosome 2 amplification (e.g., ERBB4, IRS1) and CDKN2A/B del in TH5.
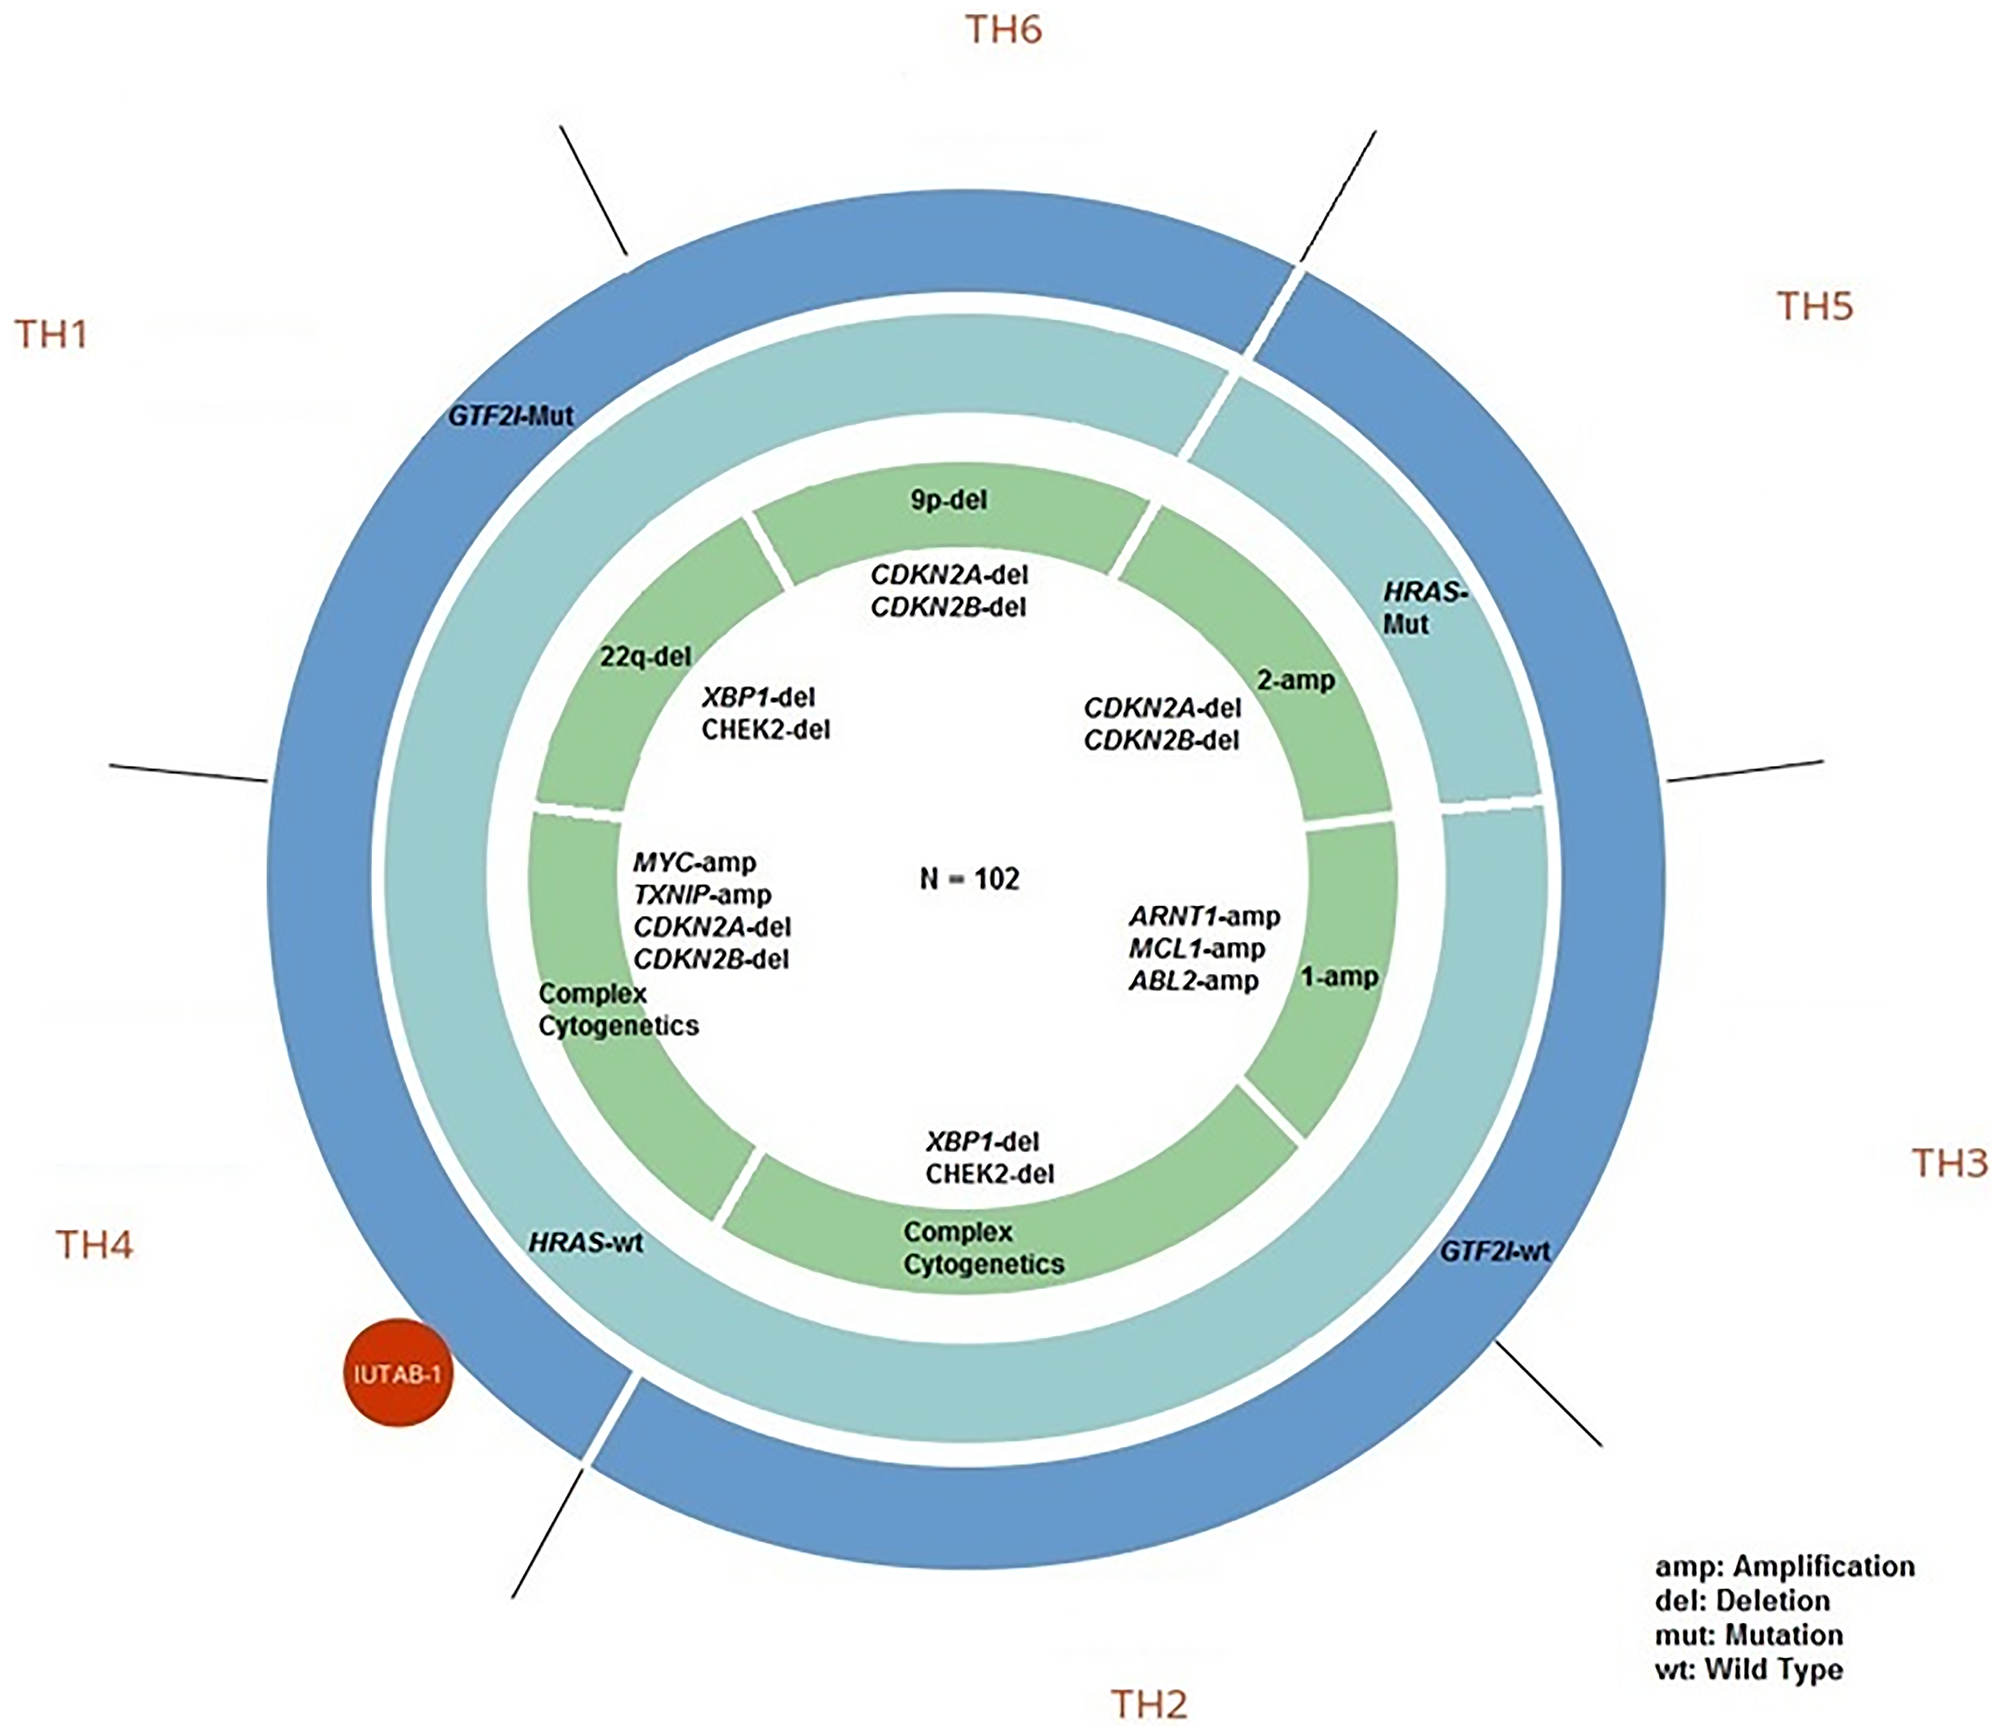
Figure 2: Genomic characteristics of thymic epithelial tumor (TET) molecular subtypes.
Table 1: Molecular aberrations in thymic epithelial tumor (TET) molecular subtypes
| Subtype | GTF2I mutation | HRAS mutation | Chr9p-deletiona | Chr22q-deletionb | Complex-Cytogeneticsc | Chr1-amplificationd | Chr2-amplificatione |
|---|---|---|---|---|---|---|---|
| TH1 (n = 12) | 58.3% (7) | 0% | 16.7% (2) | 50% (6) | 16.7% (2) | 8.3% (1) | 8.3% (1) |
| TH2 (n = 30) | 13.3% (4) | 0% | 13.3% (4) | 10% (3) | 70% (21) | 0% | 3.3% (1) |
| TH3 (n = 11) | 18.2% (2) | 0% | 9.1% (1) | 9.1% (1) | 9.1% (1) | 54.5% (6) | 0% |
| TH4 (n = 19) | 73.7% (14) | 0% | 15.8% (3) | 15.8% (3) | 63.2% (12) | 0% | 0% |
| TH5 (n = 9) | 0% | 55.6% (5) | 0% | 0% | 11.1% (1) | 11.1% (1) | 55.6% (5) |
| TH6 (n = 18) | 66.7% (12) | 0% | 55.6% (10) | 5.6% (1) | 11.1% (2) | 5.6% (1) | 16.7% (3) |
IU-TAB-1 cell line characteristics and candidate therapeutic in vitro experiments
The IU-TAB-1 cell line consists of a gain-of-function mutation in PIK3CA and an amplification of genes including AURKA, ERBB2, KIT, PDGFRA and PDGFB, all of which are known to activate the AKT pathway [18–24]. Presence of FHIT and CDH1 deletion in the IU-TAB-1 cell line may also upregulate the beta catenin pathway [25, 26].
The IU-TAB-1 cell line clustered into the TH4 molecular subtype (Figure 2). Therefore, the IU-TAB-1 cell line was used for in vitro candidate therapeutic testing of the TH4 subtype, including with nelfinavir (AKT1 inhibitor) [27], panobinostat (histone deacetylase [HDAC] inhibitor) [28], bortezomib (proteasome inhibitor) [29] and everolimus (mTORC1 inhibitor) [14] (Figure 3A–3D).
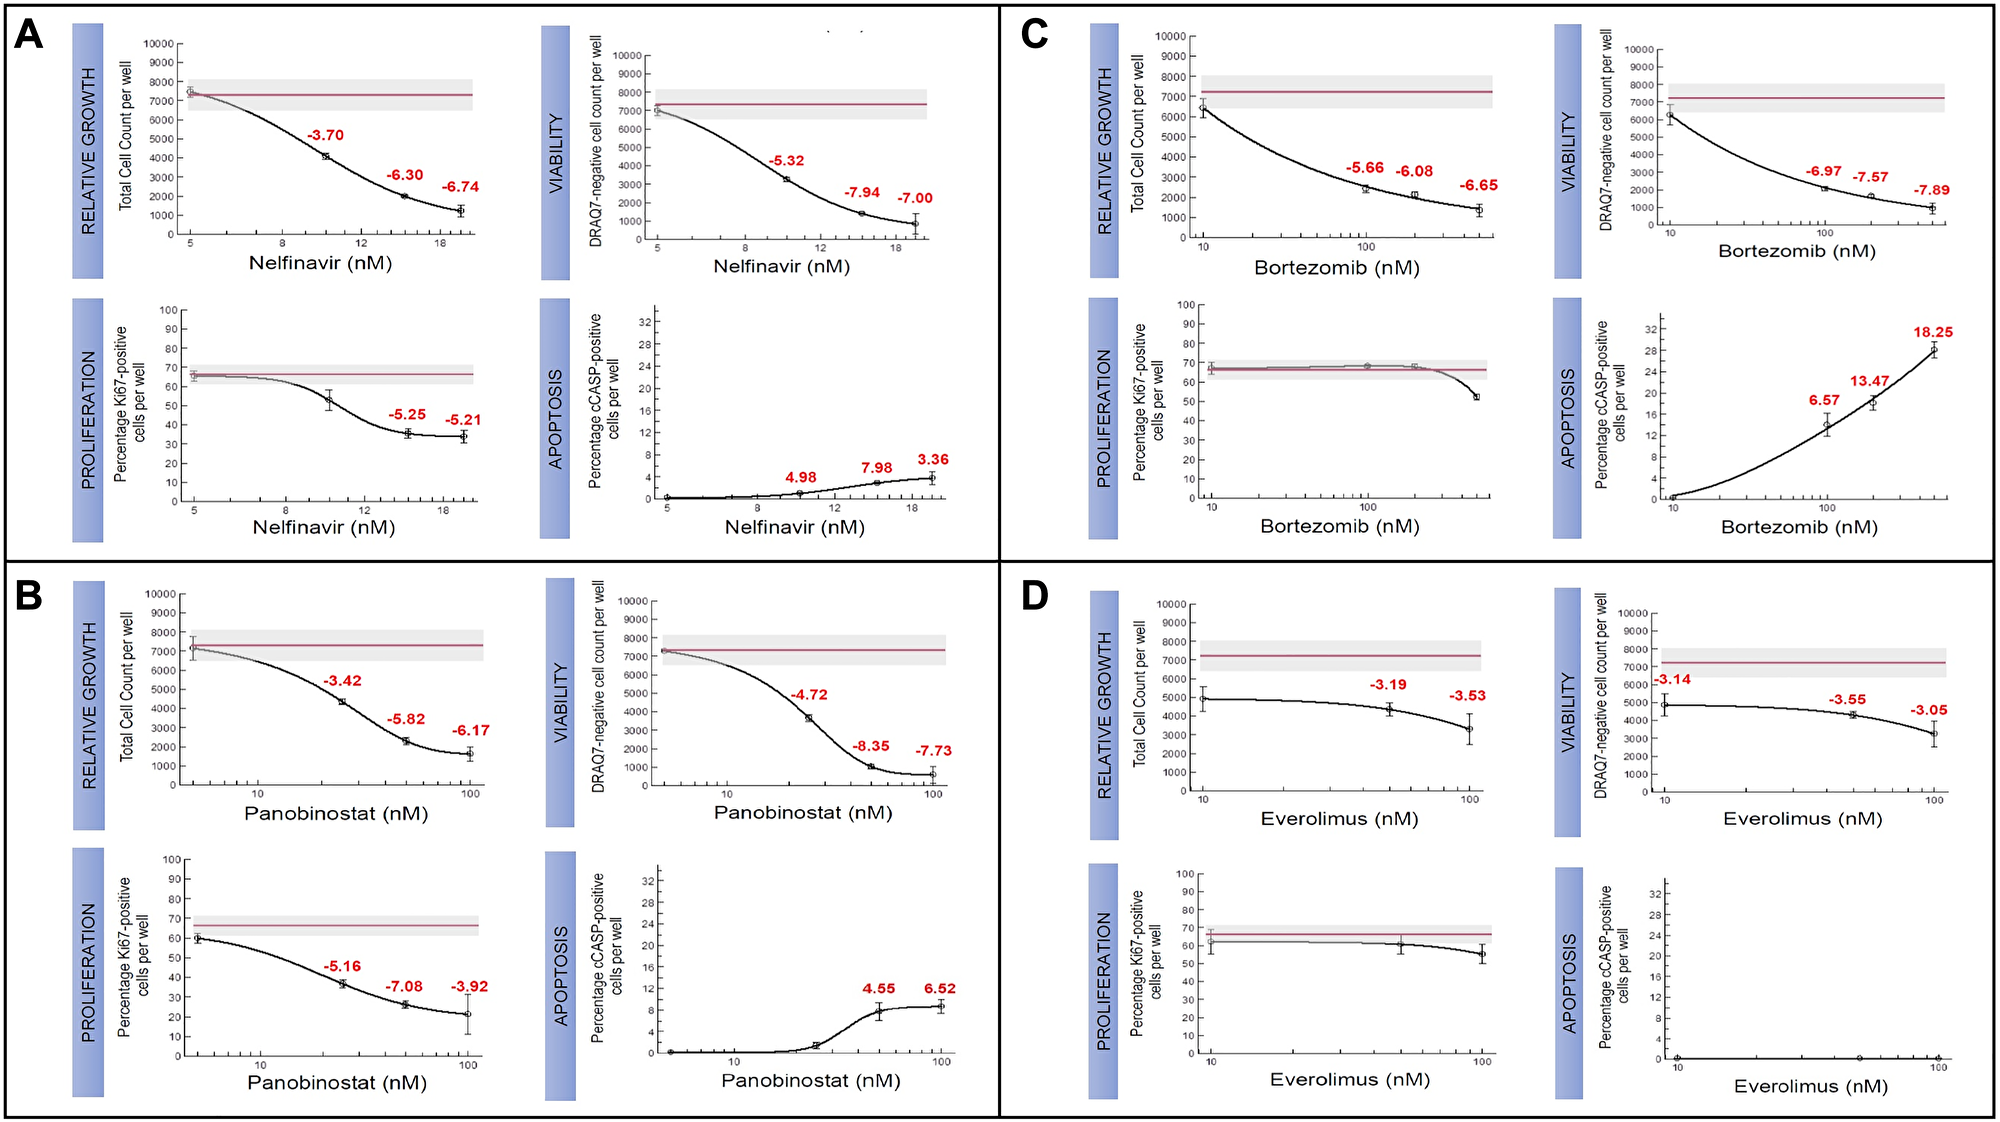
Figure 3: Candidate therapeutics tested for TH4 subtype in IU-TAB-1 cell line. Experimental dose-response curves assessing relative growth (Hoechst staining of DNA), proliferation (Ki67), viability (DRAQ7 assay), and apoptosis (caspase) for (A) Nelfinavir, (B) Panobinostat, (C) Bortezomib, and (D) Everolimus. The red line in the experimental graphs indicate DMSO treated control.
Nelfinavir [27], had significant impact on outcomes of relative growth (IC50 ~10 uM), proliferation, viability, and apoptosis in the IU-TAB-1 cell line (Figure 3A). The sensitivity of the AKT1 inhibitor is due to the presence of a gain-of function (GOF) mutation in PIK3CA and amplification of genes observed from array comparative genomic hybridization (aCGH) that result in upregulation of AKT, including AURKA, ERBB2, KIT, PDGFRA and PDGFB [18–24].
Panobinostat [28] inhibited relative growth (IC50 ~30 nM), proliferation and viability and increased apoptosis in the IU-TAB-1 cell line (Figure 3B). The sensitivity of the HDAC inhibitor is possibly due to deletion of ARID1A, an epigenetic regulator encoding a subunit of SWI/SNF chromatid-remodeling complex, which has been linked to the upregulation of HDAC6 [30, 31]. It was also observed that HDAC inhibition significantly suppressed the tumor growth in an ARID1A−/−/PIK3CAMUT genetic clear cell ovarian tumor mouse model and this similar molecular condition of ARID1A deletion and PIK3CA mutation is present in the IU-TAB-1 cell line [30].
Bortezomib [29] had variable impact on outcomes measured in the IU-TAB-1 cell line, with resistance noted in proliferation endpoints but sensitivity noted in relative growth, viability and apoptosis endpoints (Figure 3C). The reason for IU-TAB-1 resistance to the anti-proliferative effect of bortezomib was due to deletion of CDH1 and FHIT, which are known to upregulate the beta catenin pathway, a key protein in the canonical Wingless/int (Wnt) pathway [25, 26], and subsequently increase cell proliferation and G2 to M cell cycle transition via CCND1 [32, 33]. Bortezomib was also observed to lead to accumulation of beta catenin protein in a dose- and time-dependent manner without changing the mRNA level in multiple myeloma cell lines, suggesting the effect was at the post-transcriptional level and this accumulation was associated with bortezomib resistance [34]. In addition, there is loss of SPEN in the IU-TAB-1 cell line, a transcriptional co-repressor that directly binds and negatively regulates RBPJ [35]. This can result in upregulation of the NOTCH pathway via formation of the Notch transcription activation complex (NTC), which has been demonstrated to contribute to bortezomib resistance in multiple myeloma [36].
It was interesting to note that everolimus, mTORC1 inhibitor, with clinical activity previously noted in a subset of patients with TETs [14, 15], had no effect on relative growth, proliferation, viability, and apoptosis in the IU-TAB-1 cell line. There was no evidence of apoptosis even as concentrations approached 100 nM (Figure 3D). Despite the PIK3CA mutation and other aberrations such as AURKA amplification resulting in downstream upregulation of the AKT1 pathway [19], the resistance to everolimus was due to amplification of KIT, PDGFRA, and PDGFB observed in the IU-TAB-1 cell line. mTOR inhibition can result in upregulation of pro-survival signaling downstream of KIT, PDGFRA and PDGFB via release of mTOR-mediated negative feedback loops (e.g., via GRB10) [37–39], possibly accounting for resistance to everolimus.
DISCUSSION
In this study, we present an updated molecular classification system for TETs using a correlation clustering method of molecular data, including genomic aberrations and copy number variations [16]. There are significant limitations to the current WHO classification system for TETs, which is predicated upon epithelial cell morphology and lymphocyte abundance [1–4]. The current classification system also does not provide insight into the molecular characteristics of TETs and thus is limited in its ability to inform potential therapeutic decisions.
In our study, we identified six molecular subtypes of TETs (TH1-TH6), and notably, they were independent of WHO histotypes, which is in contrast to prior TCGA reports [10, 40]. In the cluster-of-clusters-assignments (COCA) analysis from the primary TCGA publication by Radovich et al, data from somatic copy number variation (sCNV), mRNA, miRNA, DNA methylation, and reverse phase protein array (RPPA) data was used to identify four molecular subtypes. These molecular subtypes strongly correlated with WHO histotypes including type B, thymic carcinoma, type AB, and a mix of types A and B. In a complementary approach to COCA known as TumorMap, incorporating each single platform analysis performed along with multi-platform PARADIGM analyses (copy number plus gene expression data), four molecular subtypes were identified. These also strongly correlated with WHO histotypes, including A-like, AB-like, B-like, and C-like clusters. In a separate publication, Lee et al used a decision tree approach and data from DNA mutational analyses, unsupervised clustering of mRNA expression data, and sCNV, to propose four molecular subtypes from the TCGA cohort that also correlated with WHO histotypes [40]. In our clustering analysis, three of the 102 tumors were un-clustered due to insufficient number of genomic alterations/CNVs. In addition, 15 tumors from the original TCGA dataset were not evaluable upfront due to this reason, representing a limitation of this analysis. Despite the TCGA being a relatively large dataset with comprehensive multi-omic analyses for this rare disease, the representation of certain histotypes was limited (e.g., type A, B1, B3, and thymic carcinoma) and the stage of tumors was biased towards early stage (e.g., I, IIA, IIB).
Targeted therapies have been and are being actively examined in TETs, with almost all studies not including biomarker selection a priori. For example, in a phase 2 study of everolimus in TETs, the overall disease control rate (DCR) was 88% (thymoma 93.8%; thymic carcinoma 77.8%) and the response rate was 12% (thymoma 9.4%; thymic carcinoma 16.7%) in 44 evaluable patients [14]. However, this clinical trial did not perform molecular profiling of the tumors. A retrospective analysis of a small cohort of patients (N = 15) from our institution with advanced thymic tumors treated with everolimus also failed to identify molecular biomarkers of response. There were several patients with durable responses to everolimus who had tumor mutations in the fibroblast growth factor family of receptors (FGFR). However, the small sample size made it difficult to draw definitive conclusions about the predictive nature of these alterations [15]. There is likely limited utility of a single genomic aberration as a predictive biomarker for treatment in patients with TETs, highlighting the importance of alternative methods for treatment selection. For example, in a phase 2 study of sunitinib, a multi-targeted tyrosine kinase inhibitor of VEGFR, KIT, and PDGFR, there was notable activity in patients with thymic carcinoma, with a DCR of 91% and response rate of 26% in 23 evaluable patients [12]. Molecular profiling of tumors was performed in 22 patients (13 with thymic carcinoma) and there was no association with any specific mutation and response, although no KIT mutations were identified. In a real world study of sunitinib in TETs, KIT genotyping was performed in 8 of 28 cases and 3 had a KIT mutation without a clear association with response [41].
The hope is that a novel classification of TETs using genomic information may render more precise therapy selection for patients in the future, as there are known challenges of developing new therapies in a rare disease. In our study, we were able to test candidate therapeutics of interest for the novel TH4 subtype since the IU-TAB-1 cell line clustered into the TH4 subtype. In vitro, there was sensitivity noted for nelfinavir (AKT1 inhibitor) [27], panobinostat (HDAC inhibitor) [28], and bortezomib (proteasome inhibitor) [29], while resistance was noted for everolimus (mTORC1 inhibitor). There were genomic explanations for the therapeutic sensitivities observed in this molecular cluster. These findings may be relevant, as some of the candidate therapeutics tested in vitro in our study are similar to completed and ongoing targeted therapy studies in patients with TETs (e.g., HDAC inhibitor belinostat [42], PI3K inhibitor buparlisib [43]). In addition, given the resistance to everolimus, patients with tumors that cluster into the TH4 subtype, may not benefit from everolimus.
Unfortunately, preclinical models for TETs are limited to a handful of cell lines [17, 43] and clinical trials are limited to single-arm phase II studies. This computational analysis involves data available from tests used routinely in the clinical setting such as targeted next generation sequencing assays, including gene mutations, copy number variations, and chromosomal aberrations. In our study, computational analysis of the TCGA dataset reveals an updated molecular classification of TETs and identifies 6 unique molecular subtypes; importantly, these subtypes are independent of WHO histologic subtypes. Only the IU-TAB-1 cell line underwent clustering analysis and was used for preclinical testing of candidate therapeutics for one of the six identified molecular subtypes from the TCGA. Although the IU-TAB-1 cell line reflects the predominant histotype of type AB thymoma from the TCGA dataset and has been extensively characterized by both whole exome sequencing (WES) and aCGH [17], its inherent limitations include generation from an early stage tumor and representation of a histotype that portends a better prognosis and less metastatic potential [1–4]. Therefore, future work should involve further genomic characterization and clustering analyses of TETs, particularly from metastatic tumors, and generation of diverse TET cell lines to evaluate whether this proof-of-concept approach of preclinical candidate therapeutic testing in molecularly classified cell lines is promising for clinical translation in patients with this rare disease.
Materials and Methods
Computational analysis of TCGA dataset and IU-TAB-1 cell line
Computational analysis [16] was applied to data from WES of 102 evaluable patients with TETs from the publically available TCGA (includes total of 117 patients) [10] and also to data from WES and aCGH of the IU-TAB-1 (type AB thymoma) cell line [17]. Specifically, this included CNVs and genomic mutations/aberrations. A subset of 15 patients with TETs were not evaluable due to an insufficient quantity of genomic aberrations identified below the threshold of the computational analysis. It is possible that data from more comprehensive whole genome sequencing would have made these tumors evaluable.
Each tumor in the TCGA was classified based on the presence or absence of each identified mutation/aberration and CNV (i.e., genomic mutation handle). Overlapping mutations and CNVs were iteratively classified as a molecular subtype based on the cumulative frequency ranked method (Supplemental Methods) [16]. Clusters of overlapping high-frequency mutations/aberrations and CNVs were identified, with clusters of greater than 5 tumors considered to be a significant molecular subtype.
Cell culture and in vitro assays
The IU-TAB-1 cell line was established from a patient with stage II type AB thymoma and characterized as described previously [17]. The cell line had the same passage as in the aforementioned publication. In this study, the IU-TAB-1 cell line was identified to be part of the TH4 cluster. In vitro experiments of candidate therapeutics, chosen based on their mechanism of action and ongoing or completed clinical trials in patients with TETs, were performed on the IU-TAB-1 cell line and included measurements of cell viability [44], proliferation (Ki67), apoptosis [45], and growth (i.e., total cell count) [46]. The known clinical pharmacokinetics of each drug, including the clinically observed concentration range and maximum concentration (Cmax) value, informed the experimental design.
Abbreviations
ABL2: ABL proto-oncogene 2, non-receptor tyrosine kinase; AKT1: AKT serine/threonine kinase 1; ARID1A: AT-rich interaction domain 1A; ARNT: aryl hydrocarbon receptor nuclear translocator; AURKA: aurora kinase A; CCND1: cyclin D1; CDH1: cadherin 1; CDKN2A: cyclin dependent kinase inhibitor 2A; CDKN2B: cyclin dependent kinase inhibitor 2B; CHEK2: checkpoint kinase 2; ERBB2: erb-b2 receptor tyrosine kinase 2; ERBB4: erb-b2 receptor tyrosine kinase 4; FGFR: fibroblast growth factor receptor; FHIT: fragile histidine triad diadenosine triphosphatase; GADD45A: growth arrest and DNA damage inducible alpha; GRB10: growth factor receptor bound protein 10; GTF2I: general transcription factor III; HDAC: histone deacetylase; HDAC6: histone deacetylase 6; HRAS: HRas proto-oncogene, GTPase; IRS1: insulin receptor substrate 1; KIT: KIT proto-oncogene, receptor tyrosine kinase; MAPK1: mitogen-activated protein kinase 1; MCL1: MCL1 apoptosis regulator, BCL2 family member; mTORC1: mammalian target of rapamycin complex 1; MYC: MYC proto-oncogene, bHLH transcription factor; NF2: neurofibromin 2; NRAS: NRAS proto-oncogene, GTPase; PAX5: paired box 5; PDGFB: platelet derived growth factor subunit B; PDGFR: platelet derived growth factor receptor; PDGFRA: platelet derived growth factor receptor alpha; PIK3CA: phosphatidylinositol-4,5-bisphosphate 3-kinase catalytic subunit alpha; PTPRC: protein tyrosine phosphatase receptor type C; RBPJ: recombination signal binding protein for immunoglobulin kappa J region; SPEN: spen family transcriptional repressor; TLN1: talin 1; TP53: tumor protein p53; TXNIP1: thioredoxin interacting protein; VCP: valosin containing protein; VEGFR: vascular endothelial growth factor receptor; XBP1: X-box binding protein 1.
CONFLICTS OF INTEREST
Sukhmani K. Padda: Research Funding: Epicentrx, Bayer, Boehringer Ingelheim; Advisory Boards: Blueprint, Astrazeneca, G1 Therapeutic, Pfizer, Janssen; Yesim Gökmen-Polar: The IU-TAB-1 cell line is licensed to Applied Biological Materials Inc. (abm; Richmond, BC, Canada) by Dr. Gökmen-Polar. Heather A. Wakelee: Research Funding: ACEA Biosciences, Arrys Therapeutics, AstraZeneca/Medimmune, BMS, Celgene, Clovis Oncology, Exelixis, Genentech/Roche, Gilead, Merck, Novartis, Pharmacyclics, Seattle Genetics, Xcovery, Eli Lilly, Pfizer; Advisory Board: AstraZeneca, Xcovery, Janssen, Mirati, Daiichi Sankyo, Helsinn, Blueprint, Merck, Genentech/Roche, Takeda, Cellworks, Merck; Sumanth M. Vasista and Neeraj K. Singh were prior employees of Cellworks Inc. Kabya Basu and Ansu Kumar are employees of Cellworks Inc. Jessica A. Hellyer and Sunil S. Badve declare no conflicts of interest.
FUNDING
This research did not receive any specific grant from funding agencies in the public, commercial, or not-for-profit sectors.
References
1. Marx A, Chan JK, Coindre JM, Detterbeck F, Girard N, Harris NL, Jaffe ES, Kurrer MO, Marom EM, Moreira AL, Mukai K, Orazi A, Ströbel P. The 2015 World Health Organization Classification of Tumors of the Thymus: Continuity and Changes. J Thorac Oncol. 2015; 10:1383–95. https://doi.org/10.1097/JTO.0000000000000654. [PubMed].
2. Detterbeck FC. Clinical value of the WHO classification system of thymoma. Ann Thorac Surg. 2006; 81:2328–34. https://doi.org/10.1016/j.athoracsur.2005.11.067. [PubMed].
3. Moran CA, Weissferdt A, Kalhor N, Solis LM, Behrens C, Wistuba II, Suster S. Thymomas I: a clinicopathologic correlation of 250 cases with emphasis on the World Health Organization schema. Am J Clin Pathol. 2012; 137:444–50. https://doi.org/10.1309/AJCP76KEGWQKWOKA. [PubMed].
4. Weis CA, Yao X, Deng Y, Detterbeck FC, Marino M, Nicholson AG, Huang J, Ströbel P, Antonicelli A, Marx A, and Contributors to the ITMIG Retrospective Database. The impact of thymoma histotype on prognosis in a worldwide database. J Thorac Oncol. 2015; 10:367–72. https://doi.org/10.1097/JTO.0000000000000393. [PubMed].
5. Gökmen-Polar Y, Cook RW, Goswami CP, Wilkinson J, Maetzold D, Stone JF, Oelschlager KM, Vladislav IT, Shirar KL, Kesler KA, Loehrer PJ Sr, Badve S. A gene signature to determine metastatic behavior in thymomas. PLoS One. 2013; 8:e66047. https://doi.org/10.1371/journal.pone.0066047. [PubMed].
6. Badve S, Goswami C, Gökmen-Polar Y, Nelson RP Jr, Henley J, Miller N, Zaheer NA, Sledge GW Jr, Li L, Kesler KA, Loehrer PJ Sr. Molecular analysis of thymoma. PLoS One. 2012; 7:e42669. https://doi.org/10.1371/journal.pone.0042669. [PubMed].
7. Petrini I, Meltzer PS, Kim IK, Lucchi M, Park KS, Fontanini G, Gao J, Zucali PA, Calabrese F, Favaretto A, Rea F, Rodriguez-Canales J, Walker RL, et al. A specific missense mutation in GTF2I occurs at high frequency in thymic epithelial tumors. Nat Genet. 2014; 46:844–49. https://doi.org/10.1038/ng.3016. [PubMed].
8. Saito M, Fujiwara Y, Asao T, Honda T, Shimada Y, Kanai Y, Tsuta K, Kono K, Watanabe S, Ohe Y, Kohno T. The genomic and epigenomic landscape in thymic carcinoma. Carcinogenesis. 2017; 38:1084–91. https://doi.org/10.1093/carcin/bgx094. [PubMed].
9. Wang Y, Thomas A, Lau C, Rajan A, Zhu Y, Killian JK, Petrini I, Pham T, Morrow B, Zhong X, Meltzer PS, Giaccone G. Mutations of epigenetic regulatory genes are common in thymic carcinomas. Sci Rep. 2014; 4:7336. https://doi.org/10.1038/srep07336. [PubMed].
10. Radovich M, Pickering CR, Felau I, Ha G, Zhang H, Jo H, Hoadley KA, Anur P, Zhang J, McLellan M, Bowlby R, Matthew T, Danilova L, et al, and Cancer Genome Atlas Network. The Integrated Genomic Landscape of Thymic Epithelial Tumors. Cancer Cell. 2018; 33:244–258.e10. https://doi.org/10.1016/j.ccell.2018.01.003. [PubMed].
11. Girard N, Lal R, Wakelee H, Riely GJ, Loehrer PJ. Chemotherapy definitions and policies for thymic malignancies. J Thorac Oncol. 2011 (Suppl 3); 6:S1749–55. https://doi.org/10.1097/JTO.0b013e31821ea5f7. [PubMed].
12. Thomas A, Rajan A, Berman A, Tomita Y, Brzezniak C, Lee MJ, Lee S, Ling A, Spittler AJ, Carter CA, Guha U, Wang Y, Szabo E, et al. Sunitinib in patients with chemotherapy-refractory thymoma and thymic carcinoma: an open-label phase 2 trial. Lancet Oncol. 2015; 16:177–86. https://doi.org/10.1016/S1470-2045(14)71181-7. [PubMed].
13. Loehrer PJ Sr, Wang W, Johnson DH, Aisner SC, Ettinger DS, and Eastern Cooperative Oncology Group Phase II Trial. Octreotide alone or with prednisone in patients with advanced thymoma and thymic carcinoma: an Eastern Cooperative Oncology Group Phase II Trial. J Clin Oncol. 2004; 22:293–99. https://doi.org/10.1200/JCO.2004.02.047. [PubMed].
14. Zucali PA, De Pas T, Palmieri G, Favaretto A, Chella A, Tiseo M, Caruso M, Simonelli M, Perrino M, De Vincenzo F, Toffalorio F, Damiano V, Pasello G, et al. Phase II Study of Everolimus in Patients With Thymoma and Thymic Carcinoma Previously Treated With Cisplatin-Based Chemotherapy. J Clin Oncol. 2018; 36:342–49. https://doi.org/10.1200/JCO.2017.74.4078. [PubMed].
15. Hellyer JA, Ouseph MM, Padda SK, Wakelee HA. Everolimus in the treatment of metastatic thymic epithelial tumors. Lung Cancer. 2020; 149:97–102. https://doi.org/10.1016/j.lungcan.2020.09.006. [PubMed].
16. Hou JP, Emad A, Puleo GJ, Ma J, Milenkovic O. A new correlation clustering method for cancer mutation analysis. Bioinformatics. 2016; 32:3717–28. https://doi.org/10.1093/bioinformatics/btw546. [PubMed].
17. Gökmen-Polar Y, Sanders KL, Goswami CP, Cano OD, Zaheer NA, Jain RK, Kesler KA, Nelson RP Jr, Vance GH, Smith D, Li L, Cardoso AA, Badve S, et al. Establishment and characterization of a novel cell line derived from human thymoma AB tumor. Lab Invest. 2012; 92:1564–73. https://doi.org/10.1038/labinvest.2012.115. [PubMed].
18. Hemmings BA, Restuccia DF. PI3K-PKB/Akt pathway. Cold Spring Harb Perspect Biol. 2012; 4:a011189. https://doi.org/10.1101/cshperspect.a011189. [PubMed].
19. Wu J, Yang L, Shan Y, Cai C, Wang S, Zhang H. AURKA promotes cell migration and invasion of head and neck squamous cell carcinoma through regulation of the AURKA/Akt/FAK signaling pathway. Oncol Lett. 2016; 11:1889–94. https://doi.org/10.3892/ol.2016.4110. [PubMed].
20. Ruiz-Saenz A, Dreyer C, Campbell MR, Steri V, Gulizia N, Moasser MM. HER2 Amplification in Tumors Activates PI3K/Akt Signaling Independent of HER3. Cancer Res. 2018; 78:3645–58. https://doi.org/10.1158/0008-5472.CAN-18-0430. [PubMed].
21. Blume-Jensen P, Janknecht R, Hunter T. The kit receptor promotes cell survival via activation of PI 3-kinase and subsequent Akt-mediated phosphorylation of Bad on Ser136. Curr Biol. 1998; 8:779–82. https://doi.org/10.1016/s0960-9822(98)70302-1. [PubMed].
22. Ho AL, Vasudeva SD, Laé M, Saito T, Barbashina V, Antonescu CR, Ladanyi M, Schwartz GK. PDGF receptor alpha is an alternative mediator of rapamycin-induced Akt activation: implications for combination targeted therapy of synovial sarcoma. Cancer Res. 2012; 72:4515–25. https://doi.org/10.1158/0008-5472.CAN-12-1319. [PubMed].
23. Li QL, Gu FM, Wang Z, Jiang JH, Yao LQ, Tan CJ, Huang XY, Ke AW, Dai Z, Fan J, Zhou J. Activation of PI3K/AKT and MAPK pathway through a PDGFRβ-dependent feedback loop is involved in rapamycin resistance in hepatocellular carcinoma. PLoS One. 2012; 7:e33379. https://doi.org/10.1371/journal.pone.0033379. [PubMed].
24. Razmara M, Heldin CH, Lennartsson J. Platelet-derived growth factor-induced Akt phosphorylation requires mTOR/Rictor and phospholipase C-γ1, whereas S6 phosphorylation depends on mTOR/Raptor and phospholipase D. Cell Commun Signal. 2013; 11:3. https://doi.org/10.1186/1478-811X-11-3. [PubMed].
25. Prasad CP, Mirza S, Sharma G, Prashad R, Datta Gupta S, Rath G, Ralhan R. Epigenetic alterations of CDH1 and APC genes: relationship with activation of Wnt/beta-catenin pathway in invasive ductal carcinoma of breast. Life Sci. 2008; 83:318–25. https://doi.org/10.1016/j.lfs.2008.06.019. [PubMed].
26. Weiske J, Albring KF, Huber O. The tumor suppressor Fhit acts as a repressor of beta-catenin transcriptional activity. Proc Natl Acad Sci U S A. 2007; 104:20344–49. https://doi.org/10.1073/pnas.0703664105. [PubMed].
27. Blumenthal GM, Gills JJ, Ballas MS, Bernstein WB, Komiya T, Dechowdhury R, Morrow B, Root H, Chun G, Helsabeck C, Steinberg SM, LoPiccolo J, Kawabata S, et al. A phase I trial of the HIV protease inhibitor nelfinavir in adults with solid tumors. Oncotarget. 2014; 5:8161–72. https://doi.org/10.18632/oncotarget.2415. [PubMed].
28. Yee AJ, Raje NS. Panobinostat and Multiple Myeloma in 2018. Oncologist. 2018; 23:516–17. https://doi.org/10.1634/theoncologist.2017-0644. [PubMed].
29. Cortes J, Thomas D, Koller C, Giles F, Estey E, Faderl S, Garcia-Manero G, McConkey D, Ruiz SL, Guerciolini R, Wright J, Kantarjian H. Phase I study of bortezomib in refractory or relapsed acute leukemias. Clin Cancer Res. 2004; 10:3371–76. https://doi.org/10.1158/1078-0432.CCR-03-0508. [PubMed].
30. Bitler BG, Wu S, Park PH, Hai Y, Aird KM, Wang Y, Zhai Y, Kossenkov AV, Vara-Ailor A, Rauscher FJ III, Zou W, Speicher DW, Huntsman DG, et al. ARID1A-mutated ovarian cancers depend on HDAC6 activity. Nat Cell Biol. 2017; 19:962–73. https://doi.org/10.1038/ncb3582. [PubMed].
31. Fukumoto T, Park PH, Wu S, Fatkhutdinov N, Karakashev S, Nacarelli T, Kossenkov AV, Speicher DW, Jean S, Zhang L, Wang TL, Shih IM, Conejo-Garcia JR, et al. Repurposing Pan-HDAC Inhibitors for ARID1A-Mutated Ovarian Cancer. Cell Rep. 2018; 22:3393–400. https://doi.org/10.1016/j.celrep.2018.03.019. [PubMed].
32. Herbst A, Jurinovic V, Krebs S, Thieme SE, Blum H, Göke B, Kolligs FT. Comprehensive analysis of β-catenin target genes in colorectal carcinoma cell lines with deregulated Wnt/β-catenin signaling. BMC Genomics. 2014; 15:74. https://doi.org/10.1186/1471-2164-15-74. [PubMed].
33. Ding Y, Su S, Tang W, Zhang X, Chen S, Zhu G, Liang J, Wei W, Guo Y, Liu L, Chen YG, Wu W. Enrichment of the β-catenin-TCF complex at the S and G2 phases ensures cell survival and cell cycle progression. J Cell Sci. 2014; 127:4833–45. https://doi.org/10.1242/jcs.146977. [PubMed].
34. Zhou L, Hou J, Fu W, Wang D, Yuan Z, Jiang H. Arsenic trioxide and 2-methoxyestradiol reduce beta-catenin accumulation after proteasome inhibition and enhance the sensitivity of myeloma cells to Bortezomib. Leuk Res. 2008; 32:1674–83. https://doi.org/10.1016/j.leukres.2008.03.039. [PubMed].
35. Wang H, Zang C, Liu XS, Aster JC. The role of Notch receptors in transcriptional regulation. J Cell Physiol. 2015; 230:982–88. https://doi.org/10.1002/jcp.24872. [PubMed].
36. Xu D, Hu J, De Bruyne E, Menu E, Schots R, Vanderkerken K, Van Valckenborgh E. Dll1/Notch activation contributes to bortezomib resistance by upregulating CYP1A1 in multiple myeloma. Biochem Biophys Res Commun. 2012; 428:518–24. https://doi.org/10.1016/j.bbrc.2012.10.071. [PubMed].
37. Zhang H, Bajraszewski N, Wu E, Wang H, Moseman AP, Dabora SL, Griffin JD, Kwiatkowski DJ. PDGFRs are critical for PI3K/Akt activation and negatively regulated by mTOR. J Clin Invest. 2007; 117:730–38. https://doi.org/10.1172/JCI28984. [PubMed].
38. Yan X, Himburg HA, Pohl K, Quarmyne M, Tran E, Zhang Y, Fang T, Kan J, Chao NJ, Zhao L, Doan PL, Chute JP. Deletion of the Imprinted Gene Grb10 Promotes Hematopoietic Stem Cell Self-Renewal and Regeneration. Cell Rep. 2016; 17:1584–94. https://doi.org/10.1016/j.celrep.2016.10.025. [PubMed].
39. Yu Y, Yoon SO, Poulogiannis G, Yang Q, Ma XM, Villén J, Kubica N, Hoffman GR, Cantley LC, Gygi SP, Blenis J. Phosphoproteomic analysis identifies Grb10 as an mTORC1 substrate that negatively regulates insulin signaling. Science. 2011; 332:1322–26. https://doi.org/10.1126/science.1199484. [PubMed].
40. Lee HS, Jang HJ, Shah R, Yoon D, Hamaji M, Wald O, Lee JS, Sugarbaker DJ, Burt BM. Genomic Analysis of Thymic Epithelial Tumors Identifies Novel Subtypes Associated with Distinct Clinical Features. Clin Cancer Res. 2017; 23:4855–64. https://doi.org/10.1158/1078-0432.CCR-17-0066. [PubMed].
41. Remon J, Girard N, Mazieres J, Dansin E, Pichon E, Greillier L, Dubos C, Lindsay CR, Besse B. Sunitinib in patients with advanced thymic malignancies: Cohort from the French RYTHMIC network. Lung Cancer. 2016; 97:99–104. https://doi.org/10.1016/j.lungcan.2016.04.024. [PubMed].
42. Giaccone G, Rajan A, Berman A, Kelly RJ, Szabo E, Lopez-Chavez A, Trepel J, Lee MJ, Cao L, Espinoza-Delgado I, Spittler J, Loehrer PJ Sr. Phase II study of belinostat in patients with recurrent or refractory advanced thymic epithelial tumors. J Clin Oncol. 2011; 29:2052–59. https://doi.org/10.1200/JCO.2010.32.4467. [PubMed].
43. Alberobello AT, Wang Y, Beerkens FJ, Conforti F, McCutcheon JN, Rao G, Raffeld M, Liu J, Rahhal R, Zhang YW, Giaccone G. PI3K as a Potential Therapeutic Target in Thymic Epithelial Tumors. J Thorac Oncol. 2016; 11:1345–56. https://doi.org/10.1016/j.jtho.2016.04.013. [PubMed].
44. Wlodkowic D, Akagi J, Dobrucki J, Errington R, Smith PJ, Takeda K, Darzynkiewicz Z. Kinetic viability assays using DRAQ7 probe. Curr Protoc Cytom. 2013; Chapter 9:Unit 9.41. https://doi.org/10.1002/0471142956.cy0941s65. [PubMed].
45. Carrasco RA, Stamm NB, Patel BK. One-step cellular caspase-3/7 assay. Biotechniques. 2003; 34:1064–67. https://doi.org/10.2144/03345dd02. [PubMed].
46. Seigel GM, Campbell LM. High-throughput microtiter assay for Hoechst 33342 dye uptake. Cytotechnology. 2004; 45:155–60. https://doi.org/10.1007/s10616-004-7256-9. [PubMed].