
Introduction
Human bladder cancer (BCa) is one of the most common cancer types in humans. It is the 6th most common malignancy in men and the 10th most common tumor type worldwide [1, 2]. In 2020, BCa accounted for 4.4% of all male tumors worldwide [2]. BCa is the cause of a high number of mortalities [3] and BCa is related to high health care costs [4]. While there is extensive biomedical research on diagnostic and therapeutic tools for BCa, incidence remains high. Hence, improved diagnostic approaches are required for diagnosing new cases and for therapy monitoring.
For human BCa, the diagnostic gold standard is based on cystoscopy. However, this is invasive, bears a certain health risk, and is related to relatively high costs [5, 6]. Alternatively, cytological evaluation is non-invasive and provides specific information but it seems to fail to detect low-grade BCa sensitively enough [7]. With regard to BCa, RNA markers have been studied by transcriptome analyses of single cells [8], tissue samples [9] and urine [10]. While it does not seem to be realistic that cystoscopy will be fully replaced in the near future, additional independent diagnostic parameters are likely to substantially improve detection of BCa and therapy monitoring [11, 12].
Thus, there is a need for alternative and powerful diagnostic tools. Ideally, these should provide non-invasive access to tumor markers, increased sensitivity and specificity, and primary human samples should be easily available. These requirements are met by most of liquid biopsies, i.e., body-fluids including blood, plasma, serum, urine, and sputum. In case of BCa, urine is thought to be the most promising source for RNA-based tumor markers as direct physical contact between tumor cells and urine seems to be given. Urine as a source of markers is particularly attractive because urine is easily available and the detection of molecular markers is already established or seems to be feasible [13, 14]. This includes systematic and frequent screens of potential patients of BCa or a follow-up of patients after therapy.
While urine contains detectable macromolecular markers, the concentrations are very low when compared to tissue samples or circulating cells in blood [15, 16]. This is particularly true for nucleic acids, i.e., for DNA and RNA [16]. In case of RNA, one usually finds concentrations of total RNA in the nanogram or even the sub-nanogram range per 10 mL of urine [15]. This is supported by indirect evidence suggesting amounts of urine RNA that can only be detected by RT-qPCR [17, 18]. Usually, these concentrations are too low for detection by standard analytical methods and even after preparation, RNA solutions are extremely diluted. Further, the inter-donor variability of urine RNA concentrations can be extremely high ranging over up to four orders of magnitude.
On the other hand, urine RNA samples contain RNAs which are suitable for cDNA synthesis and RT-qPCR detection [16]. Cell-free RNA contained in urine samples can be protected against degradation, i.e., stabilization of RNA markers is possible such that shipping of samples and storage is possible. In technical terms, it might be an advantage to avoid negative effects mediated by large amounts of proteins and lipoproteins on other kinds of biopsies which could interfere during RNA preparation and subsequent steps.
The proof-of-concept of a non-invasive and RNA-based diagnostic of BCa has been described by a number of studies [19, 20]. However, most of them were based on intuitive marker selection [21], or on large but incomplete or biased sets of marker candidates [19, 22]. Initial studies indicated promising RNA marker candidates and provided functional biological insights and interactions of tumor markers [10, 23, 24].
More recent studies describe a search for RNA-based tumor markers by network analyses which indicate marker candidates [22] and by attempting to include the complete RNA sequence content in an unbiased fashion. As a result, larger sets of long-chain non-coding RNA sequences and circular RNA (circRNA) were identified and suggested as marker candidates for BCa [25, 26]. CircRNAs are promising biomarkers in liquid biopsies, as they are highly resistant to RNase activity because the lack of free ends [27, 28]. Furthermore, they often show tissue- and development stage-specific expression [29]. This reflects the increasing role of circRNAs for malignant cell proliferation and, hence, as diagnostic tools [30, 31].
In this study we describe a systematic, whole transcriptome analysis of urine RNA aiming to identify differentially expressed transcripts between healthy individuals and high risk (HR) BCa patients. This consists of SOP-based acquisition of urine, stabilization of urine RNA, delivery and storage of samples, RNA preparation, and deep transcriptome analyses.
Results
Concept underlying this study
The possibility to stabilize urine samples, to ship them to diagnostic laboratories without degradation, and to analyze the composition of cell-free and cell-associated RNA enables one to search for RNA-based markers of tumors, primarily tumors of the urinary tract. In order to bypass the technical problem of very low RNA concentration in urine RNA samples which is not sufficient for standard transcriptome analyses, we decided to pool seven samples of urine RNA (Supplementary Table 1). These samples represent the mean values of a set of markers determined recently in a large set of urine samples, i.e., 47 patients within a control group (C) and 66 samples of the high risk (HR) patient group. Markers include 18S rRNA, Keratin 20 (KRT20), LIM and SH3 protein (LASP1), Oncoprotein 18 (OP18), Uroplakin 1A (UPK1A), and Baculoviral IAP repeat-containing protein 5 (BIRC5) (Table 1).
Table 1: Composition of pools C and HR
| Pool | Patient # | KRT20 | LASP1 | OP18 | UPK1A | BIRC5 | 18S rRNA | Mass in pool [ng] | Proportion in pool [%] | Final pool concentration |
|---|---|---|---|---|---|---|---|---|---|---|
| C | 48 | 1 | 1,751 | 336 | 178 | 56 | 3,320,989 | ~16 | 15.24 | 1 ng/μl |
| 50 | 0 | 91 | 16 | 112 | 3 | 510,671 | ~18 | 17.14 | ||
| 80 | 32 | 1,728 | 23 | 456 | 7 | 1,009,850 | ~16 | 15.24 | ||
| 138 | 92 | 905 | 3 | 628 | 2 | 409,198 | ~13 | 12.38 | ||
| 160 | 3,911 | 3,081 | 2,141 | 5,109 | 151 | 1,184,859 | ~16 | 15.24 | ||
| 166 | 8 | 363 | 27 | 204 | 1 | 193,374 | ~15 | 14.29 | ||
| 170 | 10 | 1,338 | 36 | 79 | 2 | 607,790 | ~11 | 10.48 | ||
| HR | 41 | 7,477 | 4,758 | 2,080 | 28,110 | 446 | 12,610,137 | ~18 | 15 | 2.6 ng/μl |
| 46 | 752 | 606 | 1,850 | 13,291 | 208 | 1,803,240 | ~16 | 13.33 | ||
| 107 | 91 | 3,361 | 10 | 110 | 0 | 1,452,569 | ~18 | 15 | ||
| 128 | 9,966 | 2,388 | 777 | 5,632 | 166 | 2,329,364 | ~19 | 15.83 | ||
| 159 | 1,640 | 3,350 | 325 | 5,385 | 67 | 1,585,600 | ~16 | 13.33 | ||
| 164 | 3,492 | 2,507 | 411 | 3,193 | 33 | 1,538,373 | ~17 | 14.17 | ||
| 183 | 42 | 5,725 | 2,756 | 1,907 | 346 | 2,816,141 | ~16 | 13.33 |
Next, urinary RNA was isolated and quantified in order to produce pools with equal amounts of total RNA (Table 1). Based on the estimated RNA concentrations of single samples, control pool C had a final concentration of 2.25 ng/μl and the RNA pool of high risk patients had a final concentration of 5 ng/μl. The exact final RNA concentrations and RNA quality of the generated pools was determined by an Agilent 2100 Bioanalyzer and Agilent RNA 6000 Pico Kit (Supplementary Figure 1). The electropherograms of pooled RNA samples indicated an appropriate length distribution of RNA. The concentrations were 1 ng/μl for group C pool and 2, 6 ng/μl for group HR. Both pools were used to produce four cDNA libraries with an RNA input of 10 ng. Different adapters with unique barcodes were added to individual libraries to enable multiplex sequencing. In order to obtain similar numbers of reads after sequencing, equal amounts of libraries were used to compose the final pool used for whole transcriptome analysis (Supplementary Table 2).
Next generation sequencing resulted in 255, 474, 790 reads for the final pool, which represents the depth of the collected transcriptome data. The quality of reads was analyzed using the software FastQC and was passed by all sequencing files, so that no additional corrections like trimming were necessary.
Comparison of previously analyzed biomarkers in RT-qPCR and RNA-Seq
First, we tested whether the pooled samples of groups C and HR showed characteristics similar to recent findings for a limited set of potential tumor markers in single samples. To this end, we compared expression levels of the markers depicted in Table 1 and in Figure 1 that had been determined individually by RT-qPCR with the results of RNA-Seq measurements of urine pools (Figure 1). For the markers KRT20, LASP1, OP18 and UPK1A, the lg(fold change) (lg(fc)) values determined by either methodology were compatible. Only for BIRC5 we detected a discrepancy of differential gene expression of pools C and HR compared to the results of single samples for each group (Figure 1). In summary, we conclude that RNA-Seq essentially confirmed the marker measurements of single urine samples from control donors and high risk patients. Thus, we conclude that the transcriptome analysis of urine RNA with regard to the set of tumor marker candidates listed in Table 1 is valid and seems to be suitable for more detailed studies.
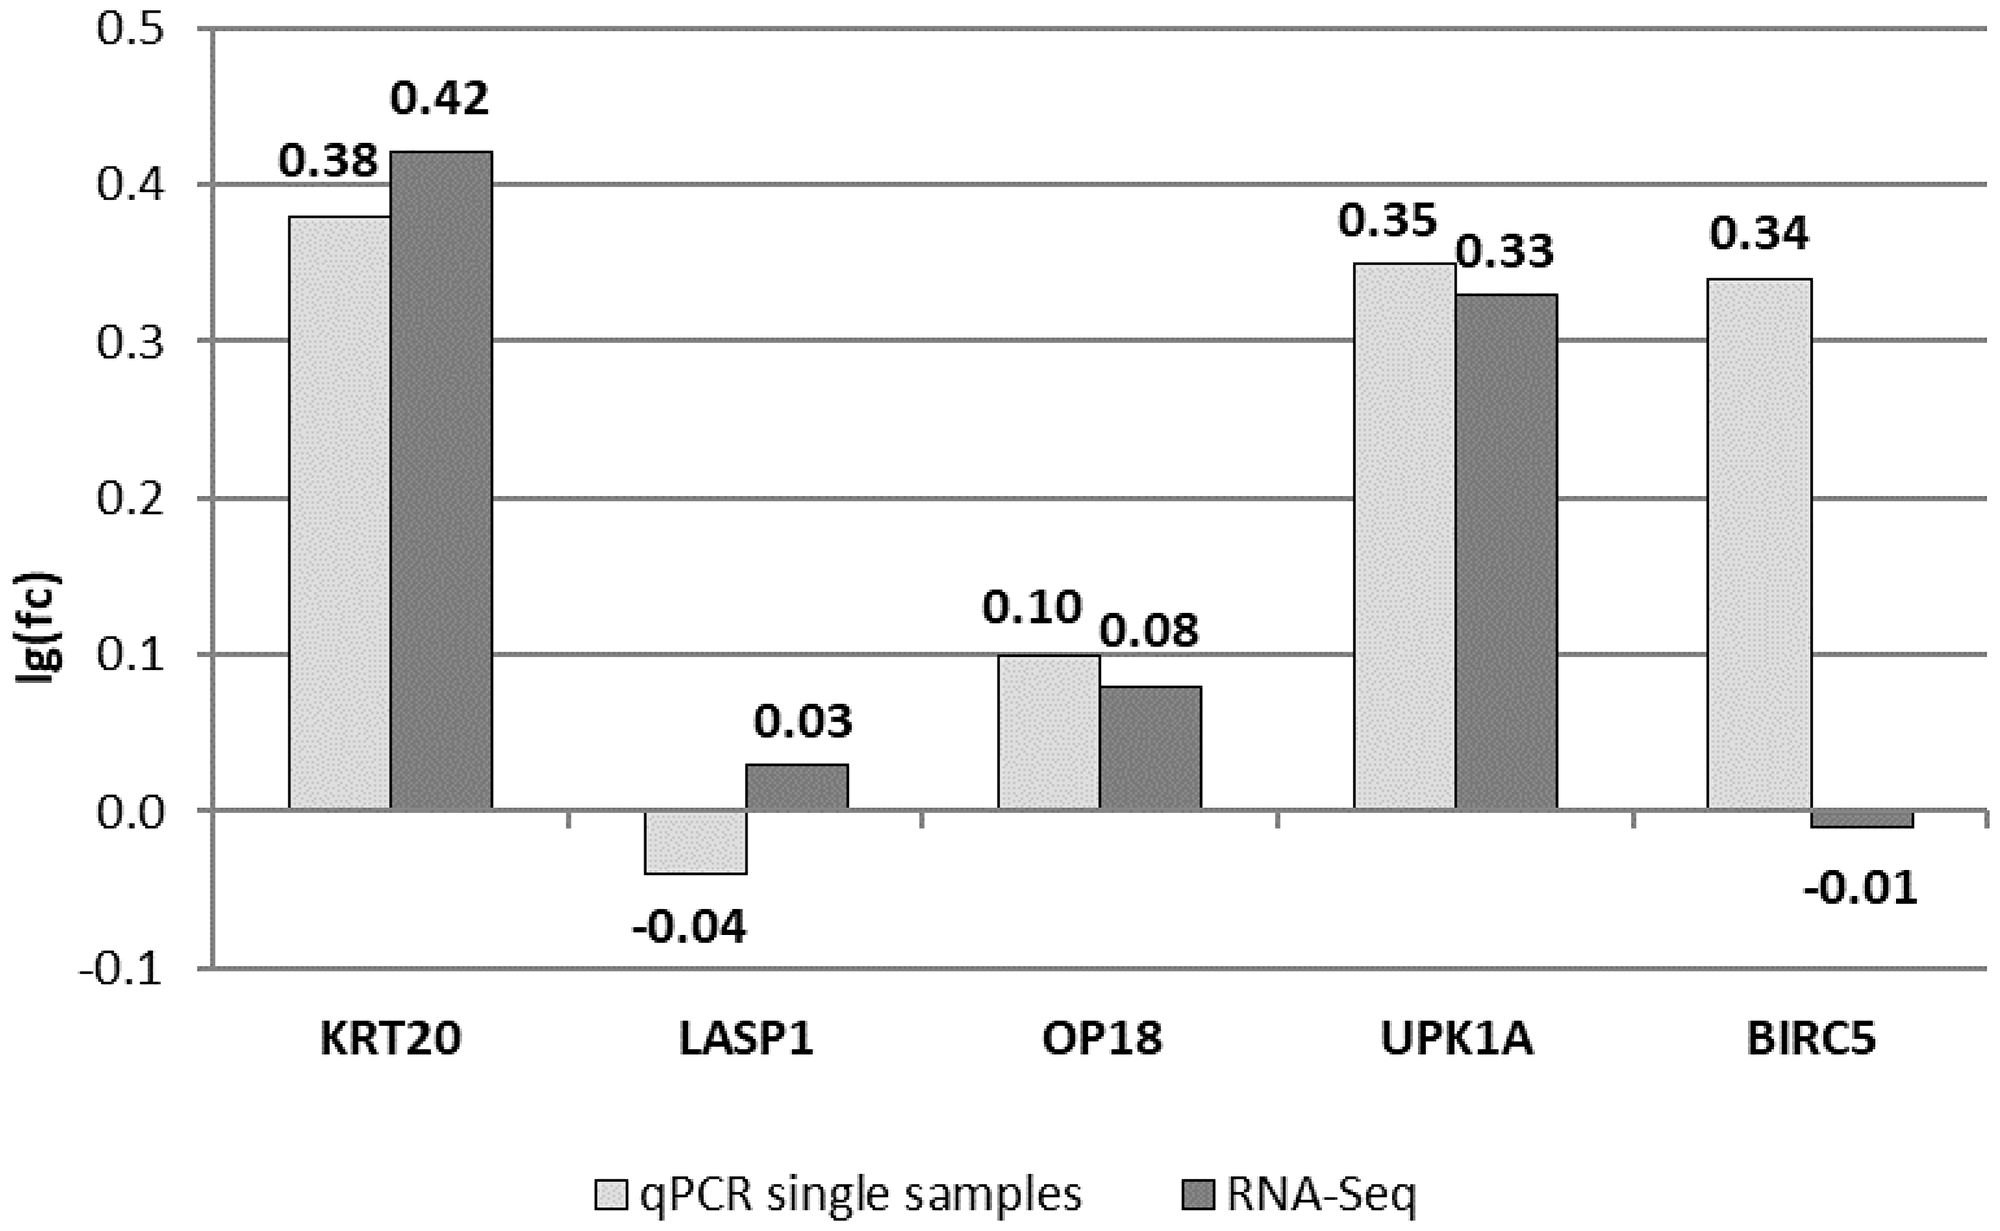
Figure 1: Comparing RT-qPCR results of single urine samples used for pools with RNA-Seq results. Shown are lg(fc) values between HR and C pools for five potential biomarkers, which were previously analyzed via RT-qPCR. All data are normalized to the expression of the 18S rRNA gene.
Criteria for the selection of new potential biomarkers
In a first step, urine RNAs data identified by whole transcriptome analyses was ranked according to lg(fc) values comparing C and HR patient groups. Regarding the results of previously analyzed potential tumor markers (Figure 1), the threshold for new marker candidates was set to lg(fc) > 0.5 for transcripts with a higher expression or lg(fc) < -0.5 for transcripts with a lower expression of transcripts in high risk patients compared to healthy subjects. As the aim of this study was to find potential biomarkers with an improved sensitivity and specificity, all transcripts not fulfilling these criteria were excluded. For the search of more potent new marker candidates, we also included individual transcripts per kilobase million (TPM) values of group C and HR which should ideally not be smaller than 10 TPM for at least one value. Next, we looked at transcript support levels (TSL) provided by Ensembl, which give a hint on the real existence of bioinformatically predicted transcripts. Further, we considered potential or known biological information about the listed RNA species.
A more complex level of criteria is related to the predicted or known splicing pattern within a gene locus and to the exon/intron structure of individual transcripts. The more data we found on these characteristics, the more weight we put on selected transcripts. Finally, we set a length filter for selected transcripts of a minimal length of 150 nts. This was based on the requirement to be able to design appropriate amplicons for qPCR-based detection of selected RNA species.
Classification of up- and down-regulated RNAs in pooled samples of the control and the high risk group
In the following, we describe classes of chosen RNA species of the control group and of the HR group according to the defined criteria. The defined categories include coding sequences (Supplementary Table 3A and 3B), non-coding transcripts (ncRNA) (Supplementary Table 3C and 3D), and circular RNAs (circRNA) (Supplementary Table 3E and 3F). We considered up-regulated transcripts as well as down-regulated transcripts between controls and HR samples for two reasons. First, a marker ratio of either one member of both groups has a higher chance to discriminate between both groups and, secondly, because a ratio of two makers is independent of absolute copy numbers. In the light of almost unmeasurable RNA concentrations in urine samples, this provides robustness to the detection of RNA markers.
For downregulated noncoding transcripts (Supplementary Table 3D), we were not able to identify RNAs matching the described criteria. Nevertheless, we showed the best marker candidates for this category. Furthermore, for circular transcripts (Supplementary Table 3E and 3F) we note that algorithms used in this study are not specifically for the identification of circRNA. In addition, no RNase R treatment of urine RNA was performed to ensure the detection of only circular RNA species. However, we include circRNA candidates in the lists shown in this study, because this class could contain RNA species with novel characteristics including their diagnostic value.
Development of amplicons for RT-qPCR-based detection of potential tumor markers
RNA species for diagnostic purposes require robust and quantitative determination in urine samples. This can be achieved by reverse transcription of urine RNA followed by qPCR-based methodology. Thus, we developed and thoroughly characterised marker-specific pairs of PCR primers for PCR reactions for selected and promising markers described in this study. Because of very limited RNA amounts in human urine and the lack of sufficient patient material, we performed initial studies in the use of a cell culture model system which we recently described [32]. In this dual model, the human control group C is represented by RT-4 cells which were established from a G1 stage urinary bladder carcinoma [33]. The human HR group and more progressed tumors are reflected by ECV-304 cells which had been derived from a G3 bladder carcinoma [34, 35].
A thorough analysis of transcripts that may serve as tumor marker candidates indicates that the design of amplicons for the PCR-based measurement has to consider the complex potential composition of transcripts expressed from a specific locus as well as the differential expression levels (lg(fc)) and the TSL values. Instructive examples are shown for C-X-C motif chemokine ligand 8 (CXCL8)-, ribosomal protein S27 (RPS27)- and ribosomal protein L23a (RPL23A)-specific RNAs (Table 2).
Table 2: Transcripts of (A) CXCL8, (B) RPS27 and (C) RPL23A
| (A) CXCL8 (C-X-C motif chemokine ligand 8) | |||||||
| Transcript ID | Name | length [kb] | HR [TPM] | C [TPM] | log(HR/C) | TSL | Biotype |
| ENST00000307407 | CXCL8-201 | 1.705 | 618.357 | 148.984 | 0.618 | 1 | Ri |
| ENST00000401931 | CXCL8-202 | 0.700 | 365.908 | 86.693 | 0.625 | 1 | Pc |
| ENST00000483500 | CXCL8-203 | 0.599 | 162.685 | 45.813 | 0.550 | 2 | Pc |
| ∑ | - | - | 382.32 | 93.83 | 0.61 | - | - |
| (B) RPS27 (ribosomal protein S27) | |||||||
| Transcript ID | Name | length [kb] | HR [TPM] | C [TPM] | log(HR/C) | TSL | Biotype |
| ENST00000368567 | RPS27-201 | 0.359 | 779.327 | 258.917 | 0.479 | 1 | Pc |
| ENST00000493224 | RPS27-203 | 0.573 | 44.177 | 14.822 | 0.474 | 2 | Ri |
| ENST00000477151 | RPS27-202 | 0.496 | 50.634 | 18.841 | 0.429 | 2 | Ri |
| (C) RPL23A (ribosomal protein L23a) | |||||||
| Transcript ID | Name | length [kb] | HR [TPM] | C [TPM] | log(HR/C) | TSL | Biotype |
| ENST00000422514 | RPL23A-204 | 0.970 | 127.601 | 38.520 | 0.520 | 1 | Pc |
| ENST00000496182 | RPL23A-206 | 0.636 | 35.841 | 11.507 | 0.493 | 3 | Pc |
| ENST00000355731 | RPL23A-201 | 0.587 | 36.773 | 11.417 | 0.508 | 5 | Pc |
| ENST00000394935 | RPL23A-202 | 0.580 | 36.805 | 10.828 | 0.531 | 5 | Pc |
| ENST00000472628 | RPL23A-205 | 0.639 | 37.069 | 13.994 | 0.423 | 1 | Pc |
| ENST00000582736 | RPL23A-209 | 0.595 | 151.180 | 49.356 | 0.486 | 1 | Ri |
| ENST00000394938 | RPL23A-203 | 0.688 | 30.541 | 10.953 | 0.445 | 2 | Pc |
| ENST00000578181 | RPL23A-207 | 0.593 | 33.195 | 11.832 | 0.448 | 2 | Pc |
| ENST00000580755 | RPL23A-208 | 0.412 | 13.270 | 9.550 | 0.143 | 2 | Ri |
| ∑ | - | - | 82.19 | 24.97 | 0.52 | - | - |
A list of RNA marker loci and major characteristics of transcripts is shown in Table 2. For all three identified CXCL8-specific splice variants we determined promising TSL and TPM values, which should give rise to a final lg(fc) value of 0.61 for all CXCL8 RNA species (Table 2A). For RPS27 (Table 2B), the primer pair with an unequivocal and strong PCR signal in cell lines was targeting only the most promising transcript RPS27-201 with an lg(fc) value of 0.48, a TSL value of 1 and the highest TPM levels. In contrast, the splicing pattern for RPL23A (Table 2C) was more complex. We found a large set of RNA species with different TSL values for this gene locus. The finally selected amplicons recognise only the two transcripts RPL23A-204 and RPL23A-201. Regardless of the existence of the splice variant RPL23A-202 with a TSL value of 5 the calculated lg(fc) value for both transcripts is 0.52.
It should be noted that the filters we used to identify promising marker sequences seems to be very stringent. For example, for the most promising candidate Glycin-N-Acetyltransferase (GLYATL1)-206 with a lg(fc) value of 1.624 (Supplementary Table 3A) we could not detect a PCR signal in the use of either amplicon and the two urinary bladder cancer cell lines. Similarly, the most promising splicing variant of the potential tumor marker with the lowest log(fc) value in the high risk group, i.e., Zinc finger protein 382 (ZNF382)-208 (Supplementary Table 3B) was excluded, as was Ryanodine receptor 3 (RYR3)-227, which was not detectable in ECV-304 cells nor in RT-4 cells. We cannot tell whether this is due to low TSL values of 4 for ZNF382-208 and 5 for RYR3-227. These examples demonstrate the complexity of developing a specific and sensitive PCR amplicon for a potential marker transcript with regard to the composition of transcripts expressed from a specific locus, the differential expression levels, and the TSL values.
Amplicons for the detection of linear and circular S100A6-specific transcripts and for TRAM1-specific transcripts
Both hits, the potential biomarkers S100 Calcium Binding Protein 6 (S100A6) and translocation associated membrane protein 1 (TRAM1) show an impressive correlation of linear and circular transcripts of these gene loci with the health status of donors (Table 3). While most of linear TRAM1-specific RNA species show a minor under-expression in urine pooled RNA of HR patients, all circular TRAM1 transcripts indicate a clear and high reduction of gene expression in the HR group compared to the control group (Table 3A). Hence, divergent primers for the detection of only circular transcripts were developed to target all circular TRAM1 splicing variants resulting in a promising lg(fc) value of –1.26. Convergent primer pairs for the amplification of linear sequence segments were designed to match with linear TRAM1 RNA species with negative lg(fc) values. It is noteworthy that TRAM1-203 with the lowest lg(fc) value of –1.09 is related to a TSL of 5. Thus, the existence of this variant is uncertain. In summary, transcripts of the TRAM1 gene locus represent the most promising candidates for potent tumor markers with decreased gene expression in high risk patients. For a robust discrimination between healthy individuals and patients with bladder cancer, it would be beneficial to find marker candidates with inverse changes of gene expression, as explained above.
Table 3: Linear and circular transcripts of TRAM1 and S100A6
| (A) TRAM1 (translocation associated membrane protein 1) | |||||
| Transcript ID | Name | length [kb] | HR [TPM] | C [TPM] | log(HR/C) |
| hsa_circ_0084758 | TRAM1 | 0.176 | 0.66 | 41.33 | –1.80 |
| hsa_circ_0084756 | TRAM1 | 0.383 | 0.81 | 21.56 | –1.43 |
| hsa_circ_0084757 | TRAM1 | 0.447 | 0.98 | 18.51 | –1.28 |
| hsa_circ_0084759 | TRAM1 | 0.422 | 3.08 | 20.04 | –0.81 |
| ∑ | - | - | 1.38 | 25.36 | –1.26 |
| Transcript ID | Name | length [kb] | HR [TPM] | C [TPM] | log(HR/C) | TSL | Biotype |
| ENST00000520700 | TRAM1-203 | 0.542 | 1.630 | 20.115 | –1.091 | 5 | Pt |
| ENST00000521425 | TRAM1-205 | 3.394 | 5.126 | 8.141 | –0.201 | 2 | Pc |
| ENST00000262213 | TRAM1-201 | 2.785 | 6.077 | 8.431 | –0.142 | 1 | Pc |
| ENST00000521049 | TRAM1-204 | 0.872 | 3.700 | 2.805 | 0.120 | 5 | Pt |
| ENST00000518678 | TRAM1-202 | 0.535 | 4.339 | 3.043 | 0.154 | 4 | Pc |
| ∑ | - | - | 4.28 | 12.23 | –0.46 | - | - |
| (B) S100A6 (S100 Calcium Binding Protein 6) | |||||
| Transcript ID | Name | length [kb] | HR [TPM] | C [TPM] | log(HR/C) |
| hsa_circ_0014225 | S100A6 | 0.390 | 391.17 | 102.25 | 0.58 |
| hsa_circ_0014226 | S100A6 | 0.683 | 314.28 | 87.06 | 0.56 |
| hsa_circ_0014224 | S100A6 | 0.231 | 105.43 | 29.96 | 0.55 |
| hsa_circ_0014227 | S100A6 | 0.452 | 21.51 | 7.32 | 0.47 |
| ∑ | - | - | 352.73 | 94.66 | 0.57 |
| Transcript ID | Name | length [kb] | HR [TPM] | C [TPM] | log(HR/C) | TSL | Biotype |
| ENST00000496817 | S100A6-205 | 0.673 | 79.051 | 19.216 | 0.614 | 2 | Pc |
| ENST00000462951 | S100A6-204 | 0.311 | 10.455 | 4.698 | 0.347 | 1 | Ri |
| ENST00000368720 | S100A6-202 | 0.673 | 70.632 | 17.232 | 0.613 | 3 | Pc |
| ENST00000368719 | S100A6-201 | 0.665 | 120.508 | 28.035 | 0.633 | 1 | Pc |
| ENST00000462776 | S100A6-203 | 0.479 | 13.011 | 4.239 | 0.487 | 2 | Pc |
| ∑ | - | - | 90.06 | 21.49 | 0.62 | - | - |
This fits well with the second potential biomarker S100A6 with a correlation of increased linear and circular transcripts in urine pools of patients with high risk BCa (Table 3B). In contrast to the TRAM1 system, the design of divergent primers targeting all circRNAs of S100A6 was not possible. Thus, primer pairs were developed to detect only the two RNA species indicating the highest lg(fc) values. For linear S100A6 transcripts the two splicing variants with the lowest differential gene expression could be excluded. This approach would lead to theoretically calculated log(fc) values of approximately 0.6 for the PCR amplicons of both RNA classes. This suggests S100A6 transcripts as another promising candidate for tumor markers overexpressed in the HR group.
Analysis of differential gene expression of potential tumor markers in urinary bladder carcinoma cell lines
Finally, we studied differential gene expression of selected tumor markers in the dual cell culture model system. Differences in gene expression of RT-4 and ECV-304 cells could give a first hint on potential RNA markers in urine of BCa patients. Therefore, we validated the PCR amplicons developed in this study in both cell lines and compared calculated lg(fc) values with the data of transcripts in urine samples of patients (Table 4).
Table 4: Differences in gene expression of selected markers in ECV-304 and RT-4 cells compared to the results of urine pools C and HR of RNA-Seq
| Transcript | HR [TPM] | C [TPM] | lg(HR/C) | ECV-304 | RT-4 | lg(ECV-304/ RT-4) |
|---|---|---|---|---|---|---|
| CXCL8 | 382.32 | 93.83 | 0.61 | 111.86 | 181.13 | -0.21 |
| RPS27 | 395.04 | 133.20 | 0.47 | 149.51 | 81.14 | 0.27 |
| RPL23A | 82.19 | 24.97 | 0.52 | 327.93 | 383.14 | -0.07 |
| TRAM1 | 4.28 | 12.23 | -0.46 | 35.83 | 143.36 | -0.60 |
| S100A6 | 90.06 | 21.49 | 0.62 | 1027.96 | 281.88 | 0.56 |
For marker candidates CXCL8 and RPL23A, lg(fc) values are not compatible between the cell culture models versus patient samples. Conversely, for transcripts of RPS27, TRAM1, and S100A6 these values are consistent between pooled urine RNA samples of control and HR patients and RT-4 and ECV-304 cells, respectively. TRAM1 transcripts show decreased expression in urine of high risk BCa patients and in ECV-304 cells which represent the G3 cancer stage. As a potential biomarker with a higher expression in G3 cells and in HR urine pool, we identified S100A6 transcripts. These RNAs exhibit a clear differential gene expression and, thus, they were selected for calculation of RNA ratios (Table 5).
Table 5: RNA ratio of TRAM1 and S100A6 transcripts in ECV-304 and RT-4 cells compared to the results of urine pools C and HR of RNA-Seq
| RNA ratio of S100A6/ TRAM1 transcripts | |||||
|---|---|---|---|---|---|
| ECV-304 | RT-4 | lg(ECV-304/ RT-4) | HR | C | lg(HR/C) |
| 28.69 | 1.97 | 1.16 | 21.04 | 1.76 | 1.08 |
The ratio of S100A6/TRAM1 transcript signals showed a high consistency between cell culture cells and transcriptome analyses of urine pools of human donors. Based on these findings a discrimination of healthy individuals and HR patients seems to be feasible by a factor of 10. Hence, the S100A6/TRAM1 ratio seems to be a significant and highly promising marker for the non-invasive diagnosis of bladder cancer based on urine RNA. With regard to this finding, it might be even more promising to study circular forms of S100A6-specific- and TRAM1-specific transcripts.
DISCUSSION
Whole transcriptome analysis of urine RNA from as little as a few milliliter urine is feasible. This study describes a significant extension of the concept of non-invasive diagnosis of bladder cancer in the use of RNA markers. This molecular concept is attractive for early tumor diagnosis because in case of aberrant gene expression which is linked with malignant cell growth, RNA is the first gene product to be detected even before gene products or their metabolic effects are detectable. It is noteworthy that the technology is robust and reliable. This includes the collection of urine samples at small volumes, the stabilization of RNA, shipping, storage, and the quantitative detection of RNA transcripts via RT-qPCR. All steps are based on established standard operation procedures [21, 32, 36]. While the proof-of-concept has been reported manifold in the past including potential bladder cancer-specific tumor markers [19, 37, 38], it remains open, what kind of gold standard in this methodological category will be identified and whether RNA markers can support or substitute the current gold standard, i.e. cystoscopy.
With regard to these considerations, we performed a systematic search for RNA-based markers by a whole transcriptome approach. The underlying rational is shown schematically in Figure 2. Briefly, we considered transcriptome data with defined threshold for differential transcript abundances, characteristics recorded by database, and known or suspected biological roles of potential hits. The number of RNA sequences and gene loci, respectively seems to be large enough in order to be able to identify transcripts that differ substantially between the healthy state and bladder cancer patients. Subsequent to the detailed analyses described here, this study suggests considering RNA-based tumor markers for this cancer type. It also suggests investigating in more detail and depth rationally identified marker candidates.
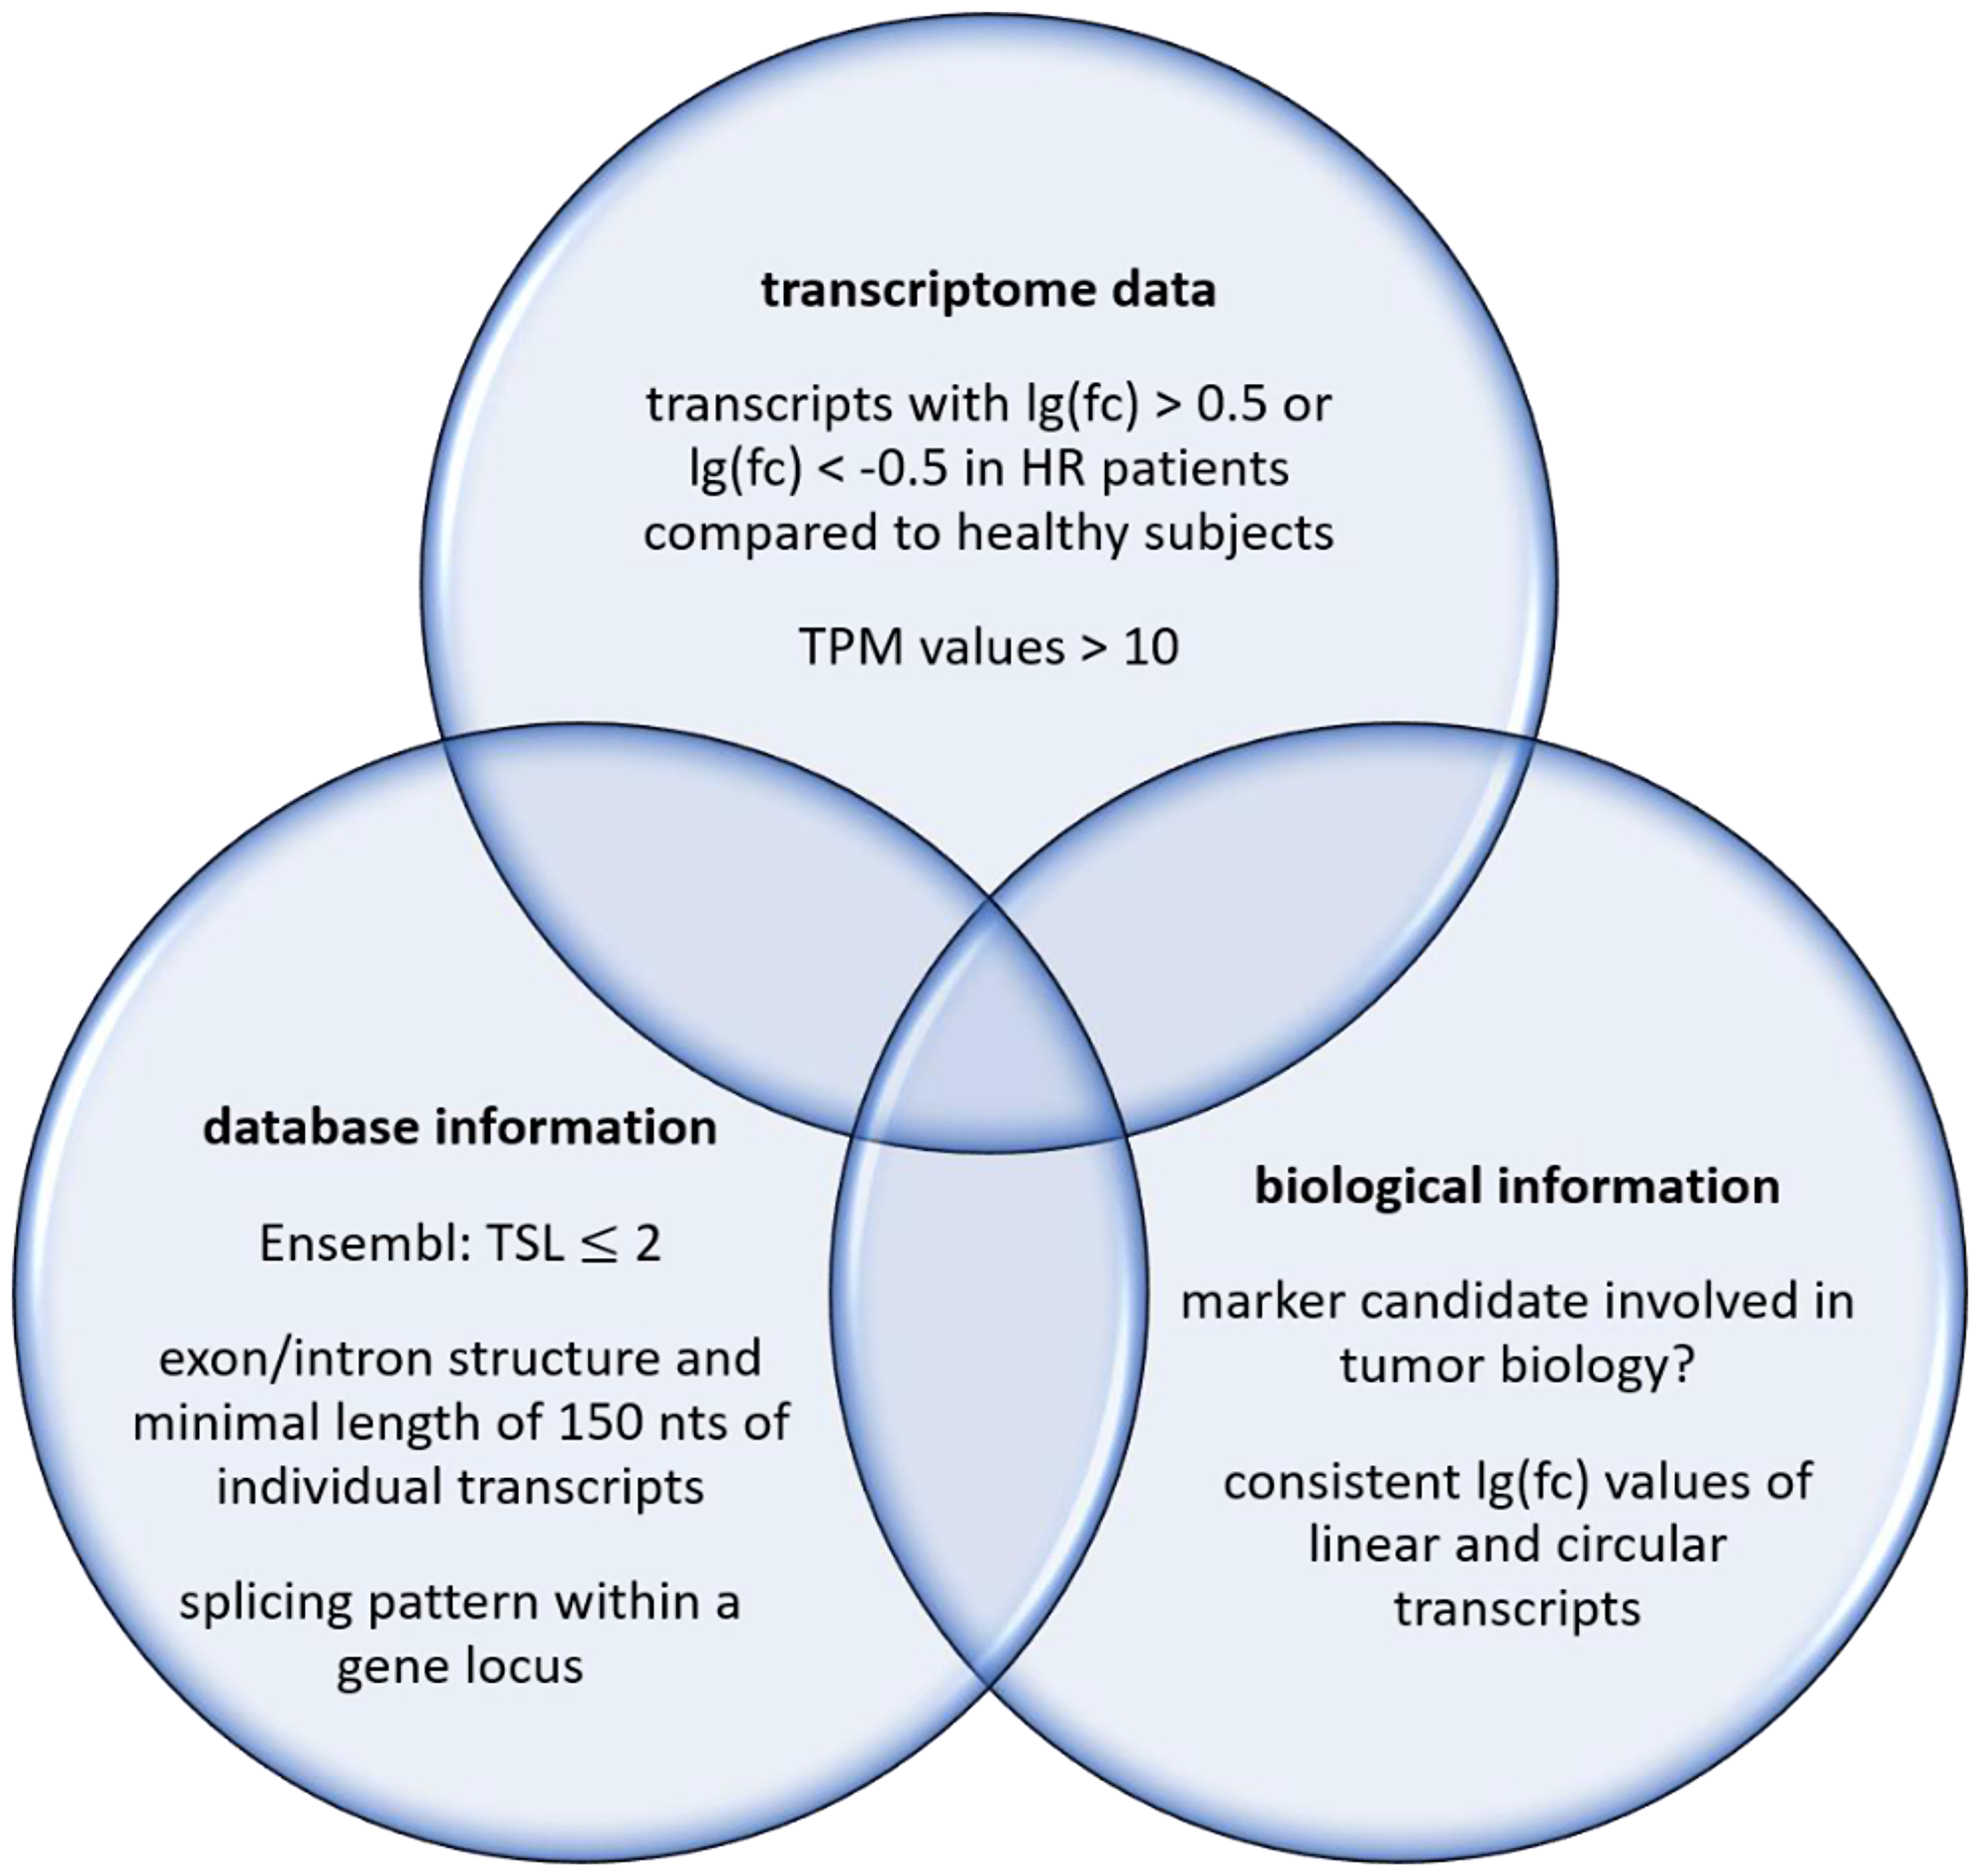
Figure 2: Filters for a systematic search of RNA-based markers.
Here we look at RNA expression data derived from different methodological approaches. Hence, it is a central issue of this study to study whether there is compatibility of marker candidates derived from deep sequencing of pools of patient samples versus individual RT-qPCR-based data of individual marker candidates (Figure 1). This finding depicted in Figure 1 suggests to analyze deep transcriptome data in more detail in order to identify substantially improved RNA markers for bladder cancer. This procedure opens a systematic and rational approach for marker identification which is independent of prior knowledge in the area of tumor biology and, thus, it is almost completely unbiased.
One of the most remarkable findings of this study is related to the ratio of S100A6/TRAM1. This ratio seems to represent an improved potential marker for human bladder cancer (Table 5) and it is also found in the dual cell culture model consisting of RT-4 cells and ECV-304 cells. Taken together, these observations provide a coherent picture of the disease-related changes of gene expression of S100A6 and TRAM1 suggesting to analyze this ratio in a large diagnostic study. However, a larger number of marker candidates was also described in this work (Tables 2 and 3) and these lists can be extended by a ranked list of more transcripts.
While all of these hits focus on conventional linear transcripts we also noted experimental evidence supporting the existence of circular RNAs that seem to be able to monitor differences between the healthy state and the cancer state. This is reflected by a number of recent studies describing a link between circular RNA and cancer [30, 31]. However, such evidence derived from in silico analyses does not necessarily proof that such circRNAs exist in reality. A set of experimental evidence is necessary to enough strongly verify their existence. Methods include PCR-based approaches that can detect backsplicing sites, sequencing of cloned backsplicing sites, and independent orthogonal tests such as RNaseH-based cleavage analyses. However, such assays go beyond the scope of this study although this is one promising way to proceed in order to identify new and potent RNA markers.
Materials and Methods
Clinical samples
This study was approved by the local ethical committee of the Universität zu Lübeck. All urine samples were obtained with written consent of the participants. All bladder cancer patients were classified according to the World Health Organization 2004 grading and risk system. For the investigation of urinary RNA, spontaneously voided urine of donors (healthy individuals, n = 47; high risk (HR) patients, n = 66) was collected and stabilized immediately with one volume of a lysis buffer (6 mol/l guanidinium isothiocyanate, 0.05 mol/l sodium acetate, and 0.5% N-lauroylsarcosine) as described recently [36]. Stabilized urine samples were frozen in liquid nitrogen and stored at –80°C until RNA preparation. For details of urine sampling see Supplementary Table 1.
Isolation of RNA from urine samples
To isolate RNA from human urine samples, the RNeasy Midi Kit (QIAGEN, Hilden, Germany) was used with minor modifications. Briefly, stabilized urine samples were thawed slowly and adjusted to pH 7.0 by adding 1 M HEPES buffer. Instead of using RLT buffer, recommended volumes of 70% ethanol and mercaptoethanol were added directly to the samples. Subsequent steps were performed following the manufacturer’s instructions. RNA samples were eluted in 320 μl of RNase-free water, lyophylized, and resuspended in 16 μl of RNase-free water. Samples were stored at –80°C.
RNA quantification and quality assessment
RNA samples were quantified using a NanoDrop ND-1000 spectrophotometer (Thermo Fisher Scientific, Waltham, MA, USA). To measure concentration and integrity of pooled urinary RNA, the Agilent 2100 Bioanalyzer was used in combination with the Agilent RNA 6000 Pico Kit (Agilent Technologies, Santa Clara, CA, USA) and the manufacturer’s instructions were followed.
Synthesis, purification and quantification of double-stranded cDNA libraries
For sequencing on Illumina platforms, cDNA libraries were synthesized using the SMARTer Stranded Total RNA-Seq Kit – Pico Input Mammalian (TaKaRa Bio Inc., Kusatsu, prefecture Shiga, Japan). Briefly, 10 ng of total RNA was fragmented according to manufacturer’s instructions and used for first-strand synthesis followed by addition of Illumina adapters. Ribosomal cDNA was depleted and the final double-stranded cDNA library was amplified via PCR according to manufacturer’s instructions. Before depletion of ribosomal cDNA and after PCR amplification, the double-stranded cDNA libraries were purified using the Agencourt AMPure XP PCR purification system (Beckman Coulter, Brea, CA, USA). The first purification step was performed according to the manufacturer´s instructions. The second purification step contained minor modifications. Briefly, the amount of beads was increased to 100 μl volume and the cDNA was eluted in 20 μl elution buffer. To quantify the double-stranded cDNA libraries, the Qubit dsDNA HS Assay Kit and the Qubit Fluorometer (Thermo Fisher Scientific, Waltham, MA, USA) were used.
RNA sequencing
Previously synthesized double-stranded cDNA libraries were sequenced by GATC Biotech AG (GATC Biotech AG, Konstanz, Germany). The Illumina platform was used with a paired-end (PE) mode and a read length of 125 nucleotides.
Data quality control
To check the quality of reads provided by GATC Biotech AG, the software FastQC (https://www.bioinformatics.babraham.ac.uk/projects/fastqc/) by Simon Andrews at Babraham Bioinformatics was used.
Data analysis
Codes for data analysis were written in the UNIX command line. Briefly, three different reference data sets were downloaded: the cDNA and ncRNA databases provided by Ensembl [39] and the circRNA database provided by circBase [40]. Databases were indexed to accelerate the mapping process and read mapping was performed using the bwa software [41]. Resulting mapped reads were recorded and normalized to TPMs (transcripts per million) to eliminate biases introduced by transcript length and sequencing depth [42]. For analysis of differential gene expression of marker candidates, lg(fold change) values of expression levels were calculated and compared for pooled samples of C and HR patient group.
cDNA synthesis
Reverse transcription was performed using the SuperScript III First-Strand Synthesis Kit (Thermo Fisher Scientific, Waltham, MA, USA) in a total volume of 20 μl containing RNA extract and 300 ng of random hexamer primer (Invitrogen, Paisley, UK). Manufacturer’s instructions were followed using the 16 μl of resuspended urinary RNA with an RNA input of 7.5 μl for the RT sample and 7.5 μl for the non-RT control sample. It should be noted that RNA concentrations in urine are extremely low and Nanodrop-based measurements of UV absorption cannot be used. However, the length distribution of urine RNA seems to be suitable [16] and RT-qPCR-based detection is possible. Therefore, urinary RT and non-RT samples were diluted 1:16 and 1:160 for detection of marker candidates and 18S rRNA in qPCR, respectively.
For cDNA synthesis of cellular RNA, RevertAid First Strand cDNA Synthesis Kit (Thermo Fisher Scientific, Waltham, MA, USA) was used and manufacturer’s instructions were followed with 2 μg RNA input of bladder cancer cell lines. For all non-RT control reactions, nuclease-free water was added instead of solutions of RNaseOut or RiboLock RNase Inhibitor and reverse transcriptase.
Quantitative PCR (qPCR)
qPCR was performed using SYBR green and TaqMan Systems in the 384-well plate format. Primer concentrations was 200 nM and concentrations of TaqMan probes was 250 nM for a 10 μl total reaction volume with 4 μl template of RT or non-RT sample and 5 μl of SYBR green or TaqMan Master Mix. SYBR green reactions were performed with a SYBR Select Master Mix (Thermo Fisher Scientific, Waltham, MA, USA.). The thermal cycler 7900HT (Applied Biosystems, Foster City, CA, USA) conditions were 50°C for 120 seconds, 95°C for 120 seconds, and 40 cycles consisting of 95°C for 15 seconds, and 60°C for 60 seconds. Melting curve analysis was performed. For the TaqMan system, TaqMan Universal Master Mix II (Applied Biosystems, Foster City, CA, USA) was used with thermocycler conditions of 50°C for 120 seconds, 95°C for 600 seconds, and 40 cycles consisting of 95°C for 15 seconds and 60°C for 60 seconds. Samples were measured in quadruplicates and negative controls without reverse transcriptase and RNaseOut or without template were included. Data analysis was performed via the SDS 2.1 software (Applied Biosystems, Foster City, CA, USA). The RNA level of bladder cancer cell lines was normalized to the levels of endogenous 18S ribosomal RNA which served as an internal control. Markers of urinary RNA were quantified and normalized according to serial 10-fold dilutions of plasmid standards.
Design of primer pairs and TaqMan probes
Primer pairs and TaqMan probes are shown in Supplementary Table 4. Convergent primer pairs for detection of linear sequences of transcripts were designed using NCBI Primer-BLAST (https://www.ncbi.nlm.nih.gov/tools/primer-blast/) with a melting temperature of 57–63°C (optimum 60°C, maximal Tm difference 3°C). The PCR product size was adjusted to a range of 70–150 nucleotides. Three types of primer pairs were created for each transcript: Primer pairs in the same exon, primer pairs separated by one intron, and primer pairs with one primer spanning the exon-exon junction sequence. In the last step, primer pairs were checked for specificity of amplification of the target transcripts and problematic secondary structures as well as self-complementarity were excluded. Divergent primer pairs for the detection of circular transcripts were designed according to “Circular RNA Interactome” [43], which was used to identify back-splicing junction sequences of a circular RNA. This sequence was inserted into NCBI Primer-BLAST (https://blast.ncbi.nlm.nih.gov/Blast.cgi) and the design of primer pairs was performed as described above. TaqMan probes were designed using Primer Express software version 2.0 (Applied Biosystems, Foster City, CA, USA) or Primer3 software (Steve Rozen, Whitehead Institute for Biomedical Research, Cambridge, UK). Primer pairs and TaqMan probes were purchased from Metabion (Planegg/ Steinkirchen, Germany) and Eurogentec (Seraing, Belgium).
Cell culture
The human urinary BCa cell line ECV-304 was cultivated in Medium 199 (with HEPES buffer + Earle’s salts) (PAA, Pasching, Austria) containing 10% (vol/vol) fetal calf serum (PAA, Pasching, Austria). ECV-304 was originally established from an invasive, G3 BCa of an 82 years old Swedish female patient with a mutant p53 in 1970. It is a defined derivative of T24 [34, 35] which we obtained from the DSMZ (Deutsche Sammlung von Mikroorganismen und Zellkulturen, Braunschweig, Germany), a repository for microorganism and cell lines. Cell identity was confirmed by DNA profiling by the DSMZ. RT-4 cells [33] were cultivated in RPMI 1640 medium (PAA, Pasching, Austria) supplemented with 10% (vol/vol) fetal calf serum. RT-4 cells were used as an in vitro model for differentiated G1 BCa. Both cell lines were cultivated without antibiotics at 37°C and 5% CO2 in a humidified incubator. For quantification of PCR amplicons, cells were washed twice with PBS, harvested and lysed using QIAzol Lysis Reagent (Qiagen, Hilden, Germany) according to manufacturer’s instructions. The total cellular RNA was isolated using phenol-chloroform extraction followed by ethanol precipitation.
Abbreviations
BCa: Human bladder cancer; circRNA: circular RNA; ncRNA: non-coding transcripts; lg(fc): lg(fold change); BIRC5: Baculoviral IAP repeat-containing protein 5; LASP1: LIM and SH3 protein; KRT20: Keratin 20; OP18: Oncoprotein 18; UPK1A: Uroplakin 1A; CXCL8: C-X-C motif chemokine ligand 8; RPS27: ribosomal protein S27; RPL23A: ribosomal protein L23a; TRAM1: translocation associated membrane protein 1; S100A6: S100 Calcium Binding Protein 6; GLYATL: Glycin-N-Acetyltransferase; ZNF382: Zinc finger protein 382; RYR3: Ryanodine receptor 3; TPM: transcripts per kilobase million; TSL: transcript support level; HR: high risk patient group; C: control patient group.
ACKNOWLEDGMENTS
We thank Kirsten Frank for technical help and Robin Pohle, Paul Lander and Colin Osterloh for preliminary primer pair selection.
CONFLICTS OF INTEREST
Authors have no conflicts of interest to declare.
References
1. Richters A, Aben KKH, Kiemeney LALM. The global burden of urinary bladder cancer: an update. World J Urol. 2020; 38:1895–904. https://doi.org/10.1007/s00345-019-02984-4. [PubMed].
2. Sung H, Ferlay J, Siegel RL, Laversanne M, Soerjomataram I, Jemal A, Bray F. Global cancer statistics 2020: GLOBOCAN estimates of incidence and mortality worldwide for 36 cancers in 185 countries. CA Cancer J Clin. 2021. [Epub ahead of print]. https://doi.org/10.3322/caac.21660. [PubMed].
3. Fitzmaurice C, Abate D, Abbasi N, Abbastabar H, Abd-Allah F, Abdel-Rahman O, Abdelalim A, Abdoli A, Abdollahpour I, Abdulle ASM, Abebe ND, Abraha HN, Abu-Raddad LJ, et al, and Global Burden of Disease Cancer Collaboration. Global, Regional, and National Cancer Incidence, Mortality, Years of Life Lost, Years Lived With Disability, and Disability-Adjusted Life-Years for 29 Cancer Groups, 1990 to 2017: A Systematic Analysis for the Global Burden of Disease Study. JAMA Oncol. 2019; 5:1749–68. https://doi.org/10.1001/jamaoncol.2019.2996. [PubMed].
4. Botteman MF, Pashos CL, Redaelli A, Laskin B, Hauser R. The health economics of bladder cancer: a comprehensive review of the published literature. Pharmacoeconomics. 2003; 21:1315–30. https://doi.org/10.1007/bf03262330. [PubMed].
5. Kamat AM, Hegarty PK, Gee JR, Clark PE, Svatek RS, Hegarty N, Shariat SF, Xylinas E, Schmitz-Dräger BJ, Lotan Y, Jenkins LC, Droller M, van Rhijn BW, Karakiewicz PI, and International Consultation on Urologic Disease-European Association of Urology Consultation on Bladder Cancer 2012. ICUD-EAU International Consultation on Bladder Cancer 2012: Screening, diagnosis, and molecular markers. Eur Urol. 2013; 63:4–15. https://doi.org/10.1016/j.eururo.2012.09.057. [PubMed].
6. Bartsch G, Mitra AP, Cote RJ. Expression profiling for bladder cancer: strategies to uncover prognostic factors. Expert Rev Anticancer Ther. 2010; 10:1945–54. https://doi.org/10.1586/era.10.131. [PubMed].
7. Carmack AJ, Soloway MS. The diagnosis and staging of bladder cancer: from RBCs to TURs. Urology. 2006; 67:3–8. https://doi.org/10.1016/j.urology.2006.01.026. [PubMed].
8. Yu Z, Liao J, Chen Y, Zou C, Zhang H, Cheng J, Liu D, Li T, Zhang Q, Li J, Yang X, Ye Y, Huang Z, et al. Single-Cell Transcriptomic Map of the Human and Mouse Bladders. J Am Soc Nephrol. 2019; 30:2159–76. https://doi.org/10.1681/ASN.2019040335. [PubMed].
9. Hovelson DH, Udager AM, McDaniel AS, Grivas P, Palmbos P, Tamura S, Lazo de la Vega L, Palapattu G, Veeneman B, El-Sawy L, Sadis SE, Morgan TM, Montgomery JS, et al. Targeted DNA and RNA Sequencing of Paired Urothelial and Squamous Bladder Cancers Reveals Discordant Genomic and Transcriptomic Events and Unique Therapeutic Implications. Eur Urol. 2018; 74:741–53. https://doi.org/10.1016/j.eururo.2018.06.047. [PubMed].
10. Sin MLY, Mach KE, Sinha R, Wu F, Trivedi DR, Altobelli E, Jensen KC, Sahoo D, Lu Y, Liao JC. Deep Sequencing of Urinary RNAs for Bladder Cancer Molecular Diagnostics. Clin Cancer Res. 2017; 23:3700–10. https://doi.org/10.1158/1078-0432.CCR-16-2610. [PubMed].
11. Bhat A, Ritch CR. Urinary biomarkers in bladder cancer: where do we stand? Curr Opin Urol. 2019; 29:203–09. https://doi.org/10.1097/MOU.0000000000000605. [PubMed].
12. Maas M, Bedke J, Stenzl A, Todenhöfer T. Can urinary biomarkers replace cystoscopy? World J Urol. 2019; 37:1741–49. https://doi.org/10.1007/s00345-018-2505-2. [PubMed].
13. Lotan Y, O’Sullivan P, Raman JD, Shariat SF, Kavalieris L, Frampton C, Guilford P, Luxmanan C, Suttie J, Crist H, Scherr D, Asroff S, Goldfischer E, et al. Clinical comparison of noninvasive urine tests for ruling out recurrent urothelial carcinoma. Urol Oncol. 2017; 35:531.e15–22. https://doi.org/10.1016/j.urolonc.2017.03.008. [PubMed].
14. Shariat SF, Karam JA, Lotan Y, Karakiewizc PI. Critical evaluation of urinary markers for bladder cancer detection and monitoring. Rev Urol. 2008; 10:120–35. [PubMed].
15. Tölle A, Jung M, Rabenhorst S, Kilic E, Jung K, Weikert S. Identification of microRNAs in blood and urine as tumour markers for the detection of urinary bladder cancer. Oncol Rep. 2013; 30:1949–56. https://doi.org/10.3892/or.2013.2621. [PubMed].
16. Zhao A, Péoc’h M, Cottier M, Genin C, Mottet N, Li G. Cell-free RNA content in urine as a possible molecular diagnostic tool for clear cell renal cell carcinoma. Int J Cancer. 2015; 136:2610–15. https://doi.org/10.1002/ijc.29313. [PubMed].
17. Kotova ES, Savochkina YA, Doludin YV, Vasilyev AO, Prilepskay EA, Potoldykova NV, Babalyan KA, Kanygina AV, Morozov AO, Govorov AV, Enikeev DV, Kostryukova ES, Ilina EN, et al. Identification of Clinically Significant Prostate Cancer by Combined PCA3 and AMACR mRNA Detection in Urine Samples. Res Rep Urol. 2020; 12:403–13. https://doi.org/10.2147/RRU.S262310. [PubMed].
18. Lee B, Mahmud I, Marchica J, Dereziński P, Qi F, Wang F, Joshi P, Valerio F, Rivera I, Patel V, Pavlovich CP, Garrett TJ, Schroth GP, et al. Integrated RNA and metabolite profiling of urine liquid biopsies for prostate cancer biomarker discovery. Sci Rep. 2020; 10:3716. https://doi.org/10.1038/s41598-020-60616-z. [PubMed].
19. Ng K, Stenzl A, Sharma A, Vasdev N. Urinary biomarkers in bladder cancer: A review of the current landscape and future directions. Urol Oncol. 2021; 39:41–51. https://doi.org/10.1016/j.urolonc.2020.08.016. [PubMed].
20. Soria F, Krabbe LM, Todenhöfer T, Dobruch J, Mitra AP, Inman BA, Gust KM, Lotan Y, Shariat SF. Molecular markers in bladder cancer. World J Urol. 2019; 37:31–40. https://doi.org/10.1007/s00345-018-2503-4. [PubMed].
21. Menke TB, Boettcher K, Krüger S, Kausch I, Boehle A, Sczakiel G, Warnecke JM. Ki-67 protein concentrations in urothelial bladder carcinomas are related to Ki-67-specific RNA concentrations in urine. Clin Chem. 2004; 50:1461–63. https://doi.org/10.1373/clinchem.2003.030049. [PubMed].
22. Lu HC, Yao JQ, Yang X, Han J, Wang JZ, Xu K, Zhou R, Yu H, Lv Q, Gu M. Identification of a potentially functional circRNA-miRNA-mRNA regulatory network for investigating pathogenesis and providing possible biomarkers of bladder cancer. Cancer Cell Int. 2020; 20:31. https://doi.org/10.1186/s12935-020-1108-3. [PubMed].
23. Dong W, Bi J, Liu H, Yan D, He Q, Zhou Q, Wang Q, Xie R, Su Y, Yang M, Lin T, Huang J. Circular RNA ACVR2A suppresses bladder cancer cells proliferation and metastasis through miR-626/EYA4 axis. Mol Cancer. 2019; 18:95. https://doi.org/10.1186/s12943-019-1025-z.
24. Li M, Liu Y, Zhang X, Liu J, Wang P. Transcriptomic analysis of high-throughput sequencing about circRNA, lncRNA and mRNA in bladder cancer. Gene. 2018; 677:189–97. https://doi.org/10.1016/j.gene.2018.07.041. [PubMed].
25. Arnaiz E, Sole C, Manterola L, Iparraguirre L, Otaegui D, Lawrie CH. CircRNAs and cancer: Biomarkers and master regulators. Semin Cancer Biol. 2019; 58:90–99. https://doi.org/10.1016/j.semcancer.2018.12.002. [PubMed].
26. Cao Y, Tian T, Li W, Xu H, Zhan C, Wu X, Wang C, Wu X, Wu W, Zheng S, Xie K. Long non-coding RNA in bladder cancer. Clin Chim Acta. 2020; 503:113–21. https://doi.org/10.1016/j.cca.2020.01.008. [PubMed].
27. Memczak S, Jens M, Elefsinioti A, Torti F, Krueger J, Rybak A, Maier L, Mackowiak SD, Gregersen LH, Munschauer M, Loewer A, Ziebold U, Landthaler M, et al. Circular RNAs are a large class of animal RNAs with regulatory potency. Nature. 2013; 495:333–38. https://doi.org/10.1038/nature11928. [PubMed].
28. Salzman J, Chen RE, Olsen MN, Wang PL, Brown PO. Cell-type specific features of circular RNA expression. PLoS Genet. 2013; 9:e1003777. https://doi.org/10.1371/journal.pgen.1003777. [PubMed].
29. Qu S, Liu Z, Yang X, Zhou J, Yu H, Zhang R, Li H. The emerging functions and roles of circular RNAs in cancer. Cancer Lett. 2018; 414:301–09. https://doi.org/10.1016/j.canlet.2017.11.022. [PubMed].
30. Cheng D, Wang J, Dong Z, Li X. Cancer-related circular RNA: diverse biological functions. Cancer Cell Int. 2021; 21:11. https://doi.org/10.1186/s12935-020-01703-z. [PubMed].
31. Wang S, Zhang K, Tan S, Xin J, Yuan Q, Xu H, Xu X, Liang Q, Christiani DC, Wang M, Liu L, Du M. Circular RNAs in body fluids as cancer biomarkers: the new frontier of liquid biopsies. Mol Cancer. 2021; 20:13. https://doi.org/10.1186/s12943-020-01298-z. [PubMed].
32. Hanke M, Dubois J, Kausch I, Petkovic S, Sczakiel G. Oncoprotein 18 is necessary for malignant cell proliferation in bladder cancer cells and serves as a G3-specific non-invasive diagnostic marker candidate in urinary RNA. PLoS One. 2020; 15:e0229193. https://doi.org/10.1371/journal.pone.0229193. [PubMed].
33. Rigby CC, Franks LM. A human tissue culture cell line from a transitional cell tumour of the urinary bladder: growth, chromosone pattern and ultrastructure. Br J Cancer. 1970; 24:746–54. https://doi.org/10.1038/bjc.1970.89. [PubMed].
34. Dirks WG, MacLeod RA, Drexler HG. ECV304 (endothelial) is really T24 (bladder carcinoma): cell line cross- contamination at source. In Vitro Cell Dev Biol Anim. 1999; 35:558–59. https://doi.org/10.1007/s11626-999-0091-8. [PubMed].
35. Drexler HG, Quentmeier H, Dirks WG, MacLeod RA. Bladder carcinoma cell line ECV304 is not a model system for endothelial cells. In Vitro Cell Dev Biol Anim. 2002; 38:185–86. [PubMed].
36. Hanke M, Hoefig K, Merz H, Feller AC, Kausch I, Jocham D, Warnecke JM, Sczakiel G. A robust methodology to study urine microRNA as tumor marker: microRNA-126 and microRNA-182 are related to urinary bladder cancer. Urol Oncol. 2010; 28:655–61. https://doi.org/10.1016/j.urolonc.2009.01.027. [PubMed].
37. Erdmann K, Salomo K, Klimova A, Heberling U, Lohse-Fischer A, Fuehrer R, Thomas C, Roeder I, Froehner M, Wirth MP, Fuessel S. Urinary MicroRNAs as Potential Markers for Non-Invasive Diagnosis of Bladder Cancer. Int J Mol Sci. 2020; 21:3814. https://doi.org/10.3390/ijms21113814. [PubMed].
38. Zhan Y, Du L, Wang L, Jiang X, Zhang S, Li J, Yan K, Duan W, Zhao Y, Wang L, Wang Y, Wang C. Expression signatures of exosomal long non-coding RNAs in urine serve as novel non-invasive biomarkers for diagnosis and recurrence prediction of bladder cancer. Mol Cancer. 2018; 17:142. https://doi.org/10.1186/s12943-018-0893-y. [PubMed].
39. Yates A, Akanni W, Amode MR, Barrell D, Billis K, Carvalho-Silva D, Cummins C, Clapham P, Fitzgerald S, Gil L, Girón CG, Gordon L, Hourlier T, et al. Ensembl 2016. Nucleic Acids Res. 2016; 44:D710–16. https://doi.org/10.1093/nar/gkv1157. [PubMed].
40. Glažar P, Papavasileiou P, Rajewsky N. circBase: a database for circular RNAs. RNA. 2014; 20:1666–70. https://doi.org/10.1261/rna.043687.113. [PubMed].
41. Li H, Durbin R. Fast and accurate short read alignment with Burrows–Wheeler transform. Bioinformatics. 2009; 25:1754–60. https://doi.org/10.1093/bioinformatics/btp324. [PubMed].
42. Wagner GP, Kin K, Lynch VJ. Measurement of mRNA abundance using RNA-seq data: RPKM measure is inconsistent among samples. Theory Biosci. 2012; 131:281–85. https://doi.org/10.1007/s12064-012-0162-3. [PubMed].
43. Dudekula DB, Panda AC, Grammatikakis I, De S, Abdelmohsen K, Gorospe M. CircInteractome: A web tool for exploring circular RNAs and their interacting proteins and microRNAs. RNA Biol. 2016; 13:34–42. https://doi.org/10.1080/15476286.2015.1128065. [PubMed].