
Introduction
The growth hormone secretagogue receptor type 1a (GHS-R1a) is the known biological relevant receptor of the endogenous ligand and pleiotropic hormone Ghrelin (acronym growth hormone release inducing), which mediates a broad range of complex biological functions [1], such as regulation of the body weight, body composition and energy expenditure [2, 3]. Besides GHS-R1a, a truncated form of the receptor exists which is termed GHS-R1b [4, 5]. In contrast to GHS-R1a, GHS-R1b does not bind Ghrelin and is completely inactive. Ghrelin and its receptor GHS-R1a are widely expressed in normal tissues but also in various tumors, including human pituitary adenomas, endocrine neoplasms of the lung, stomach, pancreas, breast, ovarian cancer and prostate carcinomas [6, 7].
Physiologically, Ghrelin is mainly involved in the positive regulation of energy homeostasis, hunger and body weight gain. The orexigenic mode of action of Ghrelin is well established and occurs via the activation of NPY/AgRP neurons in the hypothalamic arcuate nucleus [8, 9]. The GHS-R1a exhibits unusual high constitutive activity [10, 11] with ∼50% of its maximal capacity in the absence of the agonist (Ghrelin) GHS-R1a induces constant appetite and triggers food intake between meals [12]. In addition, Ghrelin receptors are involved in a series of biological processes including glucose homeostasis, GH-release, gastric motility, regulation of arterial pressure, bone metabolism, heart disease, and immune reactions. Moreover, Ghrelin is a potent anti-inflammatory mediator both in vitro and in vivo and a promising therapeutic agent in the treatment of cachexia, anorexia, age-related disorders [13], inflammatory diseases and injury. Through the MAPK signaling cascade Ghrelin can induce cell proliferation and could thereby play an important role in cancer. The growing knowledge about the interaction of Ghrelin with tumor cells suggests functional effects of Ghrelin on the tumor itself and the physiology of the body [14–17]. GHS-R1a is expressed in the prostate cancer cell lines PC-3 [18–20], DU-145 [21] and LnCAP [22, 23] and these cells can also secrete mature Ghrelin. These cells therefore represent a suitable model for in vitro experiments and in vivo studies as xenograft tumor models [24–26].
Interestingly, Ghrelin is the only known peptide modified with an O-linked octanoyl side group, which occurs on its third serine residue [27]. This modification is crucial for the physiological effects of Ghrelin including regulation of feeding, adiposity, and insulin secretion. The octanoylation is mediated by Ghrelin O-acyl transferase (GOAT). GOAT is a conserved orphan membrane-bound O-acyl transferase (MBOAT) that specifically octanoylates serine-3 of the Ghrelin peptide. Transcripts of both, GOAT and Ghrelin, occur predominantly in stomach and pancreas. GOAT is conserved across vertebrates, and genetic disruption of the GOAT gene in mice leads to complete absence of acylated Ghrelin in circulation. The occurrence of Ghrelin and GOAT in stomach and pancreas tissues demonstrates the relevance of GOAT in the acylation of Ghrelin and further implicates acylated Ghrelin in pancreatic function. GOAT should be taken into account as an additional binding site in vivo [28–30].
Although widely studied as a promising drug target, our knowledge about Ghrelin signaling, behavior, dynamic interactions with its receptor and functional receptor expression in vivo is still limited and basic bioscientific research is warranted to further evaluate the safety and benefits of Ghrelin drug treatment in patients with cancer [31–33]. In vivo imaging of the Ghrelin receptor should help to improve our understanding of its mode of action and might become a powerful tool for diagnosis and drug development [26, 34]. So far, only few groups tried to develop probes for PET and optical imaging of Ghrelin receptors [26, 35–40]. In particular the group of Lewis and colleagues started the research and development of PET radiotracers for imaging of the Ghrelin receptor [26, 37, 38, 41]. The emergence of accessible imaging techniques such as small animal PET could be very valuable to provide in vivo pharmacokinetic information all along the drug discovery process [38, 41–46].
In order to develop imaging probes targeting the Ghrelin receptor, the inverse agonist radiotracer 68Ga-NODAGA-KwFwLL-NH2 1 was previously designed for PET imaging (Scheme 1). Despite a high metabolic stability and a broad biodistribution in rats, its poor potency prevented its use for further receptor dynamic studies or therapeutic application [46, 47]. More recently, the hexapeptide K-(D-1-Nal)-FwLL-NH2 2 was developed and showed a very high inverse agonist potency toward the Ghrelin receptor as supported by the significantly decreased food intake in rats [47].
The focus of the present study was to develop potent inverse agonist radiotracers targeting the Ghrelin receptor as potential imaging and therapeutic agent. The in vivo accumulation of the radiotracer has been used as biomarker in diagnostics and therapy control. The observed agonistic ligand-mediated internalization of the GHSR-1a [48] could help to extend the retention of the small molecular ligand in the target tissue. Therefore, the heptapeptide KK-(D-1-Nal)-FwLL-NH2 2 was functionalized on solid support with Palmitic acid and 1,4,7-triazacyclononane,1-glutaric acid-4,7-acetic acid (NODAGA) and radiolabeled with 64Cu, (half-life 12.701 hours, decays by 17.86% positron emission, and 0.653 MeV positron energy). This tracer was chosen, because it is beneficial for high-resolution small animal imaging with longer observation time. Furthermore, 68Ga was selected (half-life 67.629 minutes, 89% positron emission, 1.9 MeV positron energy), a generator radionuclide with optimal characteristics for clinical application, but shorter observation time and lower image resolution in the preclinical setting. The corresponding PEGylated and palmitoylated analogues were designed in order to study the influence of such modifications on radionuclide activity distribution and in vivo behavior of the radiotracers, and to improve pharmacokinetics [48].
Here, we report on the in vitro and preclinical in vivo suitability of selected NODAGA-Ghrelin receptor inverse agonists as radiotracers. Rats and mice were used as standard radiopharmacological models with respect to biodistribution, metabolic stability and PET imaging assays. Furthermore, we demonstrated specific binding to GHS-R1a and imaging of tumors and normal tissues expressing the Ghrelin receptor with 64Cu2+- and 68Ga3+-radiolabeled inverse agonist NODAGA-KK-(D-1-NaI)-FwLL-NH2 in xenografted prostate tumor models in mice.
Results
Synthesis of Ghrelin inverse agonist derivatives and conjugation with NODAGA for labeling with metal-isotopes
Novel Ghrelin inverse agonist derivatives were synthetized and conjugated with and without Palmitic acid. To apply these compounds for in vivo imaging it was necessary to attach a chelator to these molecules allowing us the binding of natGa3+, 68Ga3+, and 64Cu2+ for in vitro testing and the in vivo imaging with PET. The optimal chelator for these metal isotopes was NODAGA that was attached at various positions in the molecules. As schematically summarized in Figure 1, eighteen Ghrelin inverse agonist derivatives were synthesized on a Rink amide resin (Table 1). The peptides 3–18 were purified (> 95%,) by RP-HPLC. Identity was confirmed by mass spectrometry. Prior to the in vivo experiments, a TFA-HCl exchange was performed for conjugates 9, 10 and 15 by incubating the peptides three times with diluted HCl and subsequent lyophilization. Integrity and purity of all compounds were controlled at each step by MS and HPLC.
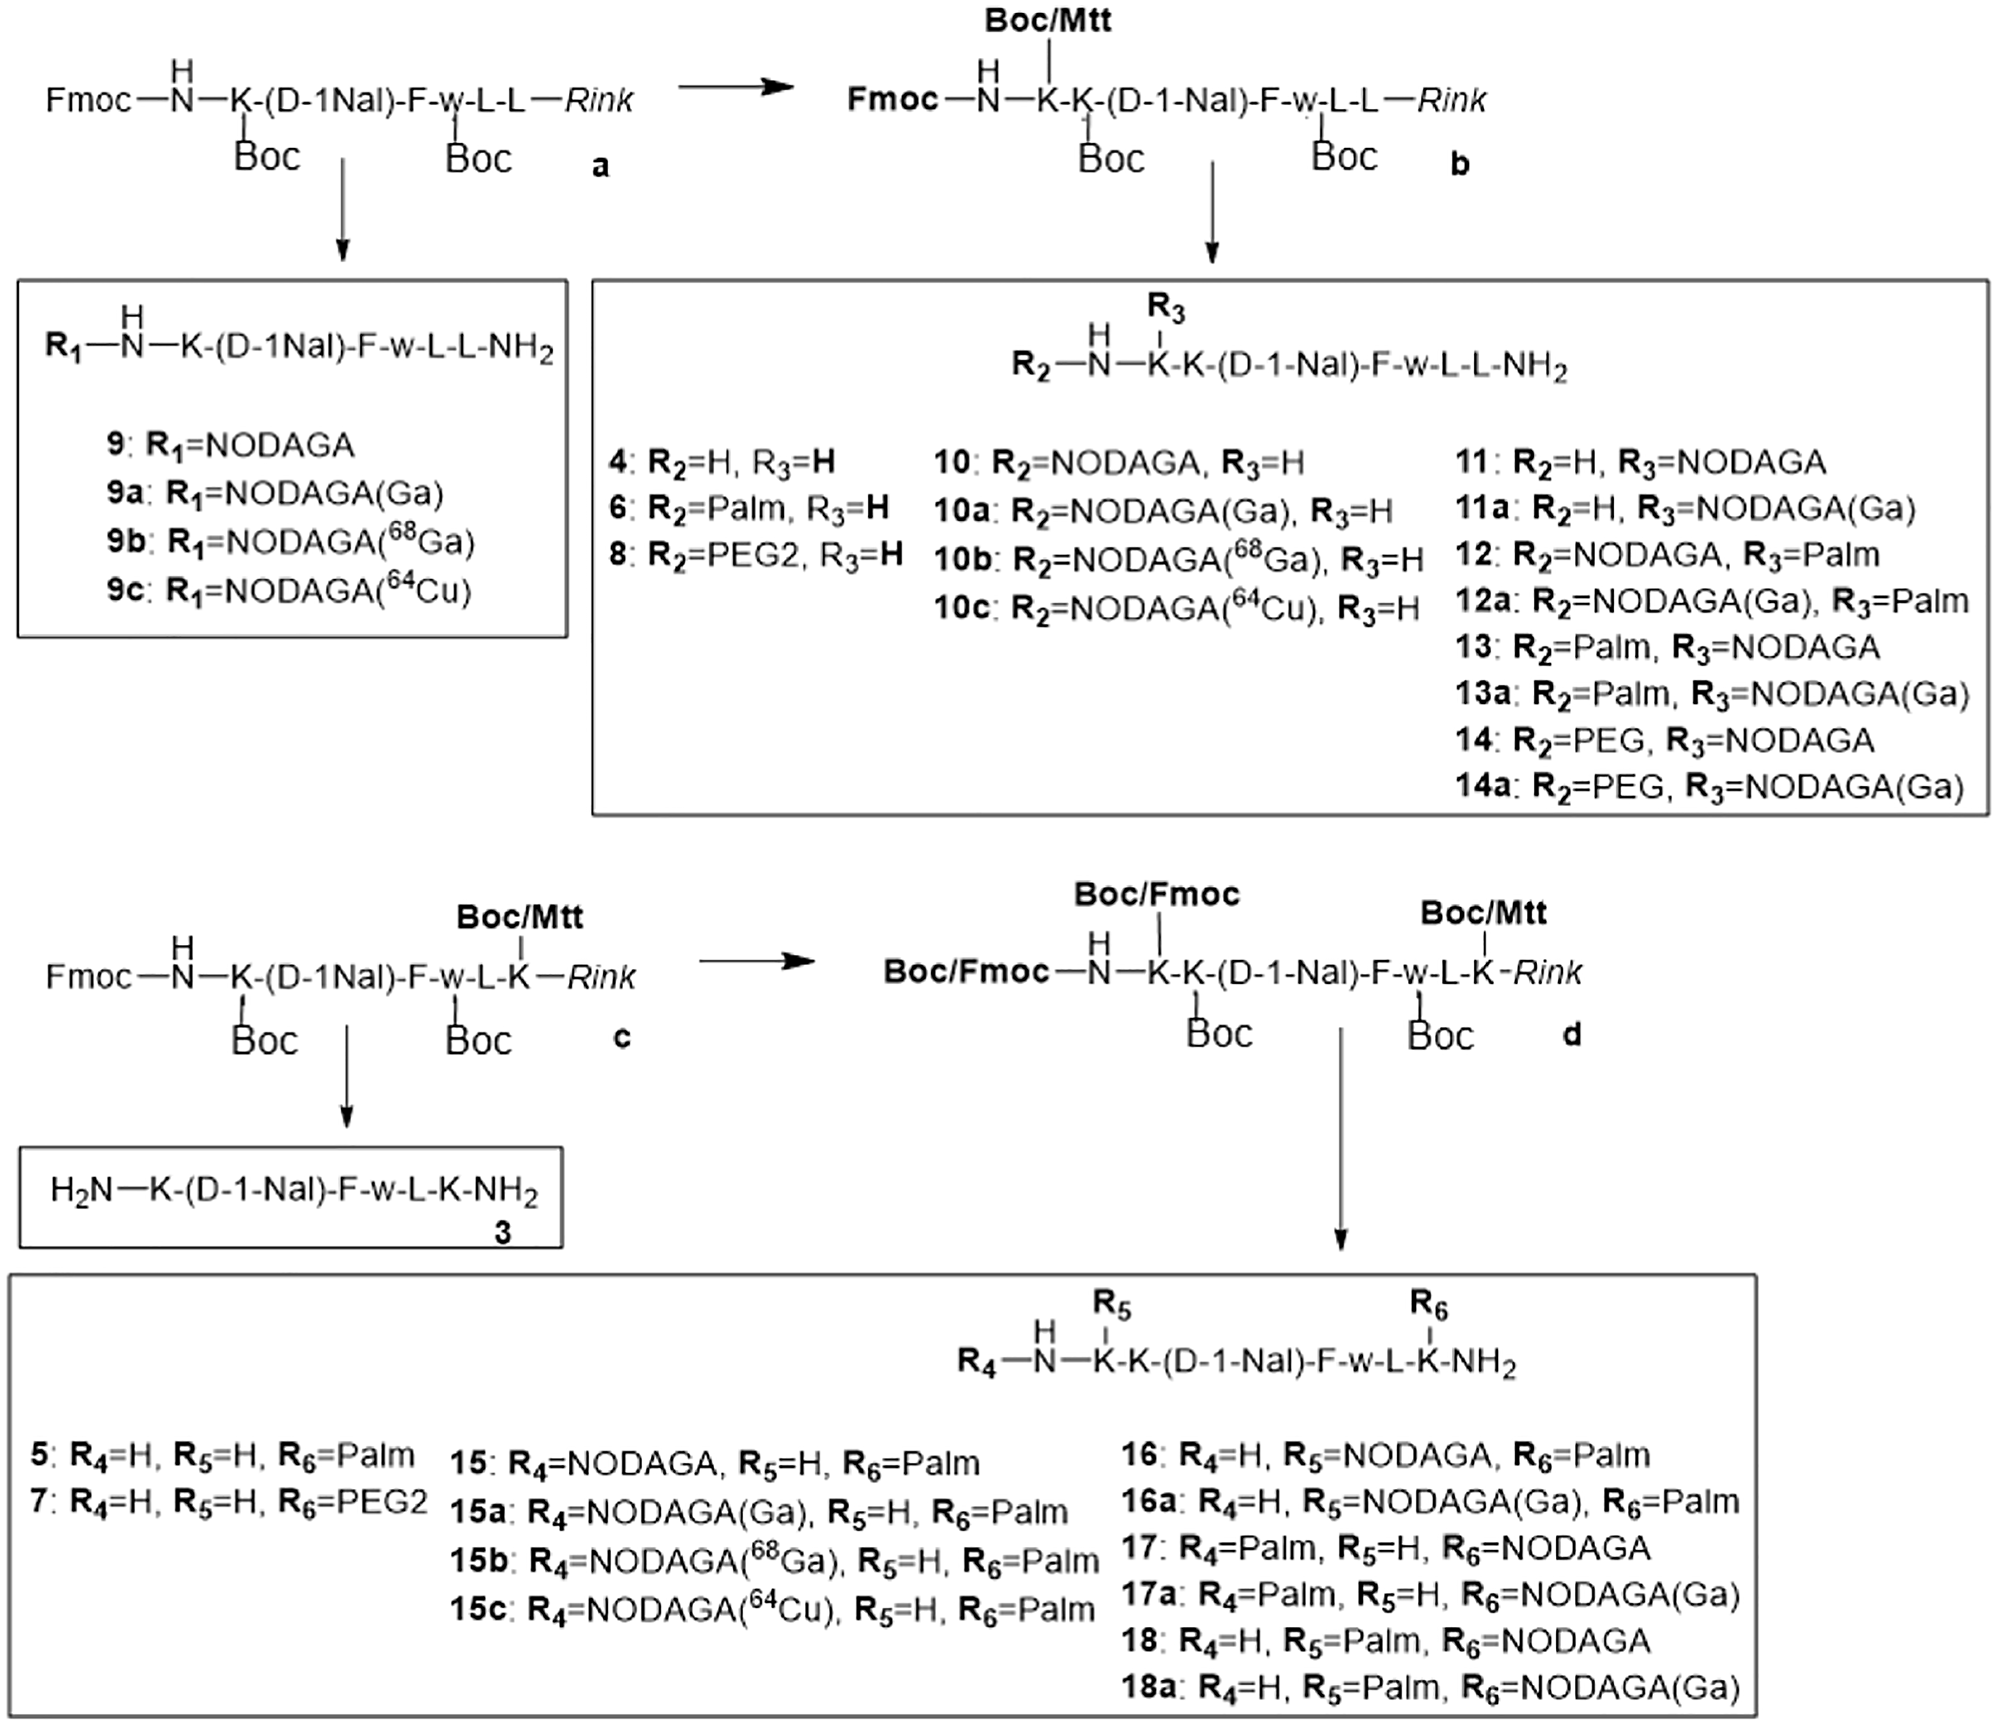
Figure 1: Synthesis of peptides 3–18. All peptides were synthesized on solid support using the Fmoc/tBu strategy and Mtt protecting groups for orthogonal side-chain modifications.
Table 1: In vitro activity of peptides 2-18a in an inositol phosphate turnover assay
| No. | Sequence | EC50 (nM) | pEC50 ± SEM | x-fold over No. 2 | Δeff (%) |
|---|---|---|---|---|---|
| 2 | K-(D-1-Nal)-FwLL-NH2 | 4.5 | 8.4 ± 0.05 | 1 | 57 ± 2 |
| 3 | K-(D-1-Nal)-FwLK-NH2 | 162.0 | 6.8 ± 0.07 | 36 | 42 ± 1 |
| 4 | KK-(D-1-Nal)-FwLL-NH2 | 13.0 | 7.9 ± 0.09 | 3 | 63 ± 2 |
| 5 | K-(D-1-Nal)-FwLK(Palm)-NH2 | 3.5 | 8.5 ± 0.07 | 1 | 85 ± 2 |
| 6 | Palm-KK-(D-1-Nal)-FwLL-NH2 | 11.0 | 8.0 ± 0.06 | 2 | 86 ± 2 |
| 7 | K-(D-1-Nal)-FwLK(PEG2)-NH2 | 166.0 | 6.8 ± 0.10 | 37 | 61 ± 3 |
| 8 | PEG2-KK-(D-1-Nal)-FwLL-NH2 | 499.0 | 6.3 ± 0.08 | 111 | 85 ± 3 |
| 9a | [natGa]Ga-NODAGA-K-(D-1-Nal)-FwLL-NH2 | 64.8 | 7.2 ± 0.10 | 14 | 88 ± 8 |
| 10a | [natGa]Ga-NODAGA-KK-(D-1-Nal)-FwLL-NH2 | 34.7 | 7.5 ± 0.07 | 8 | 98 ± 4 |
| 11a | [natGa]Ga-NODAGA-K-(D-1-Nal)-FwLL-NH2 | 151.6 | 6.8 ± 0.07 | 34 | 78 ± 4 |
| 12a | [natGa]Ga-NODAGA-K(Palm)-K-(D-1-Nal)-FwLL-NH2 | 20.3 | 7.7 ± 0.06 | 5 | 92 ± 4 |
| 13a | Palm-K[natGa]Ga-NODAGA-K-(D-1-Nal)-FwLL-NH2 | 28.7 | 7.5 ± 0.06 | 6 | 92 ± 3 |
| 14a | PEG2-K[natGa]Ga-NODAGA-K-(D-1-Nal)-FwLL-NH2 | > 1000 | - | > 1000 | n.d. |
| 15a | [natGa]Ga-NODAGA-KK-(D-1-Nal)-FwLK(Palm)-NH2 | 16.5 | 7.8 ± 0.05 | 4 | 89 ± 3 |
| 16a | K[natGa]Ga-NODAGA-K-(D-1-Nal)-FwLK(Palm)-NH2 | 13.6 | 7.9 ± 0.07 | 3 | 90 ± 4 |
| 17a | Palm-KK-(D-1-Nal)-FwLK[natGa]Ga-NODAGA-NH2 | 592.1 | 6.2 ± 0.10 | 132 | 85 ± 6 |
| 18a | K(Palm)-K-(D-1-Nal)-FwLK[natGa]Ga-NODAGA-NH2 | 266.9 | 6.6 ± 0.10 | 59 | 75 ± 6 |
Ten novel NODAGA containing compounds were synthetized and prepared for testing of the efficacy and affinity at the GHS-R1a.
In vitro activity of Ghrelin inverse agonists in inositol phosphate turnover assay
In vitro inositol phosphate turnover assay was performed to evaluate the potency and efficacy of peptides 3–7 and 9a-18a using COS-7 cells transfected with the Ghrelin receptor. The substitution of Leu6 with Lys in peptide 3 resulted in a significant loss of potency and efficacy (EC50 = 162 nM, Δeff = 42%). In contrast, addition of a Lys at the N-terminus in peptide 4 induced only a slight loss of potency (EC50 = 13.0 nM) but maintained efficacy of 63% compared to 2. Introduction of a palmitoyl group at the C-terminus led to the most potent and most efficient peptide K-(D-1-Nal)-FwLK(Palm)-NH2 (5), showing the same potency than the lead 2 (EC50 = 3.5 nM) and an efficacy of 85%. Palmitoylation at the N-terminal Lys linker led to peptide 6 which is only slightly less potent than 2 and equipotent to 4 (EC50 = 11.0 nM). The coupling of PEG2 at the C-terminal lysine (7) or at the N-terminal lysine linker (8) resulted in a drastic loss of potency (EC50 = 166 nM and 499 nM, respectively).
The biological activity of [natGa]Ga-NODAGA-chelates 9–18a as model compounds for the radiotracers was also evaluated. Direct introduction of [natGa]Ga-NODAGA at the N-terminus of the lead 2 resulted in a 14-fold drop in potency (9a, EC50 = 64.8 nM) and higher efficacy (Δeff = 88%). Addition of a Lys1 linker led to higher potency and efficacy when [natGa]Ga-NODAGA was branched at the N-terminus (10a, EC50 = 34.7 nM, Δeff = 98%) while both potency and efficacy were decreased when NODAGA was linked at Lys1 side chain (11a, EC50 = 152 nM, Δeff = 78%). Palmitoylated inverse agonist analogs 12–13a bearing both [natGa]Ga-NODAGA and palmitoylation at the Lys1 linker showed potencies in the nanomolar range (respectively EC50 = 20.3 nM and 28.7 nM) and high efficacies (Δeff = 92%). In contrast, the PEGylated inverse agonist derivative 14a presented a dramatic loss in potency with an EC50 reaching the micromolar range (EC50 = 1.8 ± 0.6 μM). Interestingly, compounds 15–16a with a C-terminal palmitoylation and an N-terminal [natGa]Ga-NODAGA presented the best potencies (EC50 = 16.5 and 13.6 nM, respectively) and high efficacies (Δeff = 89–90%), whereas the opposite configuration in derivatives 17–18a led to a 57- to 131-fold drop-in activity compared to the lead 2 (EC50 = 592.1 nM and 266.9 nM, respectively).
In the inositol phosphate turnover assay (Table 1), the efficacy of the NODAGA and Palm containing molecules decreased in the order 16a, 15a, 12a, 13a, 18a, 17a. The efficacy of NODAGA and non-Palm containing decreased in the order of 10a, 9a, 11a, 14a.
In vitro affinity of Ghrelin inverse agonists at the Ghrelin receptor
Palmitic acid containing (12a, 15a) and non-containing (10a) compounds were selected for comparison of the affinity at the Ghrelin receptor. Competitive binding assays have been performed to evaluate the affinity of compounds 10a, 12a and 15a towards the Ghrelin receptor using 125I-His-Ghrelin with high molar activity and COS-7 cells stably transfected with the Ghrelin receptor (Table 2) [49]. Although lower than Ghrelin (Ki = 0.53 ± 0.03 nM) and the lead 2 (Ki = 4.9 ± 0.8 nM), all derivatives displayed affinities in the nanomolar range with Ki of 30.3 ± 7.5 nM, 66.9 ± 25.7 nM, and 11.0 ± 4.3 nM, respectively. Interestingly, the palmitoylated peptide 15a showed the best affinity at the receptor, with only a 2-fold reduction compared with the control 2. Hence, palmitoylation is beneficial when placed at the C-terminus (15a versus 10a) whereas it lowers the affinity of the tracer when introduced at the N-terminus (12a versus 10a).
Table 2: In vitro binding affinity of peptides
| No. | Peptide | Ki ± SD [nM] | x-fold over Ghrelin | x-fold over 2 | n |
|---|---|---|---|---|---|
| Ghrelin | GS-S(Oct)-FLSPEHQRVQQRKESKKPPAKLQPR-OH | 0.53 ± 0.03 | 1 | 0.1 | 3 |
| 10a | [natGa]Ga-NODAGA-KK-(D-1-Nal)-FwLL-NH2 | 30.3 ± 7.50 | 57 | 6 | 2 |
| 12a | [natGa]Ga-NODAGA-K(Palm)-K-(D-1-Nal)-FwLL-NH2 | 66.9 ± 25.7 | 126 | 14 | 2 |
| 15a | [natGa]Ga-NODAGA-KK-(D-1-Nal)-FwLK(Palm)-NH2 | 11.0 ± 4.30 | 21 | 2 | 2 |
The affinity of the natGa-peptides to the GHS-R1a is approximately two orders of magnitude lower that Ghrelin’s.
Complexation with natGa3+ and radiolabeling with [64Cu]Cu2+ and [68Ga]Ga3+
For in vitro and in vivo studies, the radiochemical yield (RCY) was > 95% after incubation at 90°C for 30 min with a molar activity equal or larger than 20 GBq × μmol-1. High amounts of radiolabeled conjugates were obtained (280 to 430 MBq) which allowed performing of biodistribution and PET experiments in parallel. Nevertheless, the high radiochemical purity (> 98%) and molar activity allowed the direct application of the 9b-c, 10b-c and 15b-c without further purification of the products. The experiments are summarized in Table 3. In the experiments the molar activities of the radiotracers were comparable for both radionuclides. The molar activity for 9c resulted from a lower specific activity of the 64Cu2+ provided. The highest molar activities were obtained with peptide 10, with average molar activities at time of injection of 38.6 ± 37.7 GBq/μmol and 43.4 ± 41.1 GBq/μmol (mean ± SEM) for 68Ga and 64Cu respectively.
Table 3: Molar activities
| [68Ga]Ga3+- radiotracers | Molar activity (GBq/μmol) | n | [64Cu]Cu2+- radiotracers | Molar activity (GBq/μmol) | n |
|---|---|---|---|---|---|
| 9b | 19.7 ± 16.7 | 7 | 9c | 6.3 ± 3.8 | 10 |
| 10b | 38.6 ± 37.7 | 6 | 10c | 43.4 ± 41.1 | 16 |
| 15b | 16.1 ± 6.1 | 12 | 15c | 16.6 ± 8.3 | 10 |
All the compounds could be radiolabeled with molar activities suitable for radiotracer experiments in vivo.
In vivo metabolic stability of radiolabeled Ghrelin inverse agonists in rats
The metabolism of the radiolabeled peptides was studied in deproteinized arterial blood plasma of rats. Radio-HPLC chromatograms of [68Ga]Ga3+-radiotracers 9b, 10b, 15b and [64Cu]Cu2+-radiotracers 9c, 10c, and 15c are presented in Figure 2.
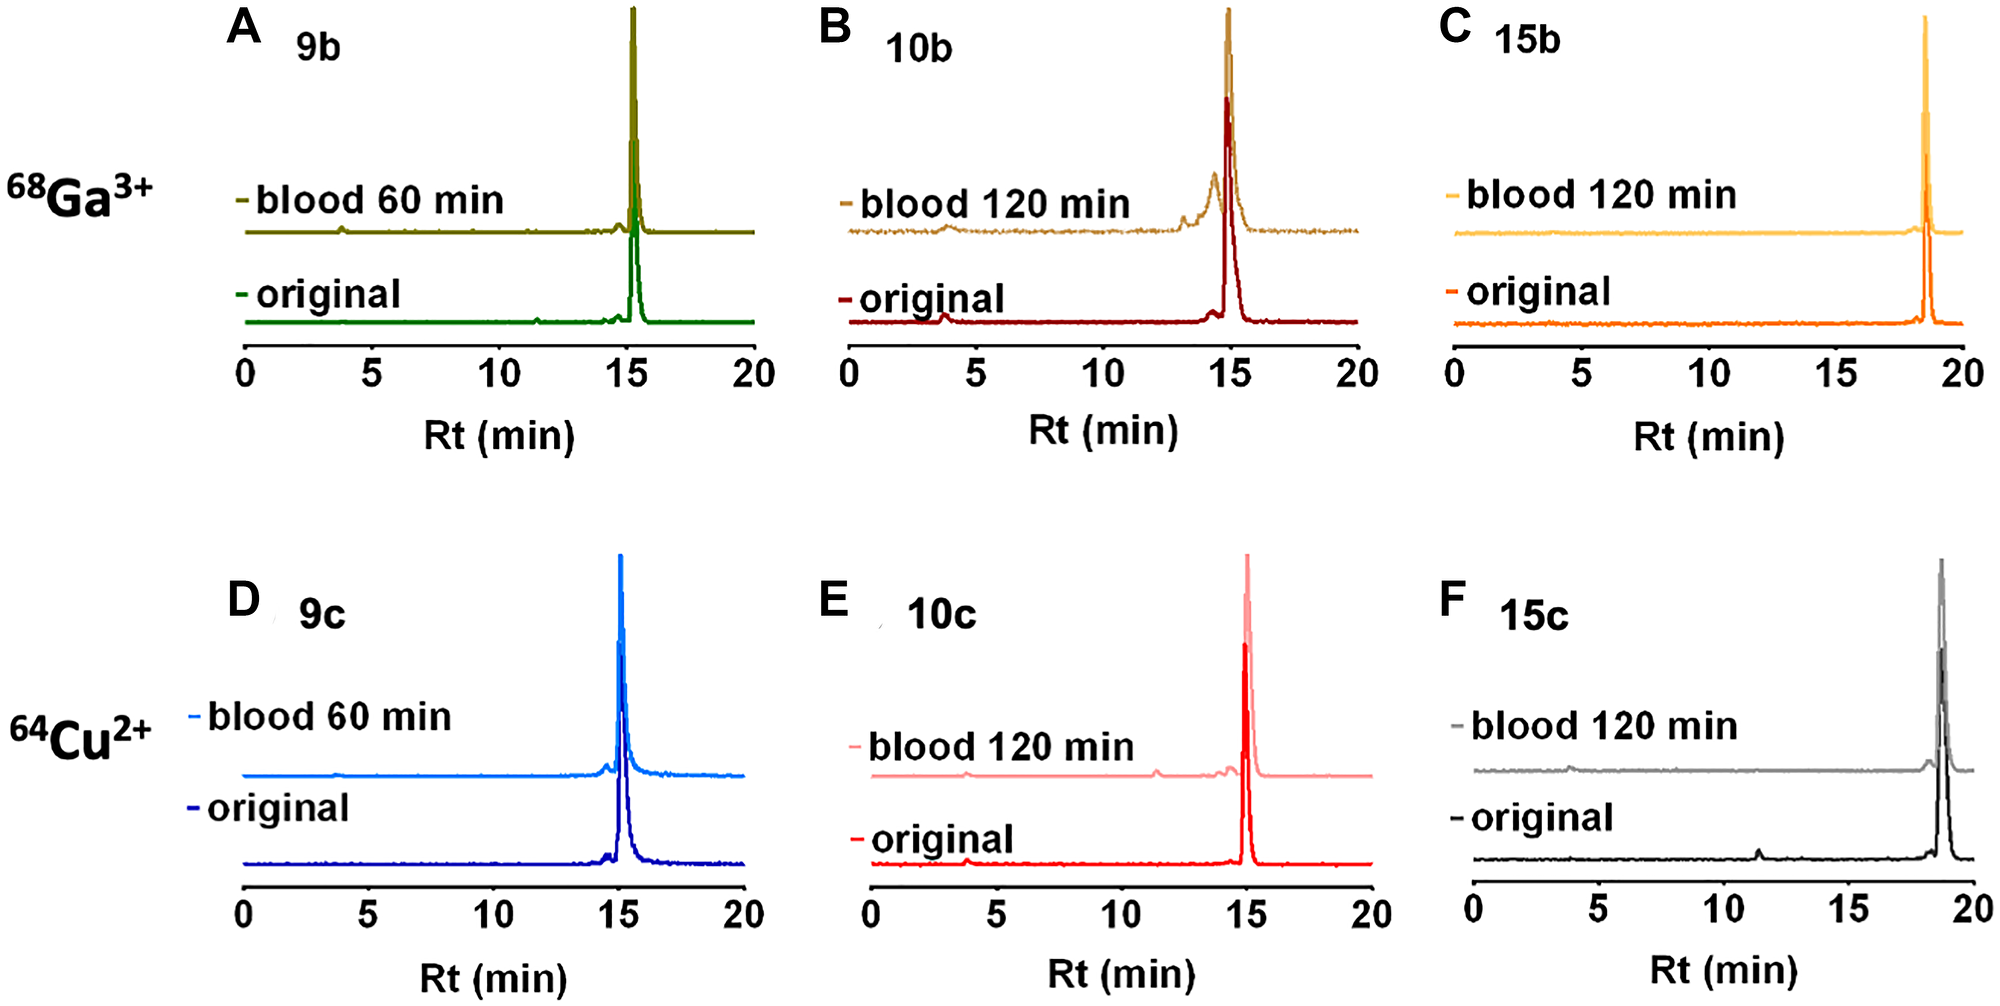
Figure 2: Radio-HPLC of rat blood plasma. Radio-HPLC of rat blood plasma at 0 and 60 or 120 minutes after single intravenous injection of the 68Ga-radiotracers (A–C) 9b, 10b and 15b and the 64Cu-radiotracers (D–F) 9c, 10c and 15c.
In the circulating blood, all radiotracers were mainly found as original compound and only traces of radioactive metabolites were detected with 10b. The chromatogram of 10b showed a minor metabolite at 120 min after injection. The distribution of intact 10c was further evaluated. At 1 hour after injection 14% of the original compound were found in the liver, 1% in the kidneys, and 6% in the urine. The structure of the metabolites was not further characterized.
As nearly no radioactive degradation products were observed in the arterial blood (Figure 2) we could therefore assume that the blood activity concentration reflect the original radiotracer with no or minor metabolite amounts. Consequently, concentration of the radiotracer peptide concentrations in the blood could be estimated according to their molar activity, injected activity, and the body weight (Table 4).
Table 4: Estimated radiotracer peptide concentrations in blood
| Biodistribution | |||||
|---|---|---|---|---|---|
| [68Ga]Ga3+-radiotracers | Cblood (nM) | n | [64Cu]Cu2+-radiotracers | Cblood (nM) | n |
| 9b | 28 ± 24 | 14 | 9c | 4.5 ± 0.9 | 16 |
| 10b | 30 ± 16 | 14 | 10c | 2.5 ± 1.3 | 15 |
| 15b | 90 ± 6 | 15 | 15c | 4.1 ± 2.4 | 15 |
| PET | |||||
| [68Ga]Ga3+-radiotracers | Cblood (nM) | n | [64Cu]Cu2+-radiotracers | Cblood (nM) | n |
| 9b | 1100 ± 800 | 2 | 9c | 570 ± 240 | 2 |
| 10b | 530 ± 210 | 2 | 10c | 270 ± 110 | 2 |
| 15b | 670 | 1 | 15c | 560 ± 310 | 2 |
It is important for comparison of the results of the biodistribution and the PET studies to know the injected peptide amounts. Under our experimental conditions and dependent on the physical half-life of the radioisotopes were the starting peptide concentrations in the blood lower for the 64Cu-labeled radiotracers compared to the 68Ga-labeled radiotracers. Comparing biodistribution and PET experiments the other factor that forced the injection of larger activity amounts in PET was the lower sensitivity of the imaging system in relation to the well counter used in biodistribution measurements. The consequence of approximately two orders of magnitude higher peptide concentration in the PET experiments was that the GHS-R1a were partially blocked by the radiotracer peptide itself and the blocking effects of the Ghrelin and the small peptide inverse agonist KK-(D-1-Nal)-FwLL-NH2 (named KKD) were smaller than in the biodistribution experiments. In the biodistribution experiments of 9c, 10c and 15c were the calculated radiotracer peptide to Ki ratios comparable to the ratio of Ghrelin level (0.09 - 0.22 nM) [50] to Ki (Ki = 0.53 ± 0.03 nM, Table 2) in vivo in lined rats.
The high metabolic stability and the low necessary tracer quantities should allow the quantification of the ghrelin receptors in the biodistribution studies. In the PET examinations, the amount of substance required is up to 100 times greater and thus will results in partial saturation of the receptors with the result of lower inhibiting effects in the competition experiments.
Biodistribution of radiolabeled Ghrelin inverse agonists in rats
Biodistribution in distinct organs and tissues of healthy rats was measured at 5 and 60 min after single intravenous injection of the 68Ga- or 64Cu-radiotracers 9b-c, 10b-c, and 15b-c in rats (see 68Ga-tracers in Figure 3 and 64Cu-tracers in Figure 4).
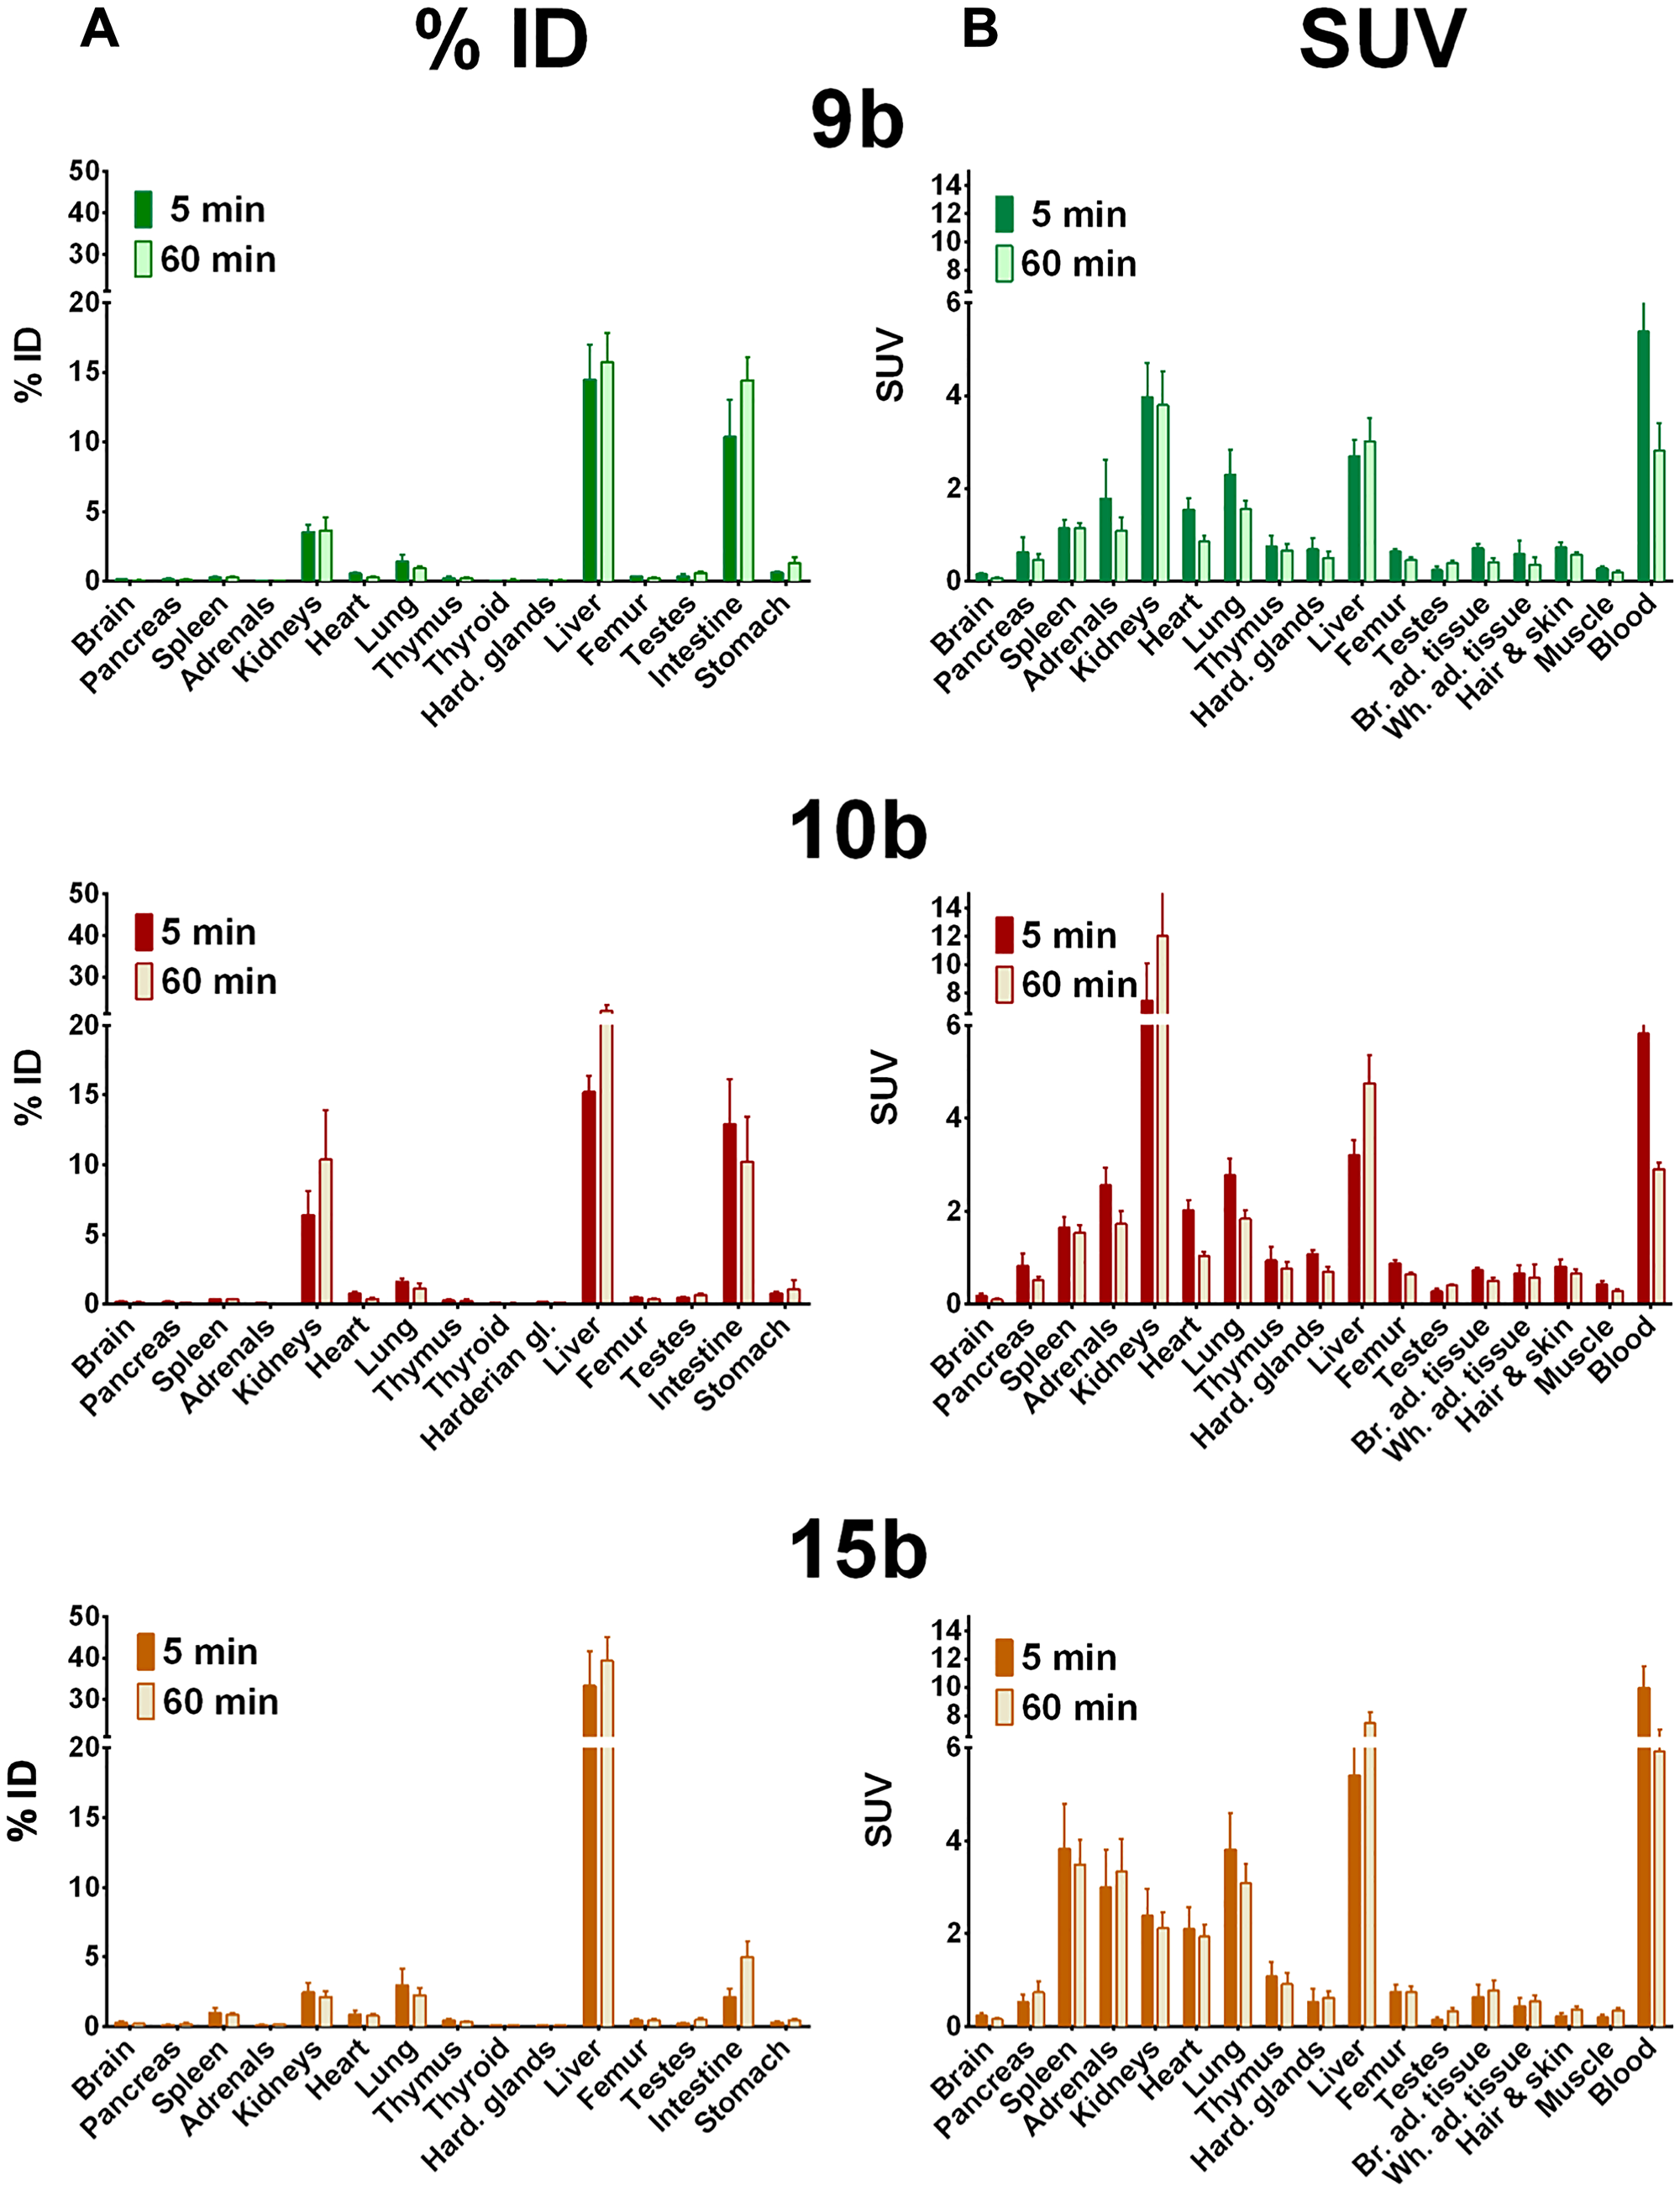
Figure 3: Biodistribution of 68Ga-radiotracers in healthy rats. Biodistribution of 68Ga-radiotracers 9b, 10b and 15b in healthy male Wistar rats after single intravenous injection at 5 and 60 min, the activity amounts in selected organs are expressed as percent of the injected dose (A, % ID) and the activity concentrations in the tissues are given as standard uptake values (B, SUV).
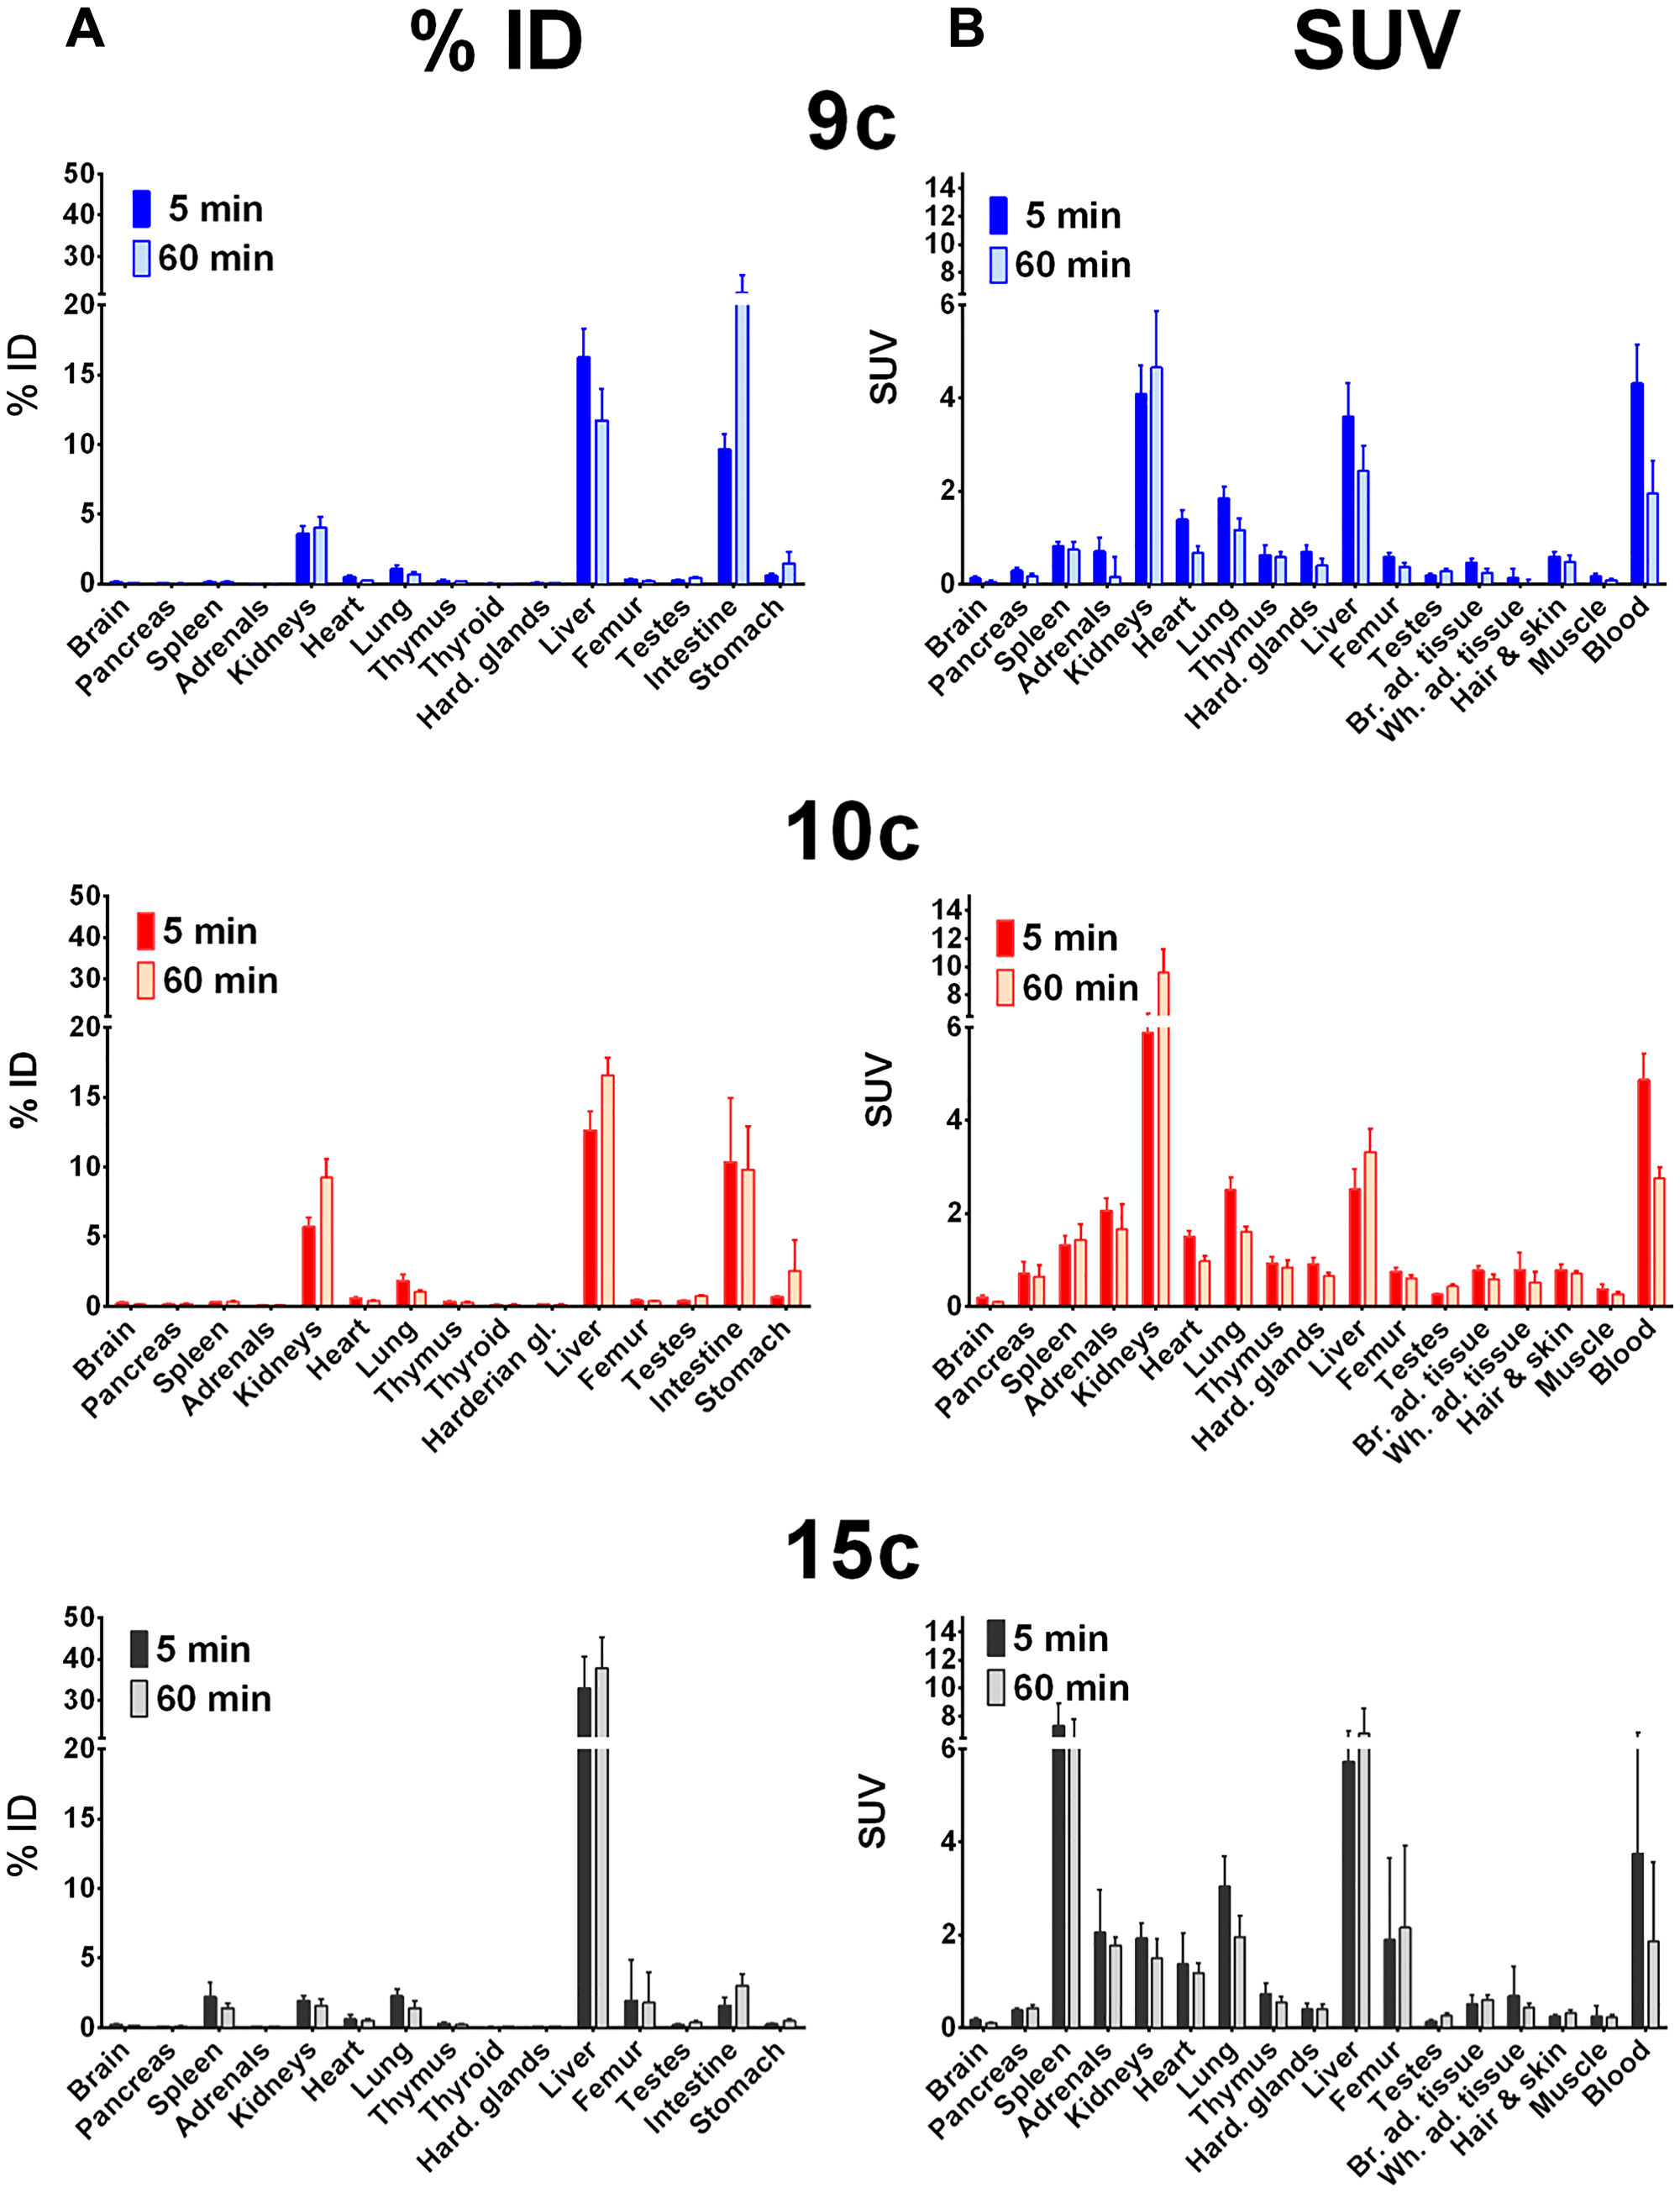
Figure 4: Biodistribution of 64Cu-radiotracers in healthy rats. Biodistribution of 64Cu-radiotracers 9c, 10c and 15c in healthy male Wistar rats after single intravenous injection at 5 and 60 min, the activity amounts in selected organs are expressed as percent of the injected dose (A, % ID) and the activity concentrations in the tissues are given as standard uptake values (B, SUV).
In general, all compounds followed the tissue perfusion and were rapidly released from the tissues with minor or slow decrease of the radiotracer concentrations in most organs between 5 and 60 min. The accumulation and diffusion of the radiotracers in the tissues primarily depended on their concentration in arterial blood. Hence, 9b-c, 10b-c and 15c showed relative high levels in the blood after 5 min (SUV = 4–6, Figure 3 and 4B) that remained also after 60 min (SUV = 2–3). In contrast, the level of the 68Ga-labeled palmitoylated tracer 15b was remarkably elevated in blood with a SUV twice as high as the other radiotracers (from 10 to 6 within one hour).
Interestingly, biodistribution of 68Ga- and 64Cu-radiotracers followed nearly the same pattern. At 5 min after injection, 68Ga- and 64Cu-radiotracers showed only minor differences with the notable exception of 68Ga-15b, which was present in blood in higher concentration than 64Cu-15c as described. At 60 min higher amounts of 68Ga-radiotracers 9b and 15b were found in most organs compared to 64Cu-radiotracers 9c and 15c except in intestine where surprisingly high amount of 9c was observed and in the spleen that showed higher amount of 15c. In contrast, no significant difference in the amounts of 68Ga-10b and 64Cu-10c was detected.
In addition, all radiotracers presented a major hepatobiliary and intestinal elimination (Figure 3A and 3B). Concentration of 9b stayed constant in liver (15% ID) while increased concentrations of 10b was observed within one hour (15 to 22% ID) reflecting liver accumulation. The palmitoylated tracer 15b exhibited the highest but constant concentration in the liver within one hour after injection (± 35% ID) probably because of the high lipophilicity of the palmitoyl chain. In intestine, uptake of 9b increased from 10 to 14% ID whereas concentration of 10b stayed constant (10–13% ID) and concentration of 15b was remarkably low (< 5% ID). In contrast to hepatobiliary and intestinal clearance, a minor renal clearance was observed for all tracers. Hence, kidney uptake was low for tracers 9b and 15b (< 4% ID) and moderate for 10b although concentrations of the latter one increased from 6 to 10% ID within one hour.
Among other organs, the concentration of the palmitoylated analogs in the spleen was remarkable. 15b showed high but constant concentration (3.5 to 3.8 SUV) while 15c reached the highest uptake of 6.5 to 7.4 SUV within one hour. At last, although low, the brain uptake was not negligible. An approximately 2-fold decrease in uptake of all radiotracers was observed within one hour after injection. The radiotracers were still detectable in brain with 0.06 to 0.1 SUV for 9b-c, 10b-c, and 15c, and 15b reaching the highest concentration with 0.16 SUV.
The three radiotracers were differently accumulated in the stomach, a natural GHS-R1a expressing organ. The activity amounts were comparable for rat and mouse (Figures 3–7). The 10c amount in the stomach was larger than that of the other compounds. This accumulation of 10c in an organ expressing the Ghrelin receptor could be an indication of specific binding to the GHS-R1a.
The direct comparison of the biodistribution of 10b and 10c in healthy Wistar rats shows that the liver uptake of 10b and 10c is relatively fast and increased only slowly, and the 68Ga compound had a slightly higher liver uptake than the 64Cu labeled compound. This demonstrates that the liver uptake is primarily caused by the ghrelin derivative itself and not by the copper release from the chelate complex with NODAGA.
PET imaging and kinetics of radiolabeled Ghrelin inverse agonists in rats
Representative maximum intensity projections of the activity distribution at 60 min after injection and time-activity curves in kidneys, liver, heart and spleen of all tracers are shown in Figure 5. The results were consistent with biodistribution studies. 9b and 9c were broadly distributed in all organs and sustained concentrations were observed in heart, kidney and liver. High concentrations of 10b are visible in liver, kidney and circulation, whereas 10c was mainly retained in kidney after one hour. Images of the palmitoylated tracers 15b and 15c highlighted their major hepatic clearance but also showed elevated activity in the circulation (visible in heart and jugular veins) and low concentration in the kidney. In addition, accumulation of the 64Cu-labeled radiotracers (9c, 12c, 15c) in the spleen was detectable.
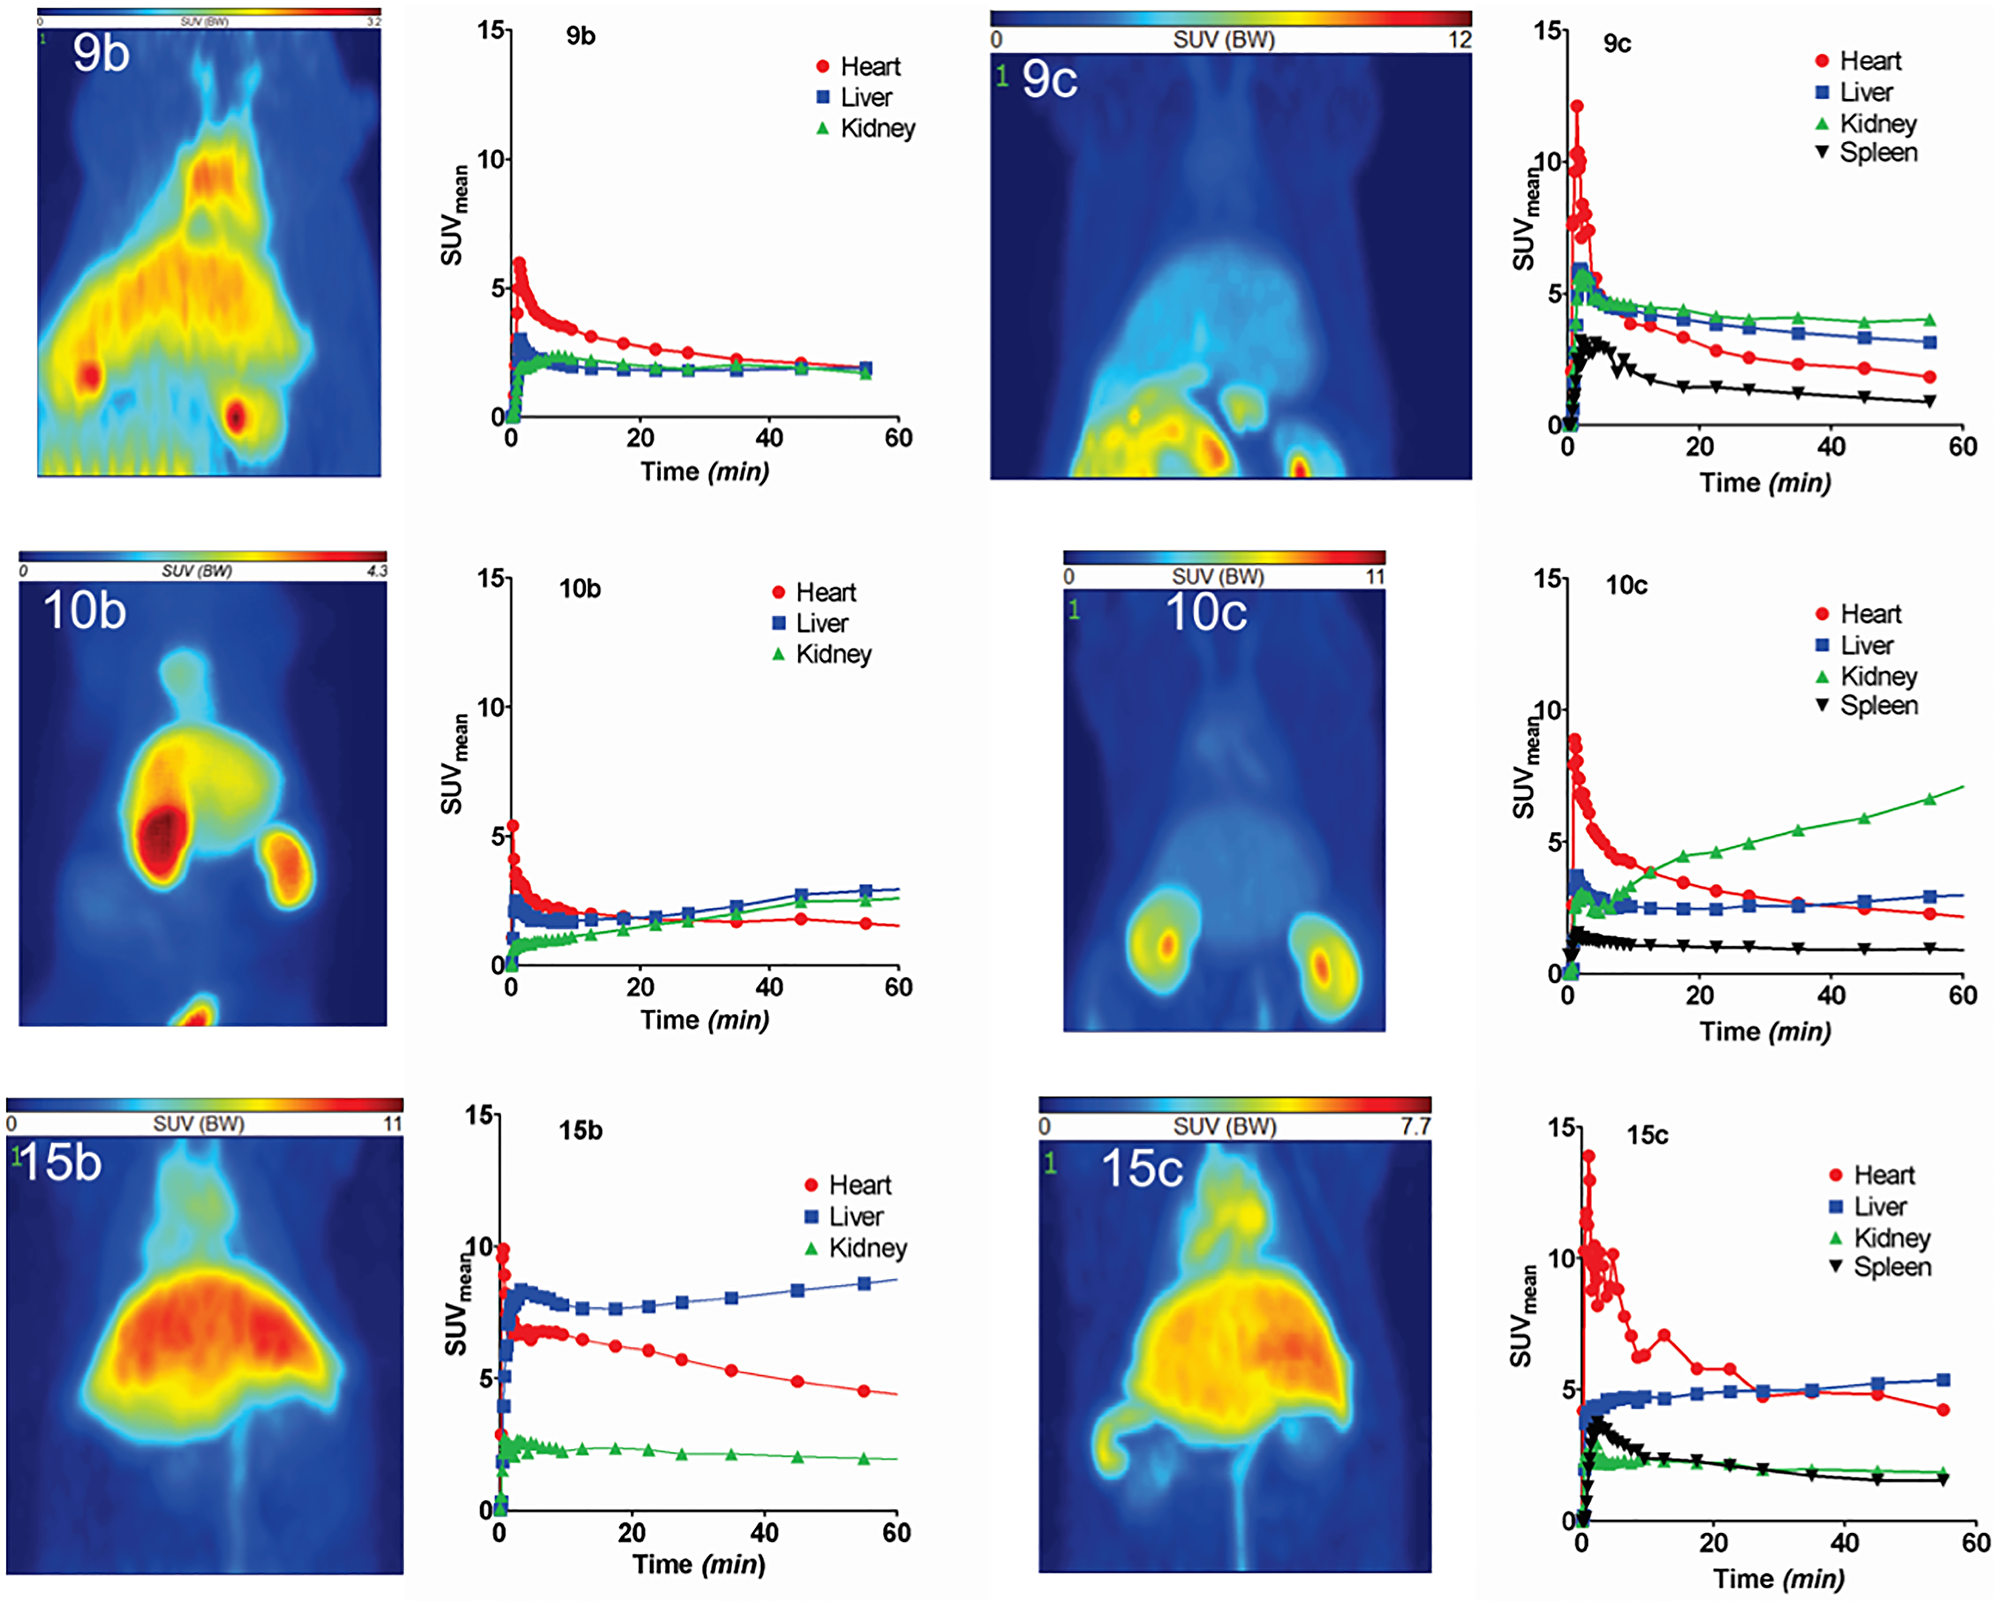
Figure 5: PET studies of 68Ga- and 64Cu-labeled radiotracers in healthy rats. PET studies of radiotracers 9b, 9c, 10b, 10c, 15b and 15c in Wistar rats. The images represent the maximum intensity projections of the radiotracer distribution 1 h after injection. The figures show the time-activity curves in the clearly visible and definable organs (dynamic measurement over one hour). Values are given as SUVmean.
The PET experiments show relative slow elimination from the blood and accumulation in liver, kidneys and spleen. The 64Cu-images show more details in PET in comparison to the 68Ga-images.
Biodistribution of [64Cu]Cu-NODAGA-NH-K-K-(D-1-NaI)-F-w-L-L-NH2 (10c) in DU-145 and PC-3 tumor bearing mice
The 64Cu-labeled 10c was selected for the further biopharmaceutical evaluations because of the high molar activity of the 64Cu-compounds, the best imaging properties of 64Cu, the lower efficacy, awaiting lower pharmacodynamic side effects, and the simpler synthesis without Palm conjugation, and the resulting lower lipophilicity. The lipophilicity is indicated from the earlier elution in the C-18 chromatography. The Figure 6 show the DU-145 and the Figure 7 the PC-3 biodistribution data.
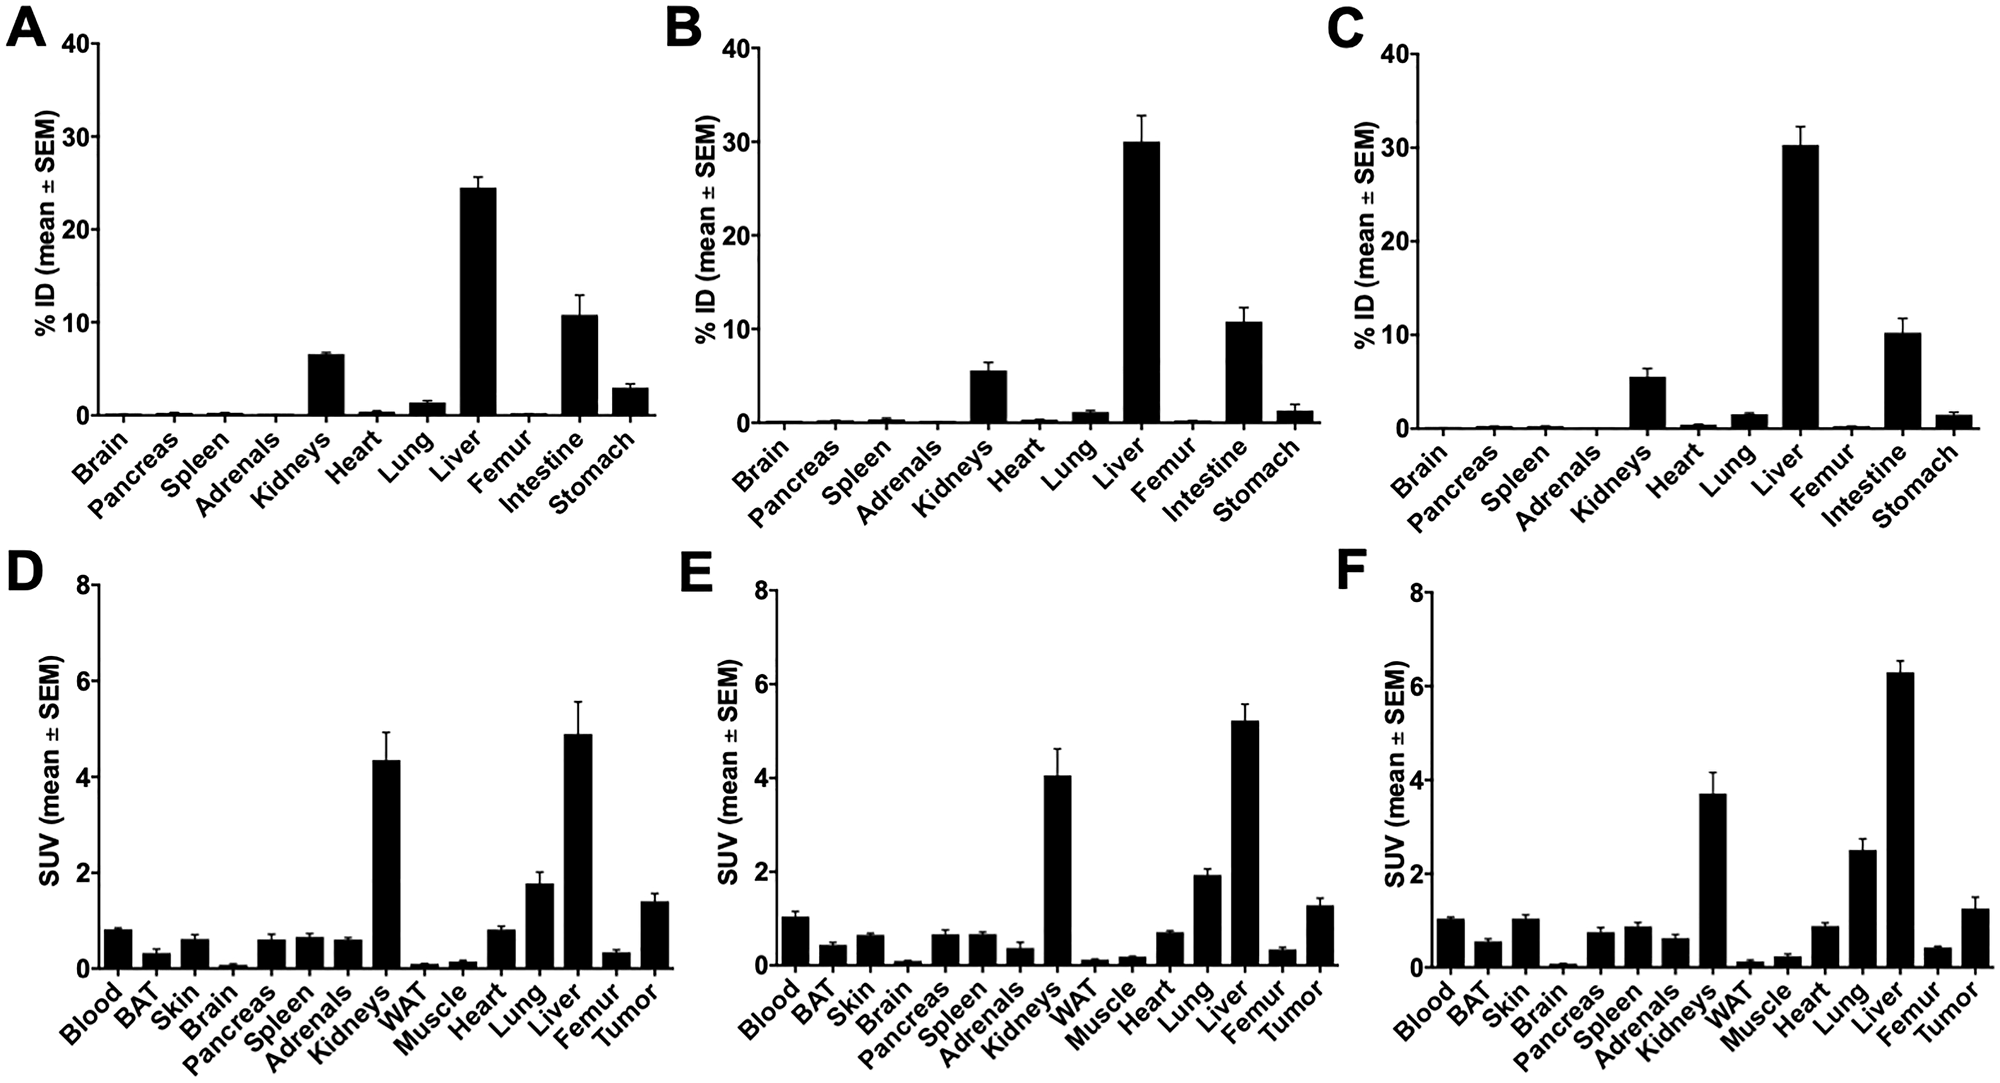
Figure 6: Biodistribution of 10c in DU-145 tumor bearing NMRI nu/nu mice 60 min p.i. Biodistribution of 10c in DU-145 tumor bearing NMRI nu/nu mice 60 min p.i. (A, D) Control. (B, E) Blocked with 1 mg/kg body weight Ghrelin. (C, F) Blocked with 1 mg/kg body weight KKD. Values are presented as % ID and SUV as mean ± SEM of three animals.
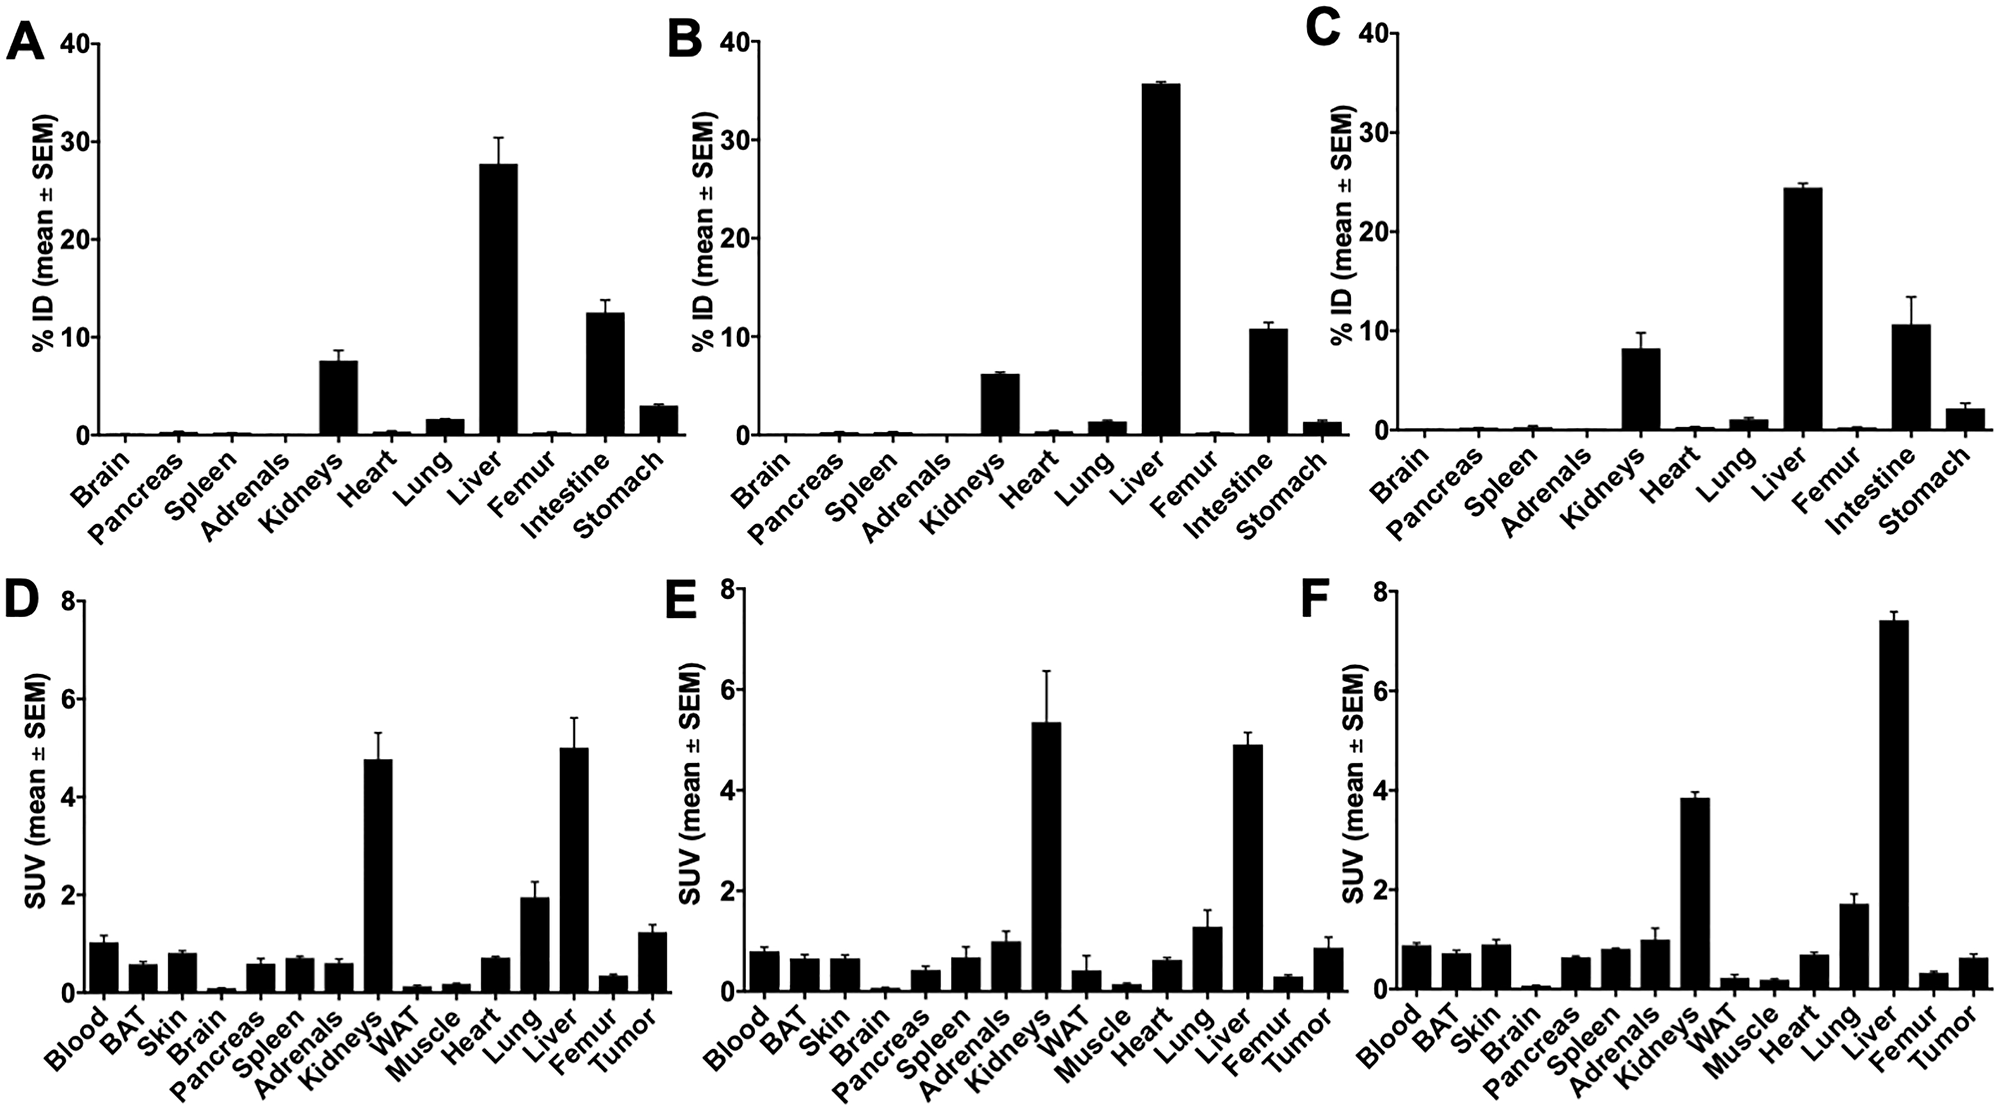
Figure 7: Biodistribution of 10c in PC-3 tumor bearing NMRI nu/nu mice 60 min p.i. Biodistribution of 10c in PC-3 tumor bearing NMRI nu/nu mice 60 min p.i. (A, D) Control. (B, E) Blocked with 1 mg/kg body weight Ghrelin. (C, F) Blocked with 1 mg/kg body weight KKD. Values are presented as % ID and SUV as mean ± SEM of three animals.
In general, the activity concentration (SUV, mean ± SEM) was highest in the liver (3.90 ± 0.87), kidneys, tumor, heart, lung, testes, ovaries, spleen, blood, uterus, skin, pancreas, adrenals, femur, brown adipose tissue (BAT), brain, white adipose tissue (WAT), and lowest in muscle (0.29 ± 0.07). Between all these tissues, only the skeleton muscle was not reported in the literature to contain significant amounts of GHS-R. The skeleton muscle was therefore used as reference tissue for the background.
The comparison of the activity amounts and concentrations between control and competition experiments showed blocking effects in the tumors and stomach (Figure 8). In both tissues was the accumulation of 10c decreased by Ghrelin and KKD. The largest blocking effect was observed at one hour after injection in the PC-3 tumors with KKD. The tumor to muscle ratios, calculated as percent of control, were decreased with Ghrelin and KKD for PC-3 to 83.4 ± 18.4% and 51.2 ± 4.5% and the values for the DU-145 to 71.0 ± 10.7% and 59.7 ± 30.2%, respectively. In the PET experiments at one hour were the tumor to muscle ratios in PC-3 tumors decreased after blocking with KKD to 31.7 ± 0.7% and to 43.7 ± 0.4% of Control. On the one hand, a significant decrease of 10c accumulation was also detected in testes, brain, and heart. On the other hand, a significant increase was observed for adrenals, lung, BAT and liver. This “blocking” pattern can be explained as a result of a “sink effect” of the broad distribution of GHSRs and other Ghrelin binding sites in the organism. In blocking experiments, the high concentration of Ghrelin and KKD after the simultaneous injection in the blood plasma liberates 10c from a number of binding sites in the organism. This increases the amount of free biologically available 10c and as result the activity was also increased in the adrenals, lung and liver, in organs with relatively large fractional blood volume. Nevertheless, there could be also compensatory effects like in spleen with no changes and in the BAT with low blood volume but with an increase of 10c concentration. This complex blocking effect pattern is a result of the wide distribution of the GHS-R1a in the organism. This demonstrates that 10c should allow tracing the Ghrelin receptor distribution in many tissues.
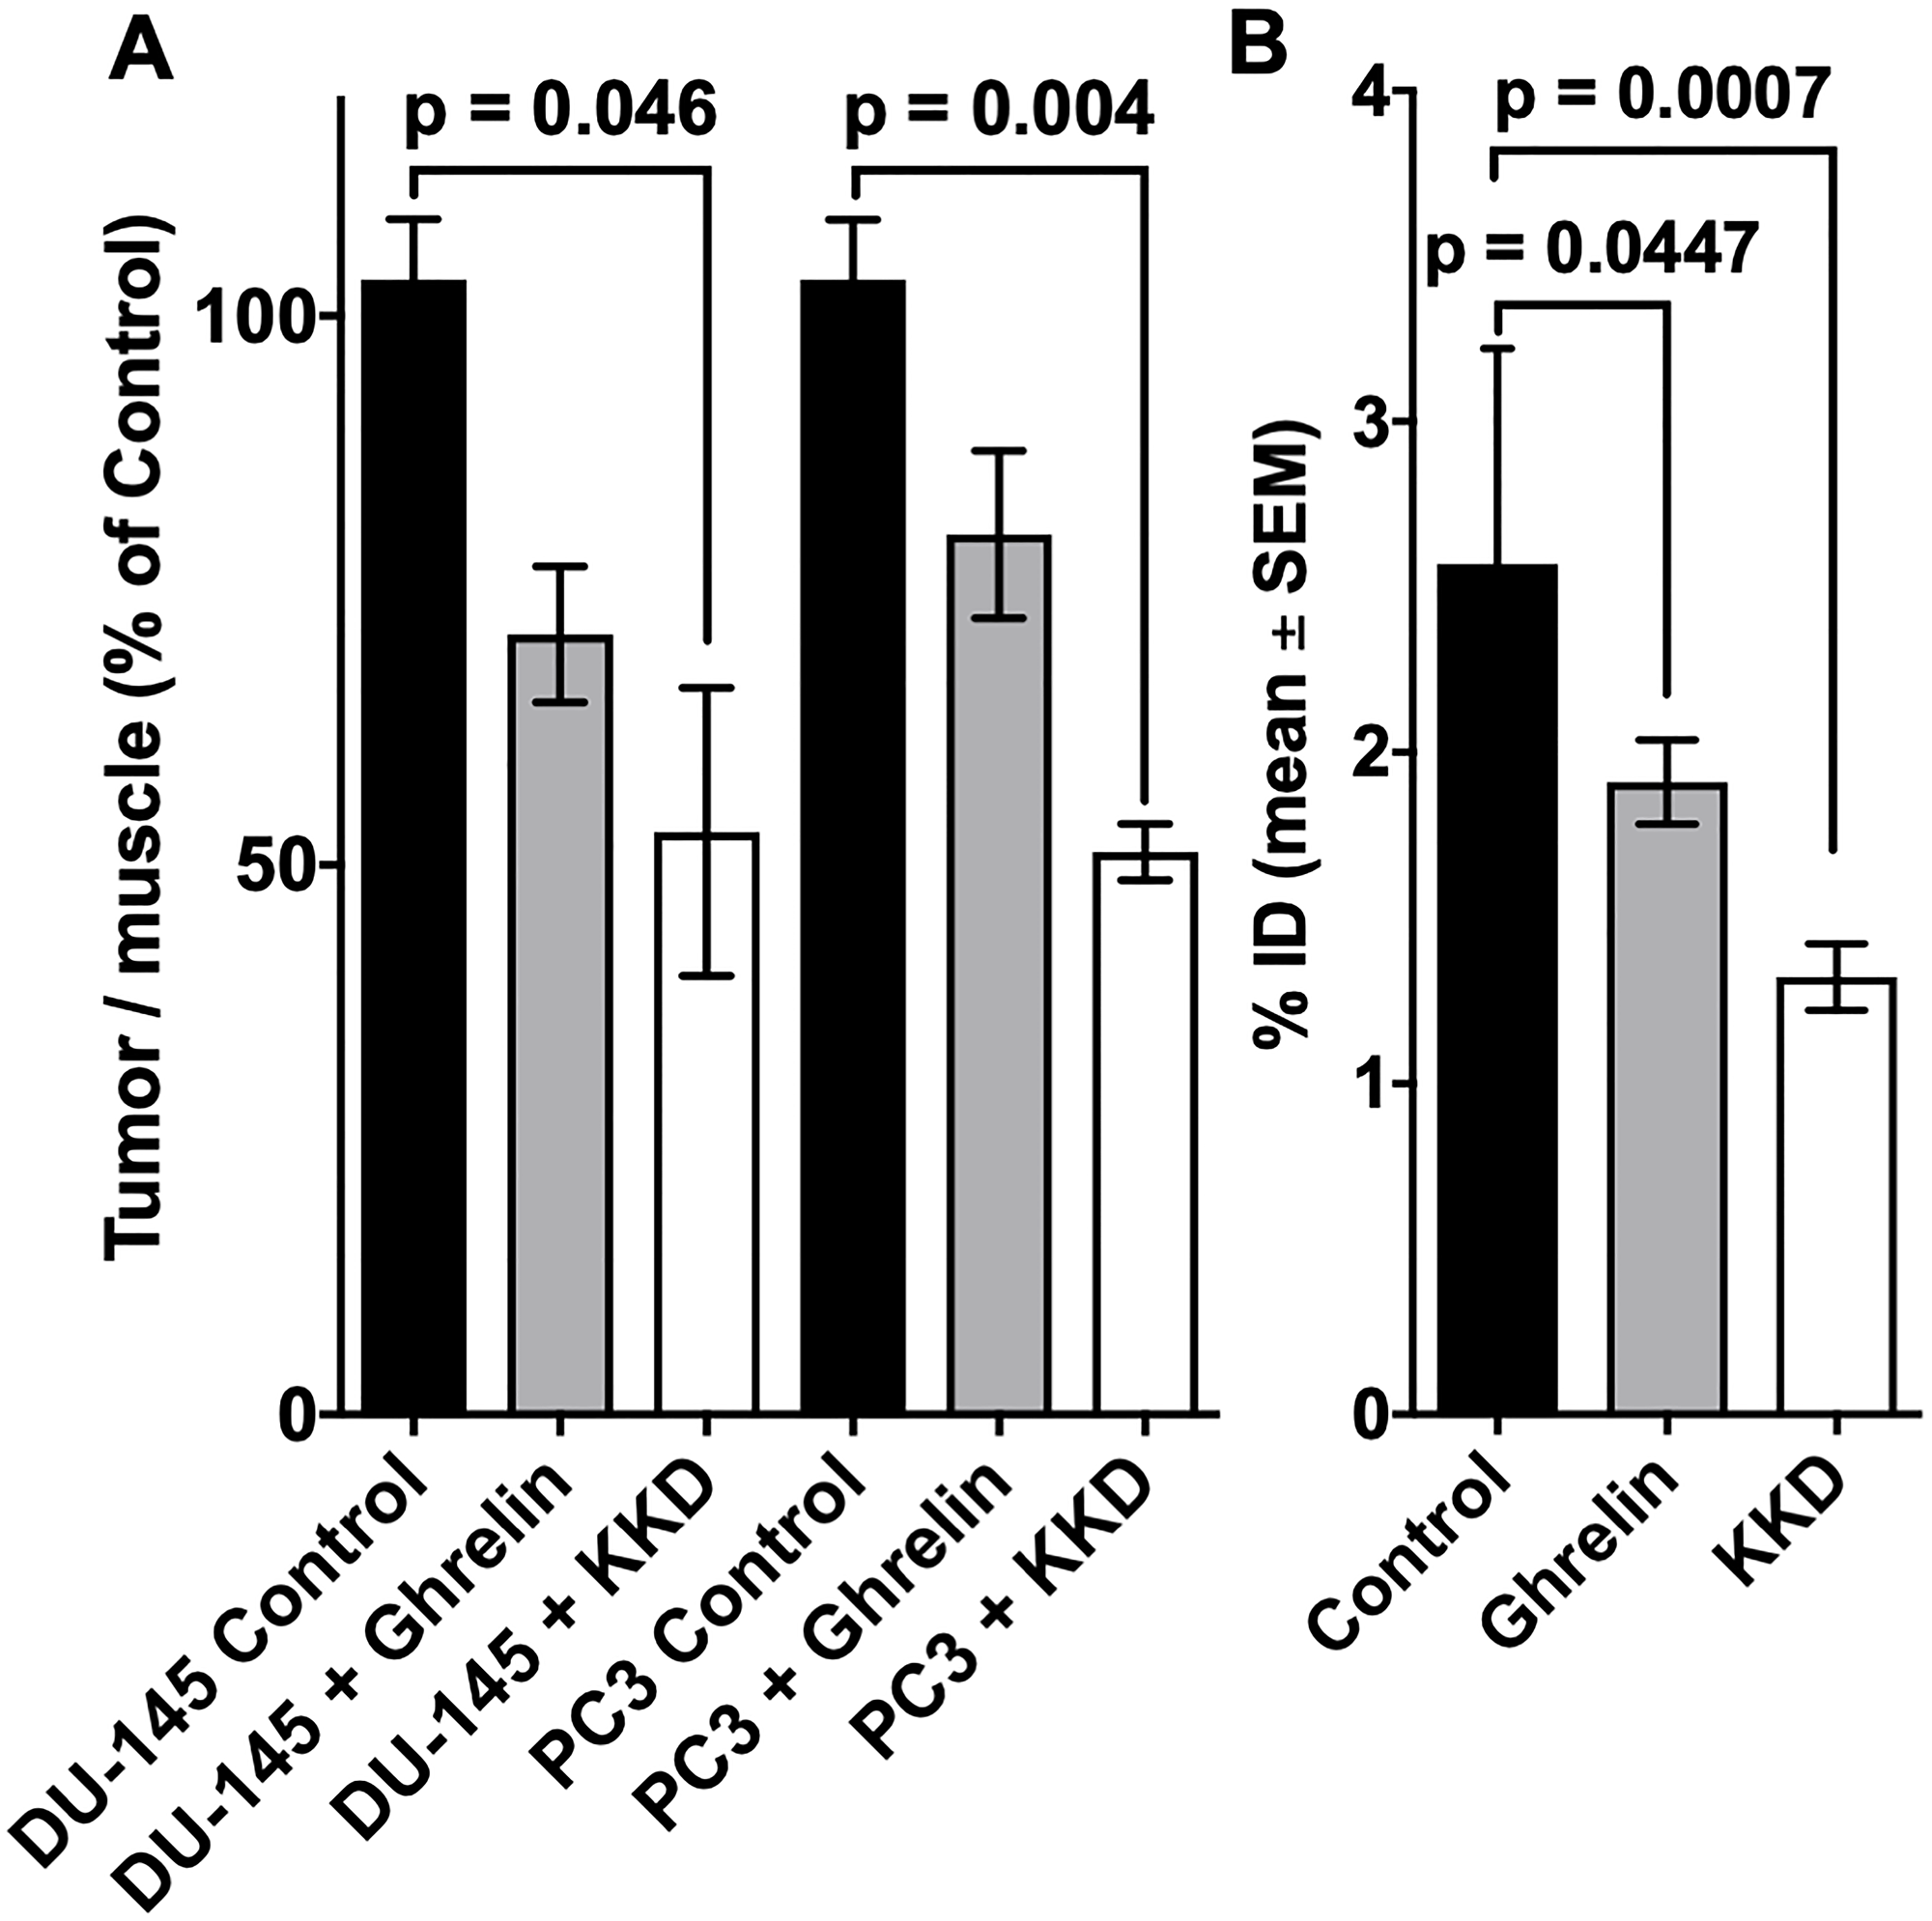
Figure 8: Blocking of 10c accumulation in tumors and stomach. The accumulation of 10c in the tumors (A) and stomach (B) at 60 min p.i. of Control and blocked with 1 mg/kg body weight Ghrelin or KKD in mice xenografted with DU-145 or PC-3 tumors. The tumor to muscle ratio is presented as % of Control and the stomach activity as % ID. All values are expressed as mean ± SEM of three animals in each tumor (A) and six animals’ stomachs (B).
PET imaging and kinetics of [64Cu]Cu-NODAGA-NH-K-K-(D-1-NaI)-F-w-L-L-NH2 (10c) in DU-145 and PC-3 tumor bearing mice
The 10c biodistribution and -kinetics was also studied by small animal PET (Figures 9–11). The tumors (PC-3, DU-145) were clearly visible in these representative images (Control). However, the activity distribution in the tumors was relative heterogeneous following the heterogeneity of the tumor tissue. An additional reason is the high interstitial pressure in the tumor center decreasing the perfusion. The highest levels of 10c were in the liver and kidneys. In the most PET studies, also the thyroid gland was visible, which could not be measured in the extractive biodistribution experiments. This was surprising because of the very small size of the thyroid. The simultaneous injection of KKD with the 10c (lower part of Figure 9) reduced the activity concentration also in this tissue. In contrast to the biodistribution, the 10c uptake in stomach could not be studied, because of the close anatomical position of the stomach to the liver and kidneys with its high activity uptake. The stomachs relative thin wall caused a spill with the surrounding tissues that didn´t allow clear visualizing of the stomach in the PET images.
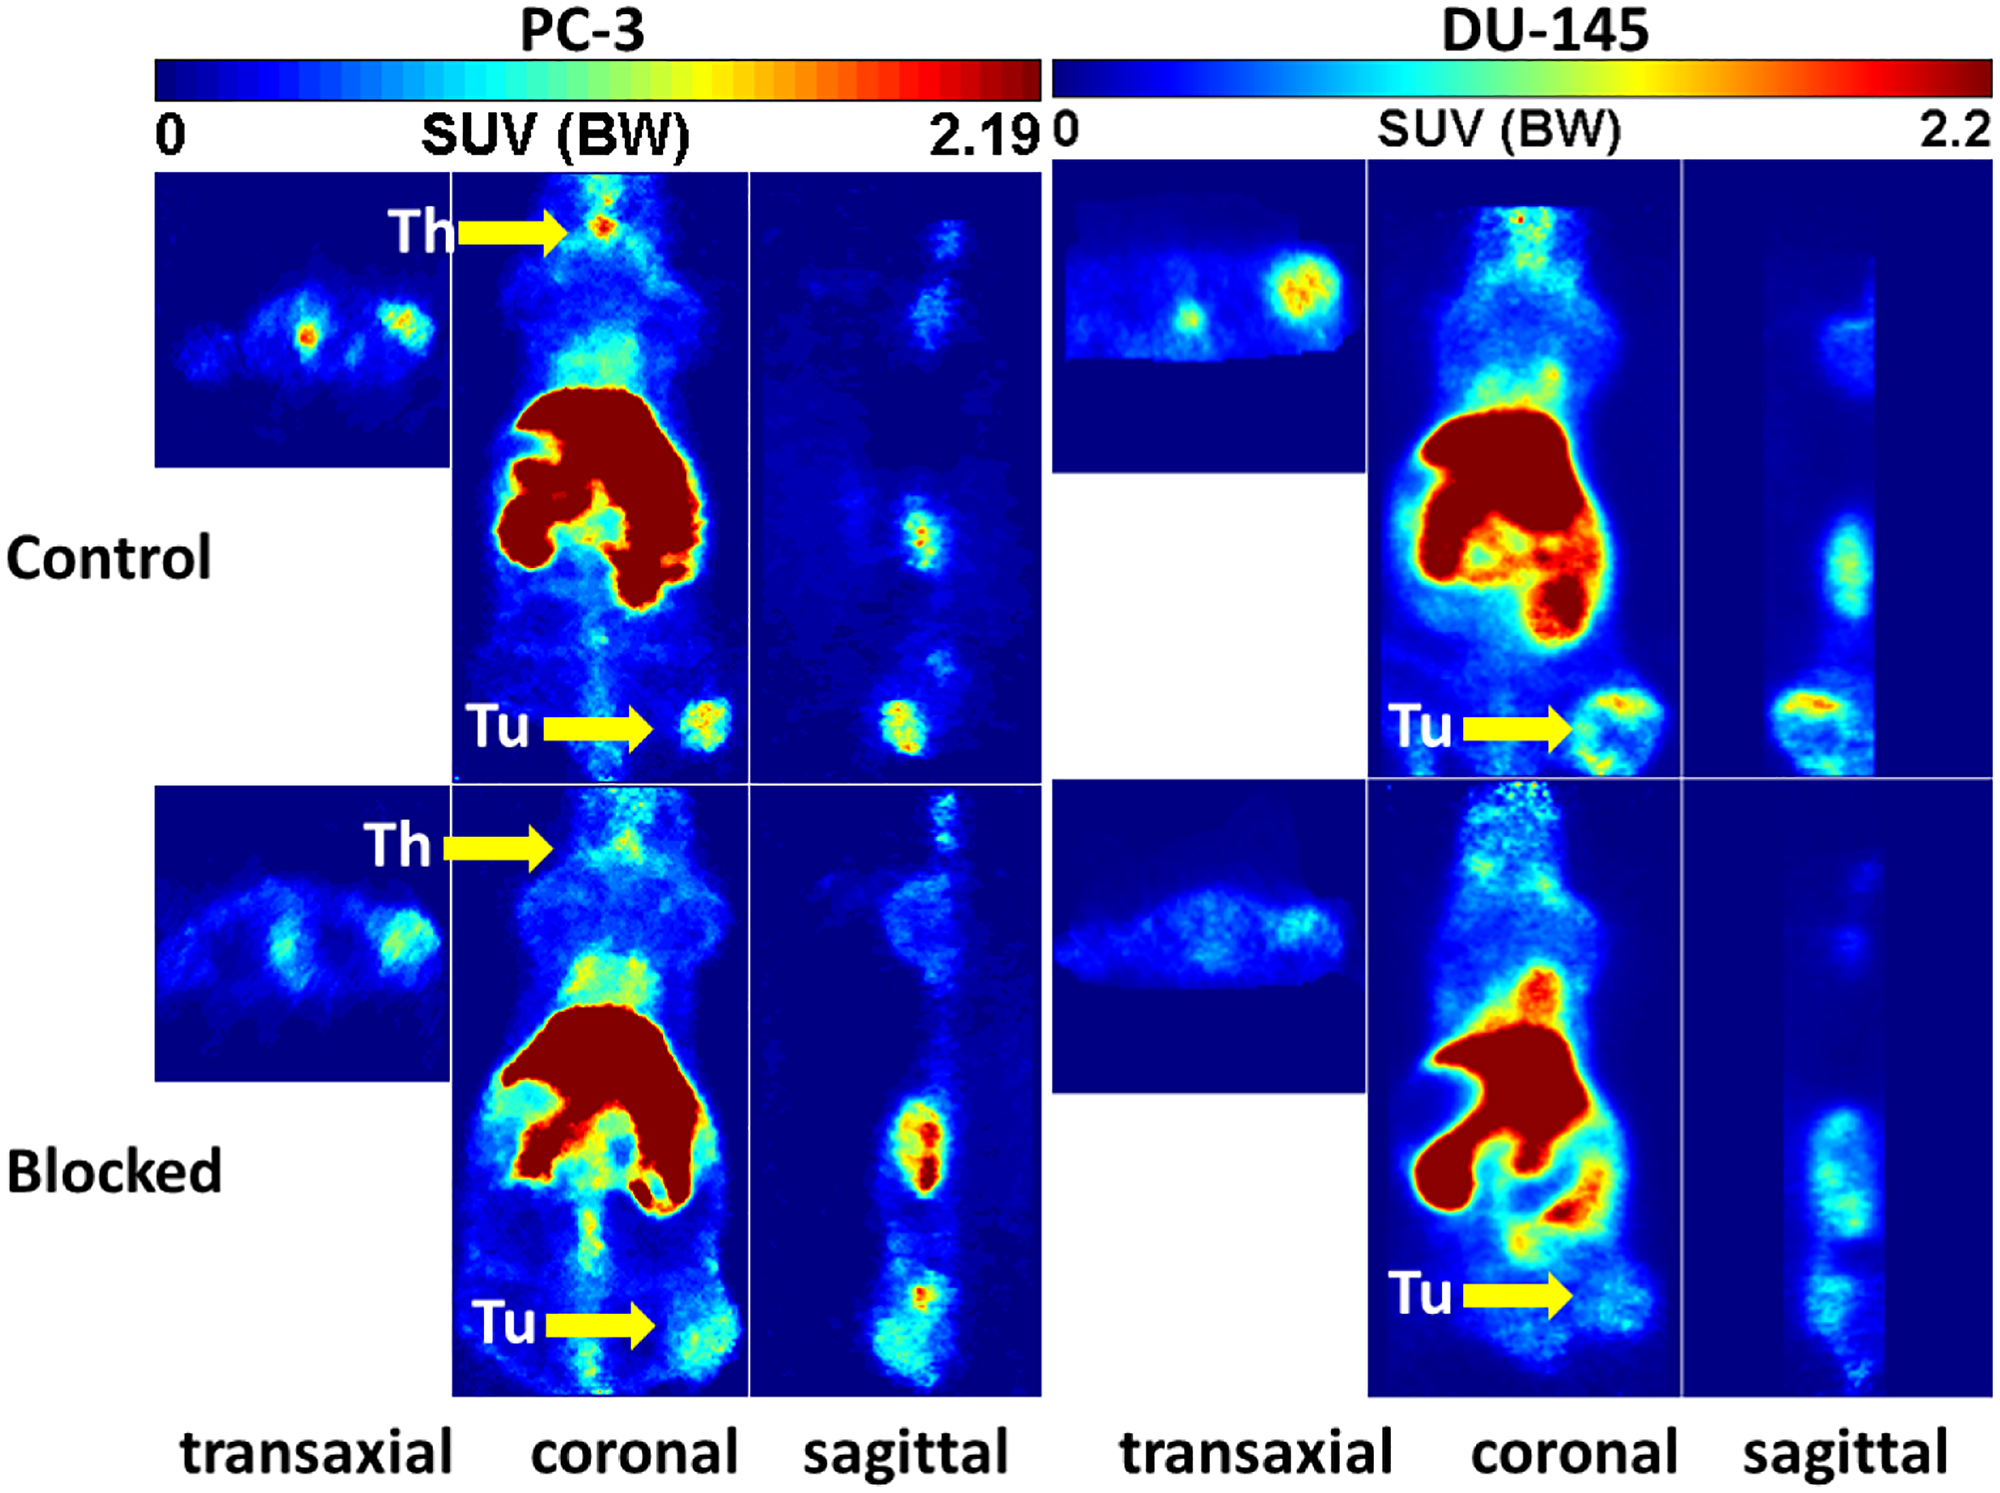
Figure 9: Representative orthogonal sections of PET studies. Representative orthogonal sections of PET studies with 10c in of PC-3 (left) and DU-145 (right) tumor-bearing NMRI nu/nu mice at 90 min midframe time (images were summarized from 60 min to 120 min). Typical Control (upper) and blocked mice (lower) by simultaneous injection of 1 mg/kg body weight of KKD are shown Abbreviations: Th, thyroid; Tu, tumor.
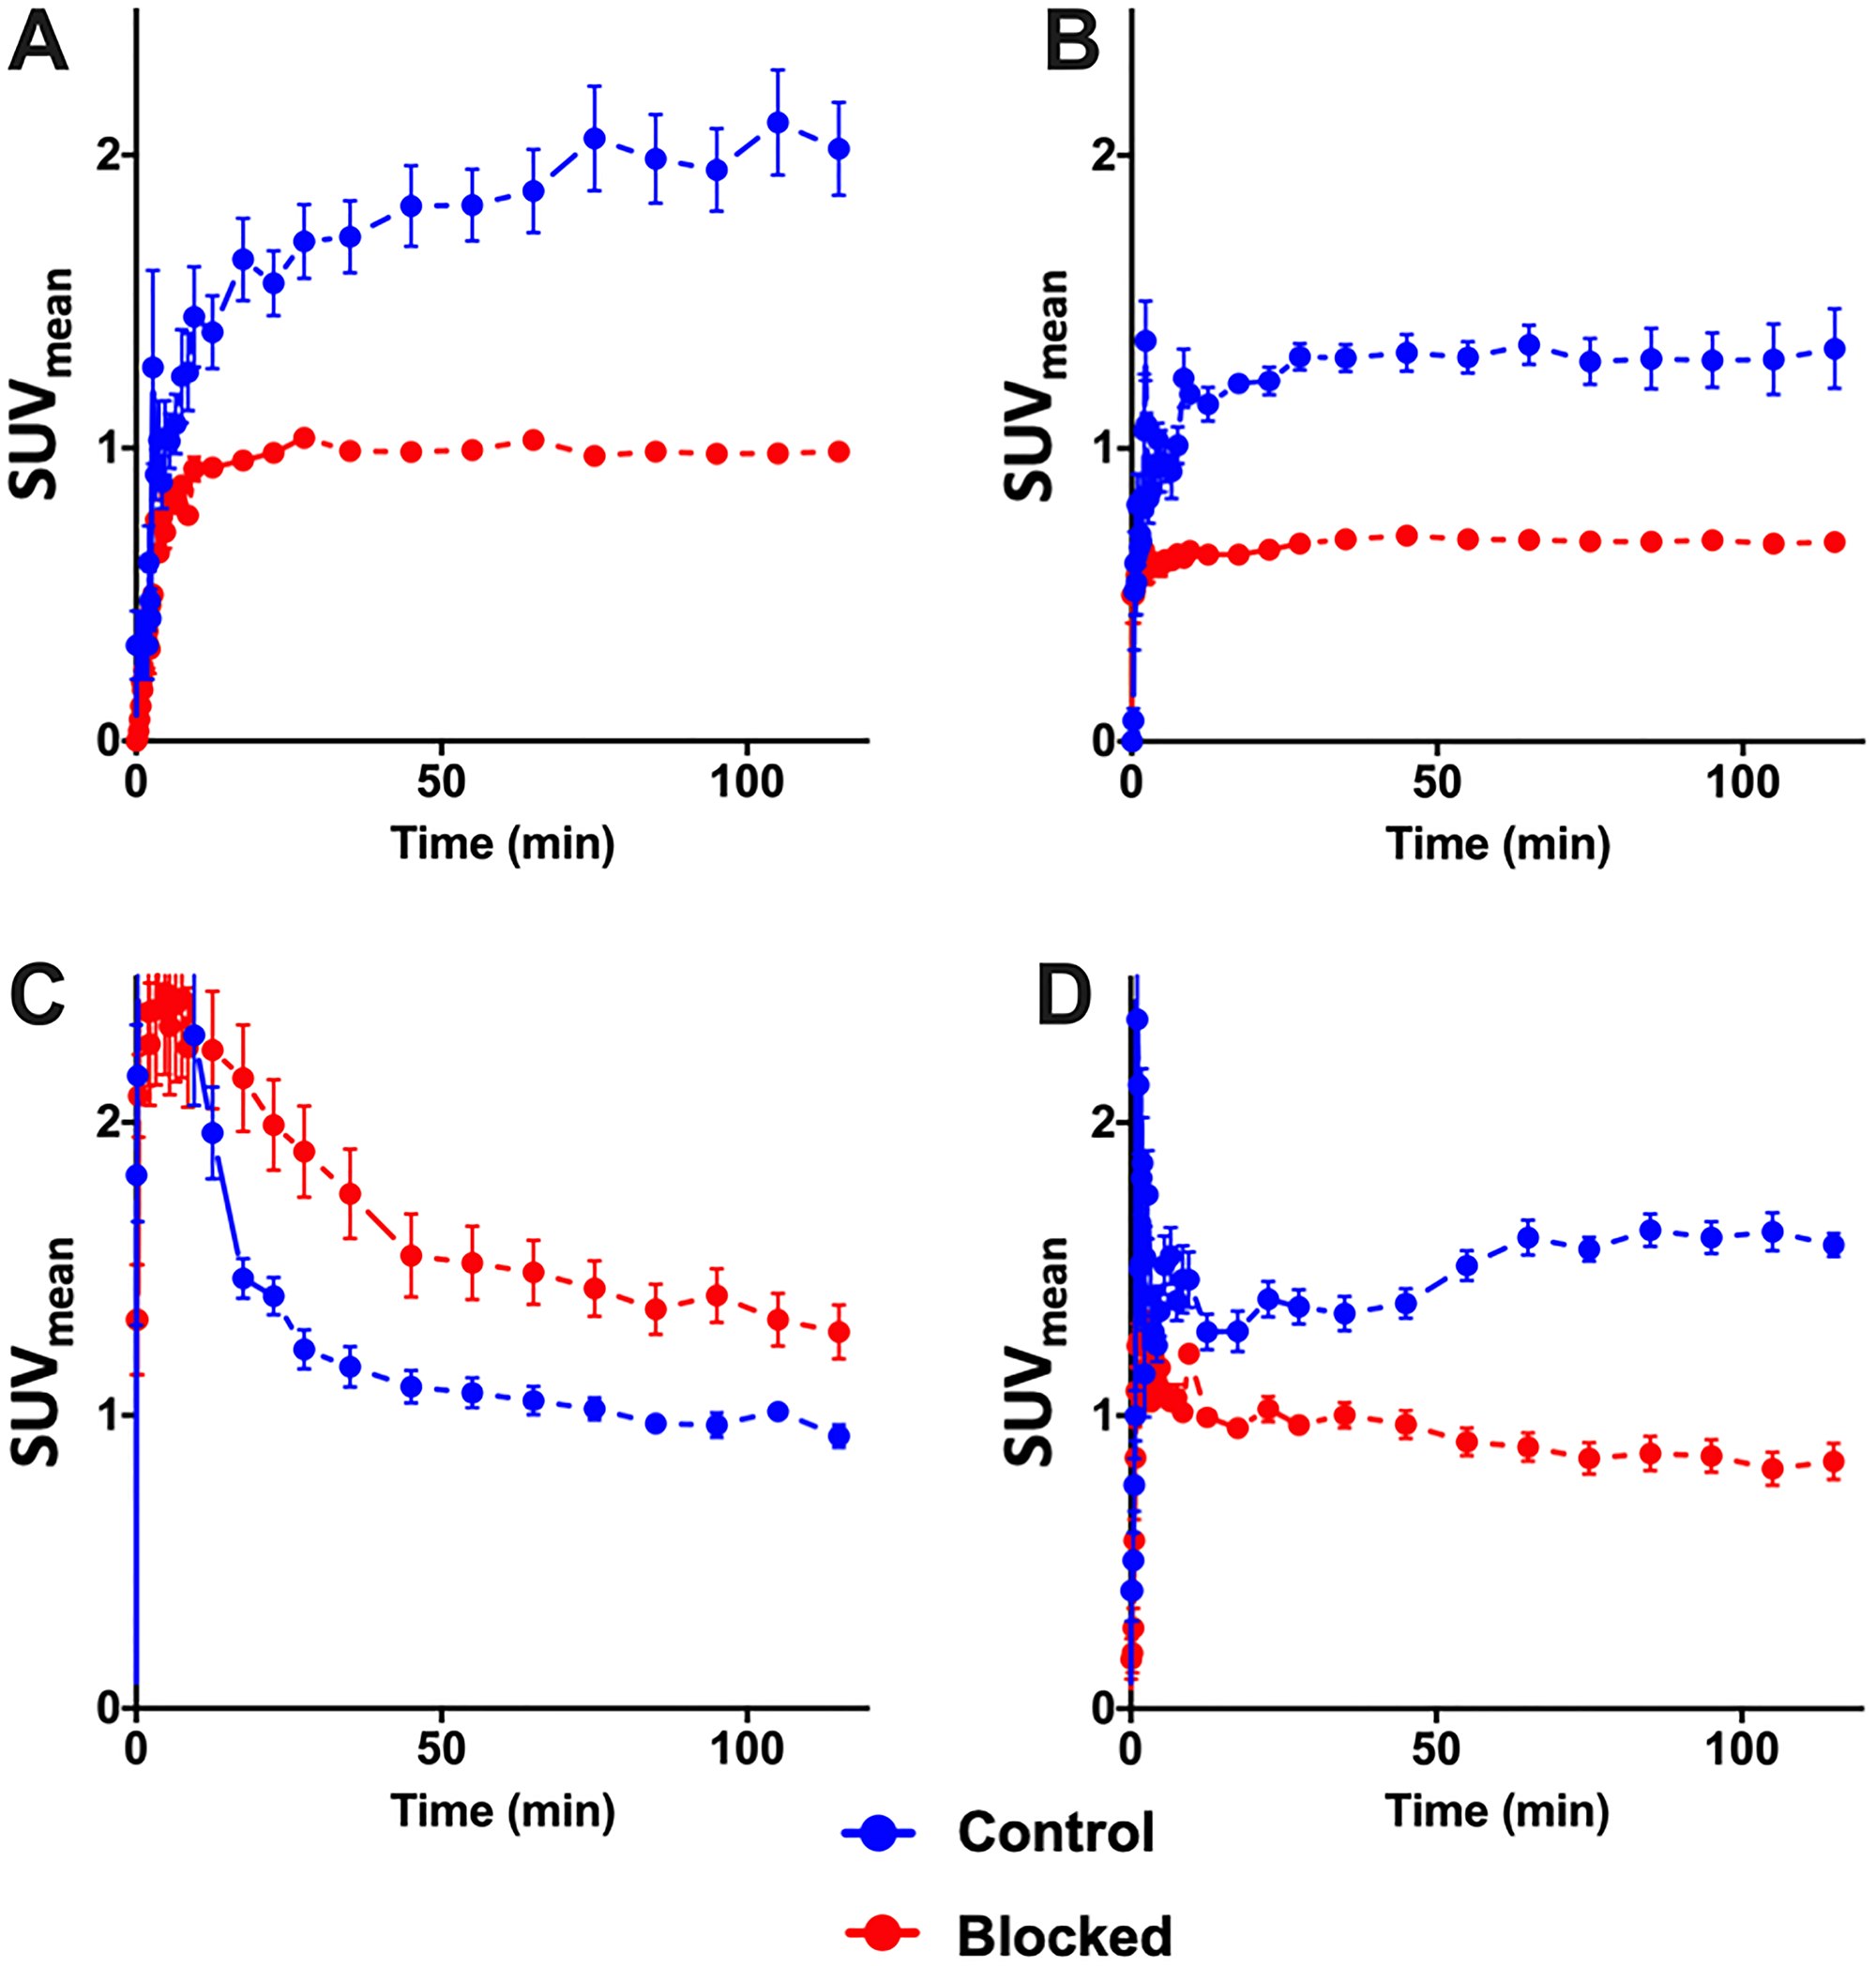
Figure 10: PET time activity curves. PET time activity curves of 10c in PC-3 (n = 3) (A) and DU-145 (n = 3) (B) tumors, in blood (C) (n = 6) and in the thyroids (D) (n = 6) of these animals. 10c was intravenously injected in the animals without (Control, blue) or with simultaneous injection (Blocked, red) of 1 mg/kg body weight of KKD. The curves show the mean ± SEM (SUV).
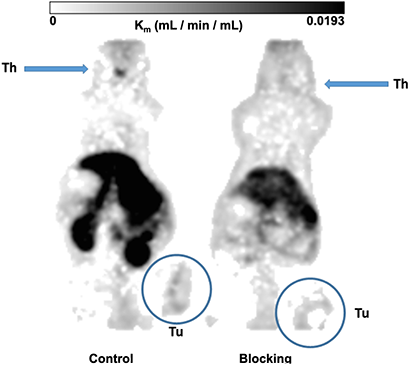
Figure 11: Metabolic trapping rate (Patlak Km) images. The metabolic trapping rate images (Patlak Km) of PC-3 tumor bearing mice after single intravenously injection of 10c were calculated from the dynamic PET studies and the image derived blood activity curves. The Control (left) clearly delineated the tumor and the thyroid. The simultaneous injection of 1 mg/kg body weight of KKD (blocking, right) decreased the metabolic trapping rate in the tumor and the thyroid. The further effects were the higher background by the elevated blood level and decreased kidney uptake.
The Figure 10 shows the kinetics of 10c. At the end of the measurement, at two hours after injection we measured the activity concentration in the PC-3 tumors [2.02 ± 0.28 SUV, (Control) and 0.99 ± 0.05 SUV (blocked)] and in the DU-145 tumors [1.34 ± 0.24 SUV (Control) and 0.68 ± 0.05 SUV (blocked)]. The activity concentration was slightly higher in the PC-3 than in DU-145 tumors. The blocking with KKD resulted in approximately two times lower concentration of the radiotracer in both tumor tissues. The incomplete blocking to the half of the 10c uptake seems to be caused by the relative high blood level, non-specific binding in the tissue and the sink effect from the whole-body distribution of the Ghrelin receptors. In the liver the release of 64Cu2+ from the NODAGA-complex [51] could. Similar effect of the competition with KKD showed the thyroid time–activity curve. The very low mass/volume (6 μL) of the thyroid in mice influenced the measured activity concentration by spillover with the surrounding tissue and low recovery of the PET signal. In contrast to the tumor and thyroid the blood concentration of 10c was increased after KKD injection, which also affected the blood clearance. The half-life of the 10c in the Control was 7.9 min and in the KKD blocked animals 23.6 min. This was caused by the competition of KKD not only on the GHS-R1a but also on binding sites in the organism important for the elimination of 10c that increased the blood background in the “blocked” animals. Exemplarily parametric metabolic trapping rate images (Patlak Km) were calculated from the blood curves and the dynamic PET images and are presented in Figure 11. This shows how the PET study with 10c allows for the modelling of whole-body tracer kinetics by directly estimating the metabolic rate constant based on a common irreversible two-compart kinetic model. In this case, the Patlak Km, image allows for the demonstration of the metabolic trapping that is dependent on the GHS-R1a density of the tissue and the heterogeneity of the distribution in the tumor. The blocking effect on the thyroid Km also demonstrated the presence and the GHS-R1a dependent radiotracer accumulation in this organ. A limitation of the parametric imaging was the use of the whole blood activity and not of the arterial blood. However, the slow tissue extraction of the 10c lowered this effect. The other limitation of this method in our example is that the tracer accumulation was not irreversible. It could be demonstrated that the 10c allows quantitative imaging of the Ghrelin receptor distribution within the organism.
Immunohistochemistry of GHS-R1a in tumors and stomach of the studied mice
To validate the presence of GHS-R1a in the tumors and mice studied an independent technology was applied. The immunohistochemistry of human prostate cancer xenografts in NMRI-Foxn1nu/nu mice showed that GHS-R1a was expressed in both DU-145 and PC-3 tumors (Figure 12). Mouse stomach also expressed the GHS-R1a and served as positive control.
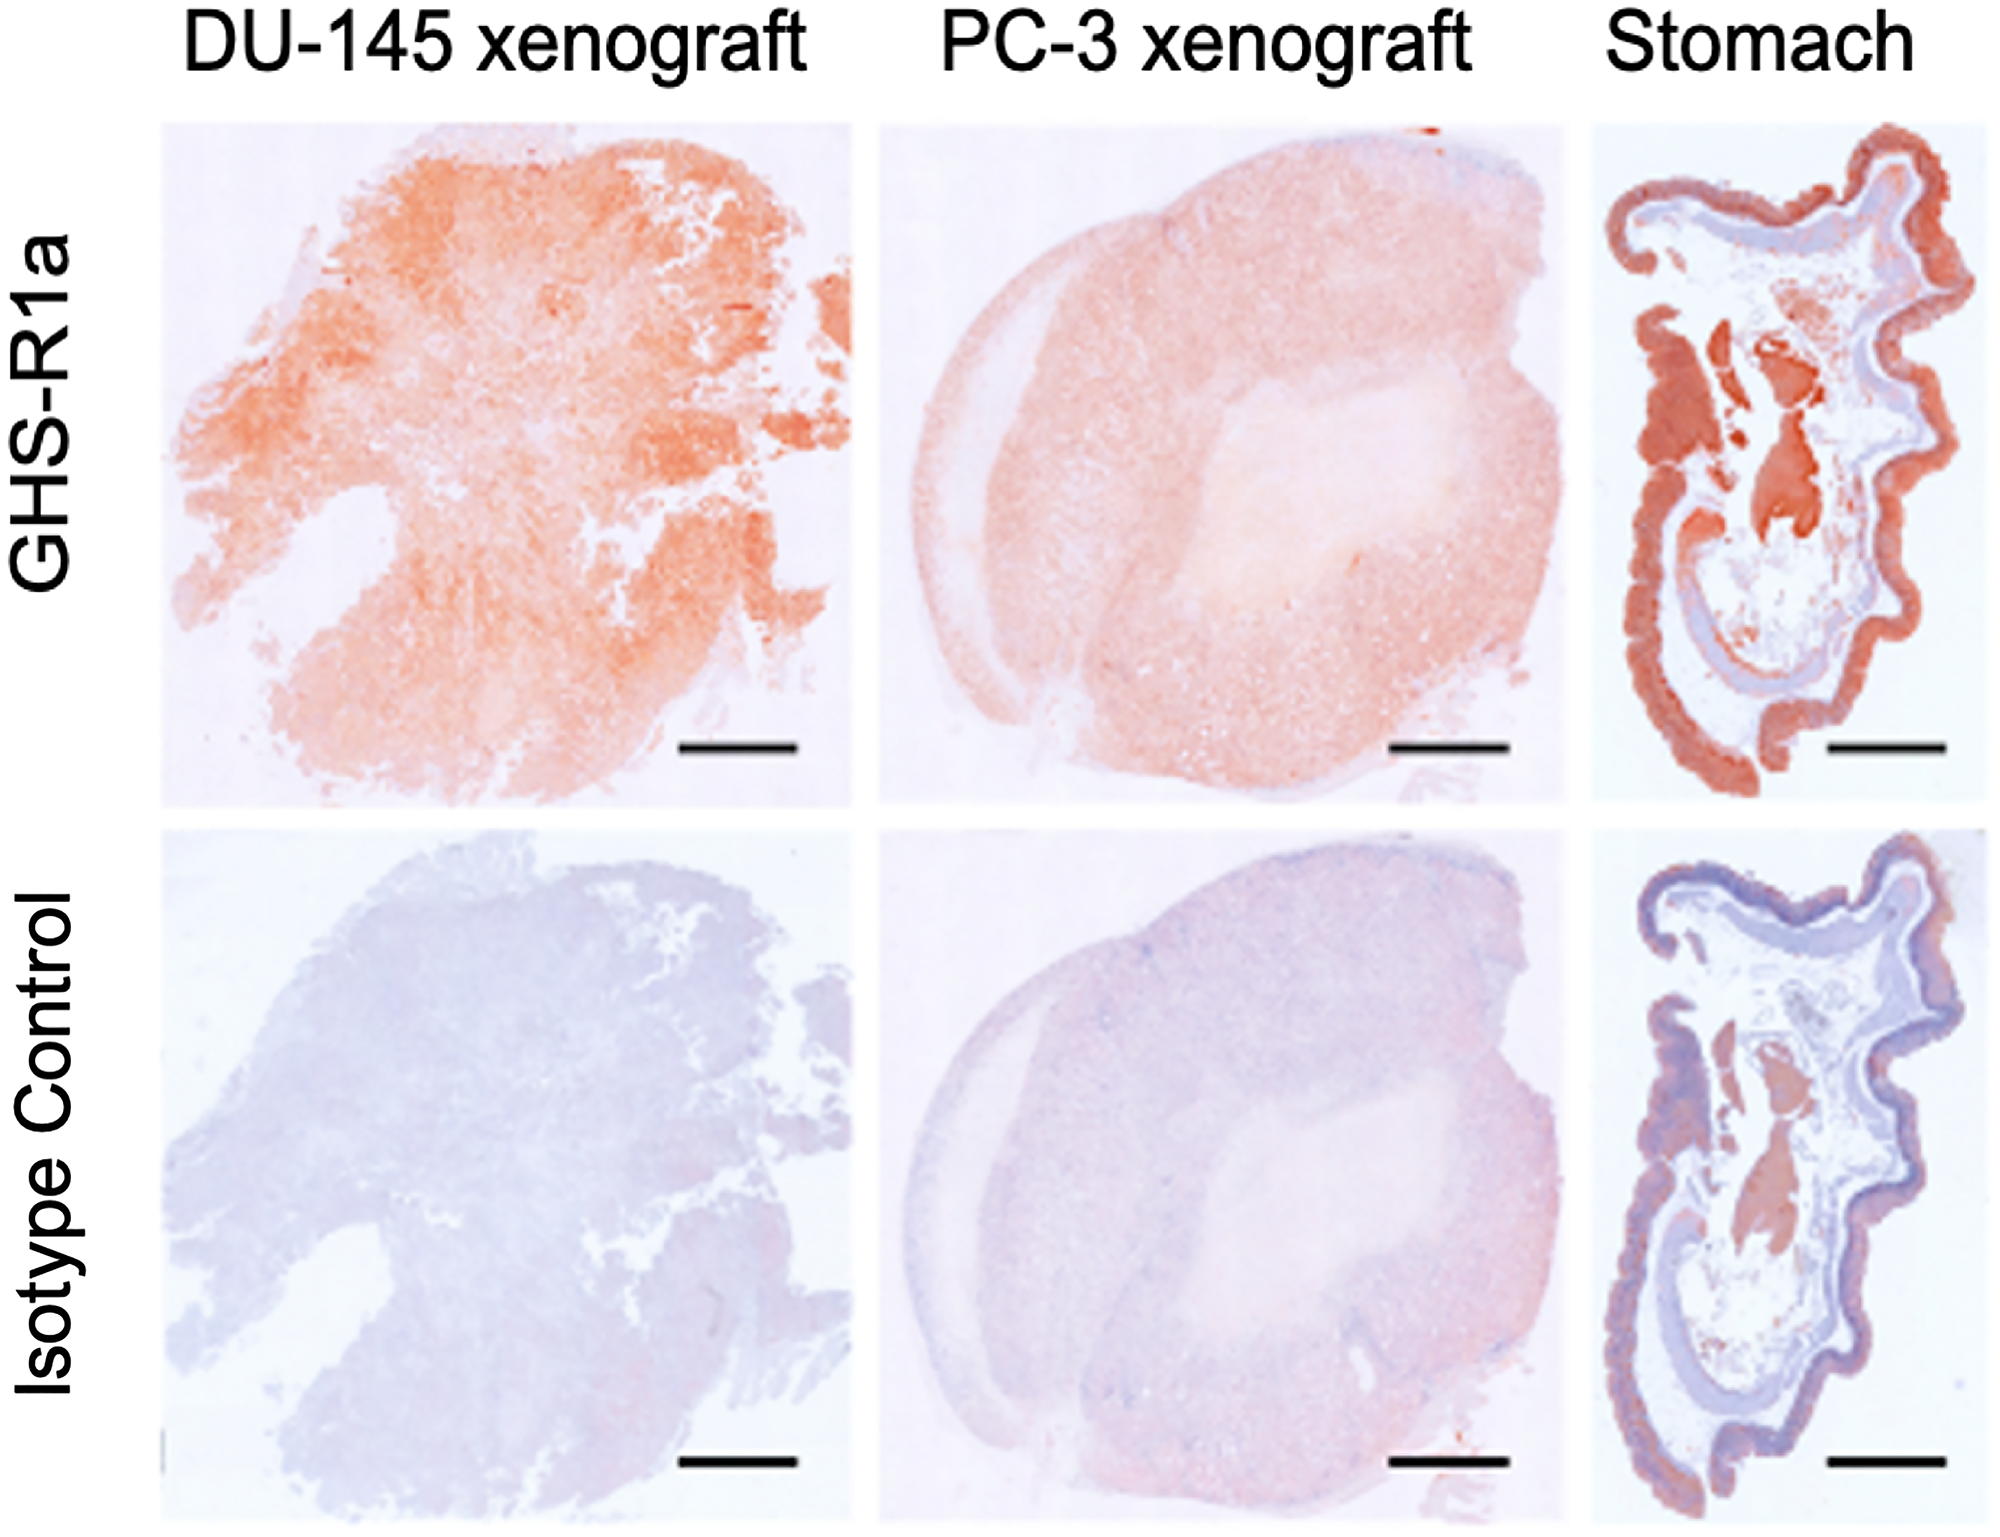
Figure 12: Immunohistochemistry of GHS-R1a. Immunohistochemistry of GHS-R1a in DU-145 and PC-3 xenografts mouse compared to mouse stomach; scale bar: 1 mm.
Immunoblotting of GHS-R1a in tumors and stomach of the studied mice
The corresponding immunoblots confirmed the histology data showing GHS-R1a immunoreactivity in lysates of both DU-145 and PC-3 xenografts (Figure 13). Of note, GHS-R1a was not detectable using the ab170690 antibody in type-A cell culture lysates (heated to 100°C, data not shown). However, different processing of type-B lysates (no heating) and use of the AGR-031 antibody allowed for detecting GHS-R1a in both cell cultures and xenografts. Considering the intensities of glyceraldehyde 3-phosphate dehydrogenase (GAPDH) loading controls, GHS-R1a levels were comparable in DU-145 and to PC-3 lysates, irrespective of sample processing or primary antibody.
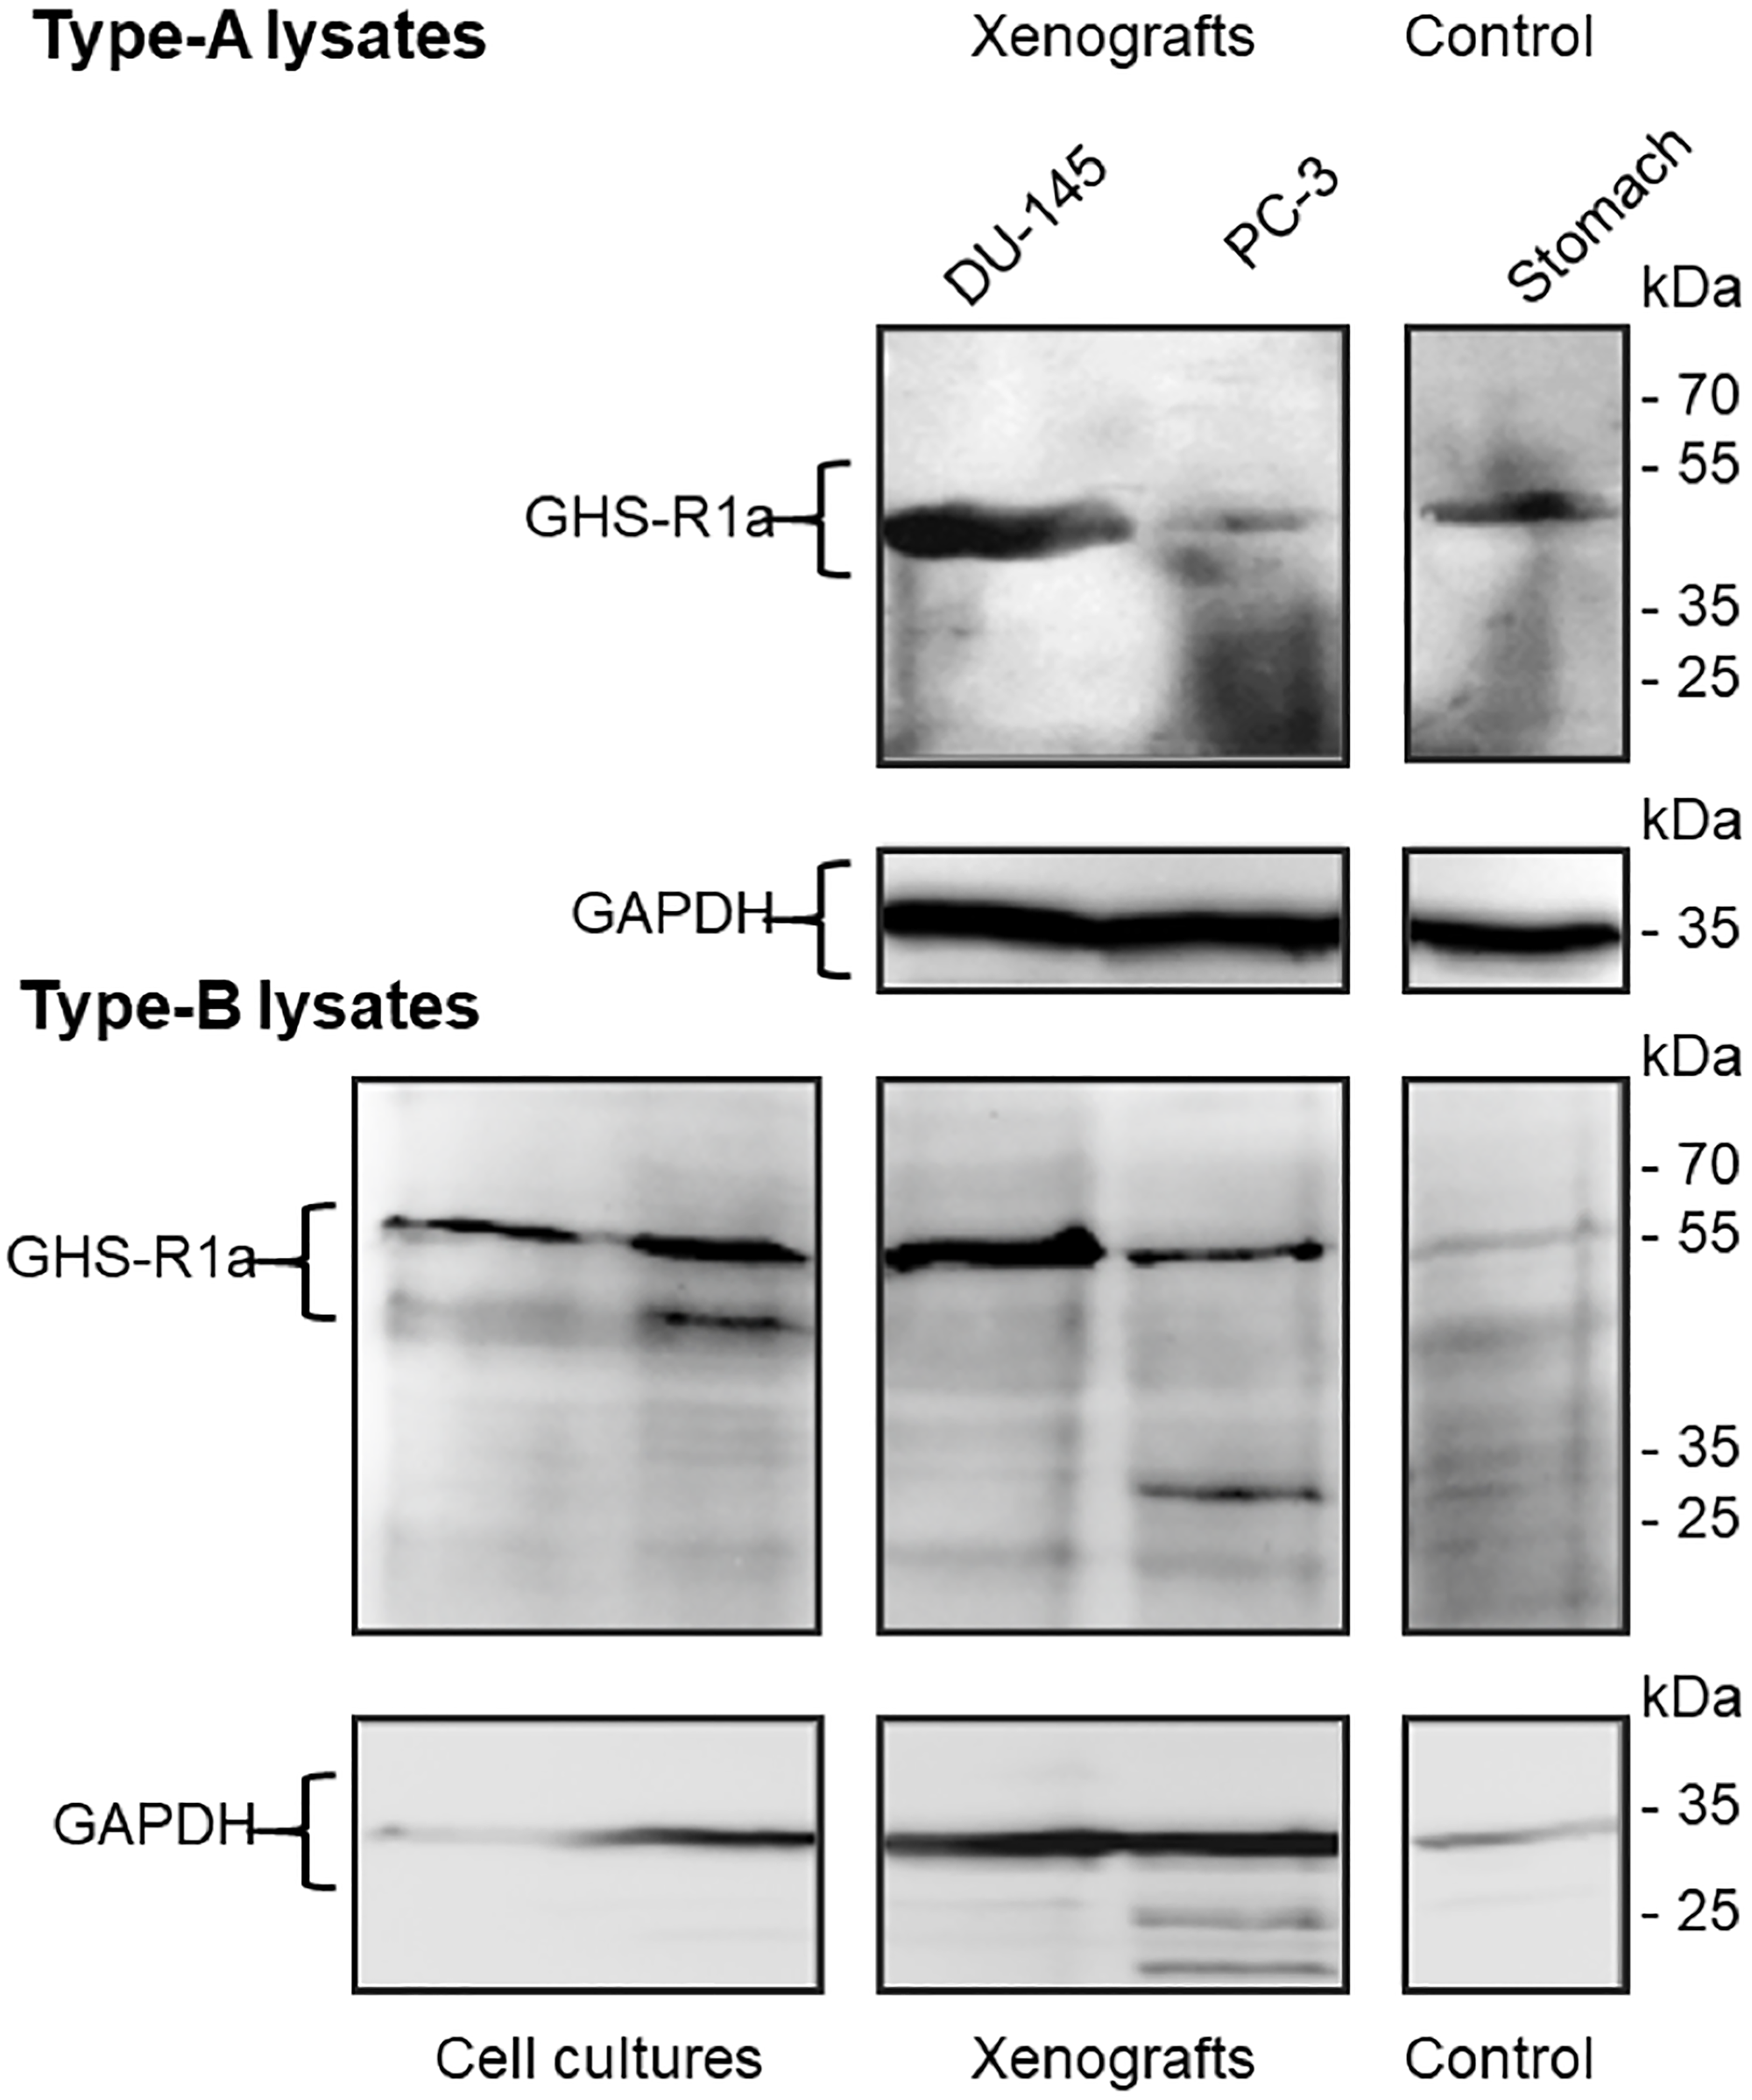
Figure 13: Immunoblots of GHS-R1a in lysates of DU-145 and PC-3 cell cultures, xenografts and Control. Type-A samples were heated to 100°C for 10 min and GHS-R1a was detected using the primary antibody ab170690; type-B samples were incubated at 37°C for 10 min and GHS-R1a was detected using the primary antibody ARG-031; mouse stomach served as positive control. (GAPDH) glyceraldehyde 3-phosphate dehydrogenase served as loading control.
The immunochemical characterizations showed the expression of the Ghrelin receptor in the tumors and stomach and are in a good agreement with the radiotracer in vivo accumulation in these tissues.
DISCUSSION
The main objectives of this work were to design potent Ghrelin receptor inverse agonist radiotracers in order to evaluate: a) their biodistribution, biokinetics, and metabolism in vivo; b) their imaging by small animal PET and, finally; c) their possible use for mapping the Ghrelin receptors in healthy tissues and tumors. All conjugates were designed based on the structure of the peptide tracer [68Ga]Ga-NODAGA KwFwLL-NH2 1 and the Ghrelin receptor inverse agonist K-(D-1-Nal)-FwLL-NH2 2, that were previously developed in our group [47, 49, 52]. Prior to the tracer design, a SAR study was performed on the lead inverse agonist K-(D-1-Nal)-FwLL-NH2 2 in order to study advantages of palmitoylation and PEGylation for further development of therapeutic and/or imaging agents. Introduction of an extra N-terminal lysine to the hexapeptide sequence and its subsequent palmitoylation has been achieved without loss of potency (3: KK-(D-1-Nal)-FwLL-NH2, 6: Palm-KK-(D-1-Nal)-FwLL-NH2). In contrary, substitution of Leu6 into Lys6 resulted in a drastic drop of potency whereas subsequent palmitoylation at Nε-Lys6 conducted to the most potent inverse agonist K-(D-1-Nal)-FwLK(Palm)-NH2 5. On the other hand a loss in potency was observed when PEGylation was performed both at Nε-Lys6 or N-ter-Lys1 (7: K-(D-1-Nal)-FwLK(PEG2)-NH2; 8: PEG2-KK-(D-1-Nal)-FwLL-NH2). Loss of activity was often reported for PEGylated analogues of bioactive molecules and predictive power of cell-based assays for in vivo therapeutic effect is even discussed [53]. Nevertheless, in the best case, the PEGylated inverse agonist exhibited a 37-fold shift in potency. Although small (2 kDa), the introduction of this PEG moiety probably changed too drastically the relative low mass of the inverse agonist (ca 1 kDa) and cleavable PEG-moieties might be an approach in future studies [54].
In order to design inverse agonist tracers, the influence of single introduction of [natGa]Ga-NODAGA was first studied. Placed at the N-terminus of the hexapeptide 2, the bifunctional chelator decreased the potency 10-fold, although maintained in the nanomolar range (9a: [natGa]Ga-NODAGA-K-(D-1-Nal)-FwLL-NH2). Nevertheless, a 10-fold gain in potency was obtained compared to the first inverse agonist chelate [natGa]Ga-NODAGA-KwFwLL-NH2 1 (EC50 = 624.0 nM). Interestingly, addition of an extra lysine linker was beneficial (10a: [natGa]Ga-NODAGA-KK-(D-1-Nal)-FwLL-NH2) whereas the connection of [natGa]Ga-NODAGA at the Nɛ-Lys1 was disadvantageous and decreased the potency (11a: K[NODAGA(Ga)]-KK-(D-1-Nal)-FwLL-NH2). Dual functionalization with palmitoyl/PEG and [natGa]Ga-NODAGA moieties, either both at the N-terminal lysine linker or at the N- and C-terminal lysine influenced potency in a similar manner than previously observed for peptides 5–6. Hence, as expected, a complete loss of potency was observed for the PEGylated chelate 14a, excluding its use as potential radiotracer. In contrast, palmitoylation improved potency of tracers when performed at Nɛ-Lys1 (12a: [[natGa]Ga-NODAGA-K(Palm)-K-(D-1-Nal)-FwLL-NH2), N-terminus (13a: Palm-K[[natGa]Ga-NODAGA]-K-(D-1-Nal)-FwLL-NH2) or Nɛ-Lys7 (15a: [[natGa]Ga-NODAGA]-KK-(D-1-Nal)-FwLK(Palm)-NH2 and 16a: K[[natGa]Ga-NODAGA]-K-(D-1-Nal)-FwLK(Palm)-NH2). Nevertheless, the competitive binding study showed that palmitoylation was preferred at the C-terminal Lys7 (15a). Interestingly, the position of [natGa]Ga-NODAGA was more critical and only tolerated in the N-terminal region (15–16a versus 17–18a).
Inverse agonist chelates 9 and 10 and the palmitoylated analogue 15 were selected for in vivo evaluation. Radiolabeling with [68Ga]Ga3+ and [64Cu]Cu2+ was performed in mild conditions and tracers 9b-c, 10b-c and 15b-c were obtained with high radiochemical purity and high specific activity. Elevated concentrations of all tracers were observed in peripheral tissues, supported by high levels in blood and a steady decrease up to half of their initial concentration within one hour after injection.
Interestingly, radiotracers 9b-c and 10b-c structurally differ in one N-terminal lysine linker and exhibited a similar biodistribution in most organs. The palmitoylated tracers 15b-c showed a distinct behavior with higher concentration in blood, spleen, and brain and an almost exclusive hepatic accumulation. However, this effect is not fully understood; it can be both the higher receptor binding affinity of 15a, 15b, 15c and, or in combination, their higher lipophilicity.
Choosing the appropriate chelator and radiometal is critical for tracer optimization [55, 56]. Gallium ([68Ga]Ga3+) and copper ([64Cu]Cu2+) have indeed different characteristics that can influence in vivo behavior. [68Ga]Ga3+-tracers have a physical half-life of 68 min and maintain the original charge of the compounds and in vivo studies could be extended up to 4 hours. In contrast, [64Cu]Cu2+-tracers possess a physical half-life of 12.07 h that allows PET studies up to two days but add a negative charge to the compounds. In addition, copper complexes are larger than gallium complexes due to the larger ionic radius of the copper ion (87 versus 76 pm). At last, the higher positron energy of [68Ga]Ga3+ results in lower spatial resolution of the PET images (β+ = 89% versus 18%). In this study, biodistribution of [68Ga]Ga3+- and [64Cu]Cu2+-chelates were comparable 5 minutes after injection except in blood where uptake of 68Ga-15b was higher than 64Cu-15c and in the spleen where the contrary was observed (64Cu-15c > 68Ga-15b). After 60 minutes, concentrations of [68Ga]Ga3+-tracers were higher in most organs than [64Cu]Cu2+-tracers, with two exceptions: 64Cu-15c in the spleen and 64Cu-9c in intestine. This discrepancies are probably due to the lower charge of the [68Ga]Ga3+-NODAGA complex. Another important organ represents the liver where free copper is highly accumulated by binding to the superoxide dismutase [57]. Comparing the biodistribution of 10b and 10c in healthy Wistar rats with published data shows that the liver uptake of both radiotracers is relatively fast and increased only slowly, and the 68Ga compound had a similar or slightly higher liver uptake than the 64Cu labeled compound. This demonstrates that the liver uptake is primarily caused by the Ghrelin derivative itself but not released from the copper NODAGA complex.
On the other site, in the blood only traces of the radioactive metabolites were overserved, which indicates that radioactive metabolites were mostly retained in the liver and kidneys and were eliminated. This behavior allows to use the blood activity concentration in the PET directly for quantitation and does not need metabolite corrections.
It is important to mention that accumulation in the kidney was often reported for tracers functionalized with chelators and highly depend on the chelator structure [58]. In this study, however, the low renal accumulation of all chelates supports the choice of NODAGA and its use for imaging [59–62]. In contrast, all tracers exhibited a predominant hepatobiliary elimination, especially the palmitoylated analogues, which correlated with their lipophilicity and their moderate size (MW = 1326 to 1708 Da). The similar liver uptake of both 64Cu- and 68Ga-radiotracers seems to be primarily caused by the Ghrelin radiotracers itself and not by copper release from the chelate complex with NODAGA [57, 63, 64].
Accumulation in brain is a central parameter as most prominent levels of Ghrelin receptors are located in the central nervous system and Ghrelin derivatives can excite central effects at therapeutic dose [1, 8, 65–67]. Nevertheless, it is not yet clear how the receptor is activated in the brain and two hypotheses are currently discussed. Circulating Ghrelin may directly enter the CNS through permeable area of the blood brain barrier or could indirectly activate its receptor via the vagus nerve [8, 9]. However, tracer concentrations in blood are about six to nine orders of magnitudes lower than therapeutic dose. In addition, the time of interaction in the brain is limited by the effective half-life of the tracer in which the physical half-life of the radionuclide used, and the biological half-life of the tracer have to be simultaneously considered. Additionally, the brain uptake is limited by the penetration of the tracer through the blood-brain barrier. In this study, specific brain accumulation of all tracers have been detected and the total uptake of 15b, according to its molar activity, reached 19 nmol × kg-1 brains after one hour. This concentration is similar to EC50 (18 nM) and Ki (11 nM) of 15a in vitro. Based on this estimation and on the metabolic stability of the compound, it can be hypothesized that the level of 15b is sufficient to interact with the Ghrelin receptor system in the brain.
Both, the palmitoylated analog 15b that was radiolabeled with short lived 68Ga and the non-palmitoylated 10c that was radiolabeled with 64Cu were identified as suitable PET imaging probes for the Ghrelin receptor. 68Ga is the preferable radionuclide for human application of low molecular weight radiopharmaceuticals. On the other site 64Cu is the radiometal of choice for preclinical applications of low molecular weight radiometal tracers, because it yields the highest resolution in PET imaging and the physical half-life allows longer study times for metabolite analysis at later time points. Easy synthesis of 10c and its structural characterization, its small molecular weight, good tumor penetration, and the long physical half-life were the major reasons to select 10c for the preclinical prostate cancer imaging in mice.
The biodistribution and metabolism of the radiotracers are primarily dependent on the bioavailability and potential competitors in the organism. The total amounts of injected peptide and the resulting blood plasma concentrations in the biodistribution studies of the 64Cu-labeled peptides were comparable with reported Ghrelin level in vivo (0.09–0.22 nM) [33–35] of lined rats.
The accumulation of 10c in mostly all organs with the exception of the low accumulation in the skeletal muscles is well in concordance with the literature about the distribution of the GHS-R1a in humans and in other mammals [15, 68, 69]. The biodistribution studies using male mice with xenotransplanted prostate tumors are in good agreement with the broad functional expression of GHS-R in many organs and tissues. Exemplarily PC-3 and DU-145 tumors and as example of the normal tissue, the stomach, were evaluated by immunohistochemistry and Western Blots for expression of the GHS-R1a. The GHS-R1a protein was in all three tissues clearly visualized. The GHS-R1a dependent biodistribution of 10c was supported by the relative high uptake of this 64Cu-labeled Ghrelin derivative with SUVs larger than 0.3 and by the complex pattern of inhibition effects with KKD. The highest blocking effect was found in testes, brain, tumor and stomach, which are all organs with a known high expression of GHS-R [6, 7]. The broad distribution of the Ghrelin binding sites in the organism caused an effect that is known from lipophilic receptor ligands with many binding sites, the simultaneous injection of a blocking drug increased the radiotracer accumulation on target sites. The mechanism behind this is the increased availability of the radiotracer that can be delivered from many binding sites and when it is released then it can bind to sites either with higher binding affinity or higher density in the tissue. An example is the increase and longer half-life of 10c in the blood and the observed increase of the 10c in the adrenals after blocking by KKD.
The data support that the studied radiometal Ghrelin inverse agonists could be used for the imaging of functional expression of Ghrelin receptors in vivo that these radiotracers have the potential to gain a deeper understanding on Ghrelin and its receptors in vivo in health and disease, in particular, in cancer [31]. The Ghrelin binding, constitutively active growth hormone secretagogue receptor type 1a (GHS-R1a) has been imaged and quantified by the developed novel compounds, structurally based on the potent inverse agonist KK-(D-1-Nal)-FwLL-NH2 that were evaluated for receptor binding and efficacy in vitro. The radiotracers were specifically accumulated in xenotransplanted human prostate tumor models (PC-3, DU-145) in mice. The tumors were clearly delineated by PET. According to the publication of Charron et al. [44] about one hour after injection the tumor uptake of the studied 68Ga-compound was 0.25 SUV. In the biodistribution experiments the 10c reached at two hours a 2.68 ± 1.11 SUV in the tumor and could be blocked by Ghrelin and KKD to 1.28 ± 0.22 SUV and 1.26 ± 0.34 SUV, respectively. This shows an approximately 10 times higher specific tumor uptake of 10c. The other large difference was the high kidney uptake of the compound of Charron et al. in comparison to the 10c radiotracer that accumulated much higher in the liver. In addition, the biodistribution 10c in rats and mice showed specific accumulation of the radiotracers in GHS-R1a expressing tissues, like stomach and thyroid in which the radiotracer uptake has been partially blocked by KKD. In the arterial blood plasma only the original compounds were practically found. This allowed us to use the time activity concentration curve without metabolite analysis. The relatively slow extraction of 10c by the tissues also allowed us to use the blood AUC measured over the vena cava. The potential bias is similar for both, the control and blocked animals by KKD. For comparison the Patlak Km images were estimated using the ROVER software and the effects of blocking visualized. The [64Cu]Cu- or [68Ga]Ga-NODAGA-NH-K-K-(D-1-NaI)-F-w-L-L-NH2 radiolabeled inverse agonists with respect to its relative simple synthesis, high affinity and medium efficacy, high metabolic stability, and the suitable pharmacokinetic profiles, seem to be potent, and safe leads of future imaging agents for visualization and quantitation of GHS-R1a expression in normal and cancer tissues by PET. The GHS-R1a in vivo imaging and quantitation has the potential to serve as biomarkers of the Ghrelin system in precision medicine.
Materials and Methods
Materials
Fmoc amino acid derivatives, diisopropylcarbodiimide (DIC), 1-hydroxybenzotriazole (HOBt), piperidine, Rink amide resin (L = 0.7 mmol × g-1), were purchased from Iris Biotech (Marktredwitz, Germany) or Novabiochem (Läufelfingen, Switzerland). If not specified, the side chain protecting groups are tBu for Glu, Ser, Thr, and Tyr; Boc for Lys and D-Trp; Trt for Gln; and His and Pbf for Arg. Thioanisole, p-thiocresol, ethandithiol, piperidine, hydrazine monohydrate, 4-dimethylaminopyridine (DMAP), triisopropylsilane (TIS), and tert-butanol was purchased from Fluka (Taufkirchen, Germany). Dichloromethane (DCM) and N,N-dimethylformamide (DMF) were purchased from Biosolve (Valkenswaard, Netherlands). Palmitic acid, Trifluoroacetic acid (TFA), acetic anhydride, diisopropylethylamine (DIPEA), octanoic acid, and Ga(NO3)3 were obtained from Sigma-Aldrich (Taufkirchen, Germany). NODAGA(tBu)3 (4-(4,7-bis(2-tert-butoxy-2-oxoethyl)-1,4,7-triazonan-1-yl)-5-tert-butoxy-5-oxopentanoic acid) was obtained from CheMatec (Dijon, France). Gradient-grade high-performance liquid chromatography (HPLC) solvent acetonitrile (ACN) was from VWR (Darmstadt, Germany). All reagents and solvents were used without purification as provided from the commercial suppliers. Non-modified Ghrelin used as a control in biological assays was obtained from PolyPeptide (Hillerød, Denmark). For cell culture and in vitro assays, Dulbecco’s phosphate buffered saline without calcium and magnesium (PBS), DMEM, high glucose (4.5 g × L–1) with l-glutamine, heat-inactivated fetal bovine serum (FBS), penicillin/streptomycin, and trypsin/EDTA (1:250) were purchased from PAA (Pasching, Austria). Metafectene was purchased from Biontex (Martinsried, Germany). [3H]-myo-inositol (681 MBq × mmol–1; 25.0 Ci × mmol–1) was from GE Healthcare Europe GmbH (Braunschweig, Germany). Cell culture flasks (75 cm2) and 24-well plates were from TPP (Trasadingen, Switzerland).
Instruments
Automated peptide synthesis was performed with a multiple peptide synthesizer (Syro, MultiSynTech, Bochum, Germany). Preparative and semi-preparative HPLC were performed using a Shimadzu system on a Phenomenex RP18-column (21.4 × 250 mm; 10 μm/90 Å). Analytical HPLC were performed using a Merck-Hitachi system with a Phenomenex Jupiter 4u Proteo 90 Å (250 × 4.6 mm; 4 μm; 90 Å). All peptides were analyzed by matrix-assisted laser desorption ionization–time-of-flight (MALDI-ToF) using a Bruker Daltonics Ultraflex III mass spectrometer. The 1.85 - GBq (50 - mCi) 68Ge/68Ga-generator was purchased from iThemba Laboratories with the 68Ge on a SnO2-cartrige and eluted according to the manufacturer’s recommendations using a remote-controlled module.
Synthesis of Ghrelin inverse agonist derivatives and conjugation with NODAGA for labeling with metal-isotopes
The synthesis of the peptides was performed on a Rink amide resin (13.5 μmol) with an automated peptide synthesizer and following a Fmoc/t-Bu strategy as previously described [52]. Special amino acids were coupled manually. NODAGA(tBu)3 was introduced after selective cleavage of Mtt or Fmoc protecting groups [46]. Palmitic acid and PEG2 were coupled on precursors b and d (scheme 2) after selective cleavage of Mtt or Fmoc protecting groups. The resins were swollen in 500 μL of DMF for 15 min. For palmitoylation, palmitic acid (0.15 mmol, 10 equiv) and HOBt (0.15 mmol, 10 equiv) were dissolved in 200 μL DMF and the solution was added to the resin with DIC (0.15 mmol, 10 equiv). For PEGylation, MeO-PEG2-NHS (0.045 mmol, 3 equiv) and DMAP (0.09 mmol, 6 equiv) were dissolved in 200 μL DMF and the solution was added to the resin with DIC (0.09 mmol, 6 equiv). Reaction mixtures were shaken overnight at room temperature, resins were then successively washed five times with DMF, DCM, MeOH, Et2O, and dried in vacuo. Completion of the coupling reaction was monitored with a Kaiser test.
Complexation with natural gallium
Complexation with natural gallium of NODAGA-peptide conjugate 9–18 was performed for in vitro assays following established procedure and yielded NODAGA(Ga)-peptide chelates 9–18a [70]. Complexation of conjugates 9–18 with natural natGa3+ was performed by incubating the peptides with a solution of natGa(NO3)3 in acetate buffer (pH 5) at 37°C [46]. The chelates 9–18a (scheme 2) were directly purified by HPLC to remove the excess of metal and used for in vitro assays.
Radiolabeling with 68Ga
TFA-HCl exchange and radiolabeling with 68Ga was also performed on chelates 9, 10 and 15 according to the procedure already described and led to 9b, 10b and 15b [46].
Radiolabeling with 64Cu
The production of 64Cu was performed at a PET cyclotron, following standard procedures [70]. The peptide conjugates 9, 10 and 15 were radiolabeled by adding 50 – 200 MBq of [64Cu]CuCl2 pH 5.5 that was adjusted with 2 M NH4-acetate to approximately 20 nmol peptide dissolved in 100 μL water to afford 9c, 10c and 15c. The radiochemical purity and integrity were confirmed by Radio-HPLC. Before formulation for the in vitro or in vivo application, the reaction mixture was filtrated (45 μm pore size, REZIST 13/0.45 PTFE, Schleicher & Schuell, Dassel, Germany). The filtrates were then diluted with isotonic sodium chloride solution E-154 (154 mmol × L–1 Na+, 154 mmol × L–1 Cl-, Serumwerk Bernburg, Germany) to reach concentration of about 20 MBq × mL-1 and directly used for the radiopharmacological studies. The acetate concentration in the final formulation did not exceed 150 mmol × L-1 and was suitable for intravenous injection.
Inositol triphosphate turnover assay
Inositol triphosphate turnover assay to measure the potency of peptide 3–8 and 9a-18a was performed in COS-7 cells stably or transiently transfected with the Ghrelin receptor, as previously described in detail [46, 49]. Data were analyzed with GraphPad Prism 6.0 program (GraphPad Software, San Diego, CA, USA). EC50, pEC50 and Emax values were obtained from concentration–response curves. All signal transduction assays were performed in duplicate and repeated at least two times independently.
Competitive binding assay
Competitive binding assay to measure the affinity of 10a, 12a and 15a was performed in COS-7 cells stably transfected with the Ghrelin receptor, as previously described [49]. Each experiment was performed in triplicates. IC50 values of the binding curves were calculated by nonlinear regression on a sigmoidal dose-response based model by using program GraphPad Prism 6.0. Ki values were calculated by Cheng-Prusoff equation.
Animals, feeding, husbandry, and animal preparation
Animal experiments in male Wistar rats (Wistar Unilever, HsdCpb:WU, Harlan Winkelmann, Borchen, Germany) (5–7 week old) and in male NMRI nu/nu mice (7–14 week old) were carried out according to the guidelines of the German Regulations for Animal Welfare. The protocol was approved by the local Ethical Committee for Animal Experiments (reference number 24-9168.21-4/2004-1).
Rats and mice were housed in separate rooms under standard conditions with free access to food and tap water.
For the generation of subcutaneous tumors PC-3 (ATCC® CRL-1435™) and DU-145 (ATCC® HTB-81™) cells were used. The NMRI nu/nu mice were subcutaneously xenotransplanted into the right legs with these cells according to the published protocol [71, 72].
Measurement of original compounds and radioactive metabolites
The metabolite analysis in blood samples was carried out on male Wistar rats that were anesthetized with desflurane. The guide value for breathing frequency was 65 breaths × min-1. Animals were put in the supine position and placed on a heating pad to maintain body temperature. The spontaneously breathing rats were treated with 100 units × kg–1 heparin (Heparin-Natrium 25.000-ratiopharm, Ratiopharm, Germany) by subcutaneous injection to prevent blood clotting on intravascular catheters. After local anesthesia by injection of Lignocaine 1% (Xylocitin loc, Mibe, Jena, Germany) into the right groin, catheter was introduced into the right femoral artery (0.8 mm Umbilical Vessel Catheter, Tyco Healthcare, Tullamore, Ireland) for blood samples for metabolite analysis, for gas analysis, arterial blood pressure measurements and a second needle (35 G) catheter into one tail vein was used for administration of the 9b, 9c, 10b, 10c, 15b and 15c. Arterial blood samples were collected at 1, 3, 5, 10, 20, 30, 60, and 120 min after injections and the activity (% ID × mL–1) was measured to give the arterial blood activity concentration. If the activity concentration in the blood was larger than 1 kBq × mL-1 then the sample was used for further evaluation. Blood cells were separated by centrifugation (5°C, 5 min, 8000 rpm), and plasma proteins were precipitated using 60% acetonitrile and subsequent centrifugation (5°C, 5 min, 8000 rpm). The supernatant was analyzed by radio-HPLC. The radio-HPLC system (Agilent 1100 series) applied for metabolite analysis was equipped with UV detection (254 nm) and an external radiochemical detector (Ramona, Raytest GmbH, Straubenhardt, Germany). Analysis was performed on a Zorbax C18 300SB (250 × 9.4 mm; 4 μm) column with an eluent system C (water + 0.1% TFA) and D (acetonitrile + 0.1% TFA) in a gradient 5 min 95% C, 10 min to 95% D, and 5 min at 95% D at a flow rate of 3 mL × min–1. HPLC analyses were performed on 9b, 9c, 10b, 10c, 15b and 15c added to a rat blood sample (0 min), and arterial blood samples from up to 120 min after injections and on urine sample from 120 min after injection. The extracts from other tissues were prepared by Ultra-Torrax TR 150 (1000 rpm) and ultrasound homogenization as 10% solution in PBS, centrifugation (5°C, 70.000 g × min) and subsequent precipitation by 60% acetonitrile. The supernatant was analyzed by the described radio-HPLC.
Biodistribution
Two groups of four male Wistar-Unilever rats aged between 5 and 7 weeks and weighing 186 ± 11 g (mean ± SD) for each time point were intravenously injected into a tail vein with 0.5 mL of electrolyte solutions E-154 of [68Ga]Ga- and [64Cu]Cu-peptides containing approximately 0.1 - 0.3 MBq. The molar activity was approximately 30 GBq × mmol–1 at the time of injection (Table 3). In blocking experiments, the radiotracers were simultaneously injected with 1 mg/kg body weight of KKD or Ghrelin. Animals were sacrificed at 5 and 60 min post injection. Blood and the major organs were collected, weighed, and counted in a Wallac WIZARD automatic gamma counter (PerkinElmer, Germany). The radioactivity of the samples was decay-corrected and calibrated by comparing the counts in tissue with the counts in aliquots of the injected radiotracer that had been measured in the gamma counter at the same time. The activity amount in organs that could be completely extracted was expressed as percent of injected dose (% ID). The activity concentrations in tissues were calculated as standardized uptake values [SUV = (activity × mL–1 tissue)/(injected activity/body weight), mL × g–1)]. The SUV was used for better comparison within animals of different size and weight and with other species and to compare the biodistribution and the PET data.
The tumor mice with xenotransplanted PC-3 or DU-145 tumors were used when the tumors reached 0.54 ± 0.34 g or 0.18 ± 0.09 g (mean ± SD, n = 9), respectively. The mice were divided in three groups of three animals and injected with 100 μL E-154 containing 0.2 MBq 10c alone (control) or simultaneously with 1 mg/kg body weight of Ghrelin or KKD for in vivo competition with the radiotracer. The mice were sacrificed one hour after injection and the organs and tissues were extracted. The activity measurements and calculations were carried out as described for the rat biodistribution experiments.
Immunohistochemistry
Tissue sections were dewaxed in RotiHistol (ROTH) and re-hydrated in a graded series of ethanol (100, 96, 85, 70, 50% (v/v), H2O). Antigen retrieval was performed in boiling 10 mmol/L citrate buffer (pH 6.0). Endogenous peroxidase was quenched with 3% (v/v) H2O in Tris-bufferd saline containing 0.1% Tween 20 (TBS-T). Endogenous biotin was blocked using a commercial biotin blocking system (DAKO). Non-specific binding was blocked using 10% (w/v) fetal bovine serum in TBS-T. GHS-R1a was detected using the primary antibody ab134152 (ABCAM). Negative controls were incubated with blocking solution only. Specific binding was detected using the biotinylated secondary antibody 111-065-003 (1:200; DIANOVA) and ExtrAvidin peroxidase E2886 (1:50; SIGMA-ALDRICH). Sections were stained with 3,3′ diaminobenzidine, counterstained with eosin, and imaged using the AXIO Imager A1 microscope (CARL ZEISS).
Immunoblotting
Cells and tissues were lyzed in ice-cold radioimmunoprecipitation assay buffer (SIGMA-ALDRICH) supplemented with 1 mM dithiotreitol, 1 mM Na3VO4, 5 mM NaF, 1 mM phenylmethylsulfonyl fluoride, and 1 μg/mL leupeptin. Tissues were disrupted using the TissueLyzer (QUIAGEN). Samples were diluted 5:1 in 5× loading buffer composed of 62.5 mol/L Tris-HCl (pH 6.0) supplemented with 10% (v/v) glycerin, 5% (v/v) β-mercaptoethanol, 2% (w/v) sodium dodecyl sulfate, and 0.01% (w/v) bromophenol blue. Samples were further processed in two different ways; type-A samples were heated to 100°C for 10 min, type-B samples were incubated at 37°C for 10 min. Proteins were separated on 10% (w/v) sodium dodecyl sulfate polyacrylamide gels and transferred to PVDF membranes (WHATMAN). Non-specific binding was blocked with Tris-HCl containing 0.5% (v/v) Tween-20 and 5% (v/v) fat-free milk. In group-A samples GHS-R1a was detected using the primary antibody ab170690 (1:200; ABCAM). In group-B samples GHS-R1a was detected using the primary antibody AGR-031 (1:500; ALOMONE LABS). Specific binding was detected using the secondary antibody A0545 (1:5000; SIGMA-ALDRICH). For loading control, glyceraldehyde 3-phosphate dehydrogenase (GAPDH) was detected using the primary antibody G8795 (1:5000; SIGMA-ALDRICH) and the secondary antibody A9044 (1:10.000; SIGMA-ALSDRICH). Immunoreactivity was visualized using SuperSignal™ West Pico/Dura substrate (LIFE TECHNOLOGIES).
Small animal PET
Anesthetized, spontaneously breathing animals were allowed to stabilize for 10 min after preparation. The animals were positioned on a heated bed to maintain the body temperature at 37°C. The PET studies were carried out with a NanoScanPET/CT (Mediso, Hungary) or a microPET P4® (Siemens preclinical solutions, Knoxville, TN, USA). The activity of the injection solution was measured in a well counter (Isomed 2000, Dresden, Germany) cross-calibrated to the PET scanners [73, 74]. A 10 min transmission scan was recorded during this time for each subject by using a rotating point source of 57Co (microPET). The transmission scans were used to correct the emission scan for γ-ray attenuation caused by body tissues and supporting structures; it was also used to demarcate the body field for image registration. The PET acquisition of 60 or 120 min emission scan was started and the infusion of the 68Ga-/64Cu-labeled compound was initiated with a delay of 10 s. 0.5 mL (rats) or 0.1 mL (mice) of solutions of [68Ga]- or [64Cu]-peptides were infused over 1 min (with a Harvard apparatus 44 syringe pump) into a lateral tail vein. In blocking experiments the radiotracers were simultaneously injected with 1 mg/kg body weight of Ghrelin or KKD. At the end of the experiment, the animals were deeply anesthetized and sacrificed by an intravenous injection of potassium chloride.
Data acquisition
Acquisition was performed in 3D list mode. Emission data were collected continuously [75, 76]. The list mode data were sorted into sinograms with 32 or 38 frames (15 × 10 s, 5 × 30 s, 5 × 60 s, 4 × 300 s, 3 × 600 s, or 9 × 600 s). The data were decay-, scatter-, and attenuation-corrected. The frames from the microPET were reconstructed by Ordered Subset Expectation Maximization applied to 3D sinograms (OSEM3D) with 14 subsets, 15 OSEM3D iterations, 25 maximum a posteriori (MAP) iterations, and 1.8 mm resolution using the FastMAP algorithm (Siemens Preclinical Solutions, Knoxville, TN, USA). The voxel size was 0.07 by 0.07 by 0.12 cm. The PET images measured with the nanoScanPET/CT were reconstructed using a three-dimensional Ordered Subsets Expectation Maximization (3D-OSEM) algorithm (Tera-Tomo, Mediso Ltd., Hungary) into dynamic frames as described and with a voxel size of 0.05 cm. No correction for partial volume effects was applied. The image volume data were converted to Siemens ECAT7 format for further processing and were then analyzed using the ROVER software (ABX GmbH, Radeberg, Germany). Masks for defining three-dimensional regions of interest (ROI) were set and the ROI’s were defined by thresholding and ROI time activity curves (TAC) were derived for the subsequent data analysis. The time activity curves over the vena cava were derived from ROI determined in the first two minutes after 1 min long infusion of the radiotracers. The ROIs were so determined that no surrounding tissue was included [77]. The ROI data and TAC were further analyzed using R (R is available as Free Software under the terms of the Free Software Foundation’s GNU General Public License in source code form) and especially developed program packages (Jörg van den Hoff, Frank Hofheinz, Helmholtz-Zentrum Dresden-Rossendorf, Dresden, Germany).
Statistical analysis
Values are expressed as mean ± SEM. The data were statistically evaluated using ANOVA or an unpaired Student’s t-test with Welch’s correction and an F-test to compare the variances (GraphPad Prism 6.0). Kruskal–Wallis test was performed to identify the differences between groups. All statistical testing was performed using Prism 7.0 software. Significant difference was set at *p < 0.05; **p < 0.01; ***p < 0.001.
Abbreviations
AgRP: agouti-related peptide; AUC: Area under the curve; Boc: tert-butyloxycarbonyl; DIC: N’,N’-diisopropylcarbodiimide; D-1-NaI: D-1-naphtylamine-2-amino-3-naphthalen-1-ylpropanoic acid; DMF: dimethylformamide; FCS: fetal calf serum; Fmoc: 9-fluorenylmethyloxycarbonyl; GHS-R: growth hormone secretagogue receptor; HOBt: 1-hydroxybenzotriazole; Mtt: 4-methyltrityl; KKD: KK-(D-1-Nal)-FwLL-NH2; NODAGA: 1,4,7-triazacyclononane,1-glutaric acid-4,7-acetic acid; NODAGA(tBu)3: 4-(4,7-bis(2-(tert-butoxy)-2-oxoethyl)-1,4,7-triazacyclononan-1-yl)-5-(tert-butoxy)-5-oxopentanoic acid; PEG2: diethylene glycol; SAR: structure−activity relationship; tBu: tert-butyl; PET: Positron-Emission-Tomography; NPY: neuropeptide Y; Palm: palmitoyl; RCY: radiochemical yield; TAC: Time-activity curve; TFA: trifluoroacetic acid; Trt: trityl; BAT: brown adipose tissue; WAT: white adipose tissue; w.c: with content.
ACKNOWLEDGMENTS
The authors thank Regina Reppich-Sacher and Kristin Loebner for technical assistance during the synthesis and in vitro experiments, Stephan Preusche, Martin Walther, and Ulrike Gesche for the 64Cu production and purification, and Regina Herrlich, Andrea Suhr, and Catharina Knöfel for technical assistance in the animal experiments, peptide radiolabeling and metabolite analysis.
CONFLICTS OF INTEREST
Authors have no conflicts of interest to declare.
FUNDING
This project was financially supported by the EU (Gastrointestinal Peptides in Obesity, GIPIO, Grant Agreement Number 223057), the BMBF (IFB Adipositas Diseases K7-18) and the Alexander von Humboldt foundation. The research was financed by the Thematic Excellence Programme (2020-4.1.1.-TKP2020) of the Ministry for Innovation and Technology in Hungary, within the framework of the BIOImaging thematic programme of the Semmelweis University.
References
1. Nakazato M, Murakami N, Date Y, Kojima M, Matsuo H, Kangawa K, Matsukura S. A role for ghrelin in the central regulation of feeding. Nature. 2001; 409:194–8. https://doi.org/10.1038/35051587. [PubMed].
2. Muller TD, Tschop MH. Ghrelin-a key pleiotropic hormone-regulating systemic energy metabolism. Endocr Dev. 2013; 25:91–100. https://doi.org/10.1159/000346590. [PubMed].
3. Liu H, Luo J, Guillory B, Chen JA, Zang P, Yoeli JK, Hernandez Y, Lee II, Anderson B, Storie M, Tewnion A, Garcia JM. Ghrelin ameliorates tumor-induced adipose tissue atrophy and inflammation via Ghrelin receptor-dependent and -independent pathways. Oncotarget. 2020; 11:3286–302. https://doi.org/10.18632/oncotarget.27705. [PubMed].
4. Callaghan B, Furness JB. Novel and conventional receptors for ghrelin, desacyl-ghrelin, and pharmacologically related compounds. Pharmacol Rev. 2014; 66:984–1001. https://doi.org/10.1124/pr.113.008433. [PubMed].
5. Wang Q, Xiao W, Li Y, Liu Z, Li H, Wang J, Hu Y, Xue Q, Wang D. Signaling of ghrelin at GHSR1b and OX1R receptor heterodimers. Mol Biol Cell. 2019. [Epub ahead of print]. https://doi.org/10.1091/mbc.E19-06-0326. [PubMed].
6. Au CC, Furness JB, Brown KA. Ghrelin and Breast Cancer: Emerging Roles in Obesity, Estrogen Regulation, and Cancer. Front Oncol. 2017; 6:265. https://doi.org/10.3389/fonc.2016.00265. [PubMed].
7. Papotti M, Duregon E, Volante M. Ghrelin and tumors. Endocr Dev. 2013; 25:122–34. https://doi.org/10.1159/000346061. [PubMed].
8. Ferrini F, Salio C, Lossi L, Merighi A. Ghrelin in central neurons. Curr Neuropharmacol. 2009; 7:37–49. https://doi.org/10.2174/157015909787602779. [PubMed].
9. Andrews ZB. Central mechanisms involved in the orexigenic actions of ghrelin. Peptides. 2011; 32:2248–55. https://doi.org/10.1016/j.peptides.2011.05.014. [PubMed].
10. Holst B, Holliday ND, Bach A, Elling CE, Cox HM, Schwartz TW. Common structural basis for constitutive activity of the ghrelin receptor family. J Biol Chem. 2004; 279:53806–17. https://doi.org/10.1074/jbc.M407676200. [PubMed].
11. Holst B, Schwartz TW. Constitutive ghrelin receptor activity as a signaling set-point in appetite regulation. Trends Pharmacol Sci. 2004; 25:113–7. https://doi.org/10.1016/j.tips.2004.01.010. [PubMed].
12. Holst B, Schwartz TW. Ghrelin receptor mutations--too little height and too much hunger. J Clin Invest. 2006; 116:637–41. https://doi.org/10.1172/JCI27999. [PubMed].
13. Akamizu T, Kangawa K. Emerging results of anticatabolic therapy with ghrelin. Curr Opin Clin Nutr Metab Care. 2007; 10:278–83. https://doi.org/10.1097/MCO.0b013e3280fa8208. [PubMed].
14. Nass R, Gaylinn BD, Thorner MO. The ghrelin axis in disease: potential therapeutic indications. Mol Cell Endocrinol. 2011; 340:106–10. https://doi.org/10.1016/j.mce.2011.02.010. [PubMed].
15. Gnanapavan S, Kola B, Bustin SA, Morris DG, McGee P, Fairclough P, Bhattacharya S, Carpenter R, Grossman AB, Korbonits M. The tissue distribution of the mRNA of ghrelin and subtypes of its receptor, GHS-R, in humans. J Clin Endocrinol Metab. 2002; 87:2988–91. https://doi.org/10.1210/jcem.87.6.8739. [PubMed].
16. Sato T, Nakamura Y, Shiimura Y, Ohgusu H, Kangawa K, Kojima M. Structure, regulation and function of ghrelin. J Biochem. 2012; 151:119–28. https://doi.org/10.1093/jb/mvr134. [PubMed].
17. Nikolopoulos D, Theocharis S, Kouraklis G. Ghrelin: a potential therapeutic target for cancer. Regul Pept. 2010; 163:7–17. https://doi.org/10.1016/j.regpep.2010.03.011. [PubMed].
18. Cassoni P, Ghe C, Marrocco T, Tarabra E, Allia E, Catapano F, Deghenghi R, Ghigo E, Papotti M, Muccioli G. Expression of ghrelin and biological activity of specific receptors for ghrelin and des-acyl ghrelin in human prostate neoplasms and related cell lines. Eur J Endocrinol. 2004; 150:173–84. https://doi.org/10.1530/eje.0.1500173. [PubMed].
19. Maugham ML, Seim I, Thomas PB, Crisp GJ, Shah ET, Herington AC, Gregory LS, Nelson CC, Jeffery PL, Chopin LK. Limited short-term effects on human prostate cancer xenograft growth and epidermal growth factor receptor gene expression by the ghrelin receptor antagonist [D-Lys3]-GHRP-6. Endocrine. 2019; 64:393–405. https://doi.org/10.1007/s12020-018-1796-9. [PubMed].
20. Ye H, Yang Y, Chen R, Shi X, Fang Y, Yang J, Dong Y, Chen L, Xia J, Wang C, Yang C, Feng J, Wang Y, et al. Recognition of Invasive Prostate Cancer Using a GHRL Polypeptide Probe Targeting GHSR in a Mouse Model In Vivo. Curr Pharm Des. 2020; 26:1614–21. https://doi.org/10.2174/1381612826666191227160001. [PubMed].
21. Wojciuk G, Kruszewski M. [DTPA-(PABn)-Leu(5)]-des-acyl ghrelin(1-5) as a new carrier of radionuclides and potential precursor of radiopharmaceuticals. Nucl Med Commun. 2018; 39:140–6. https://doi.org/10.1097/Mnm.0000000000000790. [PubMed].
22. Jeffery PL, Herington AC, Chopin LK. Expression and action of the growth hormone releasing peptide ghrelin and its receptor in prostate cancer cell lines. J Endocrinol. 2002; 172:R7–11. https://doi.org/10.1677/joe.0.172R007. [PubMed].
23. Yeh AH, Jeffery PL, Duncan RP, Herington AC, Chopin LK. Ghrelin and a novel preproghrelin isoform are highly expressed in prostate cancer and ghrelin activates mitogen-activated protein kinase in prostate cancer. Clin Cancer Res. 2005; 11:8295–303. https://doi.org/10.1158/1078-0432.Ccr-05-0443. [PubMed].
24. Thomas P, Walpole CM, Jeffery PL, Jovanovic L, Herington AC, Nelson CC, Whiteside EJ, Veedu RN, Seim I, Chopin LK. The ghrelin receptor antisense long non-coding RNA, GHSROS, in prostate cancer growth and survival. BJU Int. 2015; 116:34.
25. Pellegrino S, Ruscica M, Magni P, Vistoli G, Gelmi ML. Antiproliferative activity on human prostate carcinoma cell lines of new peptidomimetics containing the spiroazepinoindolinone scaffold. Bioorg Med Chem. 2013; 21:5470–9. https://doi.org/10.1016/j.bmc.2013.06.006. [PubMed].
26. Lu C, McFarland MS, Nesbitt RL, Williams AK, Chan S, Gomez-Lemus J, Autran-Gomez AM, Al-Zahrani A, Chin JL, Izawa JI, Luyt LG, Lewis JD. Ghrelin receptor as a novel imaging target for prostatic neoplasms. Prostate. 2012; 72:825–33. https://doi.org/10.1002/pros.21484. [PubMed].
27. Gutierrez JA, Solenberg PJ, Perkins DR, Willency JA, Knierman MD, Jin Z, Witcher DR, Luo S, Onyia JE, Hale JE. Ghrelin octanoylation mediated by an orphan lipid transferase. Proc Natl Acad Sci U S A. 2008; 105:6320–5. https://doi.org/10.1073/pnas.0800708105. [PubMed].
28. Lim CT, Kola B, Grossman A, Korbonits M. The expression of ghrelin O-acyltransferase (GOAT) in human tissues. Endocr J. 2011; 58:707–10. https://doi.org/10.1507/endocrj.K11E-117. [PubMed].
29. Goebel-Stengel M, Hofmann T, Elbelt U, Teuffel P, Ahnis A, Kobelt P, Lambrecht NW, Klapp BF, Stengel A. The ghrelin activating enzyme ghrelin-O-acyltransferase (GOAT) is present in human plasma and expressed dependent on body mass index. Peptides. 2013; 43:13–9. https://doi.org/10.1016/j.peptides.2013.02.011. [PubMed].
30. Hormaechea-Agulla D, Gomez-Gomez E, Ibanez-Costa A, Carrasco-Valiente J, Rivero-Cortes E, L-López F, Pedraza-Arevalo S, Valero-Rosa J, Sanchez-Sanchez R, Ortega-Salas R, Moreno MM, Gahete MD, Lopez-Miranda J, et al. Ghrelin O-acyltransferase (GOAT) enzyme is overexpressed in prostate cancer, and its levels are associated with patient’s metabolic status: Potential value as a non-invasive biomarker. Cancer Lett. 2016; 383:125–34. https://doi.org/10.1016/j.canlet.2016.09.022. [PubMed].
31. Soleyman-Jahi S, Sadeghi F, Pastaki Khoshbin A, Khani L, Roosta V, Zendehdel K. Attribution of Ghrelin to Cancer; Attempts to Unravel an Apparent Controversy. Front Oncol. 2019; 9:1014. https://doi.org/10.3389/fonc.2019.01014. [PubMed].
32. Sever S, White DL, Garcia JM. Is there an effect of ghrelin/ghrelin analogs on cancer? A systematic review. Endocr Relat Cancer. 2016; 23:R393–409. https://doi.org/10.1530/ERC-16-0130. [PubMed].
33. Majchrzak K, Szyszko K, Pawlowski KM, Motyl T, Krol M. A role of ghrelin in cancerogenesis. Pol J Vet Sci. 2012; 15:189–97. https://doi.org/10.2478/v10181-011-0133-5. [PubMed].
34. Franco Machado J, Silva RD, Melo R, G Correia JD. Less Exploited GPCRs in Precision Medicine: Targets for Molecular Imaging and Theranostics. Molecules. 2018; 24:E49. https://doi.org/10.3390/molecules24010049. [PubMed].
35. Holst B, Lang M, Brandt E, Bach A, Howard A, Frimurer TM, Beck-Sickinger A, Schwartz TW. Ghrelin receptor inverse agonists: identification of an active peptide core and its interaction epitopes on the receptor. Mol Pharmacol. 2006; 70:936–46. https://doi.org/10.1124/mol.106.024422. [PubMed].
36. Kilian TM, Kloting N, Bergmann R, Els-Heindl S, Babilon S, Clement-Ziza M, Zhang Y, Beck-Sickinger AG, Chollet C. Rational design of dual peptides targeting ghrelin and Y2 receptors to regulate food intake and body weight. J Med Chem. 2015; 58:4180–93. https://doi.org/10.1021/jm501702q. [PubMed].
37. Douglas GA, McGirr R, Charlton CL, Kagan DB, Hoffman LM, Luyt LG, Dhanvantari S. Characterization of a far-red analog of ghrelin for imaging GHS-R in P19-derived cardiomyocytes. Peptides. 2014; 54:81–8. https://doi.org/10.1016/j.peptides.2014.01.011. [PubMed].
38. Hou J, Kovacs MS, Dhanvantari S, Luyt LG. Development of Candidates for Positron Emission Tomography (PET) Imaging of Ghrelin Receptor in Disease: Design, Synthesis, and Evaluation of Fluorine-Bearing Quinazolinone Derivatives. J Med Chem. 2018; 61:1261–75. https://doi.org/10.1021/acs.jmedchem.7b01754. [PubMed].
39. McGirr R, McFarland MS, McTavish J, Luyt LG, Dhanvantari S. Design and characterization of a fluorescent ghrelin analog for imaging the growth hormone secretagogue receptor 1a. Regul Pept. 2011; 172:69–76. https://doi.org/10.1016/j.regpep.2011.08.011. [PubMed].
40. Rosita D, Dewit MA, Luyt LG. Fluorine and rhenium substituted ghrelin analogues as potential imaging probes for the growth hormone secretagogue receptor. J Med Chem. 2009; 52:2196–203. https://doi.org/10.1021/jm8014519. [PubMed].
41. Charron CL, Hou J, McFarland MS, Dhanvantari S, Kovacs MS, Luyt LG. Structure-Activity Study of Ghrelin(1–8) Resulting in High Affinity Fluorine-Bearing Ligands for the Ghrelin Receptor. J Med Chem. 2017; 60:7256–66. https://doi.org/10.1021/acs.jmedchem.7b00164. [PubMed].
42. Moldovan RP, Els-Heindl S, Worm DJ, Kniess T, Kluge M, Beck-Sickinger AG, Deuther-Conrad W, Krugel U, Brust P. Development of Fluorinated Non-Peptidic Ghrelin Receptor Ligands for Potential Use in Molecular Imaging. Int J Mol Sci. 2017; 18:E768. https://doi.org/10.3390/ijms18040768. [PubMed].
43. Fowkes MM, Lalonde T, Yu L, Dhanvantari S, Kovacs MS, Luyt LG. Peptidomimetic growth hormone secretagogue derivatives for positron emission tomography imaging of the ghrelin receptor. Eur J Med Chem. 2018; 157:1500–11. https://doi.org/10.1016/j.ejmech.2018.08.062. [PubMed].
44. Charron CL, McFarland MS, Dhanvantari S, Luyt LG. Development of a [(68)Ga]-ghrelin analogue for PET imaging of the ghrelin receptor (GHS-R1a). Medchemcomm. 2018; 9:1761–7. https://doi.org/10.1039/c8md00210j. [PubMed].
45. Abbas A, Yu L, Lalonde T, Wu D, Thiessen JD, Luyt LG, Dhanvantari S. Development and Characterization of an (18)F-labeled Ghrelin Peptidomimetic for Imaging the Cardiac Growth Hormone Secretagogue Receptor. Mol Imaging. 2018; 17:1536012118809587. https://doi.org/10.1177/1536012118809587. [PubMed].
46. Chollet C, Bergmann R, Pietzsch J, Beck-Sickinger AG. Design, evaluation, and comparison of ghrelin receptor agonists and inverse agonists as suitable radiotracers for PET imaging. Bioconjug Chem. 2012; 23:771–84. https://doi.org/10.1021/bc2005889. [PubMed].
47. Bender BJ, Vortmeier G, Ernicke S, Bosse M, Kaiser A, Els-Heindl S, Krug U, Beck-Sickinger A, Meiler J, Huster D. Structural Model of Ghrelin Bound to its G Protein-Coupled Receptor. Structure. 2019; 27:537–44.e4. https://doi.org/10.1016/j.str.2018.12.004. [PubMed].
48. Howick K, Chruscicka B, Felice D, Ramirez VT, van Leuven L, Pietra C, Cryan JF, Griffin BT, Schellekens H. Behavioural characterization of ghrelin ligands, anamorelin and HM01: Appetite and reward-motivated effects in rodents. Neuropharmacology. 2020; 168:108011. https://doi.org/10.1016/j.neuropharm.2020.108011. [PubMed].
49. Els S, Schild E, Petersen PS, Kilian TM, Mokrosinski J, Frimurer TM, Chollet C, Schwartz TW, Holst B, Beck-Sickinger AG. An aromatic region to induce a switch between agonism and inverse agonism at the ghrelin receptor. J Med Chem. 2012; 55:7437–49. https://doi.org/10.1021/jm300414b. [PubMed].
50. Cummings DE, Purnell JQ, Frayo RS, Schmidova K, Wisse BE, Weigle DS. A preprandial rise in plasma ghrelin levels suggests a role in meal initiation in humans. Diabetes. 2001; 50:1714–9. https://doi.org/10.2337/diabetes.50.8.1714. [PubMed].
51. Jorgensen JT, Persson M, Madsen J, Kjaer A. High tumor uptake of (64)Cu: implications for molecular imaging of tumor characteristics with copper-based PET tracers. Nucl Med Biol. 2013; 40:345–50. https://doi.org/10.1016/j.nucmedbio.2013.01.002. [PubMed].
52. Els S, Beck-Sickinger AG, Chollet C. Ghrelin receptor: high constitutive activity and methods for developing inverse agonists. Methods Enzymol. 2010; 485:103–21. https://doi.org/10.1016/B978-0-12-381296-4.00006-3. [PubMed].
53. Bailon P, Won CY. PEG-modified biopharmaceuticals. Expert Opin Drug Deliv. 2009; 6:1–16. https://doi.org/10.1517/17425240802650568. [PubMed].
54. Filpula D, Zhao H. Releasable PEGylation of proteins with customized linkers. Adv Drug Deliv Rev. 2008; 60:29–49. https://doi.org/10.1016/j.addr.2007.02.001. [PubMed].
55. Correia JD, Paulo A, Raposinho PD, Santos I. Radiometallated peptides for molecular imaging and targeted therapy. Dalton Trans. 2011; 40:6144–67. https://doi.org/10.1039/c0dt01599g. [PubMed].
56. Cutler CS, Hennkens HM, Sisay N, Huclier-Markai S, Jurisson SS. Radiometals for combined imaging and therapy. Chem Rev. 2013; 113:858–83. https://doi.org/10.1021/cr3003104. [PubMed].
57. Bass LA, Wang M, Welch MJ, Anderson CJ. In vivo transchelation of copper-64 from TETA-octreotide to superoxide dismutase in rat liver. Bioconjug Chem. 2000; 11:527–32. https://doi.org/10.1021/bc990167l. [PubMed].
58. Fani M, Del Pozzo L, Abiraj K, Mansi R, Tamma ML, Cescato R, Waser B, Weber WA, Reubi JC, Maecke HR. PET of Somatostatin Receptor-Positive Tumors Using Cu-64- and Ga-68-Somatostatin Antagonists: The Chelate Makes the Difference. J Nucl Med. 2011; 52:1110–8. https://doi.org/10.2967/jnumed.111.087999. [PubMed].
59. Oxboel J, Schjoeth-Eskesen C, El-Ali HH, Madsen J, Kjaer A. (64)Cu-NODAGA-c(RGDyK) Is a Promising New Angiogenesis PET Tracer: Correlation between Tumor Uptake and Integrin alpha(V)beta(3) Expression in Human Neuroendocrine Tumor Xenografts. Int J Mol Imaging. 2012; 2012:379807. https://doi.org/10.1155/2012/379807. [PubMed].
60. Roosenburg S, Laverman P, Joosten L, Cooper MS, Kolenc-Peitl PK, Foster JM, Hudson C, Leyton J, Burnet J, Oyen WJ, Blower PJ, Mather SJ, Boerman OC, Sosabowski JK. PET and SPECT imaging of a radiolabeled minigastrin analogue conjugated with DOTA, NOTA, and NODAGA and labeled with (64)Cu, (68)Ga, and (111)In. Mol Pharm. 2014; 11:3930–7. https://doi.org/10.1021/mp500283k. [PubMed].
61. Kang CM, Koo HJ, Choe YS, Choi JY, Lee KH, Kim BT. Ga-68-NODAGA-VEGF(121) for in vivo imaging of VEGF receptor expression. Nucl Med Biol. 2014; 41:51–7. https://doi.org/10.1016/j.nucmedbio.2013.09.005. [PubMed].
62. Blasi F, Oliveira BL, Rietz TA, Rotile NJ, Day H, Looby RJ, Ay I, Caravan P. Effect of Chelate Type and Radioisotope on the Imaging Efficacy of 4 Fibrin-Specific PET Probes. J Nucl Med. 2014; 55:1157–63. https://doi.org/10.2967/jnumed.113.136275. [PubMed].
63. Gasser G, Tjioe L, Graham B, Belousoff MJ, Juran S, Walther M, Kunstler JU, Bergmann R, Stephan H, Spiccia L. Synthesis, copper(II) complexation, Cu-64-labeling, and bioconjugation of a new bis(2-pyridylmethyl) derivative of 1,4,7-triazacyclononane. Bioconjug Chem. 2008; 19:719–30. https://doi.org/10.1021/bc700396e. [PubMed].
64. Juran S, Walther M, Stephan H, Bergmann R, Steinbach J, Kraus W, Emmerling F, Comba P. Hexadentate bispidine derivatives as versatile bifunctional chelate agents for copper(II) radioisotopes. Bioconjug Chem. 2009; 20:347–59. https://doi.org/10.1021/bc800461e. [PubMed].
65. Wren AM, Bloom SR. Gut hormones and appetite control. Gastroenterology. 2007; 132:2116–30. https://doi.org/10.1053/j.gastro.2007.03.048. [PubMed].
66. Freire RH, Alvarez-Leite JI. Appetite control: hormones or diet strategies? Curr Opin Clin Nutr Metab Care. 2020; 23:328–35. https://doi.org/10.1097/MCO.0000000000000675. [PubMed].
67. Leite-Moreira AF, Soares JB. Physiological, pathological and potential therapeutic roles of ghrelin. Drug Discov Today. 2007; 12:276–88. https://doi.org/10.1016/j.drudis.2007.02.009. [PubMed].
68. Kojima M, Hosoda H, Kangawa K. Purification and distribution of ghrelin: the natural endogenous ligand for the growth hormone secretagogue receptor. Horm Res. 2001; 56:93–7. https://doi.org/10.1159/000048143. [PubMed].
69. Davenport AP, Bonner TI, Foord SM, Harmar AJ, Neubig RR, Pin JP, Spedding M, Kojima M, Kangawa K. International Union of Pharmacology. LVI. Ghrelin receptor nomenclature, distribution, and function. Pharmacol Rev. 2005; 57:541–6. https://doi.org/10.1124/pr.57.4.1. [PubMed].
70. Thieme S, Walther M, Pietzsch HJ, Henniger J, Preusche S, Mading P, Steinbach J. Module-assisted preparation of Cu-64 with high specific activity. Appl Radiat Isot. 2012; 70:602–8. https://doi.org/10.1016/j.apradiso.2012.01.019. [PubMed].
71. Bergmann R, Ruffani A, Graham B, Spiccia L, Steinbach J, Pietzsch J, Stephan H. Synthesis and radiopharmacological evaluation of (6)(4)Cu-labeled bombesin analogs featuring a bis(2-pyridylmethyl)-1,4,7-triazacyclononane chelator. Eur J Med Chem. 2013; 70:434–46. https://doi.org/10.1016/j.ejmech.2013.10.013. [PubMed].
72. Xie F, Bergmann R, Kniess T, Deuther-Conrad W, Mamat C, Neuber C, Liu B, Steinbach J, Brust P, Pietzsch J, Jia H. (18)F-Labeled 1,4-Dioxa-8-azaspiro[4.5]decane Derivative: Synthesis and Biological Evaluation of a sigma1 Receptor Radioligand with Low Lipophilicity as Potent Tumor Imaging Agent. J Med Chem. 2015; 58:5395–407. https://doi.org/10.1021/acs.jmedchem.5b00593. [PubMed].
73. Feldmann A, Arndt C, Bergmann R, Loff S, Cartellieri M, Bachmann D, Aliperta R, Hetzenecker M, Ludwig F, Albert S, Ziller-Walter P, Kegler A, Koristka S, et al. Retargeting of T lymphocytes to PSCA-or PSMA positive prostate cancer cells using the novel modular chimeric antigen receptor platform technology “UniCAR”. Oncotarget. 2017; 8:31368–85. https://doi.org/10.18632/oncotarget.15572. [PubMed].
74. Bachmann D, Aliperta R, Bergmann R, Feldmann A, Koristka S, Arndt C, Loff S, Welzel P, Albert S, Kegler A, Ehninger A, Cartellieri M, Ehninger G, et al. Retargeting of UniCAR T cells with an in vivo synthesized target module directed against CD19 positive tumor cells. Oncotarget. 2018; 9:7487–500. https://doi.org/10.18632/oncotarget.23556. [PubMed].
75. Jentsch C, Bergmann R, Bruchner K, Mosch B, Yaromina A, Krause M, Zips D, Troost EGC, Loeck S, Kotzerke J, Steinbach J, Thames H, Baumann M, Beuthien-Baumann B. Impact of pre- and early per-treatment FDG-PET based dose-escalation on local tumour control in fractionated irradiated FaDu xenograft tumours. Radiother Oncol. 2016; 121:447–52. https://doi.org/10.1016/j.radonc.2016.07.024. [PubMed].
76. Bergmann R, Kubeil M, Zarschler K, Chhabra S, Tajhya RB, Beeton C, Pennington MW, Bachmann M, Norton RS, Stephan H. Distribution and kinetics of the Kv1.3-blocking peptide HsTX1[R14A] in experimental rats. Sci Rep. 2017; 7:3756. https://doi.org/10.1038/s41598-017-03998-x. [PubMed].
77. Torigian DA, Lopez RF, Alapati S, Bodapati G, Hofheinz F, van den Hoff J, Saboury B, Alavi A. Feasibility and performance of novel software to quantify metabolically active volumes and 3D partial volume corrected SUV and metabolic volumetric products of spinal bone marrow metastases on 18F-FDG-PET/CT. Hell J Nucl Med. 2011; 14:8–14. [PubMed].