
Introduction
Primary central nervous system lymphoma (PCNSL) is a rare subgroup of non-Hodgkin lymphoma confined to the central nervous system, with more than 90% of cases classified as Diffuse Large B-cell Lymphoma [1, 2]. Immunosuppressed states have been an established risk factor for PCNSL, with HIV representing a leading factor for the rise in the incidence of PCNSL [2]. Patients living with HIV (PLWH) represent an important population to include in investigations related to PCNSL, as the association with the Epstein Barr virus highlights PCNSL in PLWH is a distinct entity from sporadic cases [3, 4]. While emerging cyto-reductive treatment regimens demonstrate promising results, PCNSL recurrence rate remains high due to the restricted penetration of treatment agents through the protective blood-brain barrier [5–7]. As efficacious therapy strategies continue to evolve and clinical outcomes remain poor, the need to identify prognostic biomarkers for potential risk-stratified and optimized treatment in PCNSL remains an area of further exploration.
Magnetic resonance imaging (MRI) is the modality of choice for imaging CNS lymphomas [8]. Conventional gadolinium enhanced sequences can provide details of the tumor location, infiltration, enhancement pattern and mass effect but without adequately reflecting tumor histopathology [9]. However, diffusion weighted imaging (DWI) and corresponding apparent diffusion coefficient (ADC) maps can provide a representation of the cellular microenvironment [10, 11] with several studies demonstrating that ADC values can predict tumor cellularity across various neoplasms, including lymphomas [10–14]. Expression of tumor Ki-67, a cellular biomarker for proliferative activity, has been shown correlate with overall survival (OS) and progression-free survival (PFS) in PCNSL patients [15–17]. Studies have also suggested that ADC values from various malignancies correlate with the expression of Ki-67 [13, 14, 18–26]. Therefore, ADC values may serve as a potential noninvasive method to prognosticate and monitor response to treatment in PCNSL. These studies, however, were limited due to the small sample sizes (< 30) or neglected to investigate the effect of immune status, as PLWH represent a well-established, clinically distinct, subset of patients with PCNSL. Prior studies also did not incorporate whole tumor volume segmentation with T1 contrast co-registration, which is the most reliable and reproducible method of ADC histogram acquisition [27]. In a recent similar study of whole tumor histogram analysis in PCNSL performed by the authors of this study [28], multiple ADC parameters were inversely correlated with Ki-67 expression and associated with poorer OS. However, tumor segmentation was performed using only the ADC sequence with the potential inclusion of intra-tumoral necrosis, hemorrhage or regions outside of the actual solid tumor that would otherwise have been excluded with contrast co-registration, ultimately providing a suboptimal representation of true tumor parenchyma.
The primary aim of this study is to more comprehensively evaluate the relationship between ADC calculations with tumor Ki-67 expression and clinical outcomes (OS and PFS) using a larger patient sample with the inclusion of PLWH and whole tumor segmentation with T1 post contrast co-registration. Our hypothesis is that ADC values will inversely correlate with Ki-67 expression and that tumors with higher ADC values above the median will have improved OS and PFS.
Results
Patient demographics
90 patients met the inclusion criteria. Of these, 32 were from BTH (36%) and 58 were from MDACC (64%). 23 patients were HIV positive (26%) while 67 patients were HIV negative (74%). Of the 23 patients who were HIV positive, only 1 patient (4.3%) was from MDACC (p < 0.001). Further demographic information is summarized in Supplementary Table 1. One patient was excluded in the Cox Proportional Hazards Models calculations due to lack of available ECOG score.
Qualitative imaging characteristics
Ring enhancement was more common in PLWH than immunocompetent patients (p < 0.001). PLWH were more likely to have multiple tumors while immunocompetent patients were more likely to have single lesions (p = 0.01). Tumor hemorrhage was also more common in PLWH, but not significant (p = 0.14). Further qualitative imaging characteristics are summarized in Supplementary Table 1.
Correlations between ADC parameters and Ki-67
Ki-67 expression data was available for a subset of patients (22, 24.4% of total). There were no significant correlations identified between Ki-67 expression and any ADC histogram parameter (Table 1) in all patients. After lesions from PLWH were excluded (n = 19), statistically significant inverse correlations were observed with nADCmean (r = –0.49, p = 0.03), nADC15 (r = –0.58, p = 0.009), and nADC75 (r = –0.48, p = 0.04). There were no significant correlations in the HIV positive subset.
Table 1: Correlation with Ki-67 in all patients and patients with and without HIV
| Parameter | All patients (n = 22) | HIV positive (n = 3) | HIV negative (n = 19) | |||
|---|---|---|---|---|---|---|
| r | p-value | r | p-value | r | p-value | |
| Skewness | −0.130 | 0.5641 | −0.666 | 0.5361 | −0.102 | 0.6785 |
| Kurtosis | −0.226 | 0.3125 | −0.901 | 0.2859 | −0.167 | 0.4957 |
| nADCMin | 0.244 | 0.2737 | 0.973 | 0.1486 | 0.193 | 0.4284 |
| nADCMax | −0.259 | 0.2442 | 0.725 | 0.4834 | −0.323 | 0.1775 |
| nADCMean | −0.237 | 0.2876 | 0.955 | 0.1928 | −0.494 | 0.0317* |
| nADC1 | 0.290 | 0.1907 | 0.702 | 0.5050 | 0.241 | 0.3204 |
| nADC5 | 0.199 | 0.3744 | 0.617 | 0.5766 | 0.130 | 0.5946 |
| nADC15 | −0.394 | 0.0695 | 0.828 | 0.3787 | −0.580 | 0.0092* |
| nADC75 | −0.349 | 0.1118 | 0.942 | 0.2185 | −0.477 | 0.0391* |
| nADC95 | −0.267 | 0.2297 | 0.991 | 0.0849 | −0.358 | 0.1325 |
| nADC99 | −0.148 | 0.5122 | 0.921 | 0.2551 | −0.175 | 0.4743 |
ADC parameters and overall survival
Four ADC histogram parameters were found to have a statistically significant relationship with OS in all patients after adjustment for age, HIV status, ECOG, and treatment (Table 2). Values above the median for nADCmean (HR = 0.47, 95% CI = 0.253–0.855, p = 0.006), nADC15 (HR = 0.879, 95% CI = 0.456–1.695, p = 0.04), nADC75 (HR = 0.581, 95% CI = 0.294–1.148, p = 0.02) and nADC95 (HR = 0.788, 95% CI = 0.427–1.453, p = 0.04) were associated with improved OS. When analysis was stratified based on HIV status, values above the median for nADCmean (HR = 0.461, 95% CI = 0.21–1.012, p = 0.01), nADC75 (HR = 0.674, 95% CI = 0.286–1.585, p = 0.02) and nADC95 (HR = 0.799, 95% CI = 0.368–1.737, p = 0.06) were significant predictors for improved OS in HIV negative patients, while there were no significant associations with PLWH. Figure 1 illustrates the OS curve for nADCmean.
Table 2: Hazard ratios for overall survival in all patients and patients with and without HIV
| Feature | All patients (n = 89)1 | HIV+ (N = 23)2 | HIV- (n = 66)2 | |||
|---|---|---|---|---|---|---|
| p-value | HR (95% CI) | p-value | HR (95% CI) | p-value | HR (95% CI) | |
| Skewness | 0.6817 | 1.463 (0.785–2.728) | 0.6137 | 2.022 (0.661–6.185) | 0.2522 | 1.555 (0.688–3.517) |
| Kurtosis | 0.2677 | 1.427 (0.708–2.877) | 0.2478 | 2.429 (0.494–11.956) | 0.4393 | 1.383 (0.598–3.199) |
| nADCMin | 0.8748 | 0.789 (0.448–1.391) | 0.7748 | 0.909 (0.302–2.738) | 0.2999 | 0.692 (0.346–1.383) |
| nADCMax | 0.0880 | 0.737 (0.405–1.342) | 0.3526 | 0.574 (0.17–1.943) | 0.6768 | 0.874 (0.428–1.782) |
| nADCMean | 0.0062* | 0.465 (0.253–0.855) | 0.2225 | 0.481 (0.162–1.427) | 0.0110* | 0.461 (0.21–1.012) |
| nADC1 | 0.2265 | 0.721 (0.409–1.268) | 0.6766 | 0.698 (0.227–2.145) | 0.2771 | 0.656 (0.324–1.328) |
| nADC5 | 0.2549 | 0.860 (0.49–1.511) | 0.6904 | 1.062 (0.381–2.959) | 0.3075 | 0.709 (0.354–1.422) |
| nADC15 | 0.0364* | 0.879 (0.456–1.695) | 0.4947 | 1.068 (0.307–3.718) | 0.0691 | 0.908 (0.377–2.188) |
| nADC75 | 0.0149* | 0.581 (0.294–1.148) | 0.6153 | 0.463 (0.131–1.634) | 0.0156* | 0.674 (0.286–1.585) |
| nADC95 | 0.0358* | 0.788 (0.427–1.453) | 0.6594 | 1.051 (0.291–3.799) | 0.0567 | 0.799 (0.368–1.737) |
| nADC99 | 0.4637 | 0.562 (0.289–1.092) | 0.2643 | 0.412 (0.084–2.026) | 0.2898 | 0.482 (0.213–1.090) |
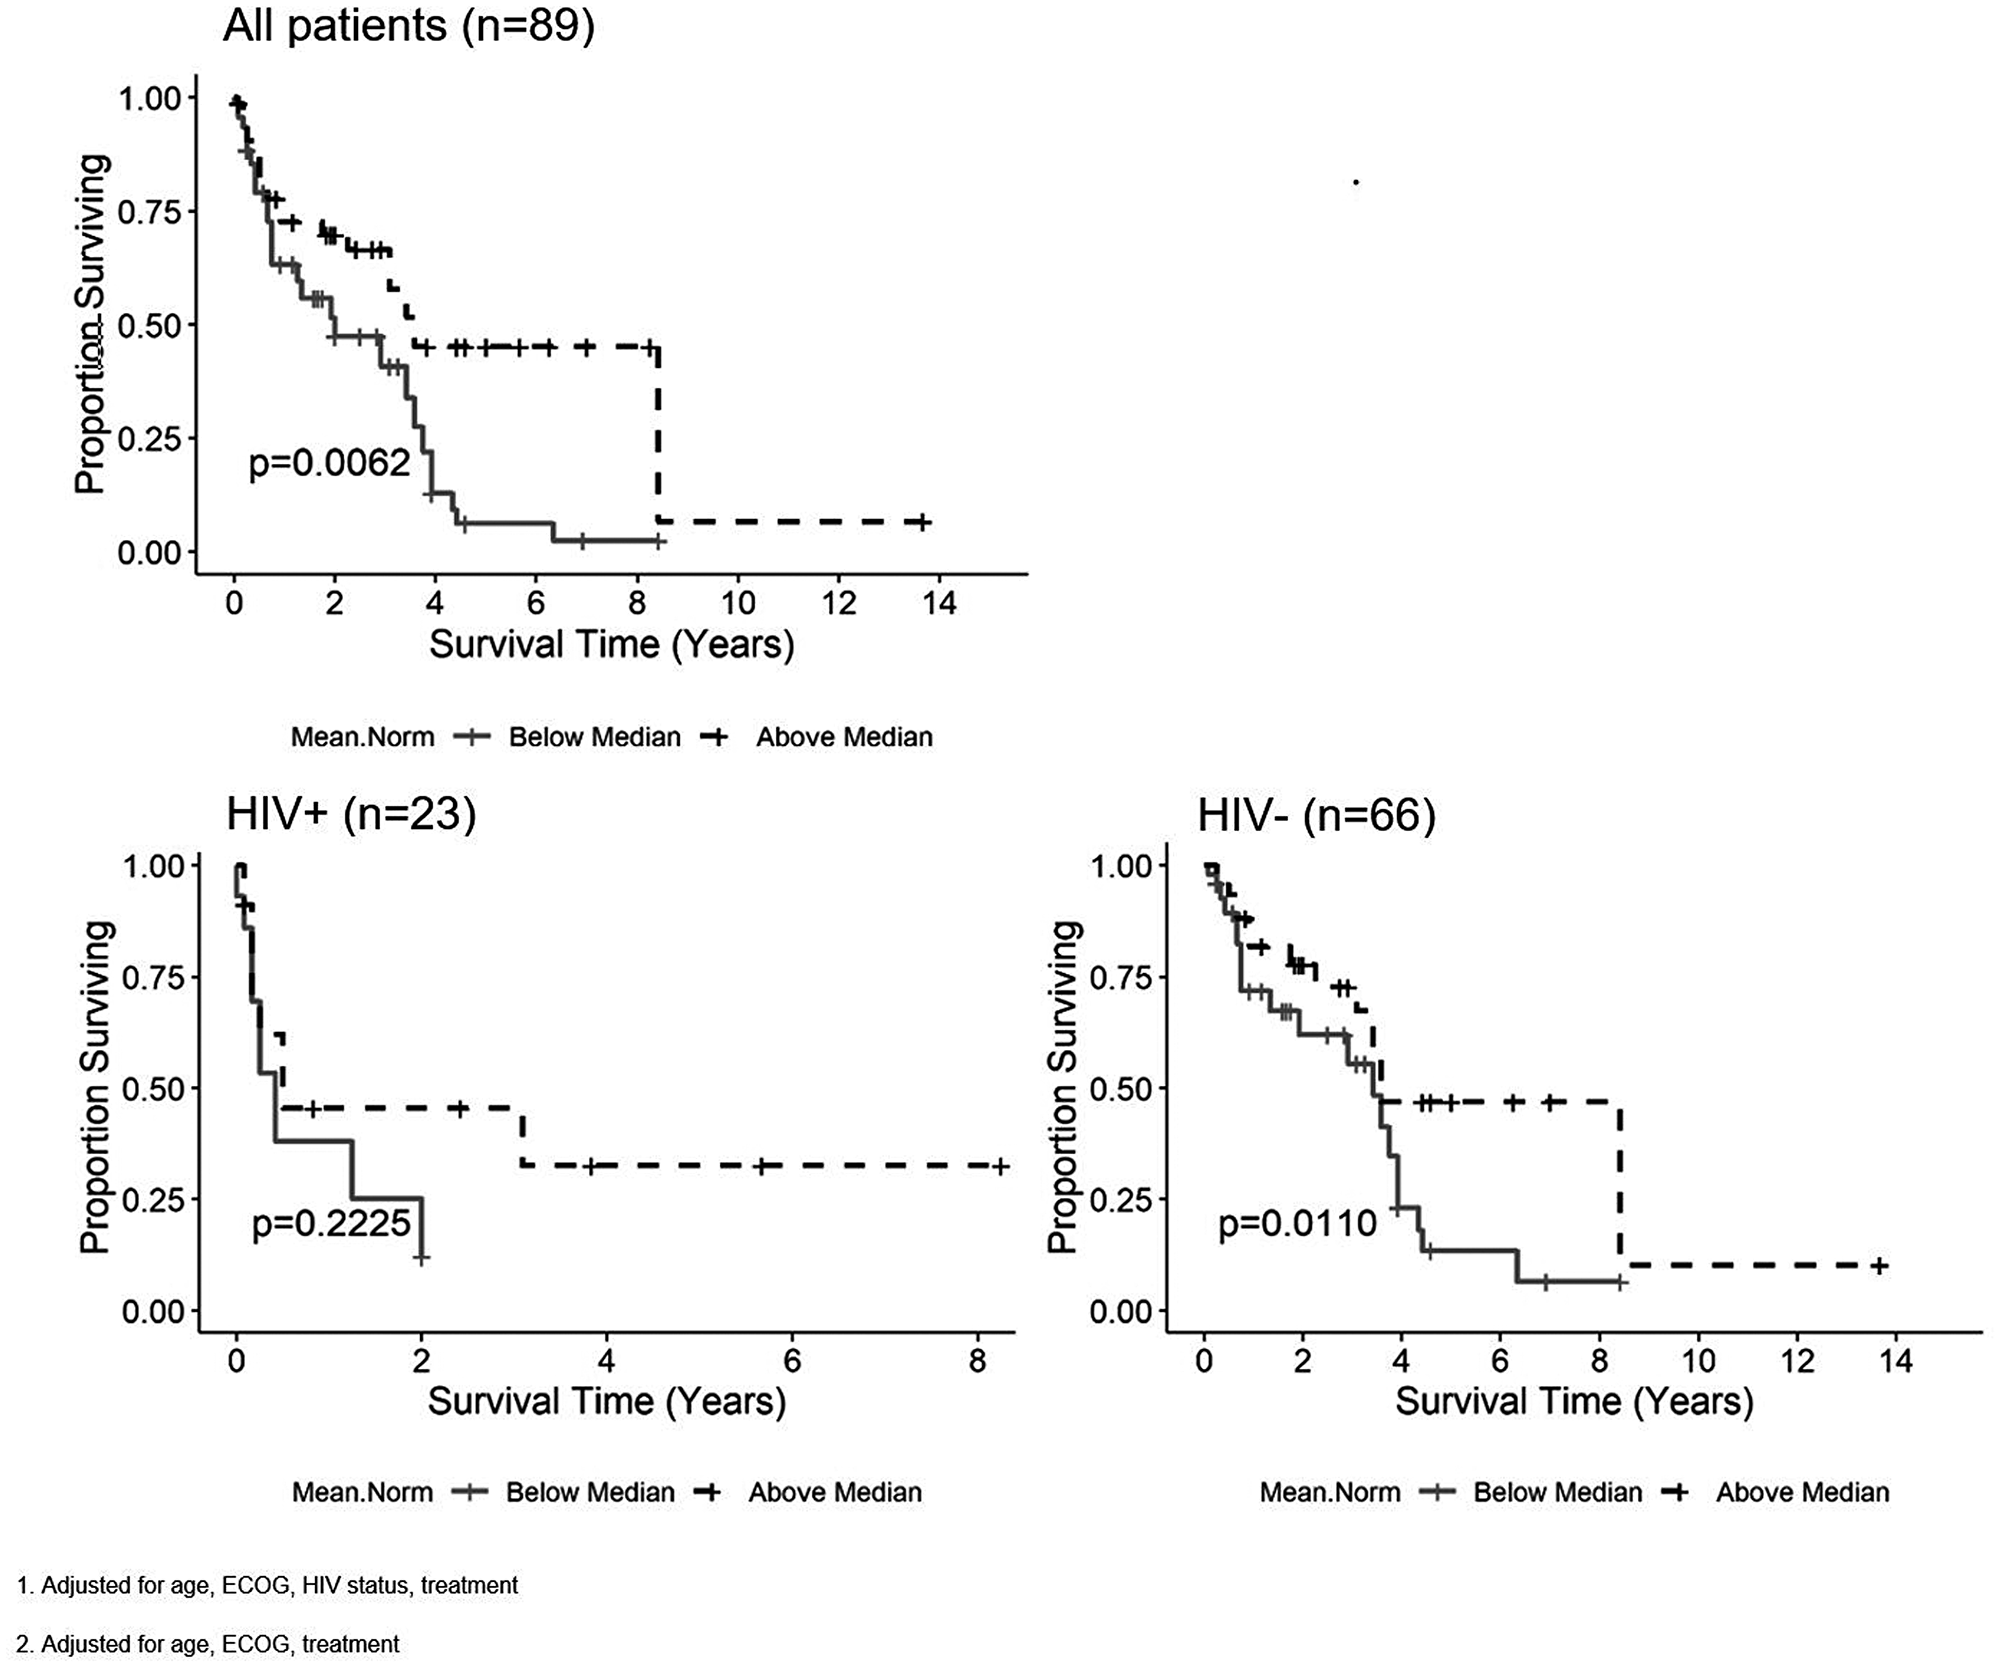
Figure 1: Kaplan-Meier curves for the nADCmean parameter and overall survival (OS) in all patients1, patients living with HIV2 (PLWH) and HIV negative patients2. Tumors with ADC values above the median for nADCmean are associated with improved OS in all patients and HIV negative patients, but not in PLWH.
ADC parameters and progression-free survival
Five ADC histogram parameters were found to have a statistically significant relationship with PFS in all patients after adjustment for age, HIV status, ECOG and treatment (Table 3). Values above the median for nADCmin (HR = 0.557, 95% CI = 0.316–0.983, p = 0.03), nADCmean (HR = 0.462, 95% CI = 0.255–0.838, p = 0.001), nADC1 (HR = 0.436, 95% CI = 0.244–0.780, p = 0.004), nADC5 (HR = 0.484, 95% CI = 0.272–0.862, p = 0.006) and ADC histogram kurtosis (HR = 2.35, 95% CI = 1.204–4.588, p = 0.008) were significant predictors for improved PFS. Values above the median for nADC75 were marginally significant (HR = 0.618, 95% CI = 0.326–1.170, p = 0.06). When analysis was limited to HIV negative patients, values above the median of five ADC parameters were significant predictors for improved PFS, including nADCmin (HR = 0.427, 95% CI = 0.21–0.869, p = 0.005), nADCmean (HR = 0.437, 95% CI = 0.206–0.927, p = 0.003), nADC1 (HR = 0.35, 95% CI = 0.171–0.718, p = 0.002), nADC5 (HR = 0.393, 95% CI = 0.195–0.794, p = 0.003) and nADC75 (HR = 0.583, 95% CI = 0.268–1.27, p = 0.03). In the HIV positive subset, there were no significant correlations with any ADC parameter and PFS. Figure 2 illustrates the PFS curve for nADCmean.
Table 3: Hazard ratios for progression free survival in all patients and patients with and without HIV
| Feature | All patients (n = 89)1 | HIV+ (N = 23)2 | HIV- (n = 66)2 | |||
|---|---|---|---|---|---|---|
| p-value | HR (95% CI) | p-value | >HR (95% CI) | p-value | HR (95% CI) | |
| Skewness | 0.1627 | 2.026 (1.131–3.627) | 0.9491 | 2.839 (0.851–9.47) | 0.1055 | 1.6 (0.778–3.29) |
| Kurtosis | 0.0082* | 2.35 (1.204–4.588) | 0.1869 | 4.313 (0.537–34.662) | 0.0759 | 1.848 (0.879–3.883) |
| nADCMin | 0.0313* | 0.557 (0.316–0.983) | 0.9330 | 0.835 (0.27–2.585) | 0.0053* | 0.427 (0.21–0.869) |
| nADCMax | 0.4497 | 0.799 (0.461–1.385) | 0.5308 | 0.8 (0.254–2.522) | 0.6771 | 0.803 (0.409–1.576) |
| nADCMean | 0.0012* | 0.462 (0.255–0.838) | 0.1770 | 0.448 (0.151–1.325) | 0.0030* | 0.437 (0.206–0.927) |
| nADC1 | 0.0043* | 0.436 (0.244–0.78) | 0.4448 | 0.636 (0.2–2.023) | 0.0018* | 0.35 (0.171–0.718) |
| nADC5 | 0.0063* | 0.484 (0.272–0.862) | 0.4351 | 0.845 (0.3–2.383) | 0.0033* | 0.393 (0.195–0.794) |
| nADC15 | 0.2584 | 1.183 (0.625–2.238) | 0.6675 | 1.533 (0.39–6.022) | 0.1990 | 0.947 (0.441–2.035) |
| nADC75 | 0.0569 | 0.618 (0.326–1.17) | 0.7717 | 0.482 (0.135–1.719) | 0.0248* | 0.583 (0.268–1.27) |
| nADC95 | 0.1482 | 0.889 (0.504–1.568) | 0.9131 | 1.416 (0.407–4.931) | 0.0864 | 0.714 (0.35–1.455) |
| nADC99 | 0.3223 | 0.353 (0.188–0.664) | 0.2295 | 0.232 (0.029–1.863) | 0.4752 | 0.398 (0.197–0.803) |
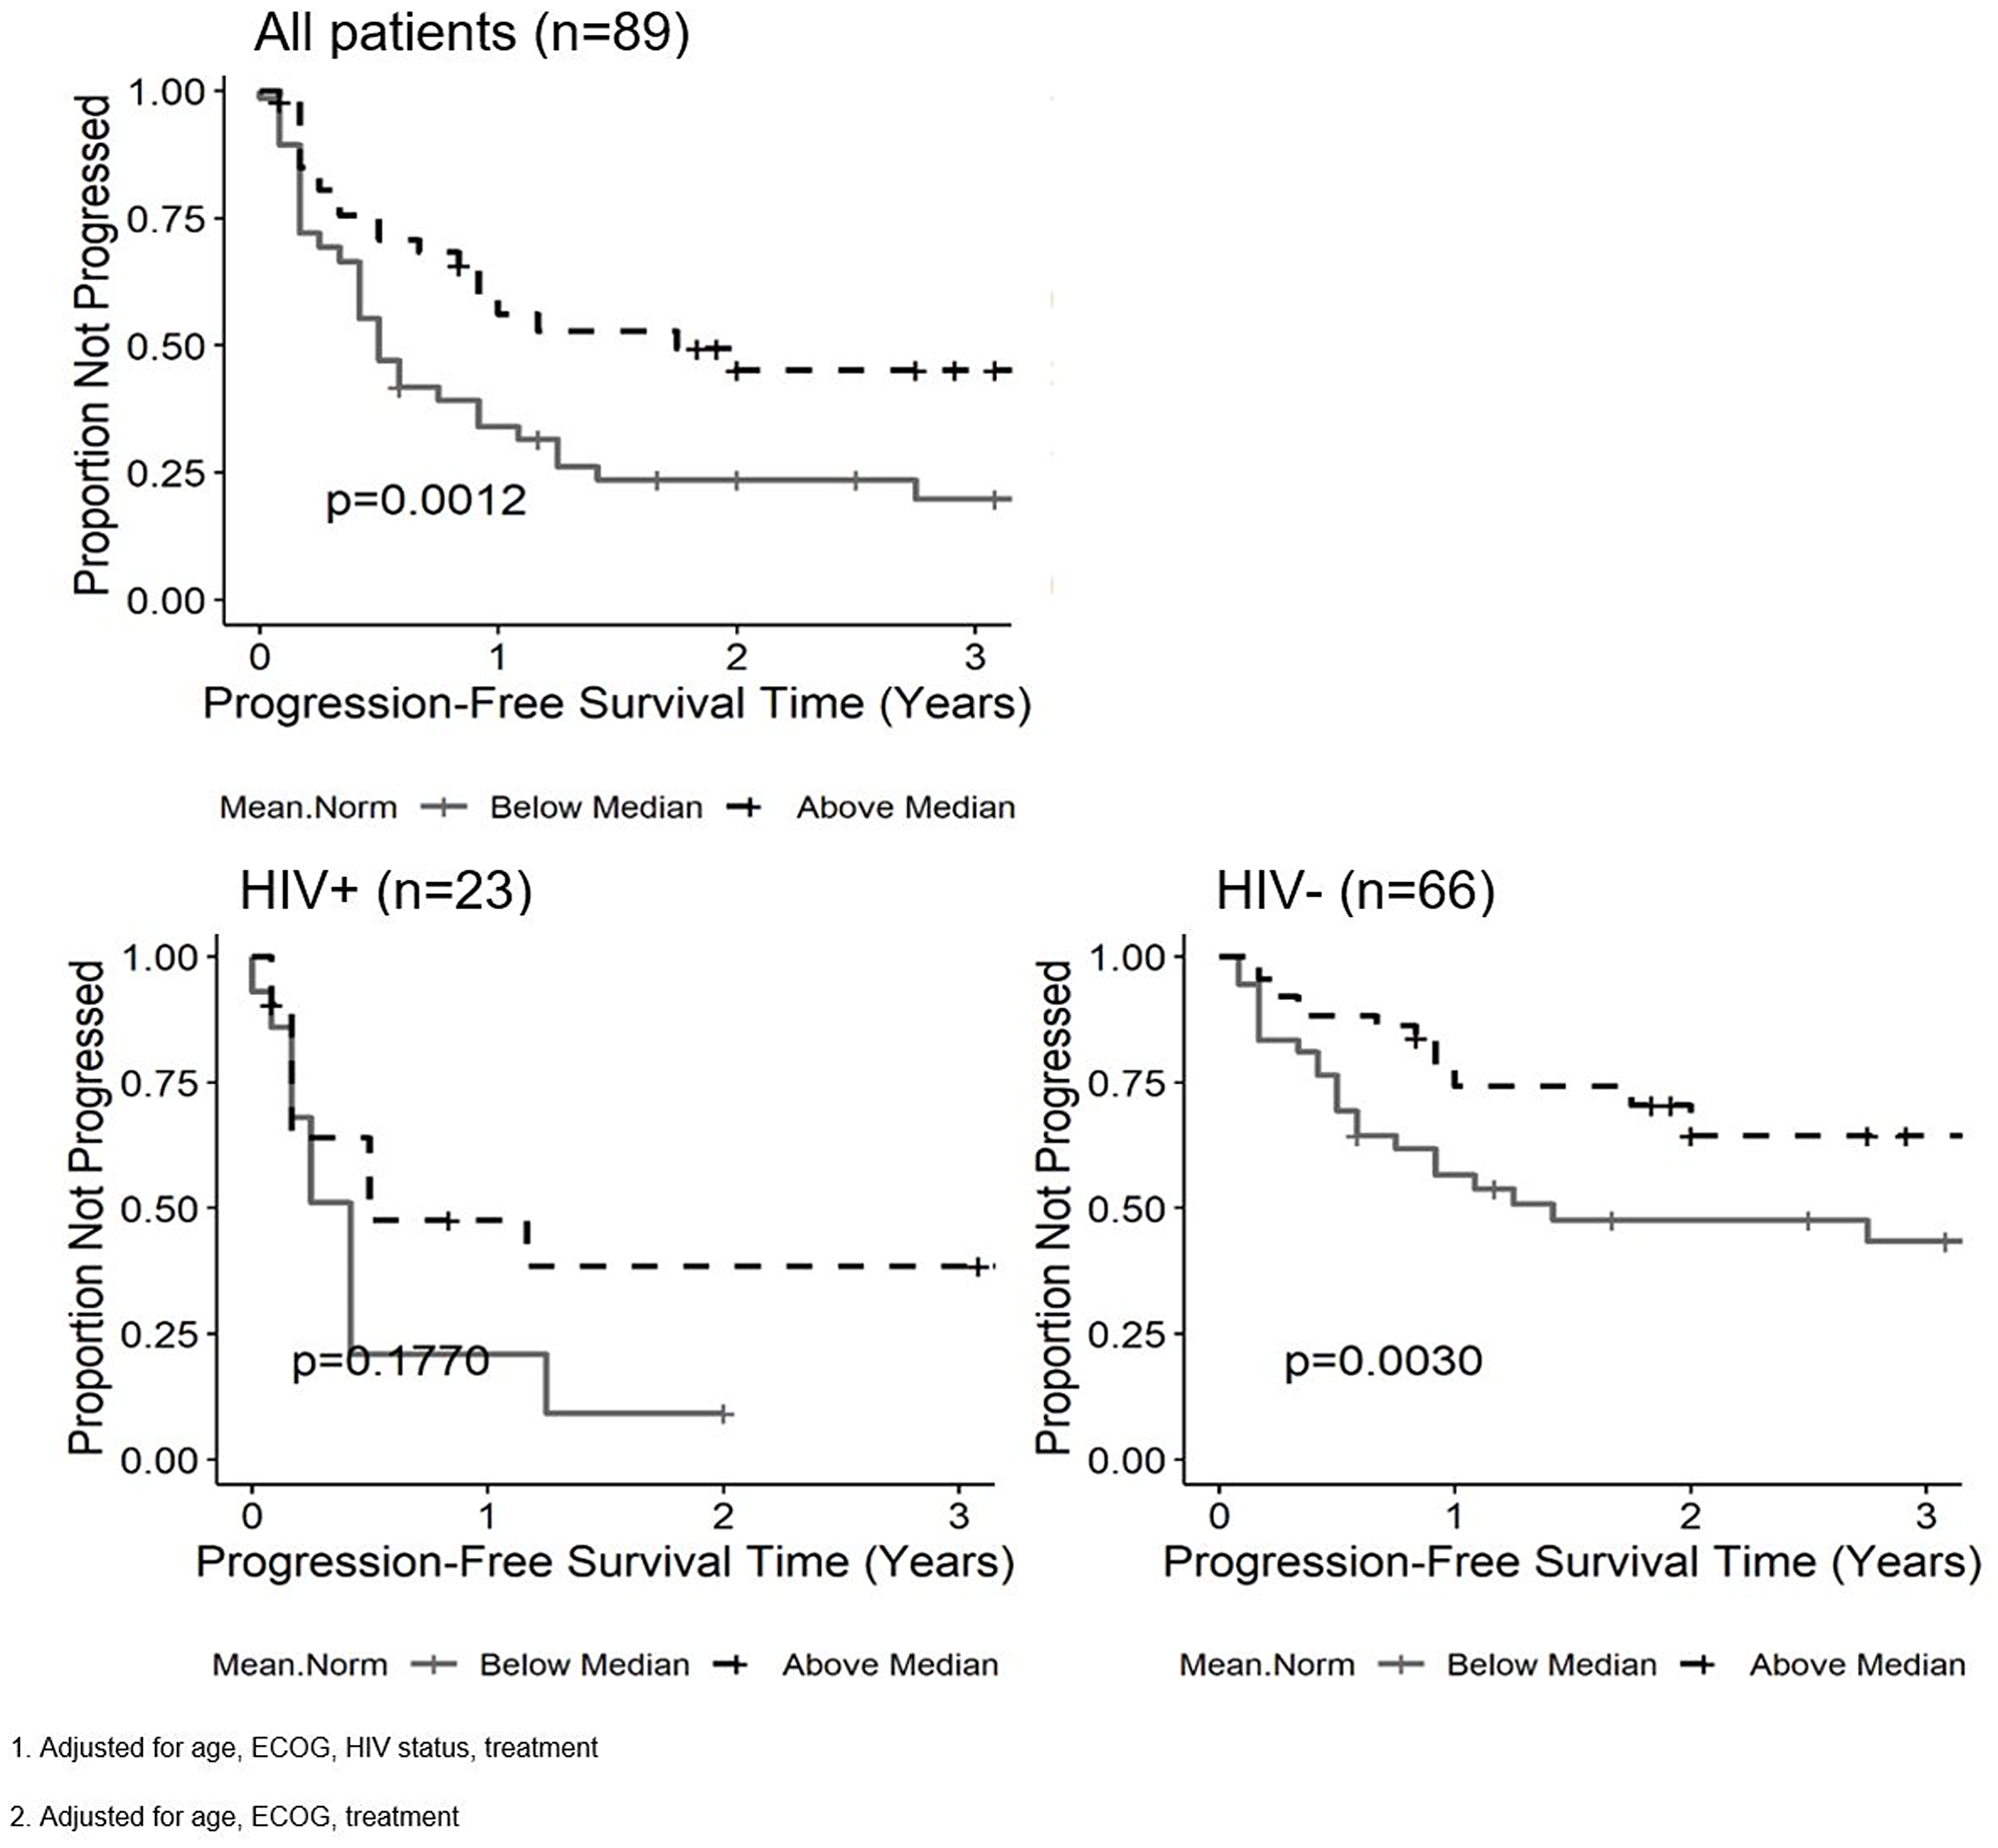
Figure 2: Kaplan-Meier curves for the nADCmean parameter and progression free survival (PFS) in all patients1, patients living with HIV2 (PLWH) and HIV negative patients2. Tumors with ADC values above the median for nADCmean are associated with improved PFS in all patients and HIV negative patients, but not in PLWH.
Additional factors impacting overall survival and progression-free survival
HIV status was associated with poorer OS (median survival of 6 months versus 43 months, p = 0.003). ECOG score of 0–1 was associated with improved OS for all patients (median survival of 47 months versus 8 months, p < 0.001). Individuals with lesion hemorrhage had poorer OS (median survival of 21 months versus 30 months, p = 0.01) and PFS (median time to recurrence 22 months versus 30 months, p = 0.05). These findings are summarized on Supplementary Table 1.
DISCUSSION
Our results suggest that multiple normalized ADC parameters inversely correlate with tumor Ki-67 expression in HIV negative patients, specifically nADCmean, nADC15 and nADC75. This inverse relationship between ADC parameters and Ki-67 expression concurs with existing studies [19, 20, 22–26, 29, 30]. Schob and colleagues (2016) examined 21 patients with PCNSL using single ROI for ADC quantification and found inverse correlations between Ki-67 expression and multiple ADC parameters [19]. While our correlations were only significant in the HIV negative subset, the findings by Schob and colleagues also only included immunocompetent patients. Further work by Schob et al. (2018) found that only the ninetieth percentile (ADC90) of whole tumor diffusion profiling showed an inverse correlation with the expression of Ki-67 [20]. Our findings suggest that additional ADC parameters not previously identified may reflect tumor proliferation, which may indicate a higher sensitivity of ADC analysis to predict proliferation than previously thought. A potential explanation may be related to both our larger patient sample size and the use of whole tumor segmentation with post-contrast co-registration, which has been shown to be a more reliable and reproducible method of segmentation compared to the singular ROI method utilized by prior studies [27].
Our study suggests that ADC values above the median of multiple normalized ADC parameters were significant predictors of improved OS and PFS in immunocompetent patients with PCNSL. We postulate that tumors with higher ADC values reflect less cellularity, as the inverse relationship between tumor cellularity and ADC values has been shown in a broad spectrum of malignancies, including PCNSL [10, 11, 18] and may imply less aggressive tumors that are more responsive to existing treatment. Existing studies in the literature concur with our findings in immunocompetent patients with PCNSL. Barajas et al. (2010) found that the low ADC group (defined by ADC25) was associated with shorter PFS and OS and the high ADC group was found to have improved OS and PFS [18]. Valles et al. (2013) also demonstrated that lesions with ADC values in the low ADC parameter were associated with increased progression and death compared to the high ADC group [21]. Our findings not only substantiate the literature supporting the use of ADC as an imaging biomarker for prognosis, but also suggest that additional ADC parameters not previously identified as significant may also predict outcomes. Furthermore, prediction of survival outcomes based on ADC values remained significant even when adjusting for treatment. This suggests that the pre-treatment MR exam with DWI and T1 post-contrast sequences should be sufficient to predict OS and PFS in immunocompetent PCNSL patients.
The current study investigates the impact of immune status on ADC histogram analysis for tumor proliferation expression and patient outcomes, an area largely unexplored in the current literature. In this study, ADC values from PLWH did not show any correlation with Ki-67 expression or with patient outcomes. A possible explanation may be that PCNSL in immunosuppressed patients more often exhibit necrotic regions and may develop spontaneous hemorrhage compared to HIV negative patients [8, 31]. We hypothesize that the tumoral necrosis characteristic of PCNSL in PLWH results in decreased tumor cellularity and viable tumor, thereby altering the tumoral ADC profile and ultimately the relationship of ADC to clinical outcomes and histology. Hemorrhage is also known to alter the tumor micro-environment, leading to changes in ADC values based on the age of the hemorrhage [32–34]. Our similar recently published work demonstrated significant associations between multiple ADC parameters and poorer OS, in addition to significant inverse correlations with Ki-67 expression, even in PLWH [28]. However, a major limitation was the lack of co-registration of the ADC and T1 post-contrast sequences during segmentation. Segmentation of the ADC sequence alone in that study may have included areas of intra-tumoral necrosis, hemorrhage, or regions outside of the enhancing tumor margin, resulting in variable and inaccurate tumor ADC histogram characterization. In the current study using co-registration, while areas of necrosis and hemorrhage were excluded during segmentation based on imaging features, microscopic necrosis or hemorrhage beyond the resolution of imaging may have been included. Additionally, the lack of correlation between ADC parameters and Ki-67 expression in PLWH may be the result of the small sample size of PLWH with available Ki-67 data (n = 3). The very small sample size results in a significant limitation in drawing a correlation between ADC parameters and tumor proliferative activity in PLWH, necessitating further evaluation with larger sample sizes in potential future studies. Overall, ADC histogram profiling may have a limited role in patients with immunosuppression, although the imaging, pathological and clinical correlation of PCNSL in PLWH is still a developing area of research.
This study identified additional qualitative imaging features and clinical factors to further expand the knowledge of PCNSL outside of ADC histogram analysis. Lesions from PLWH were more likely to be ring-enhancing and multi-centric compared to lesions in the immunocompetent, as has been well established [8, 35]. HIV status was associated with poorer overall survival, which also concurs with prior findings [36]. Our results substantiate the existing knowledge that the imaging and clinical features for PCNSL in PLWH and immunocompetent patients are distinct entities [3, 4, 8]. Lesion hemorrhage, higher ECOG scores and the absence of treatment with autologous stem cell transplantation were also associated with poorer outcomes when adjusting for HIV status, similar to other established studies [36–38]. This confirms additional prognostic factors to consider in the treatment of PCNSL in conjunction with ADC histogram analysis.
There are various limitations to our study. Although our patient population appears representative of a large group, our sample size was relatively small, though remains larger than similar radiological publications. The small sample size of available Ki-67 data is a potential cause for lack of statistical significance for correlations between the various ADC parameters when adjusting for the false discovery rate, although there still appears to be a trend between ADC parameters and Ki-67 that warrants further investigation. Secondly, the retrospective and multi-center nature of the study and the use of multiple vendors and magnet strengths resulted in non-uniform image acquisition parameters, which alters ADC values [39]. This, however, replicates real life experience. Lastly, the distribution of patients in each treatment group was uneven which limits comparison. The largest group was treated with methotrexate based combined chemotherapy and had a prolonged overall survival.
When compared to similar prior studies, the strengths of our study include: 1) a larger, multicenter sample size with the inclusion of PLWH; 2) the use of co-registered T1 post-contrast images to ensure of whole tumor analysis instead of a singular or multiple regions of interest; 3) normalizing ADC values to normal contralateral white matter; 4) stratifying patients based on immune status, which to our knowledge, has not been extensively evaluated; and 5) inclusion of imaging and clinical characteristics which demonstrated an impact on outcomes.
The role of MR in PCNSL historically has been the detection and qualitative evaluation of response to treatment. DWI and derived ADC maps have been a well-established tool in neuroimaging, but the use of ADC histogram profiling has not been widely accepted in daily practice. Our data expands the role of conventional MR imaging by utilizing quantitative ADC histogram analysis to predict clinical outcomes and tumor expression of Ki-67, a biomarker for tumor proliferative activity, in immunocompetent PCNSL patients. The role of using ADC as an imaging biomarker in PLWH may be limited. Quantitative ADC histogram analysis should be strongly considered as part of the imaging protocol in the evaluation of immunocompetent patients with PCNSL.
Materials and Methods
Patient selection
This is a retrospective IRB-approved, HIPAA-compliant study of patients diagnosed with PCNSL at The University of Texas MD Anderson Cancer Center (MDACC) between March 2000 and July 2016 and at Ben Taub Hospital (BTH) between January 2012 and December 2016. Patients that met the following inclusion criteria were included: 1) age > 18 years; 2) pathologically proven PCNSL that presented during the study period; 3) pretreatment standard brain MRI at 1.5T or 3.0T; 4) no evidence of systemic lymphoma by whole-body computed tomography or positron emission tomography scan, and bone marrow biopsy. We reviewed the electronic health records (EHR) and collected relevant socio-demographic characteristics, ECOG performance status, HIV status, pathology results, expression of Ki-67, MR imaging characteristics, treatment and clinical outcomes. The patient population selected for this study is identical to the population used in our prior study evaluating tumor histogram analysis in PCNSL [28].
MR imaging parameters
Images were acquired using the clinical diagnostic parameters using either a 1.5 or 3.0 Tesla scanners, General Electric (Milwaukee, Wisconsin) or Siemens (Erlangen, Germany); a minority of the images were from outside facilities. DWI were obtained with the following parameters using spin echo, echo planar sequences: 1) for BTH: minimum echo time (TE), time (TR) = 8000 ms, no flip angle, slice thickness = 5 mm (27 slices), and field of view (FOV) = 36 cm with diffusion-sensitizing gradients applied with b factors of 0 and 1000 s/mm2 2) for MDACC: TE = 8.9 ms, TR = 6600 ms, slice thickness = 5 mm, and FOV = 36 cm with diffusion-sensitizing gradients applied with b factors of 0, 500, and 1000 s/mm2. ADC maps were automatically generated on the operating console with commercially available software. Axial T1-weighted post contrast sequences were obtained with the following parameters: 1) for BTH: TE = 11ms, TR 750 ms, slice thickness = 5 mm, FOV = 24 cm and 354 × 192 acquisition matrix; 2) for MDA: 12ms TE, 700 TR, 5 mm slice thickness, FOV = 24 cm and 352 × 224 acquisition matrix.
Analysis of MRI imaging
Images were exported from the PACS in DICOM format, converted to a Neuroimaging Informatics Technology Initiative (NIfTI) file and then were uploaded to 3D slicer (version 4.7, http://www.slicer.org). This is an open source software platform for medical imaging informatics [40]. 3D slicer was used for image analysis and segmentation. Using 3D slicer, ADC maps and the T1 post-gadolinium contrast sequences were co-registered. Volume of interest (VOI) consisting of areas of gadolinium-enhancement were outlined and automatically propagated onto the corresponding ADC map (Figure 3). Only one lesion was selected for analysis in each patient. For patients with multiple lesions, the largest lesion was used for analysis. The VOI was segmented to exclude necrosis and hemorrhage in order to optimally obtain enhancing solid tumor. Necrosis was defined as an area of non-enhancement within the VOI. Hemorrhage was diagnosed by imaging features using pre-contrast T1WI and gradient echo sequences. To ensure optimum segmentation, 2 board certified neuroradiologists in consensus reviewed all tumor VOI prior to analysis (F. E. M. 15 years of experience, and R. R. C. 9 years of experience). A contralateral normal white matter VOI was obtained to calculate normalized ADC (nADC) ratios to correct for variations in imaging technologies and white matter disease within the dataset [14, 17, 21]. Distribution of the ADC values for the segmented tumors, normal white matter and normalized ADC values are provided as supplementary materials (Supplementary Figures 1–3).
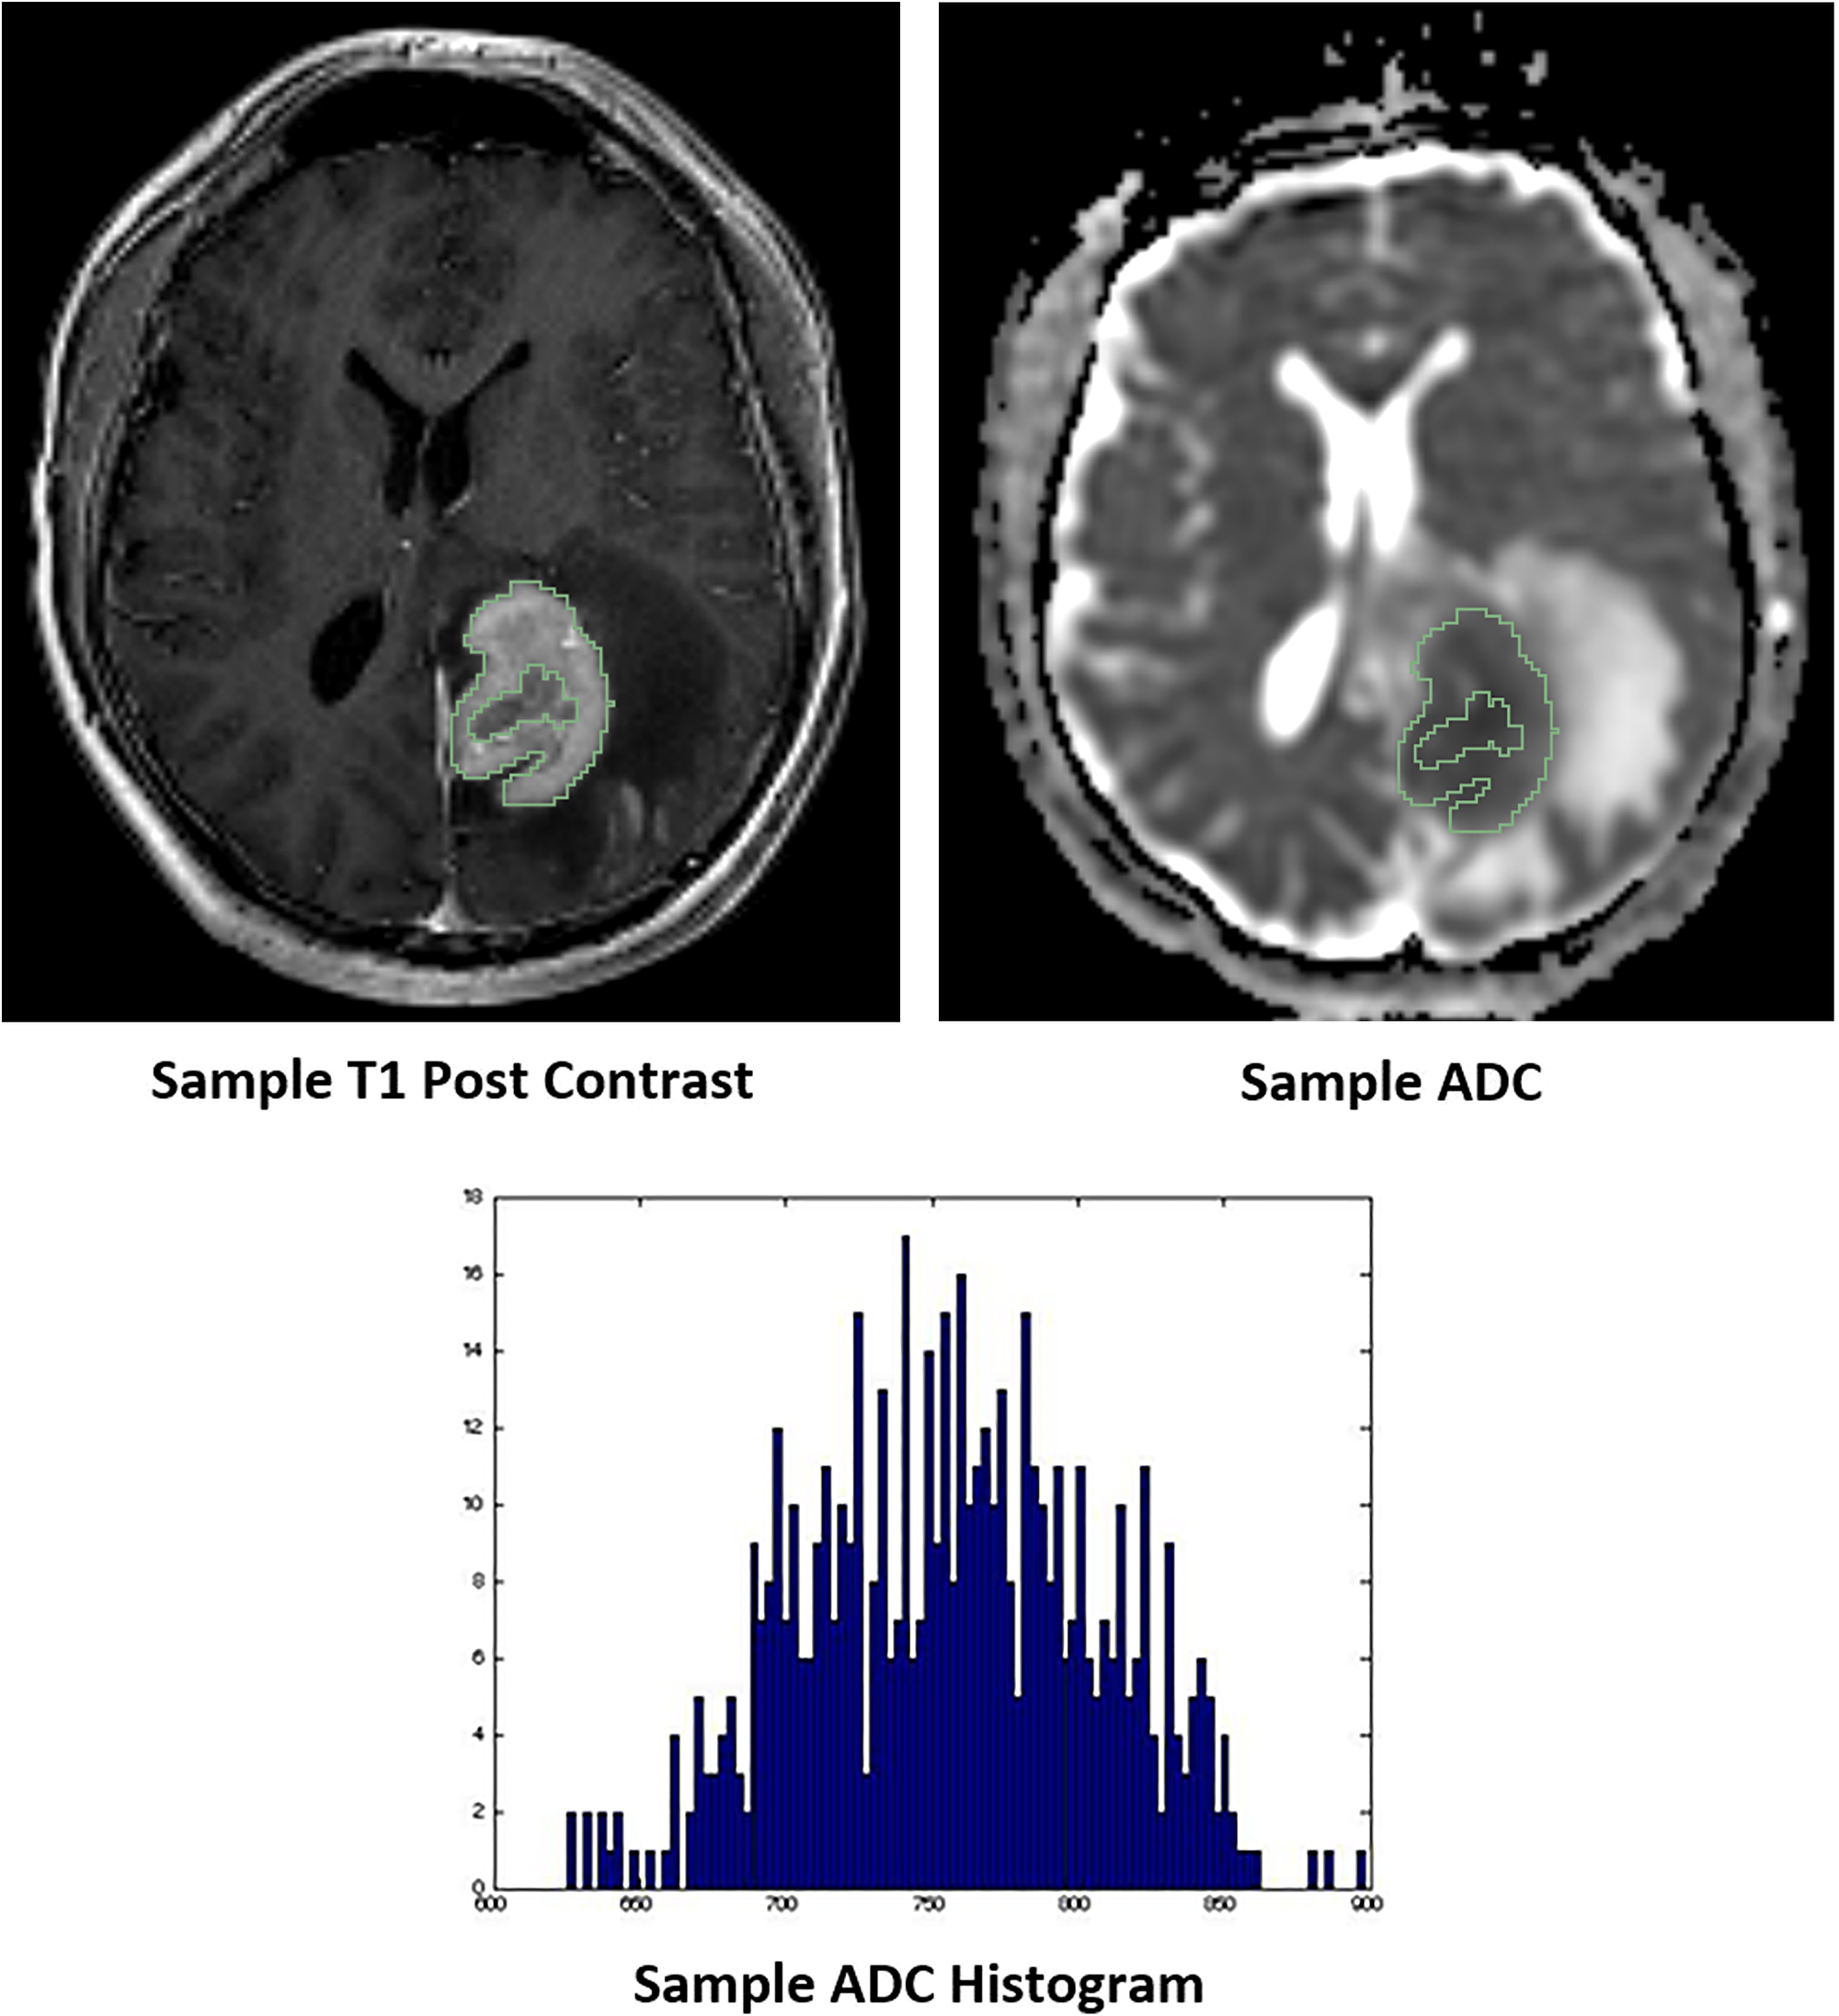
Figure 3: Representative images of whole tumor volume segmentation of the co-registered T1 post-contrast sequence and apparent diffusion coefficient (ADC) map, yielding the corresponding ADC histogram distribution utilized for data analysis.
nADC ratios were calculated as the ratio of the ADC values within the lesion to the ADC value of normal white matter. Subsequently, an in-house software built on Matlab was used to obtain the following histogram features: minimum, maximum, mean, standard deviation, skewness, kurtosis and the various ADC percentiles (1st, 5th, 15th, 25th, 75th, 95th, and 99th) of the ADC map VOIs. The volume of the VOI was obtained by multiplying the number of voxels within the VOI with the voxel size. Qualitative analysis was subsequently performed. This included the classification of tumor lesions with and without intra-tumoral hemorrhage, with ring versus solid enhancement pattern, and deep brain involvement, which included periventricular regions, basal ganglia, brainstem and/or cerebellum.
Clinical outcomes
Two clinical outcomes, PFS and OS, were analyzed. We calculated the OS from the time of diagnosis to death of any cause. We calculated the PFS from the time of treatment to progression, relapse, or death from any cause, whichever occurred first. Complete remission was defined according to the International Primary Central Nervous System Lymphoma Collaboration Group Response Criteria [37, 41]. OS and PFS were correlated for each treatment group, including: 1) Supportive therapy, 2) Whole-brain radiation (WBRT), 3) methotrexate (MTX) monotherapy, 4) MTX-based combination chemotherapy, 5) WBRT plus MTX-based chemotherapy and 6) autologous stem cell transplantation (SCT). Of the 90 patients that met selection criteria of this study, one patient was excluded in analysis of these two clinical outcomes due to lack of available ECOG score.
Statistical analysis
Analysis of demographic data and imaging characteristics by HIV status were performed using Pearson’s chi-squared test and Fisher’s exact test when any group contained four or less individuals. Median survival time was generated using Kaplan-Meier methods and p-values were calculated using Cox Proportional Hazards models. Normalized ratios were generated by dividing the tumor value against the corresponding white matter value. Correlations between nADC parameters and Ki-67 were generated using Pearson’s correlation coefficient. Correlations between non-normalized ADC parameters and Ki-67 were also performed for completeness (Supplementary Table 2). False discovery rate adjustment of these correlations were performed for 9 tests in 3 groups using Benjamini & Hochberg method (Supplementary Table 3). Associations between nADC parameters and OS and PFS were performed using Cox Proportional Hazards models adjusted for age at diagnosis, ECOG score, HIV status, and treatment. One patient was excluded from the Cox Proportional Hazards models due to a lack of available ECOG score. For completeness, associations between non-normalized ADC parameters and OS and PFS were similarly performed and included as supplementary material (Supplementary Tables 4 and 5). Hazard ratios (HR) and 95% confidence intervals (95%CI) were generated using values that were divided at the median. Statistical analyses were performed using R 3.5.0 [42]. Statistical significance was set to a p value < 0.05.
Abbreviations
PCNSL: Primary central nervous system lymphoma; DWI: Diffusion weighted imaging; ADC: Apparent diffusion coefficient; VOI: Volume of interest; nADC: Normalized ADC; PLWH: Patients living with HIV; MDACC: MD Anderson Cancer Center; BTH: Ben Taub Hospital; SCT: Stem cell transplant; ECOG: Eastern Cooperative Oncology performance status; WM: white matter.
ACKNOWLEDGMENTS
The authors would like to acknowledge Dr. Naveen Garg, MD (Associate Professor of Radiology at the University of Texas MD Anderson Cancer Center) for their assistance with providing the cases utilized in this study.
CONFLICTS OF INTEREST
Authors have no conflicts of interest to declare.
FUNDING
QTO is supported by a Research Training Grant from the Cancer Prevention and Research Institute of Texas (CPRIT; RP160097T).
References
1. Deckert M, Montesinos-Rongen M, Brunn A, Siebert R. Systems biology of primary CNS lymphoma: from genetic aberrations to modeling in mice. Acta Neuropathol. 2014; 127:175–188. https://doi.org/10.1007/s00401-013-1202-x. [PubMed].
2. Phillips EH, Fox CP, Cwynarski K. Primary CNS lymphoma. Curr Hematol Malig Rep. 2014; 9:243–253. https://doi.org/10.1007/s11899-014-0217-2. [PubMed].
3. Batchelor T, Loeffler JS. Primary CNS lymphoma. J Clin Oncol. 2006; 24:1281–1288. https://doi.org/10.1200/JCO.2005.04.8819. [PubMed].
4. Bayraktar S, Bayraktar UD, Ramos JC, Stefanovic A, Lossos IS. Primary CNS lymphoma in HIV positive and negative patients: comparison of clinical characteristics, outcome and prognostic factors. J Neurooncol. 2011; 101:257–265. https://doi.org/10.1007/s11060-010-0252-3. [PubMed].
5. Fallah J, Qunaj L, Olszewski AJ. Therapy and outcomes of primary central nervous system lymphoma in the United States: analysis of the National Cancer Database. Blood Adv. 2016; 1:112–121. https://doi.org/10.1182/bloodadvances.2016000927. [PubMed].
6. Galea I, Bechmann I, Perry VH. What is immune privilege (not)? Trends Immunol. 2007; 28:12–18. https://doi.org/10.1016/j.it.2006.11.004. [PubMed].
7. Xie H, Ahluwalia MS, Peereboom DM. The Cleveland Clinic experience with primary central nervous system lymphoma. Am J Clin Oncol. 2015; 38:140–146. https://doi.org/10.1097/COC.0b013e31828f5a26. [PubMed].
8. Thurnher MM, Rieger A, Kleibl-Popov C, Settinek U, Henk C, Haberler C, Schindler E. Primary central nervous system lymphoma in AIDS: a wider spectrum of CT and MRI findings. Neuroradiology. 2001; 43:29–35. https://doi.org/10.1007/s002340000480. [PubMed].
9. Schob S, Frydrychowicz C, Gawlitza M, Bure L, Preuss M, Hoffmann KT, Surov A. Signal Intensities in Preoperative MRI Do Not Reflect Proliferative Activity in Meningioma. Transl Oncol. 2016; 9:274–279. https://doi.org/10.1016/j.tranon.2016.05.003. [PubMed].
10. Guo AC, Cummings TJ, Dash RC, Provenzale JM. Lymphomas and high-grade astrocytomas: comparison of water diffusibility and histologic characteristics. Radiology. 2002; 224:177–183. https://doi.org/10.1148/radiol.2241010637. [PubMed].
11. Le Bihan D. Apparent Diffusion Coefficient and Beyond: What Diffusion MR Imaging Can Tell Us about Tissue Structure. Radiology. 2013; 268:318–322. https://doi.org/10.1148/radiol.13130420. [PubMed].
12. Padhani AR, Liu G, Mu-Koh D, Chenevert TL, Thoeny HC, Takahara T, Dzik-Jurasz A, Ross BD, van Cauteren M, Collins D, Hammoud DA, Rustin GJ, Taoluli B, et al. Diffusion-Weighted Magnetic Resonance Imaging as a Cancer Biomarker: Consensus and Recommendations. Neoplasia. 2009; 11:102–125. https://doi.org/10.1593/neo.81328. [PubMed].
13. Wieduwilt MJ, Valles F, Issa S, Behler CM, Hwang J, McDermott M, Treseler P, O’Brien J, Shuman MA, Cha S, Damon LE, Rubenstein JL. Immunochemotherapy with intensive consolidation for primary CNS lymphoma: a pilot study and prognostic assessment by diffusion-weighted MRI. Clin Cancer Res. 2012; 18:1146–1155. https://doi.org/10.1158/1078-0432.CCR-11-0625. [PubMed].
14. Zhang Y, Zhang Q, Wang XX, Deng XF, Zhu YZ. Value of pretherapeutic DWI in evaluating prognosis and therapeutic effect in immunocompetent patients with primary central nervous system lymphoma given high-dose methotrexate-based chemotherapy: ADC-based assessment. Clin Radiol. 2016; 71:1018–1029. https://doi.org/10.1016/j.crad.2016.05.017. [PubMed].
15. Cho U, Oh WJ, Hong YK, Lee YS. Prognostic Significance of High Ki-67 Index and Histogenetic Subclassification in Primary Central Nervous System Lymphoma. Appl Immunohistochem Mol Morphol. 2018; 26:254–262. https://doi.org/10.1097/PAI.0000000000000424. [PubMed].
16. Gaudio F, Giordano A, Perrone T, Pastore D, Curci P, Delia M, Napoli A, de’Risi C, Spina A, Ricco R, Liso V, Specchia G. High Ki67 index and bulky disease remain significant adverse prognostic factors in patients with diffuse large B cell lymphoma before and after the introduction of rituximab. Acta Haematol. 2011; 126:44–51. https://doi.org/10.1159/000324206. [PubMed].
17. Liu J, Wang Y, Liu Y, Liu Z, Cui Q, Ji N, Sun S, Wang B, Wang Y, Sun X, Liu Y. Immunohistochemical profile and prognostic significance in primary central nervous system lymphoma: Analysis of 89 cases. Oncol Lett. 2017; 14:5505–55112. https://doi.org/10.3892/ol.2017.6893. [PubMed].
18. Barajas RF Jr, Rubenstein JL, Chang JS, Hwang J, Cha S. Diffusion-weighted MR imaging derived apparent diffusion coefficient is predictive of clinical outcome in primary central nervous system lymphoma. AJNR Am J Neuroradiol. 2010; 31:60–66. https://doi.org/10.3174/ajnr.A1750. [PubMed].
19. Schob S, Meyer J, Gawlitza M, Frydrychowicz C, Muller W, Preuss M, Bure L, Quaschling U, Hoffman KT, Surov A. Diffusion-Weighted MRI Reflects Proliferative Activity in Primary CNS Lymphoma. PLoS One. 2016; 11:e0161386. https://doi.org/10.1371/journal.pone.0161386. [PubMed].
20. Schob S, Munch B, Dieckow J, Quaschling U, Hoffmann KT, Richter C, Garnov N, Frydrychowicz C, Krause M, Meyer HJ, Surov A. Whole Tumor Histogram-profiling of Diffusion-Weighted Magnetic Resonance Images Reflects Tumorbiological Features of Primary Central Nervous System Lymphoma. Transl Oncol. 2018; 11:504–510. https://doi.org/10.1016/j.tranon.2018.02.006. [PubMed].
21. Valles FE, Perez-Vallez CL, Regaldo S, Barajas RF Jr, Rubenstein JL, Cha S. Combined diffusion and perfusion MR imaging as biomarkers of prognosis in immunocompetent patients with primary central nervous system lymphoma. AJNR Am J Neuroradiol. 2013; 34:35–40. https://doi.org/10.3174/ajnr.A3165. [PubMed].
22. Surov A, Meyer HJ, Wienke A. Correlation between minimum apparent diffusion coefficient (ADCmin) and tumor cellularity: a meta-analysis. Anticancer Res. 2017; 37:3807–3810. https://doi.org/10.21873/anticanres.11758. [PubMed].
23. Surov A, Caysa H, Wienke A, Spielmann RP, Fiedler E. Correlation between different ADC fractions, cell count, Ki-67, total nucleic areas and average nucleic areas in meningothelial meningiomas. Anticancer Res. 2015; 35:6841–6846. [PubMed].
24. Meyer HJ, Pazaitis N, Surov A. ADC histogram analysis of muscle lymphoma-correlation with histopathology in a rare entity. Br J Radiol. 2018; 91:20180291. https://doi.org/10.1259/bjr.20180291. [PubMed].
25. Tang Y, Dundamadappa SK, Thangasamy S, Flood T, Moser R, Smith T, Cauley K, Takhtani D. Correlation of apparent diffusion coefficient with Ki-67 proliferation index in grading meningioma. AJR Am J Roentgenol. 2014; 202:1303–1308. https://doi.org/10.2214/AJR.13.11637. [PubMed].
26. Gihr GA, Horvath-Rizea D, Hekeler E, Ganslandt O, Henkes H, Hoffmann KT, Scherlach C, Schob S. Histogram Analysis of Diffusion Weighted Imaging in Low-Grade Gliomas: in vivo Characterization of Tumor Architecture and Corresponding Neuropathology. Front Oncol. 2020; 10:206. https://doi.org/10.3389/fonc.2020.00206. [PubMed].
27. Ahn SJ, Shin HJ, Chang JH, Lee SK. Differentiation between primary cerebral lymphoma and glioblastoma using the apparent diffusion coefficient: comparison of three different ROI methods. PLoS One. 2014; 9:e112948. https://doi.org/10.1371/journal.pone.0112948. [PubMed].
28. Chong I, Ostrom Q, Khan B, Dandachi D, Garg N, Kotrotsou A, Colen R, Moron FE. Whole tumor histogram analysis using DW MRI in primary central nervous system lymphoma correlates with tumor biomarkers and outcome. Cancers (Basel). 2019; 11:1506. https://doi.org/10.3390/cancers11101506. [PubMed].
29. Surov A, Meyer HJ, Wienke A. Associations between apparent diffusion coefficient (ADC) and Ki-67 in different tumors: a meta-analysis, part 1: ADCmean. Oncotarget. 2017; 8:75434–75444. https://doi.org/10.18632/oncotarget.20406. [PubMed].
30. Schob S, Meyer H, Dieckow J, Pervinder B, Pazaitis N, Hohn A, Garnov N, Horvath-Rizea D, Hoffman KT, Surov A. Histogram analysis of diffusion weighted imaging at 3t is useful for prediction of lymphatic metastatic spread, proliferative acvtivity and cellularity in thyroid cancer. Int J Mol Sci. 2017; 18:821. https://doi.org/10.3390/ijms18040821. [PubMed].
31. Zacharia TT, Law M, Naidich TP, Leeds NE. Central nervous system lymphoma characterization by diffusion-weighted imaging and MR spectroscopy. J Neuroimaging. 2008; 18:411–417. https://doi.org/10.1111/j.1552-6569.2007.00231.x. [PubMed].
32. Mansour A, Qandeel M, Abdel-Razeq H, Abu Ali HA. MR imaging features of intracranial primary CNS lymphoma in immune competent patients. Cancer Imaging. 2014; 14:22. https://doi.org/10.1186/1470-7330-14-22. [PubMed].
33. Silvera S, Oppenheim C, Touze E, Ducreux D, Page P, Domigo V, Mas JL, Roux FX, Fredy D, Meder JF. Spontaneous intracerebral hematoma on diffusion-weighted images: influence of T2-shine-through and T2-blackout effects. AJNR Am J Neuroradiol. 2005; 26:236–241. [PubMed].
34. Whang JS, Kolber M, Powell DK, Libfeld E. Diffusion-weighted signal patterns of intracranial haemorrhage. Clin Radiol. 2015; 70:909–916. https://doi.org/10.1016/j.crad.2015.04.006. [PubMed].
35. Go JL, Lee SC, Kim PE. Imaging of primary central nervous system lymphoma. Neurosurg Focus. 2006; 21:E4. https://doi.org/10.3171/foc.2006.21.5.5. [PubMed].
36. Dandachi D, Ostrom QT, Chong I, Serpa JA, Giordano TP, Kruchko C, Barnholtz-Sloan JS, Fowler N, Colen RR, Moron FE. Primary central nervous system lymphoma in patients with and without HIV infection: a multicenter study and comparison with U.S national data. Cancer Causes Control. 2019; 30:477–488. https://doi.org/10.1007/s10552-019-01144-8. [PubMed].
37. Han CH, Batchelor TT. Primary Central Nervous System Lymphoma. Continuum (Minneap Minn). 2017; 23:1601–1618.
38. DeFilip Z, Li S, El-Jawahri A, Armand P, Nayak L, Wang N, Batchelor TT, Chen YB. High-dose chemotherapy with thiotepa, busulfan, and cyclophosphamide and autologous stem cell transplantation for patients with primary central nervous system lymphoma in first complete remission. Cancer. 2017; 123:3073–3079. https://doi.org/10.1002/cncr.30695. [PubMed].
39. Huisman TA, Loenneker T, Barta G, Bellemann ME, Hennig J, Fischer JE, Il’yasov KA. Quantitative diffusion tensor MR imaging of the brain: field strength related variance of apparent diffusion coefficient (ADC) and fractional anisotropy (FA) scalars. Eur Radiol. 2006; 16:1651–1658. https://doi.org/10.1007/s00330-006-0175-8. [PubMed].
40. Fedorov A, Beichel R, Kalpathy-Cramer J, Finet J, Fillion-Robin JC, Pujol S, Bauer C, Jennings D, Fennessy F, Sonka M, Buatti J, Aylward S, Miller JV, et al. 3D Slicer as an image computing platform for the Quantitative Imaging Network. Magn Reson Imaging. 2012; 30:1323–1341. https://doi.org/10.1016/j.mri.2012.05.001. [PubMed].
41. Abrey LE, Batchelor TT, Ferreri AJ, Gospodarowicz M, Pulczynski EJ, Zucca E, Smith JR, Korfel A, Soussain C, DeAngelis LM, Neuwelt EA, O’Neill BP, Thiel E, et al. Report of an international workshop to standardize baseline evaluation and response criteria for primary CNS lymphoma. J Clin Oncol. 2005; 23:5034–5043. https://doi.org/10.1200/JCO.2005.13.524. [PubMed].
42. R Core Team. R: A language and environment for statistical computing: R Foundation for Statistical Computing, Vienna, Austria; 2018.