
INTRODUCTION
Medulloblastoma (MB) is the most frequently diagnosed malignant pediatric brain tumor. Approximately 30% of patients with MB are resistant to therapies and prone to develop metastasis [1–9]. Several earlier studies have shown that over-expression and/or over-activation of certain genes such as PDGFRs and c-MYC in the tumor tissues of MB patients are correlated with an aggressive tumor phenotype and poor prognosis [10–14].
The activation of PDGFR signaling initiates events that culminate in cell proliferation, survival, and migration [15–19]. A plethora of evidence shows that the MB cells with abnormal PDGFR signaling, attributable to the over-expression of PDGFRs or their ligands [11, 12, 20, 21], or mutation in PDGFRα, are linked to metastatic disease [19]. PDGFRα was initially found to be highly expressed in metastatic MBs, and it was further proposed to be a therapeutic target for metastatic MB based on the results that metastatic MB cells lost their metastatic phenotypes (reduced capabilities on adhesion and migration in vitro) upon blockade of PDGFRα signaling using a PDGFRα-neutralizing antibody and a MAP2K1/2 inhibitor [11, 20]. These results led to the proposal by MacDonald and coworkers that PDGFRα is a bona fide therapeutic target for metastatic MB [11, 20]. However, in subsequent studies, the PDGFRα probe-set used in the microarray analysis by MacDonald and his coworkers was shown to detect PDGFRβ [12]. The controversy regarding the roles of PDGFRα and PDGFRβ in MB has continued, i.e., PDGFRα was deregulated in both the primary and metastatic tumors in a sleeping beauty mouse model of MB [22]. Taking earlier and more recent results as a whole, it is evident that the controversy lingers and the dispute remains unresolved.
MB tumors are highly heterogeneous. Based on their molecular and clinical characteristics, at least four subgroups, WNT, SHH, Group 3, and Group 4 exist [14, 23–33]. Among these subgroups, the preferential survival rates of MB patients from good to poor are: WNT>SHH / Group 4>Group 3 [29, 34]; however, metastatic MBs are found in all subgroups. As yet, the role of PDGFR-mediated signaling has not been examined in the context of MB subgroups, and whether PDGFRα and PDGFRβ could initiate convergent or divergent events in MB remains to be determined.
c-MYC is a proto-oncogene encoding a transcription factor that controls multiple cellular events such as proliferation [35, 36], cell cycle [37–39], and apoptosis [40–43] by regulating the expression of its target genes. Over-expression of c-MYC promotes tumorigenesis while inhibition of c-MYC reduces tumor growth in vitro and in vivo [10, 13]. It has been shown that over-expression or oncogenic activation of c-MYC in MB may be also linked to an aggressive phenotype, and MB patients with elevated levels of c-MYC often have poor outcomes [10, 13, 14, 44, 45]. Inhibition of c-MYC using either siRNA or pharmacological intervention has been shown to limit tumor growth in vitro [43, 46–49]. These studies suggest that c-MYC plays a crucial role in MB biology.
Notch signaling, one of major determinants regulating cell differentiation [50], is a critical pathway regulating stem cell differentiation and tumor progression [51–54]. Abnormal activation of Notch pathway was demonstrated to induce tumor formation [50, 55]. A few studies indicate that Notch signaling may play a role in MB progression [53]; however, whether the regulation of Notch signaling by PDGFR in MB has not been reported.
In this study, we analyzed the expression levels of PDGFRα and PDGFRβ in primary MB for their associated gene signatures. We further used MB cells to elucidate their individual functions on cell proliferation, migration, and invasion. Moreover, by combining miRNA profiling with bioinformatics-aided target prediction complemented by experimental validation, we identified a potential novel therapeutic target, JAG2, which appears to act as a downstream target of the PDGFRβ-c-MYC signaling pathway. We further determined the expression levels of JAG2 in MB tissues for its prognostic value.
RESULTS
Expression of PDGFRα and PDGFRβ is associated with different prognosis in patients with MB
To define the biological roles of PDGFRs in MB, we analyzed the subgroup dependent mRNA levels of PDGFRα and PDGFRβ in two independent, non-overlapping gene expression profiling data sets [29, 56, 57]. As shown in Figure 1A, 1B, 1C, 1D and Table S1, the expression of PDGFRα was elevated in WNT and SHH subgroups (p < 0.001), while high levels of PDGFRβ were found in a subset of tumors from all subgroups, particularly high in SHH tumors (p < 0.001). We further analyzed the expression patterns in 3 sets of data and obtained similar results (Figure S1) [32, 58, 59]. Our previous studies revealed that patient with WNT MB has a better outcome than the one with SHH / Group 4 and Group 3 MBs [29, 34]. Our results suggest that expression of PDGFRα and PDGFRβ may be associated with the differences in prognosis.
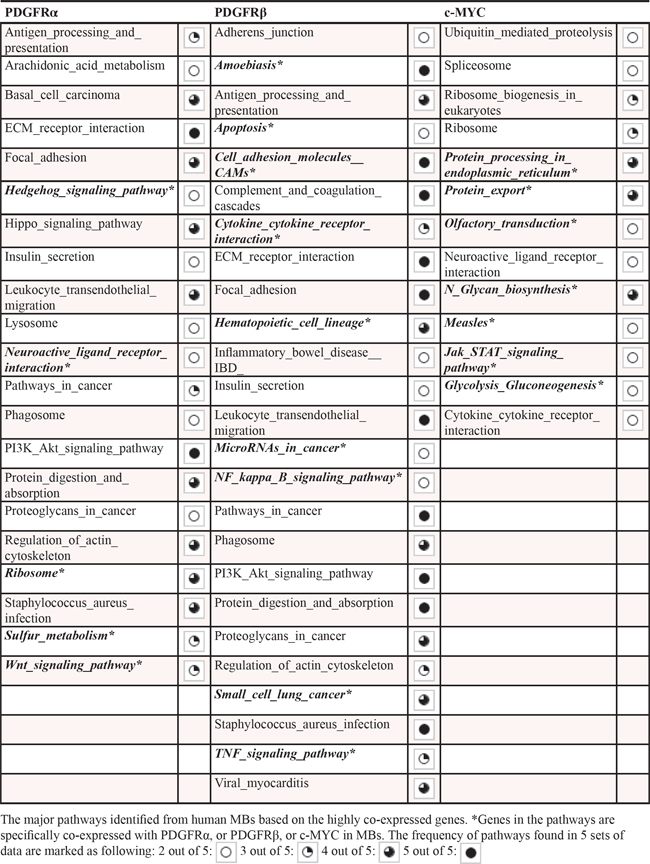
We next searched for the molecular signatures of PDGFRα, PDGFRβ, and c-MYC in MBs using the R2 software (http://r2.amc.nl) by assessing the correlations of genes in major pathways with cellular functions in five cohorts of MBs previously determined by microarray from at least more than 45 samples containing all 4 subgroups of clinical MBs [29, 32, 33, 59, 60]. By analyzing the KEGG (Kyoto Encyclopedia of Genes and Genomes) pathway annotation in these data sets, we revealed that several pathways were significantly associated with PDGFRα and PDGFRβ expression, respectively, in the five separate tumor cohorts. As shown in Table 1, Supplemental Tables S2, S3, both the expression of PDGFRα and PDGFRβ in MB tumors was associated with signatures related to ‘ECM receptor interaction’, ‘Focal adhesion’, and ‘Pathways in cancer’. Notably, distinct signaling pathways for PDGFRα and PDGFRβ were also identified. For instance, ‘Wnt signaling pathway’, ‘Hedgehog signaling pathway’, and ‘Hippo signaling pathway’ were only associated with PDGFRα expression; while ‘Cell adhesion molecules_CAMs’, ‘Apoptosis’, ‘NFĸB signaling pathway’, and ‘Cytokine_cytokine receptor interaction’ were only associated with PDGFRβ expression. These data suggest that PDGFRs regulate distinct cellular functions in MB including cell proliferation, cell death, and cellular mobility.
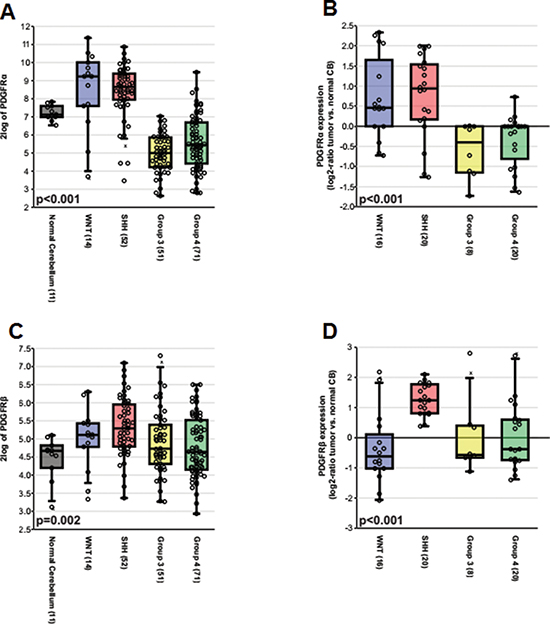
Figure 1: The subgroup specific expression of PDGFRα and PDGFRβ in primary MB. (A) Boxplot showing PDGFRα expression in normal adult cerebellar samples and MB subgroups based on the Boston cohort (n = 199). (B) Relative expression of PDGFRα as a log2-ratio compared to a pool of normal cerebellar samples according to MB subgroups based on the Heidelberg cohort (n = 64). (C) Boxplot showing PDGFRβ expression in normal adult cerebellar samples and MB subgroups based on the Boston cohort. (D) Relative expression of PDGFRβ as a log2-ratio compared to a pool of normal cerebellar samples according to MB subgroups based on the Heidelberg cohort.
Table 1: Pathway analysis of genes co-expressed with PDGFRα, PDGFRβ, and c-MYC in MB tumors
PDGFRβ instead of PDGFRα promotes MB progression
The distinct expression patterns of PDGFRα and PDGFRβ in MB subgroups and the association of distinct signaling pathways of PDGFRs in MBs led us to hypothesize that PDGFRα and PDGFRβ have distinct roles in MB progression. To functionally characterize the biological impact of these signaling events induced by the two PDGFRs, we assessed the effects on Daoy and D283 MB cells in cell proliferation and cell death in response to siRNA knockdown either PDGFRα or PDGFRβ. PDGFRβ knockdown resulted in decreased cell proliferation and increased cell death (p < 0.01; p < 0.01, respectively), while treatment with PDGFRα siRNA showed an increased cell proliferation and reduced cell death (p < 0.05; p < 0.05, respectively) (Figure 2A, 2B) in both Daoy and D283 cells. We also checked cell invasion under conditions of PDGFRα and PDGFRβ blockade using their respective neutralizing antibodies. We observed that interference with PDGFRα signaling promoted invasion, while disrupted PDGFRβ signaling inhibited invasion in Daoy cells (Figure 2C, S2). These results lead to the conclusion that PDGFRβ but not PDGFRα is a critical element to promote aggressive behavior of MBs. To understand the distinct cellular functions elicited by PDGFRα and PDGFRβ in MB cells, we further analyzed the expression of c-MYC, a previously defined PDGF response gene as a key determinant involved in cell proliferation [61–63]. In cells featuring siRNA-mediated knockdown of PDGFRα or PDGFRβ, we found that c-MYC expression was reduced in PDGFRβ siRNA-treated but not PDGFRα siRNA-treated cells, suggesting that c-MYC may be a downstream target of PDGFRβ partially contributing to the differential effects initiated by PDGFRα and PDGFRβ (Figure 2D, 2E).
Co-targeting PDGFRβ and c-MYC expression reduces MB cell proliferation
Analysis of MBs using high-resolution DNA copy number profiling showed that c-MYC amplification was mainly found in Group 3 MBs (25% of MBs) [60]; while Grotzer et al. demonstrated by RT-PCR using a cohort of 26 MBs that all MBs express c-MYC [44]. We thus also analyzed the genes in the pathways co-expressed with c-MYC in the 5 data sets [29, 32, 33, 59, 60] and our data suggest that c-MYC and PDGFRβ activate distinct signaling pathways in MBs (Table 1, Supplemental Tables S3, S4). Based on previous reports that c-MYC over-expression is critical for MB progression [10, 13], we reasoned that co-targeting both PDGFRβ and c-MYC could maximize the suppression of MB progression, especially in SHH and Group 3 MBs. On the basis of phenotypes and molecular features, Daoy may be regarded as a SHH tumor, while D283 and D425 are considered as Group 4 and Group 3 MB tumors, respectively [14, 23–33, 64]. All 3 cell lines with detectable PDGFRs and c-MYC (Figure 3A) were used to target both PDGFRβ and c-MYC simultaneously using siRNAs against PDGFRβ and c-MYC, and also pharmacological inhibitors, SJ001 (a novel PDGFR inhibitor, also called cambogin) [65] and 10058-F4 (it inhibits the c-MYC-Max interaction) [46–48]. The specificity and efficacy of siRNA knockdown of PDGFRβ or c-MYC or both were confirmed by Western blotting analysis (Figure 3A). The results show that blockade of PDGFRβ and c-MYC signaling using either RNA interference or pharmacological intervention inhibited both MB cell proliferation and migration (Figure 3B, 3D). Although in Figure 2D, we show that c-MYC is partially regulated by PDGFRβ signaling, the observation of that PDGFRβ signaling affected cell migration more significantly than proliferation, whereas c-MYC signaling mainly contributed to suppression of cell proliferation, indicating that PDGFRβ and c-MYC act on different pathways. Notably, SJ001 is able to inhibit both PDGFRα and PDGFRβ [65], indicating that PDGFRβ may have a decisive role on cell proliferation and migration in MB when both PDGFRs are repressed simultaneously. Co-targeting of PDGFRβ and c-MYC using either gene specific siRNAs or pharmacological inhibitors potentiated the effects on cell proliferation and migration, as shown by synergism in suppression of cell proliferation and migration compared to blockade of either c-MYC or PDGFRβ alone (Figure 3C, 3D).
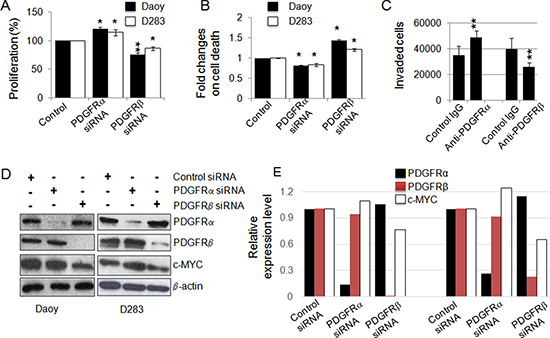
Figure 2: PDGFRs have distinct cellular functions and PDGFRβ regulates c-MYC. (A) Effect of siRNA-mediated knockdown of PDGFRα and PDGFRβ in MB cells on cell proliferation. After 48 h of transfection, the rates of cell proliferation were determined using MTS assay; (B) siRNA-mediated knockdown of PDGFRα and PDGFRβ in MB cells on cell death. PDGFRα and PDGFRβ in MB cells were knocked down using siRNA and the rate of cell death was determined by LDH at 48 h; (C) Daoy cell migration/invasion was assessed in the presence of a control antibody, PDGFR neutralizing antibodies (mouse IgG as control for anti-PDGFRα, goat IgG as control for anti-PDGFRβ) as described in the Materials and Methods. *p < 0.05, **p < 0.01 (paired Student’s t-test, sample vs. control); (D) PDGFRα and PDGFRβ signaling differentially regulates the expression of c-MYC in MB cells. PDGFRα and PDGFRβ in MB cells were knocked down using siRNAs. After 48 h of siRNA transfection, cells were harvested as protein lysates for Western blotting analysis; (E) The relative levels of PDGFRs and c-MYC in response to the siRNA treatments were calculated from the gel images of (D).
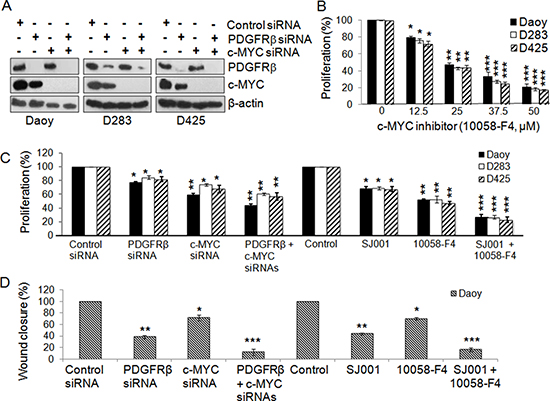
Figure 3: Co-inhibition of PDGFRβ and c-MYC suppresses MB cell proliferation and migration. MB cells were transfected with gene-specific siRNAs for PDGFRβ and c-MYC and also with PDGFR and c-MYC specific inhibitors alone or in combination for 48 h. (A) Confirmation of specific gene knockdown by Western blotting analysis. β-actin was used as the loading control. (B) The effects of c-MYC inhibitor 10058-F4 on MB cell proliferation. (C) The effects of siRNAs and inhibitors on MB cell proliferation were determined using MTS. *p < 0.05, **p < 0.01 (paired t-test, sample vs. control). (D) The effects of co-inhibiting PDGFRβ and c-MYC on MB cell migration. Daoy cells were transfected with gene specific siRNAs for PDGFRβ and c-MYC and also with PDGFR and c-MYC specific inhibitors alone or in combination for 36 h. Treated cells were then detached and re-distributed in equal amounts in a 48-well plate before a linear wound was made. The image was captured immediately after that an artificial wound was made at 0th h and also at 24th h (Figures S3a, S3b). Quantified results were calculated from the images. Percentage wound closure shows the migration rate in PDGFRβKD, c-MYCKD or PDGFRβKDc-MYCKD cells when compared to control sample, *p < 0.05, **p < 0.01, ***p < 0.001 (paired t-test, sample vs. control).
miR-1280 expression is regulated by PDGFRβ and c-MYC, and functionally important for MB cells
To find the common targets which are optimally responsible for both migration/invasion and proliferation, we explored the involvement of miRNAs in PDGFRα, PDGFRβ, and c-MYC signaling in MB cells by determining the miRNA profiles of Daoy cells without (Mock) and with knockdown of PDGFRα (PDGFRαKD), PDGFRβ (PDGFRβKD), c-MYC (c-MYCKD), and both PDGFRβ and c-MYC (PDGFRβKDc-MYCKD) using the miRCURY LNATM microRNA Array (6th Gen) platform. We observed that knockdown of PDGFRα had little effect on miRNA expression, while knockdown of either PDGFRβ or c-MYC markedly changed the miRNA profiles (Figure 4A). Among 1497 tested miRNAs, 159 miRNAs were modulated by PDGFRβ (57 up-regulated and 102 down-regulated); 125 miRNAs were altered by c-MYC (76 up-regulated and 49 down-regulated), and 22 miRNAs responded to both PDGFRβ and c-MYC. Comparative analysis of the respective miRNA profiles revealed that among 39 highly regulated miRNAs, a subset of miRNAs including miR-1280 and miR-1260 was concordantly regulated by PDGFRβ and c-MYC (Figure 4A). Next we analyzed the expression levels of miR-1280 and miR-1260 (two highly regulated miRNAs by both PDGFR and c-MYC) by real-time RT-PCR upon knockdown of PDGFRα and PDGFRβ, each separately or both combined, in three MB cell lines (Daoy, D283, and D425). The results agreed with the data generated by miRNA profiling analysis (Figure 4B). To determine the biological functions of miR-1280 and miR-1260 in MB cells, PDGFRβKD Daoy cells were treated with either a miR-1280 inhibitor or a miR-1260 inhibitor, and cells were then analyzed for miR-1280 or miR-1260 expression, cell proliferation, and migration. We found that both miR-1280 and miR-1260 inhibitors down-regulated the expression of miR-1280 and miR-1260 (Figure 4C, 4D), respectively, in PDGFRβKD Daoy cells. Notably, treatment with the miR-1280 inhibitor restored the cellular function of PDGFRβKD cells; while the miR-1260 inhibitor had less pronounced effects on both cell proliferation and migration. Thus, we selected miR-1280 for the further investigation. In response to miR-1280 inhibition, PDGFRβKD cells showed 15% and 55% increases in cell proliferation and in cell migration (Figure 4E, 4F), respectively. Taken together, these results provide a strong support that PDGFRα and PDGFRβ regulate different molecular downstream targets, resulting in distinct functional roles for MB progression.
Identification of JAG2 as a potential new MB therapeutic target regulated by PDGFRβ and c-MYC
To further understand the miRNA network regulated by PDGFRβ and c-MYC, we used a miRNA target prediction strategy as previously outlined [66, 67] to analyze the potential targets of the highly regulated miRNAs. Based on the number of potential interaction sites between miRNA and its potential targets, the score of sequence alignment at the 3’ UTR of the potential target gene and available literature regarding the function of the potential targets, we identified that JAG2 is a potential target regulated by miRNAs under the control of both PDGFRβ and c-MYC. These results suggest that PDGFRβ and c-MYC likely modulate genes related to cell proliferation and survival via certain miRNAs and their targets, including JAG2 as a target of miR-1280. To further test and validate the results obtained from bioinformatics aided identification of miRNA target, we treated MB cells with PDGFRβ and c-MYC siRNAs alone or in combination and then analyzed the expression levels of JAG2 protein by Western blotting analysis. A decrease in JAG2 expression occurred in MB cells lacking either PDGFRβ or c-MYC. An even more significant reduction of JAG2 protein levels was observed in MB cells lacking both PDGFRβ and c-MYC compared to either control or knockdown of PDGFRβ and c-MYC alone (Figure 5A). These results indicate that both PDGFRβ and c-MYC regulate the expression of JAG2 via miR-1280 in MB cells. This conclusion is further supported by the fact that the level of JAG2 increased markedly in the cells treated with a miR-1280 inhibitor compared to the control (Figure 5B). To further elucidate the role of JAG2 in MB biology, JAG2 was specifically knocked down using siRNAs in all three MB cell lines (Figure 5C), and its effects on cell proliferation and migration were analyzed using MTS and wound healing assay, respectively. The results showed that JAG2 knockdown in MB cells reduced cell proliferation (p < 0.01) and migration (p < 0.001) (Figure 5D, 5E). To determine the clinical significance of JAG2 in MB, we analyzed the prognostic values of JAG2 expression levels in 64 MB samples. We observed increased expression levels of JAG2 in metastatic MB tumors (Figure 5F, p < 0.05) and the expression levels of JAG2 correlated with poor prognosis outcomes (Figure 5G, p < 0.001).
DISCUSSION
Over-expression of PDGFRs has been considered as a hallmark feature of MB metastasis and thus as therapeutic targets in high-risk MBs [10–14]. In this study, we found that the expression of PDGFRα and PDGFRβ in MBs is subgroup specific and associated with distinct molecular signatures; and only elevated level of PDGFRβ is linked with an aggressive phenotype of MB in vitro experiments. We present data showing that PDGFRα and PDGFRβ differentially regulate MB cellular functions - with PDGFRα limiting and PDGFRβ promoting cell proliferation, survival, and migration/invasion. Through targeting PDGFRβ and c-MYC, we revealed that the biological effects of PDGFRβ appear to be orchestrated by novel mediators including the miR-1280-JAG2 axis, which enhanced MB proliferation and migration in vitro. We further showed that the expression of JAG2 is correlated with the stages of MB metastasis and associated with a poor outcome in MB patients, indicating that JAG2 is a novel potential target. Thus our mechanistic studies on PDGFRβ promoting MB growth and migration via miRNAs and miRNA targets provide new insight that may help resolve the long-standing controversy on the role of PDGFRs in MB.
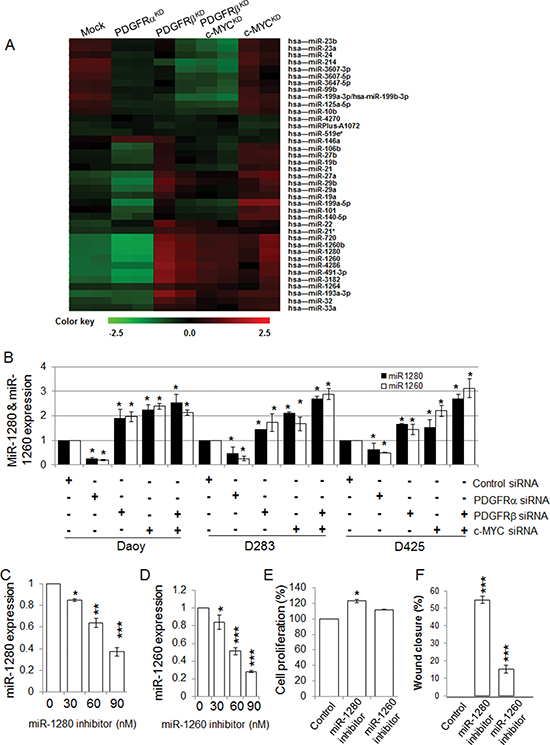
Figure 4: PDGFRβ and c-MYC differentially regulate miRNA expression in MB cells. (A) Heat map represents the differentially regulated miRNAs by Control (Mock), PDGFRαKD, PDGFRβKD, c-MYCKD or PDGFRβKDc-MYCKD cells. The normalized log ratio values were used for the analysis. The clustering was performed on all samples, and the highly differentially regulated 39 miRNAs were selected. Each row represents a miRNA and each column represents a sample. The color scale illustrates the relative expression levels of miRNAs. Green color represents an expression level below the reference channel, and red color represents the expression higher than the reference. (B) The expression levels of miRNAs regulated by PDGFRα, PDGFRβ, and c-MYC in MB cell lines. MB cells were transfected with gene specific siRNAs for PDGFRα, PDGFRβ, and c-MYC alone or in combination of PDGFRβ and c-MYC for 24 h. p < 0.05 was considered to be statistically significant. (C) miR-1280 inhibitor suppresses miR-1280 expression in Daoy cells. PDGFRβKD Daoy cells were transfected with control or increasing concentrations of miR-1280 specific inhibitor using Lipofectamineltx in opti-MEM reduced serum medium following the manufacturer’s instruction for 4 h. The cells were then fed with equal volume of MEM medium with 10% FBS. After 24 h, total RNA isolated was subjected to TaqMan microRNA assay to verify for specific inhibition of miRNAs. Data are presented as mean values (n = 3) ± standard deviation. Differences between 2 groups were analyzed using Student’s t-test. p < 0.05 was considered to be statistically significant. (D) miR-1260 inhibitor suppresses miR-1260 expression in Daoy cells. (E) The effects of miR-1280 and miR-1260 on MB cell proliferation. PDGFRβKD Daoy cells were treated with control or miR-1280 inhibitor or miR-1260 inhibitor. The effects on cell proliferation were determined by MTS assay. (F) The effects of miR-1280 and miR-1260 on PDGFRβKD Daoy cell migration. PDGFRβKD Daoy cells were treated with control or miR-1280 inhibitor or miR-1260 inhibitor. The treated cells were then detached and re-distributed in equal amounts in a 48-well plate before a linear wound was made. The image was captured immediately after an artificial wound was made at 0th h and also at 24th h (Figure S4a). Quantified results were calculated from the images. The treated samples were compared to control sample, *p < 0.05, **p < 0.01, ***p < 0.001 (paired t-test, sample vs. control).
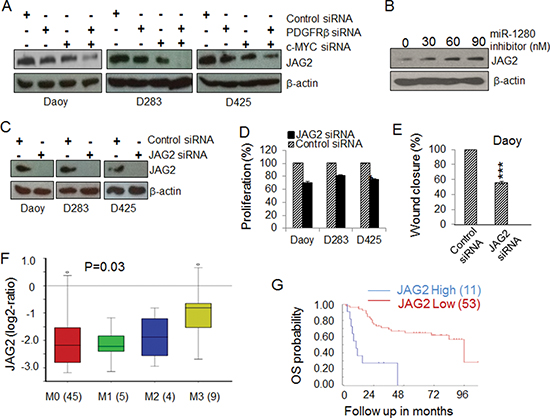
Figure 5: Identification of JAG2 as a potential target of MB. (A) The expression of JAG2 in MB cells is regulated by PDGFRβ and c-MYC. MB cells were transfected with gene specific siRNAs against PDGFRβ and/or c-MYC for 48 h. Protein lysates extracted from treated samples were used for the expression levels of JAG2 by Western blotting. β-actin was used as a loading control. (B) The expression levels of JAG2 are regulated by a miR-1280 inhibitor. PDGFRβKD Daoy cells were transfected with increasing concentrations of a miR-1280 specific inhibitor. After 48 h, protein lysates extracted were subjected to Western blotting analysis to check for change in expression of JAG2 protein. β-actin was used as a loading control. (C) Confirmation of specific knockdown JAG2 by Western blotting analysis. β-actin was used as the loading control. (D) The effects of JAG2 siRNA on MB cell proliferation. MB cells were transfected with control or JAG2 specific siRNAs for 48 h. Cell proliferation was determined using MTS. (E) The effects of JAG2 on MB cell migration. PDGFRKD Daoy cells were treated with control or JAG2 siRNAs for 36 h and then detached and re-distributed in equal amounts in a 48-well plate before a linear wound was made. The image was captured immediately after an artificial wound was made at 0th h and also at 24th h (Supplemental Figure S4B). Quantified results were calculated from the images. The significance of JAG2 siRNAs on MB cell migration were analyzed using paired t-test, sample vs. control (*p < 0.05, **p < 0.01). (F) The expression of JAG2 in MB tissues of different stages of metastasis (45 patients at M0 stage, 5 patients at M1 stage, 4 patients at M2 stage, and 9 patients at M3 stage); (G) Kaplan-Meier plots of overall survival (OS) time according to JAG2 levels in MB patients.
The notion that PDGFRα and PDGFRβ contain well-conserved structure and display largely redundant functions has been documented and generally accepted. However, in this study, we present data showing that PDGFRα and PDGFRβ play distinct roles in MB cells by differentially regulating MB cellular functions. Notably, structure-function analysis of the two PDGFRs shows that although they share 70% homologues in the N-termini and 80% in the C-termini of the kinase domain [68], significant differences exist in their ligand binding domain (31% identical) and a sub-domain located at the C-terminal region (27–28% homologues). These dissimilar structural features presumably can account for, at least in part, how the two receptors show differential ligand binding specificity and affinity and additionally, interaction with unique target protein sets to mediate starkly distinct functions in vitro [69] and in vivo [68, 70, 71].
Oncogenic activation of the c-MYC gene is commonly observed in MBs [13, 14, 72, 73] and over-expression of c-MYC is one of the critical features of Group 3 MBs [25, 60]. The subset of MB patients with 17p loss and higher levels of c-MYC is characterized by shorter survival [14]. Notably, majority of the MB cell lines established from pediatric MB patients express high levels of c-MYC [13, 72]. Based on our current study, the over-expression of c-MYC in MB could be partially due to abnormal PDGFR signaling because c-MYC is a PDGFRβ downstream target (Figure 2D). Although c-MYC expression is partially regulated by PDGFRβ, c-MYC and PDGFRβ regulate cellular functions differently, since PDGFRβ siRNA or inhibitor had a greater inhibitory effect on migration, while c-MYC siRNA or inhibitor primarily blocked MB cell proliferation. Importantly, only blockade of PDGFRβ showed significant effects on limiting cell invasion (Figure 2C), suggesting that PDGFRβ may play a more critical role in MB invasion. Although our current data from patients with MB that high levels of PDGFRβ are mainly observed in SHH tumors, high levels of PDGFRβ also exist in other subgroups and all cell lines tested in this study (Figure 1D, 3A). Therefore, targeting both PDGFR and c-MYC might provide a novel therapeutic strategy for treating MB. Indeed, we have demonstrated that the combined inhibition of both PDGFRβ and c-MYC using either gene-specific siRNAs or pharmacological inhibitors showed additive inhibitory effects on both MB cell proliferation and migration compared to single knockdown of either PDGFRβ or c-MYC (Figure 3C, 3D).
MicroRNAs provide an important mechanism for modulating signaling pathways [74–78]. While analysis the PDGFR specific signatures in MB tumors, we noticed the results from 2 out of 5 data sets showing that PDGFRβ, but not PDGFRα, was associated with miRNA_in_cancer (Tables S2, S3). Our array knockdown analysis of individual PDGFRs also show that PDGFRα signaling has little effects on miRNA regulation in the tested cells (Figure 4A). Through miRNA profiling, target prediction and validation, we revealed that PDGFRβ and c-MYC may modulate MB biology via a set of highly regulated miRNAs (Figure 4A) and miRNA targets. Notably, Schopman et al. showed that miR-1280 might be a fragment of a tRNA based on their sequence similarity and annotation [79]. We first confirmed the expression of miR-1280 in different MB cell lines that responded to knockdown of PDGFRα, PDGFRβ or c-MYC. We further demonstrated that the miR-1280 inhibitor suppressed the expression of miR-1280 in MB cells (Figure 4C), and that this suppression had a more pronounced effect on cellular motility than proliferation (Figure 4E, 4F). Knockdown of either PDGFRβ, c-MYC alone or in combination provided evidence of an inverse correlation between the expression levels of miR-1280 and its expected target, JAG2 (Figure 4B, 5A). The expression of JAG2 in MB cells regulated by miR-1280 was further confirmed in studies using a miR-1280 inhibitor (Figure 5B). These results support the notion that JAG2 is a bona fide target of miR-1280. Furthermore, the effects of JAG2 siRNA phenocopied the functional effects of the miR-1280 inhibitor on Daoy cell proliferation and migration in the current study. Now, we have direct evidence that JAG2 is involved in PDGFRβ and c-MYC signaling, supporting the novel PDGFRβ-c-MYC-JAG2 regulatory axis in MB growth and migration (Figure 6). Our findings are in line with a recent paper indicating that Notch signaling and c-MYC signaling transduction are linked in MBs [80]. However, it further extends this report by suggesting an upstream regulatory role PDGFRβ in this signaling network and delineating that miR-1280 has an important role in the transcriptional regulation of JAG2. Further, here we demonstrate for the first time that JAG2 is regulated by PDGFRB and c-MYC and there is an immediate functional impact of JAG2 abrogation in MBs. Given that c-MYC is a well-known driver of oncogenesis in many models and cancer types, and that JAG2 is a c-MYC-regulated gene [81], the PDGFRβ-c-MYC-JAG2 pathways would be a logical and expected mechanism of MB carcinogenesis.
JAG2 is a transmembrane glycoprotein that binds to notch receptors regulating cell proliferation and differentiation in both normal and pathological conditions [50, 82, 83]. The significance of Notch signaling in MB has been demonstrated by employing inhibitors designed to suppress various key regulators playing important roles in the Notch pathway, wherein accompanying changes manifested as a reduction in cell proliferation and increase in apoptosis were observed [51–53], thus implicating Notch signaling as a target that may constitute an additional promising treatment strategy for MB patients. By inference, therefore, it may be proposed that co-targeting of Notch and PDGFR signaling should constitute a more promising effective therapeutic modality for MB, particularly since previous data show that Notch1 inhibition may not be sufficiently robust to achieve tumor control in a small cohort of pre-treated, relapsed MBs [84].
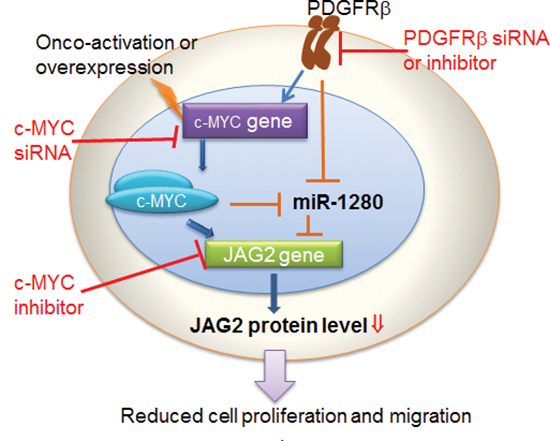
Figure 6: Schematic representation of pathways promoting MB progression by PDGFRβ and c-MYC, and the axis connecting PDGFRβ to JAG2, through c-MYC and miR-1280.
In conclusion, our results demonstrate that PDGFRβ, not PDGFRα, plays an essential role in MB biology. The promoting of MB progression by PDGFRβ and c-MYC could through their several downstream effectors, among which a set of miRNAs, e.g., miR-1280, and concomitantly up-regulates the expression of tumorigenic factors, e.g., JAG2 are important contributors. As the existence of PDGFRβ and c-MYC expression MBs, simultaneous inhibition of PDGFRβ and c-MYC signaling in MB cells synergistically suppresses both cell migration and cell proliferation. We further revealed that the expression of JAG2 is linked with MB metastasis and patients with a poor outcome. Finally, our results proffer the therapeutic tenet that co-targeting of PDGFRβ and c-MYC, or PDGFRβ and Notch signaling may represent novel therapeutic strategies for the treatment of MB.
MATERIALS AND METHODS
Analysis of PDGFRs, c-MYC, and JAG2 expression in primary MB
Using the R2 software (http://r2.amc.nl), we analyzed candidate gene expression levels in primary MBs and normal cerebellar samples, and correlated gene expression patterns with subgroup annotation to a recently published gene expression profiling study [29, 32, 57–59]. The specific pathways associated with the expression of PDGFRα, PDGFRβ, and c-MYC in MBs were analyzed in 5 available complete data sets in the R2 database using the KEGG pathway finder option. The pathways that show significant (p ≤ 0.01, chi-squared test) enrichment based on the genes co-expressed with PDGFRs were identified and specific pathways found in at least 2 of 5 data sets were ordered [29, 32, 33, 59, 60]. In addition to standard descriptive and graphical analyses, qualitative and quantitative association of variables was also evaluated by one-way ANOVA or the Mann-Whitney test, respectively. Survival was measured from the time of initial diagnosis to the date of death or the date of last follow up. Survival distribution was estimated according to the Kaplan-Meier method using optimal cut-off selection and log-rank statistics with Bonferroni based multiple testing corrections. P-values < 0.05 were considered to be statistically significant.
Cell culture
Human MB cell lines, Daoy and D283 were purchased from American Type Culture Collection and D425 cells were a gift from Dr. Darell D. Bigner [85]. Daoy and D283 cells were maintained in modified Eagle’s medium (MEM) containing 10% fetal bovine serum (FBS), 2 mM non-essential amino acids and 5 mM sodium pyruvate. D425 cells were maintained in Zinc-rich MEM medium containing 10% FBS and cultured in a 5% CO2 incubator at 37°C.
RNA interferences
PDGFRα siRNA duplex (5′-GGAGGAUG AUGAUUCUGCCAUUAUA-3′), PDGFRβ siRNA duplex (5′-UCACGGAAAUAACUGAGAUCACCAU-3′), and control (mock) siRNA duplex (5′-ACAUCACGUACGCG GAAUACUUCGA-3′) were obtained from Invitrogen. JAG2 siRNA, a pool of 4 siRNA duplexes (5′-GCAAGGAAGCUGUGUGUAA-3′, 5′-GCGUGUGC CUUAAGGAGUA-3′, 5′-GAACGGCGCUCGCUGC UAU-3′, 5′-GGUCGUACUUGCACUCACA-3′) were purchased from Dharmacon. c-MYC siRNA is a pool of 3 different siRNA duplexes (5′-CCCAAGGUAGUUAUCCUUAtt-3′, 5′-GGAAACGAC GAGAACAGUUtt-3′, and 5′-CCUGAGCAAUCA CCUAUGAtt-3′) were purchased from Santa Cruz. Transfection of siRNA was performed using Lipofectamine™ (Invitrogen) according to the company’s instructions.
Cell proliferation
Cells (2 × 10⁴/well) were incubated in 70% MEM with 10% FBS, 30% Opti-MEM with 15 pM siRNA, or miRNA inhibitor (Applied Biosystems) and 0.25 μl/well of Lipofectamine (Invitrogen) in 96-well plates. For the experiments using inhibitors, cells were treated with either SJ001 (cambogin, 5 μM) [65] or 10058-F4 (an inhibitor that disrupts the c-MYC-Max interaction ) [45–47] (Calbiochem) at various concentration as indicated in the figures. At 48 h post-treatment, cell proliferation rates were determined using a MTS assay (Promega).
Lactate dehydrogenase (LDH) based cell death index
Cells (2 × 10⁴/well) were placed in MEM without penicillin and streptomycin a day before transfection in 24-well plates. After 48 h of siRNA transfection, culture media were harvested for assessment of released LDH using an LDH based toxicology assay kit (Sigma).
RT-PCR and western blotting
Real-time RT-PCR and Western blotting were performed as described [69]. The antibodies were purchased from various manufacturers: anti-human PDGFRα rabbit antibody (Santa Cruz), anti-human PDGFRβ rabbit antibody (Epitomics), anti-human PDGFRα mouse neutralizing antibody (R&D), anti-human PDGFRβ goat neutralizing antibody (R&D), c-MYC rabbit antibody (Sigma), JAG2 rabbit antibody (Cell Signaling), β-actin mouse antibody (Sigma), secondary rabbit HRP-conjugated antibody (Bio-Rad), secondary mouse HRP-conjugate antibody (Sigma).
Invasion and wound healing assay
Boyden chamber 24-well invasion assay kit was purchased from Calbiochem. Invasion assays were performed as previously described [69]. Wound healing assays were used to measure the rate of cell migration [86]. Daoy cells were treated with siRNA, or inhibitor as indicated in the Figures. Equal amount of scrambled siRNA or solvent served as a control. At 36 h, cells were detached, and equal number of cells was re-distributed in a 48-well plate. After 48 h incubation, an artificial wound was made using a 100 μl pipette tip by scraping across the bottom of the well. The medium was changed to remove all detached cells. Movement of cells into the wound area was captured by taking images at 0 and 24 h using a phase-contrast microscope (Olympus). Migration rates in percentage were calculated by comparing the width of the wound at 0 and 24 h in each sample against control cells. Wound healing assay was not performed on D283 and D425 cells as they are half adherent/half suspension cells. Experiments were performed in triplicate. The results are presented as percentage for wound healing.
MicroRNA (miRNA) profiling
Control shRNA, PDGFRα-shRNA and PDGFRβ-shRNA plasmids were prepared using a vector (pRNAT-CMV3.2/Neo) from GenScript. The plasmids were introduced into Daoy cells followed by G418 selection. The control cells (harboring a mask control shRNA vector) and PDGFRβKD cells were used to prepare c-MYCKD and PDGFRβKDc-MYCKD cells, respectively, using c-MYC specific siRNA. Total RNAs were isolated from control, PDGFRα, PDGFRβKD, c-MYCKD, and PDGFRβKD c-MYCKD cells using the miRCURYTM RNA isolation kit (Exiqon) following the manufacturer’s protocol. NanoDrop 1000 spectrophotometer (Thermo Scientific) and agarose gel electrophoresis were used to assess the quality of the RNA isolated. The samples were labeled using the miRCURY LNATM microRNA Hi-Power Labeling kit Hy3TM/Hy5TM (Exiqon) and hybridized on the miRCURY LNATM microRNA Array (6th Gen, Exiqon). Duplicate samples for each cell type were applied to the array analysis. The quantified signals were normalized (background corrected) using the global Lowess regression algorithm and the highly differentially regulated miRNAs were selected and presented in the heat map.
Determination of miRNAs by Taqman PCR
Total RNA was isolated using TRI reagent (Sigma). One μg of total RNA was used to prepare miRNA specific cDNA using TaqMan® microRNA reverse transcription kit (Applied Biosystems). One μl of this cDNA was used to perform qRT-PCR using 20x TaqMan® MicroRNA assay along with TaqMan Universal PCR master mix (Applied Biosystems) to validate the regulated miRNAs in MB cells. RNU6B was chosen as an endogenous control. Experiments were performed in duplicate. PCR was performed using the following program: initial enzyme activation at 95°C for 10 min, denaturation at 95°C for 15s followed by annealing/extension at 60°C for 1 min for 40 cycles. Fold change obtained from Ct values using 2–ΔΔ Ct methodology [87] was converted into logarithmic base 2 for statistical analysis. p < 0.05 was considered to be statistically significant.
ACKNOWLEDGEMENTS
We are grateful to Dr. Darell D. Bigner at Duke University for providing MB cell line D425. We thank Dr. Jing Yang at The University California, San Diego, and other members of the Wu lab for their suggestions and help for the manuscript. This work was supported by a project grant from the National Center for Research Resources (NCRR; P20 RR020151) and the National Institute of General Medical Sciences (NIGMS; P20 GM103505) from the National Institutes of Health (NIH). MR received a postdoctoral fellowship by the Mildred-Scheel foundation / German Cancer Aid. LW was supported by the V Foundation for Cancer Research and the National Institute of Dental & Craniofacial Research of NIH (R01DE023641). MDT is supported by a CIHR Clinician Scientist Phase II award, funds from the Garron Family Chair in Childhood Cancer Research at The Hospital for Sick Children and The University of Toronto, and operating funds from the Canadian Institutes of Health Research, NIH (R01CA159859 and R01CA148699) and the Pediatric Brain Tumor Foundation. The contents of this report are solely the responsibility of the authors and do not necessarily reflect the official views of the NIH, NCRR, NIGMS, any other funding agencies listed above.
Authorship contributions
Conceived and designed the experiments: FW, MR, KB, MDT, EW. Performed the experiments: FW, MR, KB, SZ. Analyzed the data: FW, MR, KB, ETW, SZ, VR, AD, EF, SS, HZ, TCH, STO, LW, DWL, CH, ISK, JMW, MW, MDT, EW. Wrote the paper: FW, MR, KB, STO, JMW, MW, MDT, EW.
REFERENCES
1. Smoll NR. Relative survival of childhood and adult medulloblastomas and primitive neuroectodermal tumors (PNETs). Cancer. 2012; 118:1313–1322.
2. Pizer BL, Clifford SC. The potential impact of tumour biology on improved clinical practice for medulloblastoma: progress towards biologically driven clinical trials. Br J Neurosurg. 2009; 23:364–375.
3. Taylor RE, Bailey CC, Robinson KJ, Weston CL, Ellison D, Ironside J, Lucraft H, Gilbertson R, Tait DM, Saran F, Walker DA, Pizer BL, Lashford LS. Impact of radiotherapy parameters on outcome in the International Society of Paediatric Oncology/United Kingdom Children’s Cancer Study Group PNET-3 study of preradiotherapy chemotherapy for M0–M1 medulloblastoma. Int J Radiat Oncol Biol Phys. 2004; 58:1184–1193.
4. Taylor RE, Bailey CC, Robinson K, Weston CL, Ellison D, Ironside J, Lucraft H, Gilbertson R, Tait DM, Walker DA, Pizer BL, Imeson J, Lashford LS. Results of a randomized study of preradiation chemotherapy versus radiotherapy alone for nonmetastatic medulloblastoma: The International Society of Paediatric Oncology/United Kingdom Children’s Cancer Study Group PNET-3 Study. J Clin Oncol. 2003; 21:1581–1591.
5. Gottardo NG, Hansford JR, McGlade JP, Alvaro F, Ashley DM, Bailey S, Baker DL, Bourdeaut F, Cho YJ, Clay M, Clifford SC, Cohn RJ, Cole CH, Dallas PB, Downie P, Doz F, et al. Medulloblastoma Down Under 2013: a report from the third annual meeting of the International Medulloblastoma Working Group. Acta Neuropathol. 2014. 127:189–201.
6. Lannering B, Rutkowski S, Doz F, Pizer B, Gustafsson G, Navajas A, Massimino M, Reddingius R, Benesch M, Carrie C, Taylor R, Gandola L, Bjork-Eriksson T, Giralt J, Oldenburger F, Pietsch T, et al. Hyperfractionated versus conventional radiotherapy followed by chemotherapy in standard-risk medulloblastoma: results from the randomized multicenter HIT-SIOP PNET 4 trial. J Clin Oncol. 2012; 30:3187–3193.
7. Pizer B, Donachie PH, Robinson K, Taylor RE, Michalski A, Punt J, Ellison DW, Picton S. Treatment of recurrent central nervous system primitive neuroectodermal tumours in children and adolescents: results of a Children’s Cancer and Leukaemia Group study. Eur J Cancer. 2011; 47:1389–1397.
8. Michalski A, Bouffet E, Taylor RE, Hargrave D, Walker D, Picton S, Robinson K, Pizer B, Bujkiewicz S. The addition of high-dose tamoxifen to standard radiotherapy does not improve the survival of patients with diffuse intrinsic pontine glioma. J Neurooncol. 2010; 100:81–88.
9. Taylor RE, Donachie PH, Weston CL, Robinson KJ, Lucraft H, Saran F, Ellison DW, Ironside J, Walker DA, Pizer BL. Impact of radiotherapy parameters on outcome for patients with supratentorial primitive neuro-ectodermal tumours entered into the SIOP/UKCCSG PNET 3 study. Radiother Oncol. 2009; 92:83–88.
10. Stearns D, Chaudhry A, Abel TW, Burger PC, Dang CV, Eberhart CG. c-myc overexpression causes anaplasia in medulloblastoma. Cancer Res. 2006; 66:673–681.
11. MacDonald TJ, Brown KM, LaFleur B, Peterson K, Lawlor C, Chen Y, Packer RJ, Cogen P, Stephan DA. Expression profiling of medulloblastoma: PDGFRA and the RAS/MAPK pathway as therapeutic targets for metastatic disease. Nat Genet. 2001; 29:143–152.
12. Gilbertson RJ, Clifford SC. PDGFRB is overexpressed in metastatic medulloblastoma. Nat Genet. 2003; 35:197–198.
13. Siu IM, Lal A, Blankenship JR, Aldosari N, Riggins GJ. c-Myc promoter activation in medulloblastoma. Cancer Res. 2003; 63:4773–4776.
14. Park AK, Lee SJ, Phi JH, Wang KC, Kim DG, Cho BK, Haberler C, Fattet S, Dufour C, Puget S, Sainte-Rose C, Bourdeaut F, Grill J, Delattre O, Kim SK, Park WY. Prognostic classification of pediatric medulloblastoma based on chromosome 17p loss, expression of MYCC and MYCN, and Wnt pathway activation. Neuro Oncol. 2011; 14:203–214.
15. Claesson-Welsh L. Platelet-derived growth factor receptor signals. J Biol Chem. 1994; 269:32023–32026.
16. Vassbotn FS, Ostman A, Siegbahn A, Holmsen H, Heldin CH. Neomycin is a platelet-derived growth factor (PDGF) antagonist that allows discrimination of PDGF alpha- and beta-receptor signals in cells expressing both receptor types. J Biol Chem. 1992; 267:15635–15641.
17. Lokker NA, Sullivan CM, Hollenbach SJ, Israel MA, Giese NA. Platelet-derived growth factor (PDGF) autocrine signaling regulates survival and mitogenic pathways in glioblastoma cells: evidence that the novel PDGF-C and PDGF-D ligands may play a role in the development of brain tumors. Cancer Res. 2002; 62:3729–3735.
18. Roberts WG, Whalen PM, Soderstrom E, Moraski G, Lyssikatos JP, Wang HF, Cooper B, Baker DA, Savage D, Dalvie D, Atherton JA, Ralston S, Szewc R, Kath JC, Lin J, Soderstrom C, et al. Antiangiogenic and antitumor activity of a selective PDGFR tyrosine kinase inhibitor, CP-673, 451. Cancer Res. 2005; 65:957–966.
19. Gilbertson RJ, Langdon JA, Hollander A, Hernan R, Hogg TL, Gajjar A, Fuller C, Clifford SC. Mutational analysis of PDGFR-RAS/MAPK pathway activation in childhood medulloblastoma. Eur J Cancer. 2006; 42:646–649.
20. MacDonald TJ, Brown K, LaFleur B, Peterson K, Lawlor C, Chen Y, Packer RJ, Cogen P, Stephan DA. Expression profiling of medulloblastoma: PDGFRA and the RAS/MAPK pathway as therapeutic targets for metastatic disease. Nat Genet 2001; 29:143–152.
21. Kho AT, Zhao Q, Cai Z, Butte AJ, Kim JY, Pomeroy SL, Rowitch DH, Kohane IS. Conserved mechanisms across development and tumorigenesis revealed by a mouse development perspective of human cancers. Genes Dev. 2004; 18:629–640.
22. Wu X, Northcott PA, Dubuc A, Dupuy AJ, Shih DJ, Witt H, Croul S, Bouffet E, Fults DW, Eberhart CG, Garzia L, Van Meter T, Zagzag D, Jabado N, Schwartzentruber J, Majewski J, et al. Clonal selection drives genetic divergence of metastatic medulloblastoma. Nature. 2012; 482:529–533.
23. Cho YJ, Tsherniak A, Tamayo P, Santagata S, Ligon A, Greulich H, Berhoukim R, Amani V, Goumnerova L, Eberhart CG, Lau CC, Olson JM, Gilbertson RJ, Gajjar A, Delattre O, Kool M, et al. Integrative Genomic Analysis of Medulloblastoma Identifies a Molecular Subgroup That Drives Poor Clinical Outcome. J Clin Oncol. 2010; 29:1424–1430.
24. Smoll NR. Relative survival of childhood and adult medulloblastomas and primitive neuroectodermal tumors (PNETs). Cancer. 2011; 118:1313–1322.
25. Taylor MD, Northcott PA, Korshunov A, Remke M, Cho YJ, Clifford SC, Eberhart CG, Parsons DW, Rutkowski S, Gajjar A, Ellison DW, Lichter P, Gilbertson RJ, Pomeroy SL, Kool M, Pfister SM. Molecular subgroups of medulloblastoma: the current consensus. Acta Neuropathol. 2012; 123:465–472.
26. Ellison DW, Dalton J, Kocak M, Nicholson SL, Fraga C, Neale G, Kenney AM, Brat DJ, Perry A, Yong WH, Taylor RE, Bailey S, Clifford SC, Gilbertson RJ. Medulloblastoma: clinicopathological correlates of SHH, WNT, and non-SHH/WNT molecular subgroups. Acta Neuropathol. 2011; 121:381–396.
27. McCabe MG, Backlund LM, Leong HS, Ichimura K, Collins VP. Chromosome 17 alterations identify good-risk and poor-risk tumors independently of clinical factors in medulloblastoma. Neuro Oncol. 2011; 13:376–383.
28. Parsons DW, Li M, Zhang X, Jones S, Leary RJ, Lin JC, Boca SM, Carter H, Samayoa J, Bettegowda C, Gallia GL, Jallo GI, Binder ZA, Nikolsky Y, Hartigan J, Smith DR, et al. The genetic landscape of the childhood cancer medulloblastoma. Science. 2011; 331:435–439.
29. Remke M, Hielscher T, Korshunov A, Northcott PA, Bender S, Kool M, Westermann F, Benner A, Cin H, Ryzhova M, Sturm D, Witt H, Haag D, Toedt G, Wittmann A, Schottler A, et al. FSTL5 is a marker of poor prognosis in non-WNT/non-SHH medulloblastoma. J Clin Oncol. 2011; 29:3852–3861.
30. Schwalbe EC, Lindsey JC, Straughton D, Hogg TL, Cole M, Megahed H, Ryan SL, Lusher ME, Taylor MD, Gilbertson RJ, Ellison DW, Bailey S, Clifford SC. Rapid diagnosis of medulloblastoma molecular subgroups. Clin Cancer Res. 2011; 123:615–626.
31. Gibson P, Tong Y, Robinson G, Thompson MC, Currle DS, Eden C, Kranenburg TA, Hogg T, Poppleton H, Martin J, Finkelstein D, Pounds S, Weiss A, Patay Z, Scoggins M, Ogg R, et al. Subtypes of medulloblastoma have distinct developmental origins. Nature. 2010; 468:1095–1099.
32. Robinson G, Parker M, Kranenburg TA, Lu C, Chen X, Ding L, Phoenix TN, Hedlund E, Wei L, Zhu X, Chalhoub N, Baker SJ, Huether R, Kriwacki R, Curley N, Thiruvenkatam R, et al. Novel mutations target distinct subgroups of medulloblastoma. Nature. 2012; 488:43–48.
33. Thompson MC, Fuller C, Hogg TL, Dalton J, Finkelstein D, Lau CC, Chintagumpala M, Adesina A, Ashley DM, Kellie SJ, Taylor MD, Curran T, Gajjar A, Gilbertson RJ. Genomics identifies medulloblastoma subgroups that are enriched for specific genetic alterations. J Clin Oncol. 2006; 24:1924–1931.
34. Kool M, Korshunov A, Remke M, Jones DT, Schlanstein M, Northcott PA, Cho YJ, Koster J, Schouten-van Meeteren A, van Vuurden D, Clifford SC, Pietsch T, von Bueren AO, Rutkowski S, McCabe M, Collins VP, et al. Molecular subgroups of medulloblastoma: an international meta-analysis of transcriptome, genetic aberrations, and clinical data of WNT, SHH, Group 3, and Group 4 medulloblastomas. Acta Neuropathol. 2012; 123:473–484.
35. Schmidt EV. The role of c-myc in cellular growth control. Oncogene. 1999; 18:2988–2996.
36. Trumpp A, Refaeli Y, Oskarsson T, Gasser S, Murphy M, Martin GR, Bishop JM. c-Myc regulates mammalian body size by controlling cell number but not cell size. Nature. 2001; 414:768–773.
37. Pelengaris S, Khan M, Evan G. c-MYC: more than just a matter of life and death. Nat Rev Cancer. 2002; 2:764–776.
38. Wang Y, Thakur A, Sun Y, Wu J, Biliran H, Bollig A, Liao DJ. Synergistic effect of cyclin D1 and c-Myc leads to more aggressive and invasive mammary tumors in severe combined immunodeficient mice. Cancer Res. 2007; 67:3698–3707.
39. Wang C, Lisanti MP, Liao DJ. Reviewing once more the c-myc and Ras collaboration: converging at the cyclin D1-CDK4 complex and challenging basic concepts of cancer biology. Cell Cycle. 2010; 10:57–67.
40. Prendergast GC. Mechanisms of apoptosis by c-Myc. Oncogene. 1999; 18:2967–2987.
41. Sakamuro D, Eviner V, Elliott KJ, Showe L, White E, Prendergast GC. c-Myc induces apoptosis in epithelial cells by both p53-dependent and p53-independent mechanisms. Oncogene. 1995; 11:2411–2418.
42. Nilsson JA, Cleveland JL. Myc pathways provoking cell suicide and cancer. Oncogene. 2003; 22:9007–9021.
43. von Bueren AO, Shalaby T, Oehler-Janne C, Arnold L, Stearns D, Eberhart CG, Arcaro A, Pruschy M, Grotzer MA. RNA interference-mediated c-MYC inhibition prevents cell growth and decreases sensitivity to radio- and chemotherapy in childhood medulloblastoma cells. BMC cancer. 2009; 9:10.
44. Grotzer MA, Hogarty MD, Janss AJ, Liu X, Zhao H, Eggert A, Sutton LN, Rorke LB, Brodeur GM, Phillips PC. MYC messenger RNA expression predicts survival outcome in childhood primitive neuroectodermal tumor/medulloblastoma. Clin Cancer Res. 2001; 7:2425–2433.
45. Pfister S, Remke M, Benner A, Mendrzyk F, Toedt G, Felsberg J, Wittmann A, Devens F, Gerber NU, Joos S, Kulozik A, Reifenberger G, Rutkowski S, Wiestler OD, Radlwimmer B, Scheurlen W, et al. Outcome prediction in pediatric medulloblastoma based on DNA copy-number aberrations of chromosomes 6q and 17q and the MYC and MYCN loci. J Clin Oncol. 2009; 27:1627–1636.
46. Huang MJ, Cheng YC, Liu CR, Lin S, Liu HE. A small-molecule c-Myc inhibitor, 10058-F4, induces cell-cycle arrest, apoptosis, and myeloid differentiation of human acute myeloid leukemia. Exp Hematol. 2006; 34:1480–1489.
47. Jung KC, Park CH, Hwang YH, Rhee HS, Lee JH, Kim HK, Yang CH. Fatty acids, inhibitors for the DNA binding of c-Myc/Max dimer, suppress proliferation and induce apoptosis of differentiated HL-60 human leukemia cell. Leukemia. 2006; 20:122–127.
48. Lin CP, Liu JD, Chow JM, Liu CR, Liu HE. Small-molecule c-Myc inhibitor, 10058-F4, inhibits proliferation, downregulates human telomerase reverse transcriptase and enhances chemosensitivity in human hepatocellular carcinoma cells. Anticancer Drugs. 2007; 18:161–170.
49. Shalaby T, von Bueren AO, Hurlimann ML, Fiaschetti G, Castelletti D, Masayuki T, Nagasawa K, Arcaro A, Jelesarov I, Shin-ya K, Grotzer M. Disabling c-Myc in childhood medulloblastoma and atypical teratoid/rhabdoid tumor cells by the potent G-quadruplex interactive agent S2T1-6OTD. Mol Cancer Ther. 2010; 9:167–179.
50. Pierfelice TJ, Schreck KC, Eberhart CG, Gaiano N. Notch, neural stem cells, and brain tumors. Cold Spring Harb Symp Quant Biol. 2008; 73:367–375.
51. Hallahan AR, Pritchard JI, Hansen S, Benson M, Stoeck J, Hatton BA, Russell TL, Ellenbogen RG, Bernstein ID, Beachy PA, Olson JM. The SmoA1 mouse model reveals that notch signaling is critical for the growth and survival of sonic hedgehog-induced medulloblastomas. Cancer Res. 2004; 64:7794–7800.
52. Fan X, Mikolaenko I, Elhassan I, Ni X, Wang Y, Ball D, Brat DJ, Perry A, Eberhart CG. Notch1 and notch2 have opposite effects on embryonal brain tumor growth. Cancer Res. 2004; 64:7787–7793.
53. Fan X, Matsui W, Khaki L, Stearns D, Chun J, Li YM, Eberhart CG. Notch pathway inhibition depletes stem-like cells and blocks engraftment in embryonal brain tumors. Cancer Res. 2006; 66:7445–7452.
54. Patten BA, Peyrin JM, Weinmaster G, Corfas G. Sequential signaling through Notch1 and erbB receptors mediates radial glia differentiation. J Neurosci. 2003; 23:6132–6140.
55. Lathia JD, Mattson MP, Cheng A. Notch: from neural development to neurological disorders. J Neurochem. 2008; 107:1471–1481.
56. Cho YJ, Tsherniak A, Tamayo P, Santagata S, Ligon A, Greulich H, Berhoukim R, Amani V, Goumnerova L, Eberhart CG, Lau CC, Olson JM, Gilbertson RJ, Gajjar A, Delattre O, Kool M, et al. Integrative genomic analysis of medulloblastoma identifies a molecular subgroup that drives poor clinical outcome. J Clin Oncol. 2011; 29:1424–1430.
57. Remke M, Hielscher T, Northcott PA, Witt H, Ryzhova M, Wittmann A, Benner A, von Deimling A, Scheurlen W, Perry A, Croul S, Kulozik AE, Lichter P, Taylor MD, Pfister SM, Korshunov A. Adult medulloblastoma comprises three major molecular variants. J Clin Oncol. 2011; 29:2717–2723.
58. Northcott PA, Korshunov A, Witt H, Hielscher T, Eberhart CG, Mack S, Bouffet E, Clifford SC, Hawkins CE, French P, Rutka JT, Pfister S, Taylor MD. Medulloblastoma comprises four distinct molecular variants. J Clin Oncol. 2011; 29:1408–1414.
59. Kool M, Koster J, Bunt J, Hasselt NE, Lakeman A, van Sluis P, Troost D, Meeteren NS, Caron HN, Cloos J, Mrsic A, Ylstra B, Grajkowska W, Hartmann W, Pietsch T, Ellison D, et al. Integrated genomics identifies five medulloblastoma subtypes with distinct genetic profiles, pathway signatures and clinicopathological features. PloS One. 2008; 3:e3088.
60. Northcott PA, Shih DJ, Peacock J, Garzia L, Morrissy AS, Zichner T, Stutz AM, Korshunov A, Reimand J, Schumacher SE, Beroukhim R, Ellison DW, Marshall CR, Lionel AC, Mack S, Dubuc A, et al. Subgroup-specific structural variation across 1,000 medulloblastoma genomes. Nature. 2012; 488:49–56.
61. Sacca R, Cochran BH. Identification of a PDGF-responsive element in the murine c-myc gene. Oncogene. 1990; 5:1499–1505.
62. Frick KK, Scher CD. Platelet-derived growth factor-stimulated c-myc RNA accumulation in MG-63 human osteosarcoma cells is independent of both protein kinase A and protein kinase C. Mol Cell Biol. 1990; 10:184–192.
63. Chiariello M, Marinissen MJ, Gutkind JS. Regulation of c-myc expression by PDGF through Rho GTPases. Nat Cell Biol. 2001; 3:580–586.
64. Snuderl M, Batista A, Kirkpatrick ND, Ruiz de Almodovar C, Riedemann L, Walsh EC, Anolik R, Huang Y, Martin JD, Kamoun W, Knevels E, Schmidt T, Farrar CT, Vakoc BJ, Mohan N, Chung E, et al. Targeting placental growth factor/neuropilin 1 pathway inhibits growth and spread of medulloblastoma. Cell. 2013; 152:1065–1076.
65. Tian Z, Shen J, Wang F, Xiao P, Yang J, Lei H, Kazlauskas A, Kohane IS, Wu E. Cambogin is preferentially cytotoxic to cells expressing PDGFR. PLoS One. 2011; 6:e21370.
66. Wang X IM. Prediction of both conserved and nonconserved microRNA targets in animals. Bioinformatics. 2008; 24:325–332.
67. Wang X. miRDB: a microRNA target prediction and functional annotation database with a wiki interface. RNA. 2008; 14:1012–1017.
68. Klinghoffer RA, Mueting-Nelsen PF, Faerman A, Shani M, Soriano P. The two PDGF receptors maintain conserved signaling in vivo despite divergent embryological functions. Mol Cell. 2001; 7:343–354.
69. Wu E, Palmer N, Tian Z, Moseman AP, Galdzicki M, Wang X, Berger B, Zhang H, Kohane IS. Comprehensive dissection of PDGF-PDGFR signaling pathways in PDGFR genetically defined cells. PloS One. 2008; 3:e3794.
70. Zhang J, Cao R, Zhang Y, Jia T, Cao Y, Wahlberg E. Differential roles of PDGFR-alpha and PDGFR-beta in angiogenesis and vessel stability. FASEB J. 2009; 23:153–163.
71. Schmahl J, Raymond CS, Soriano P. PDGF signaling specificity is mediated through multiple immediate early genes. Nat Genet. 2007; 39:52–60.
72. Bigner SH, Friedman HS, Vogelstein B, Oakes WJ, Bigner DD. Amplification of the c-myc gene in human medulloblastoma cell lines and xenografts. Cancer Res. 1990; 50:2347–2350.
73. Boon K, Eberhart CG, Riggins GJ. Genomic amplification of orthodenticle homologue 2 in medulloblastomas. Cancer Res. 2005; 65:703–707.
74. Genovesi LA, Carter KW, Gottardo NG, Giles KM, Dallas PB. Integrated analysis of miRNA and mRNA expression in childhood medulloblastoma compared with neural stem cells. PloS One. 2011; 6:e23935.
75. Weeraratne SD, Amani V, Teider N, Pierre-Francois J, Winter D, Kye MJ, Sengupta S, Archer T, Remke M, Bai AH, Warren P, Pfister SM, Steen JA, Pomeroy SL, Cho YJ. Pleiotropic effects of miR-183~96~182 converge to regulate cell survival, proliferation and migration in medulloblastoma. Acta Neuropathol. 2012; 123:539–552.
76. Weeraratne SD, Amani V, Neiss A, Teider N, Scott DK, Pomeroy SL, Cho YJ. miR-34a confers chemosensitivity through modulation of MAGE-A and p53 in medulloblastoma. Neuro Oncol. 2011; 13:165–175.
77. de Antonellis P, Medaglia C, Cusanelli E, Andolfo I, Liguori L, De Vita G, Carotenuto M, Bello A, Formiggini F, Galeone A, De Rosa G, Virgilio A, Scognamiglio I, Sciro M, Basso G, Schulte JH, et al. MiR-34a targeting of Notch ligand delta-like 1 impairs CD15+/CD133+ tumor-propagating cells and supports neural differentiation in medulloblastoma. PloS One. 2011; 6:e24584.
78. Uziel T, Karginov FV, Xie S, Parker JS, Wang YD, Gajjar A, He L, Ellison D, Gilbertson RJ, Hannon G, Roussel MF. The miR-17~92 cluster collaborates with the Sonic Hedgehog pathway in medulloblastoma. Proc Natl Acad Sci U S A. 2009; 106:2812–2817.
79. Schopman NC, Heynen S, Haasnoot J, Berkhout B. A miRNA-tRNA mix-up: tRNA origin of proposed miRNA. RNA Biol. 2010; 7:573–576.
80. Fiaschetti G, Schroeder C, Castelletti D, Arcaro A, Westermann F, Baumgartner M, Shalaby T, Grotzer MA. NOTCH ligands JAG1 and JAG as critical pro-survival factors in childhood medulloblastoma. Acta Neuropathol Commun. 2014; 2:39.
81. Yustein JT, Liu YC, Gao P, Jie C, Le A, Vuica-Ross M, Chng WJ, Eberhart CG, Bergsagel PL, Dang CV. Induction of ectopic Myc target gene JAG2 augments hypoxic growth and tumorigenesis in a human B-cell model. Proc Natl Acad Sci U S A. 2010; 107:3534–3539.
82. Leong KG, Karsan A. Recent insights into the role of Notch signaling in tumorigenesis. Blood. 2006; 107:2223–2233.
83. Wang Q, Li H, Liu N, Chen XY, Wu ML, Zhang KL, Kong QY, Liu J. Correlative analyses of notch signaling with resveratrol-induced differentiation and apoptosis of human medulloblastoma cells. Neurosci Lett. 2008; 438:168–173.
84. Fouladi M, Stewart CF, Olson J, Wagner LM, Onar-Thomas A, Kocak M, Packer RJ, Goldman S, Gururangan S, Gajjar A, Demuth T, Kun LE, Boyett JM, Gilbertson RJ. Phase I trial of MK-0752 in children with refractory CNS malignancies: a pediatric brain tumor consortium study. J Clin Oncol. 2011; 29:3529–3534.
85. He XM, Wikstrand CJ, Friedman HS, Bigner SH, Pleasure S, Trojanowski JQ, Bigner DD. Differentiation characteristics of newly established medulloblastoma cell lines (D384 Med, D425 Med, and D458 Med) and their transplantable xenografts. Lab Invest. 1991; 64:833–843.
86. Wu KJ, Zeng J, Zhu GD, Zhang LL, Zhang D, Li L, Fan JH, Wang XY, He DL. Silibinin inhibits prostate cancer invasion, motility and migration by suppressing vimentin and MMP-2 expression. Acta Pharmacol Sin. 2009; 30:1162–1168.
87. Livak KJ, Schmittgen TD. Analysis of relative gene expression data using real-time quantitative PCR and the 2(-Delta Delta C(T)) Method. Methods. 2001; 25:402–408.