
Introduction
Patients with advanced esophageal cancer presenting with dysphagia often experience malnutrition as well as impairment of performance status and quality of life. Disease-related malnutrition may suppress anti-tumor immunity and is an independent predictor of worse clinical outcomes [1]. The geriatric nutritional risk index (GNRI) was established by Bouillanne et al. as a risk screening tool for nutrition-related morbidity and mortality [2]. The GNRI is a widely used, simple, and objective measure, calculated using the body mass index (BMI) and serum albumin levels. Serum albumin is a clinically relevant indicator of nutritional status, such as malnutrition and cachexia [3, 4]. Additionally, hypoalbuminemia is often associated with systemic inflammation and impaired host immune responses [5, 6]. Systemic inflammation promotes tumor progression and metastasis [7]. Concurrently, the BMI, which is calculated using body weight and height, is also used to assess the nutritional status of an individual. A low BMI is known to be a negative prognostic factor in several cancers [8, 9].
Recently, it has been widely accepted that the GNRI was strongly associated with mortality in elderly hospitalized patients and in patients with various cancers [10–12]. However, to the best of our knowledge, there have been few reports on the prognostic significance of the GNRI in patients with esophageal squamous cell carcinoma (ESCC). In this study, we have investigated whether the GNRI is a useful predictor of long-term survivals in patients with ESCC who underwent a curative esophagectomy.
Results
Association between the GNRI and various clinicopathological features
The association between the GNRI and clinicopathological features in all patients in this study is shown in Table 1. Based on the GNRI cutoff value of 97.1, 81 (42.4%), and 110 (57.6%) patients were classified as having low and normal GNRIs, respectively. There was a significant association between the GNRI and various clinicopathological factors, such as the BMI (p < 0.0001), tumor size (p < 0.0077), depth of tumor (p < 0.0001), the pathological tumor-node-metastasis (pTNM) stage (p = 0.0038), serum squamous cell carcinoma (SCC) antigen (p = 0.0001), serum albumin levels (p < 0.0001), and C-reactive protein (CRP) levels (p < 0.0001).
Table 1: Relationships between GNRI and clinicopathological features in all patients with ESCC
| Characteristics | Total patients | GNRI | ||
|---|---|---|---|---|
| < 97.1 (n = 81) | ≥ 97.1 (n = 110) | p value | ||
| Age (years) | 67 (48–84) | 66 (47–85) | 0.3170 | |
| Sex | 0.1267 | |||
| Male | 169 | 75 | 94 | |
| Female | 22 | 6 | 16 | |
| BMI | 18.5 (13.1–26.3) | 22.2 (16.5–31.8) | < 0.0001 | |
| WBC | 5730 (2560–12240) | 5435 (2710–17140) | 0.7366 | |
| Neutrophil | 3425 (849–9420) | 3257 (860–15169) | 0.5700 | |
| Lymphocyte | 1410 (160–3470) | 1600 (380–3340) | 0.0795 | |
| Platelet | 24.4 (8.7–49.5) | 21.6 (11.2–41.8) | 0.0574 | |
| Location of tumor | 0.6629 | |||
| Ce | 13 | 7 | 6 | |
| Ut | 10 | 4 | 6 | |
| Mt | 79 | 36 | 43 | |
| Lt | 69 | 28 | 41 | |
| Ae | 20 | 6 | 14 | |
| Tumor size (mm) | 5.0 (0.2–70.0) | 3.7 (0.5-48.0) | 0.0077 | |
| Depth of tumor | < 0.0001 | |||
| T1a–1b | 81 | 23 | 58 | |
| 2 | 16 | 4 | 12 | |
| 3 | 75 | 39 | 36 | |
| 4a–4b | 19 | 15 | 4 | |
| Lymph node metastasis | 0.0901 | |||
| N0 | 102 | 40 | 62 | |
| N1 | 53 | 28 | 25 | |
| N2 | 21 | 5 | 16 | |
| N3 | 15 | 8 | 7 | |
| Pathological TNM stage | 0.0038 | |||
| Ia–Ib | 73 | 20 | 53 | |
| IIa–IIb | 41 | 20 | 21 | |
| IIIa–IIIc | 77 | 41 | 36 | |
| Operation time (min) | 647 (156–1073) | 653 (196–1258) | 0.8831 | |
| Intraoperative blood loss (ml) | 630 (0–10000) | 375 (0–3000) | 0.0842 | |
| SCC antigen | 1.3 (0.1–20.8) | 0.8 (0.1–6.0) | 0.0001 | |
| Albumin | 3.6 (2.3–4.6) | 4.2 (3.3–4.9) | < 0.0001 | |
| CRP | 0.20 (0.01–6.02) | 0.20 (0.01–4.00) | < 0.0001 | |
Cox regression analysis of cancer-specific survival in all patients
Univariate analyses identified that low serum albumin levels (p = 0.0005), high CRP (p = 0.0021), low GNRI (p < 0.0001), large tumor size (p = 0.0026), advanced pTNM stage (p < 0.0001), and not being well differentiated (p = 0.0276) were significantly associated with worse cancer-specific survivals (CSS). Multivariate analysis revealed that the serum albumin levels (hazard ratio [HR], 2.498; 95% confidence interval [CI], 1.333–4.684; p = 0.0043), GNRI (HR, 1.941; 95% CI, 1.120–3.365; p = 0.0181), pTNM stage (HR, 3.884; 95% CI, 2.229–6.769; p < 0.0001), and tumor differentiation (HR, 2.307; 95% CI, 1.262–4.220; p = 0.0066) were the independent prognostic factors for CSS in all patients (Table 2).
Table 2: Prognostic factors for cancer-specific survival in all patients with ESCC
| Variables | Patients (n = 191) | Category or characteristics | Univariate analyses | Multivariate analyses | ||||
|---|---|---|---|---|---|---|---|---|
| HR | 95% CI | p value | HR | 95% CI | p value | |||
| Gender | 22/169 | (female/male) | 1.310 | 0.599–2.867 | 0.4993 | |||
| Age | 81/110 | (<65 / ≥65) | 0.961 | 0.594–1.554 | 0.8713 | |||
| BMI | 144/47 | (≥18.5 / <18.5) | 1.616 | 0.946–2.758 | 0.0787 | |||
| Alb | 159/32 | (≥3.5 / <3.5) | 2.747 | 1.557–4.845 | 0.0005 | 2.498 | 1.333–4.684 | 0.0043 |
| CRP | 148/43 | (<0.5 / ≥0.5) | 2.262 | 1.344–3.807 | 0.0021 | 1.205 | 0.673–2.157 | 0.5300 |
| GNRI | 110/81 | (≥97.1 / <97.1) | 2.879 | 1.764–4.698 | < 0.0001 | 1.941 | 1.120–3.365 | 0.0181 |
| Tumor size | 54/136 | (<3 / ≥3) | 2.704 | 1.415–5.170 | 0.0026 | 1.229 | 0.614–2.461 | 0.5600 |
| pTNM stage | 114/77 | (I, II / III) | 4.600 | 2.747–7.704 | < 0.0001 | 3.884 | 2.229–6.769 | < 0.0001 |
| Differentiation | 64/127 | (well / other) | 1.908 | 1.074–3.390 | 0.0276 | 2.307 | 1.262–4.220 | 0.0066 |
| SCC | 139/52 | (<1.5 / ≥1.5) | 1.546 | 0.921–2.595 | 0.0990 | |||
The CSS and GNRI in all patients
In patients with low and normal GNRIs, the 3-year CSS rates were 51.3% and 79.3%, respectively, and the 5-year CSS rates were 36.9% and 73.8%, respectively. The log-rank test demonstrated that patients with low GNRIs had significantly worse prognoses, with respect to their CSS, than those with normal GNRIs (p = 0.0011) (Figure 1). Similarly, patients with low GNRIs had a significantly worse prognosis in terms of overall survival (OS) than those with normal GNRIs (p < 0.001) (Supplementary Figure 1).
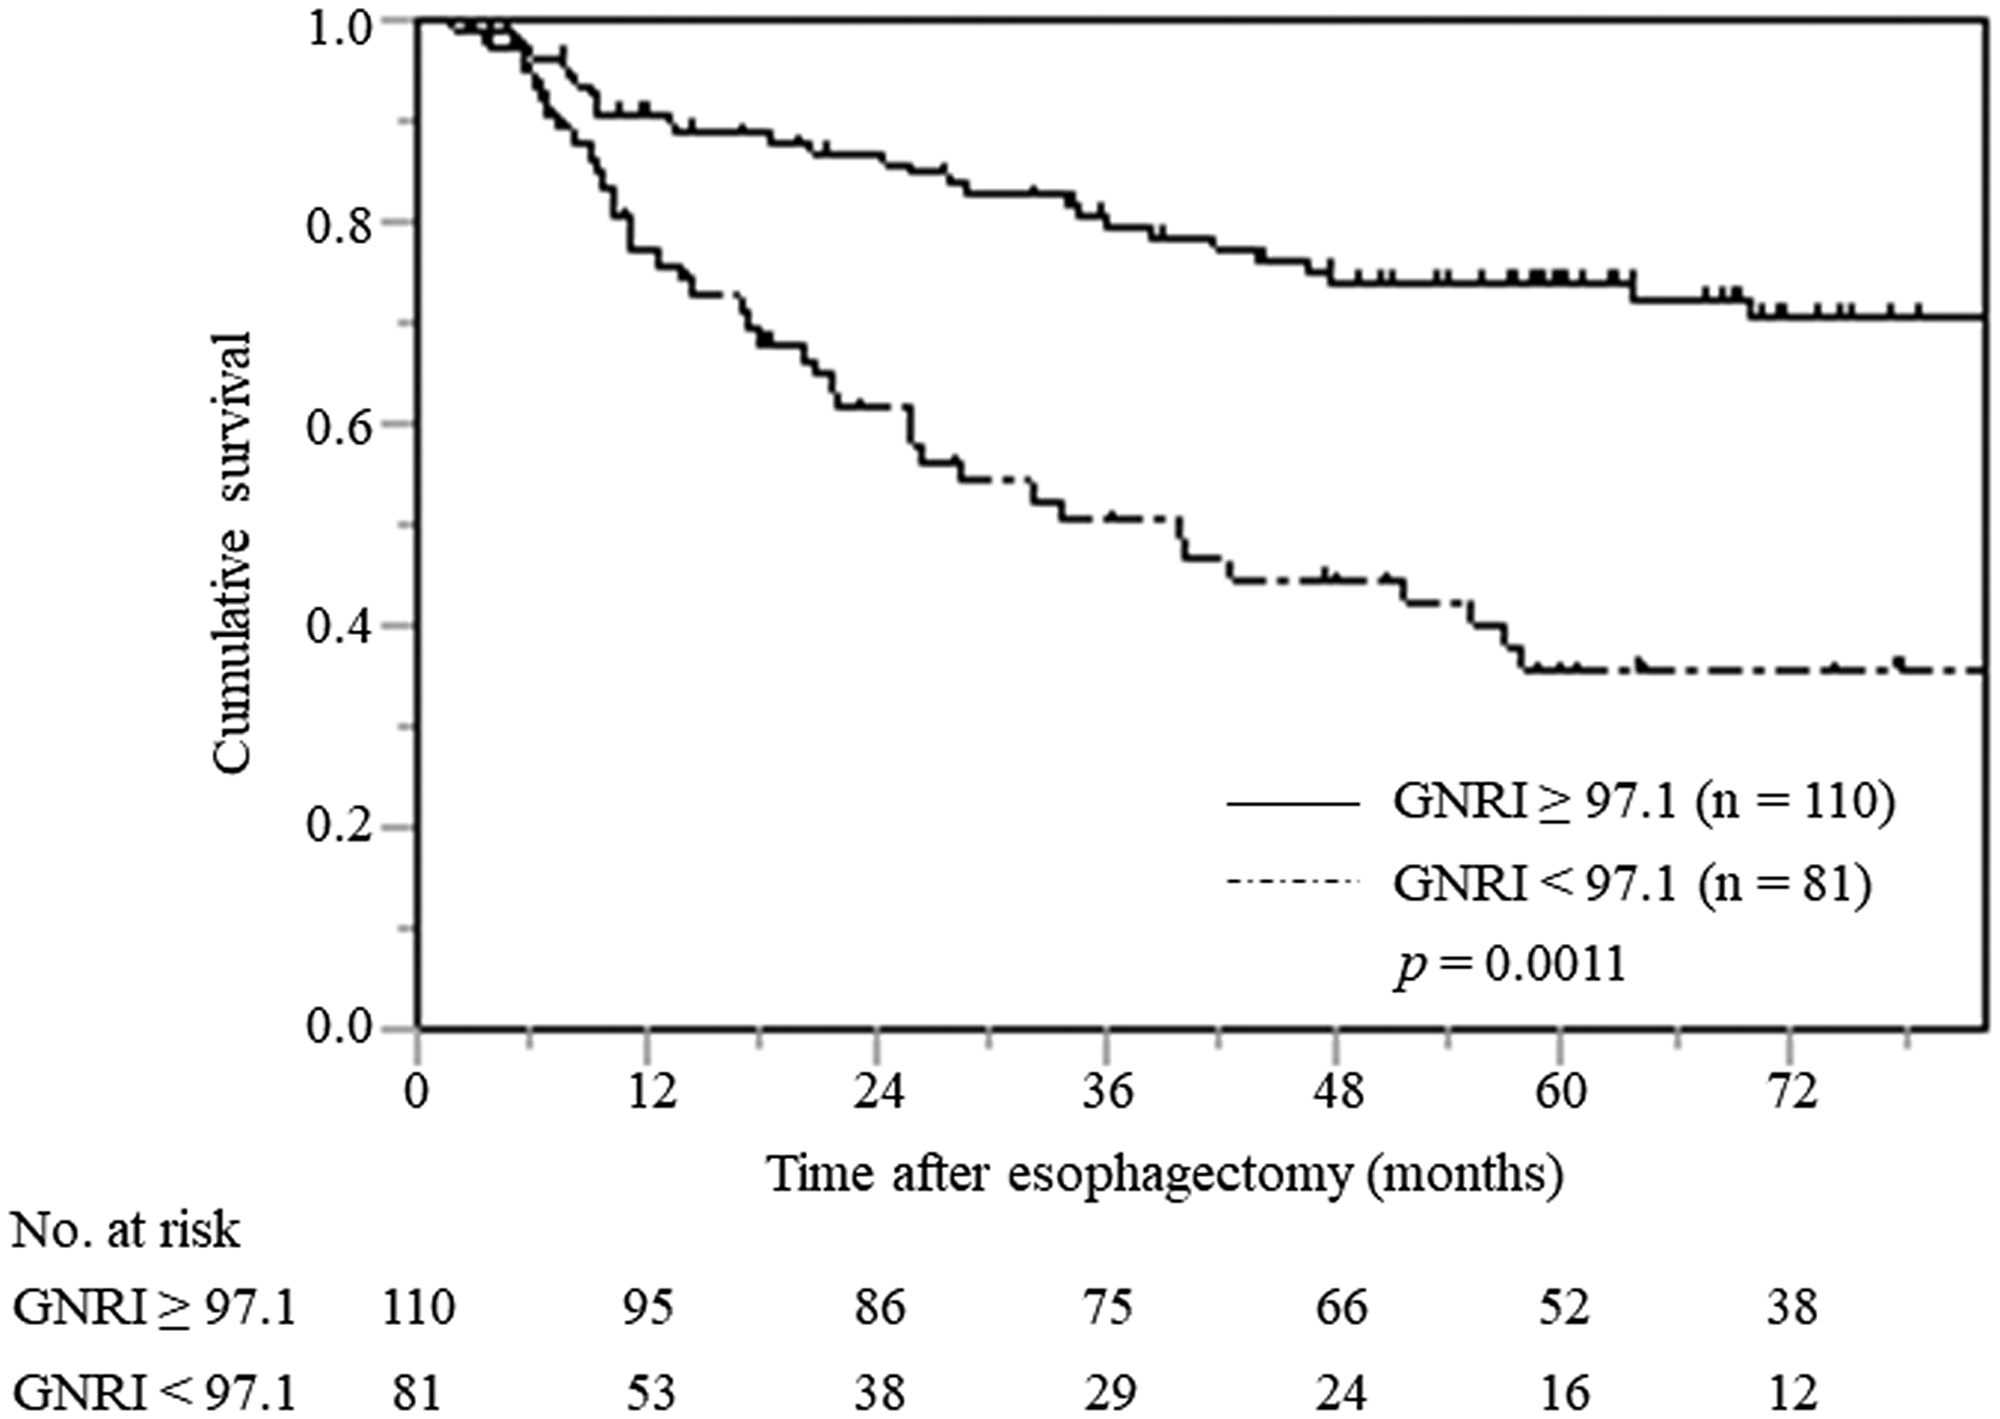
Figure 1: Cancer-specific survival curves in all patients with ESCC stratified by preoperative GNRI.
The GNRI value relative to pTNM stage
The association between the GNRI and pTNM stage is shown in Figure 2. The mean preoperative GNRIs were 101.6 (range 69.8–117.0), 97.3 (range 68.8–119.1), and 96.4 (range 65.9–119.5) in patients with pTNM stage I, II, and III, respectively. There was a significant association between GNRI and pTNM stage in these patients (p = 0.0012).
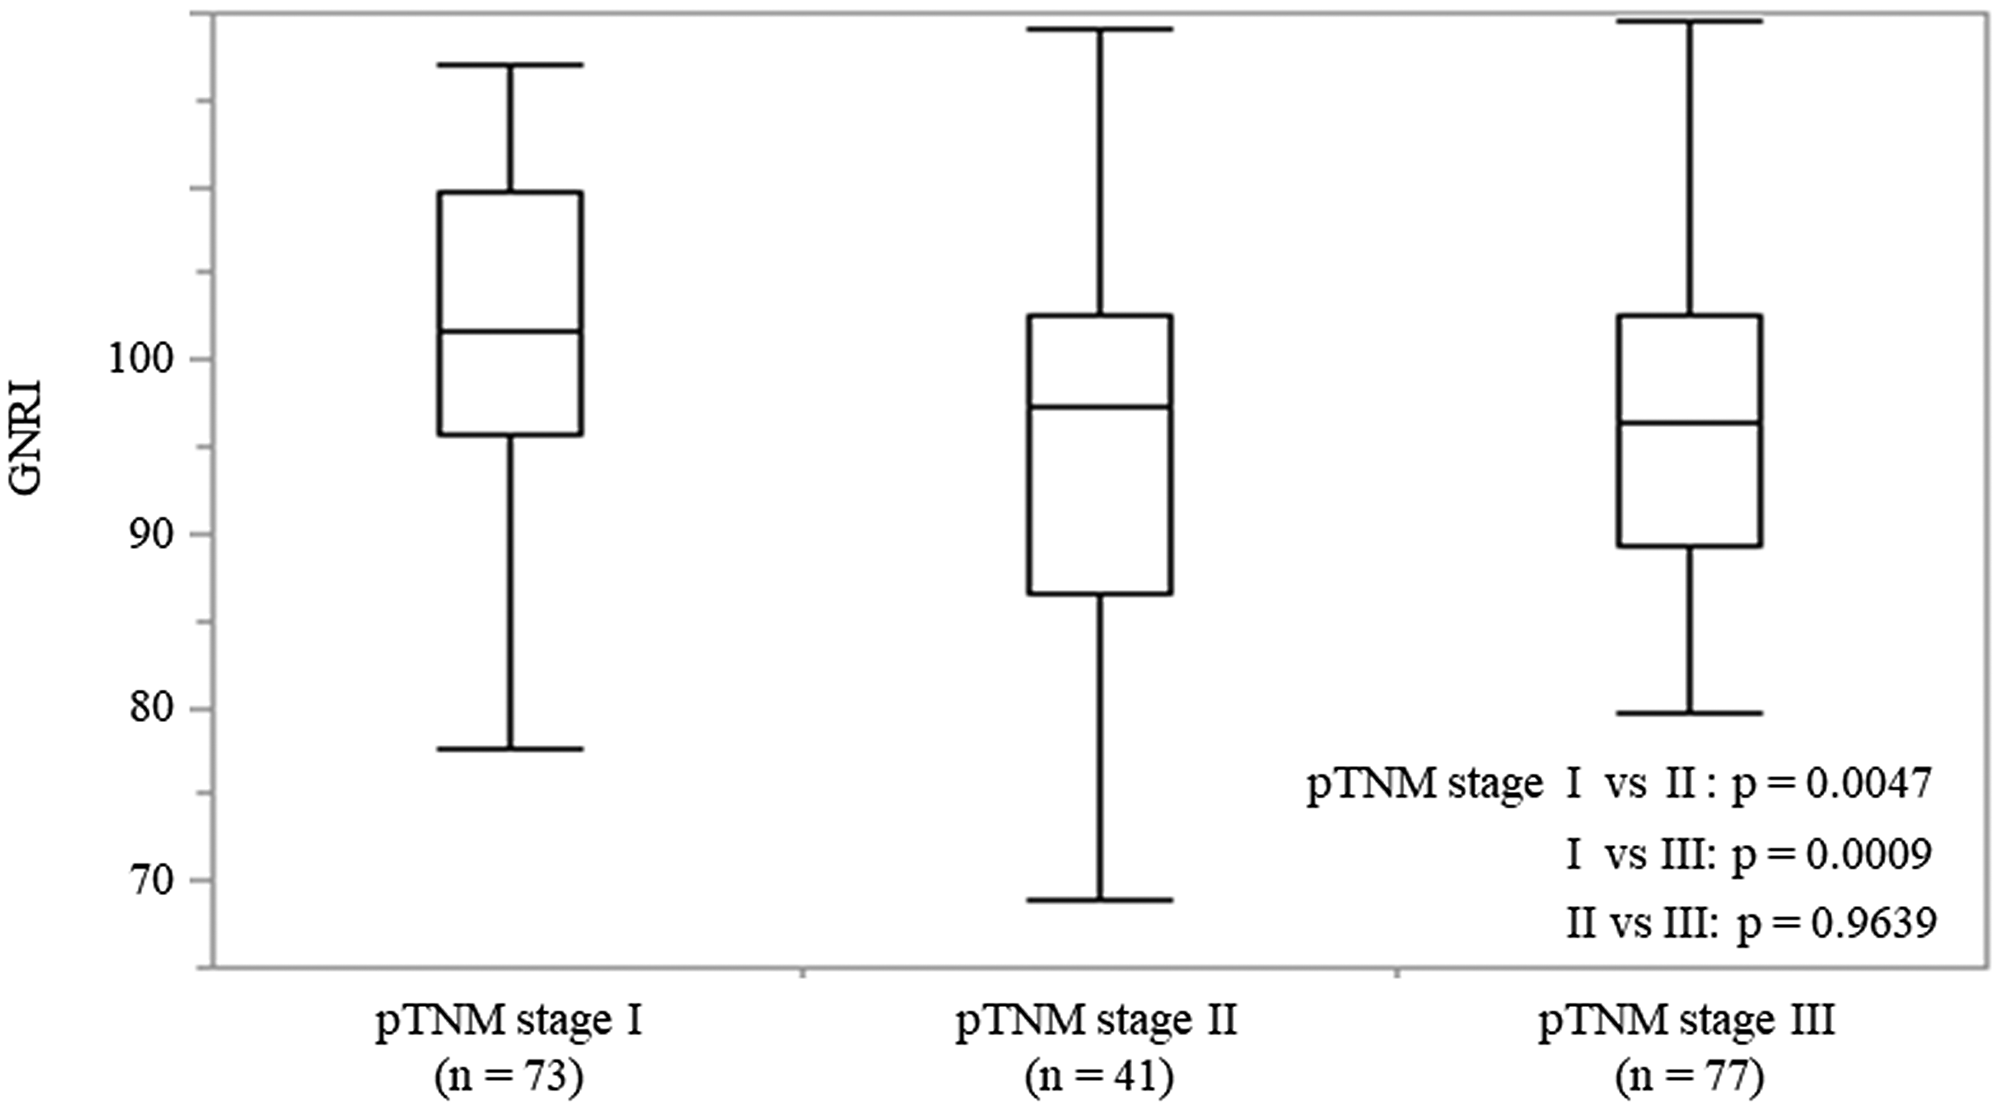
Figure 2: The GNRI values in patients with ESCC at each pTNM stage. On each box, the central mark indicates the median, and the bottom and top edges of the box indicate the 25th and 75th percentiles, respectively. Capped bars indicate the minimum and maximum values, respectively.
Association between the GNRI and clinicopathological factors in subgroups with pTNM stage I, II, and III
Based on the GNRI cutoff value of 97.1, 20 (27.4%) and 53 (72.6%) patients were classified as having low and normal GNRIs, respectively. There was a significant association between the GNRI and clinicopathological factors, such as the BMI (p < 0.0001), SCC antigen (p = 0.0019), and serum albumin levels (p < 0.0001) in patients with pTNM stage I (Table 3A).
Table 3A: Relationships between GNRI and clinicopathological features in patients with ESCC stage I
| Characteristics | Total patients | GNRI | ||
|---|---|---|---|---|
| < 97.1 (n = 20) | ≥ 97.1 (n = 53) | p value | ||
| Age (years) | 70 (53–80) | 66 (47–85) | 0.1873 | |
| Sex | 0.9920 | |||
| Male | 62 | 17 | 45 | |
| Female | 11 | 3 | 8 | |
| BMI | 18.1 (13.3 – 20.8) | 22.3 (16.5–31.8) | < 0.0001 | |
| WBC | 5595 (3350–10800) | 5060 (2710–9940) | 0.6922 | |
| Neutrophil | 3383 (1100–9410) | 2920 (860–7296) | 0.4924 | |
| Lymphocyte | 1470 (560–3470) | 1593 (818–2600) | 0.2846 | |
| Platelet | 23.4 (14.2 – 35.6) | 20.7 (11.2 – 30.9) | 0.0987 | |
| Location of tumor | 0.4399 | |||
| Ce | 3 | 1 | 2 | |
| Ut | 1 | 0 | 1 | |
| Mt | 32 | 12 | 20 | |
| Lt | 28 | 5 | 23 | |
| Ae | 9 | 2 | 7 | |
| Tumor size (mm) | 3.9 (0.2–7.0) | 3.7 (0.5–48.0) | 0.4574 | |
| Depth of tumor | 0.8374 | |||
| T1a–1b | 61 | 17 | 44 | |
| 2 | 12 | 3 | 9 | |
| 3 | 0 | 0 | 0 | |
| 4a-4b | 0 | 0 | 0 | |
| Lymph node metastasis | ||||
| N0 | 73 | 20 | 53 | |
| N1 | 0 | 0 | 0 | |
| N2 | 0 | 0 | 0 | |
| N3 | 0 | 0 | 0 | |
| Operation time (min) | 624 (156–891) | 645 (344–1217) | 0.5527 | |
| Intraoperative blood loss (ml) | 415 (50–1840) | 470 (0–3000) | 0.6922 | |
| SCC antigen | 1.1 (0.3–4.2) | 0.6 (0.1–2.3) | 0.0019 | |
| Albumin | 3.7 (3.0–4.6) | 4.2 (3.6–4.9) | < 0.0001 | |
| CRP | 0.20 (0.02–1.82) | 0.20 (0.01–3.26) | 0.9231 | |
In patients with pTNM stage II, 20 (48.8%) and 21 (51.2%) patients were classified as having low and normal GNRIs, respectively. There was a significant association between the GNRI and various clinicopathological factors, such as the BMI (p = 0.0123), white blood cell (WBC) (p = 0.0489), neutrophil count (p = 0.0446), serum albumin levels (p < 0.0001), and CRP (p = 0.0096) (Table 3B).
Table 3B: Relationships between GNRI and clinicopathological features in patients with ESCC stage II
| Characteristics | Total patients | GNRI | ||
|---|---|---|---|---|
| < 97.1 (n = 20) | ≥ 97.1 (n = 21) | p value | ||
| Age (years) | 72 (55–84) | 65 (50–77) | 0.0732 | |
| Sex | 0.6740 | |||
| Male | 36 | 18 | 18 | |
| Female | 5 | 2 | 3 | |
| BMI | 19.1 (13.1–24.4) | 20.7 (17.9–27.5) | 0.0123 | |
| WBC | 4460 (3070–11360) | 6120 (3920–11340) | 0.0489 | |
| Neutrophil | 2814 (1220–7168) | 3672 (2347–8222) | 0.0446 | |
| Lymphocyte | 1144 (160–3400) | 1600 (778–3330) | 0.1337 | |
| Platelet | 19.5 (9.4–39.7) | 21.7 (13.6–41.8) | 0.4416 | |
| Location of tumor | 0.6296 | |||
| Ce | 3 | 1 | 2 | |
| Ut | 6 | 3 | 3 | |
| Mt | 16 | 9 | 7 | |
| Lt | 11 | 6 | 5 | |
| Ae | 5 | 1 | 4 | |
| Tumor size (mm) | 4.0 (2.0–8.0) | 4.8 (0.5–38.0) | 0.9792 | |
| Depth of tumor | 0.2220 | |||
| T1a–1b | 17 | 6 | 11 | |
| 2 | 3 | 1 | 2 | |
| 3 | 21 | 13 | 8 | |
| 4a–4b | 0 | 0 | 0 | |
| Lymph node metastasis | 0.1426 | |||
| N0 | 21 | 13 | 8 | |
| N1 | 19 | 7 | 12 | |
| N2 | 1 | 0 | 1 | |
| N3 | 0 | 0 | 0 | |
| Operation time (min) | 614 (270–1073) | 633 (395–1258) | 0.7741 | |
| Intraoperative blood loss (ml) | 710 (0–2250) | 560 (0–2620) | 0.5228 | |
| SCC antigen | 1.1 (0.1–6.2) | 0.9 (0.1–2.1) | 0.3018 | |
| Albumin | 3.4 (2.8–4.2) | 4.2 (3.6–4.9) | < 0.0001 | |
| CRP | 0.33 (0.01–2.25) | 0.14 (0.02–1.50) | 0.0096 | |
In patients with pTNM stage III, 41 (53.2%) and 36 (46.8%) patients were classified as having low and normal GNRIs, respectively. GNRI was significantly associated with BMI (p < 0.0001), tumor size (p = 0.0473), depth of tumor (p = 0.0071), lymph node metastasis (p = 0.0076), intraoperative blood loss (p = 0.0191), serum albumin levels (p < 0.0001), and CRP levels (p = 0.0019) (Table 3C).
Table 3C: Relationships between GNRI and clinicopathological features in patients with ESCC stage III
| Characteristics | Total patients | GNRI | ||
|---|---|---|---|---|
| < 97.1 (n = 41) | ≥ 97.1 (n = 36) | p value | ||
| Age (years) | 64 (48–84) | 67 (49–84) | 0.5810 | |
| Sex | 0.0534 | |||
| Male | 71 | 40 | 31 | |
| Female | 6 | 1 | 5 | |
| BMI | 18.5 (15.2–26.3) | 22.3 (16.9–31.8) | < 0.0001 | |
| WBC | 6700 (2560–12240) | 5560 (3280–17140) | 0.3025 | |
| Neutrophil | 4270 (849–9420) | 3408 (2268–15169) | 0.3171 | |
| Lymphocyte | 1480 (179–3390) | 1605 (380–3340) | 0.7170 | |
| Platelet | 25.5 (8.7–49.5) | 22.5 (14.5 – 38.0) | 0.1269 | |
| Location of tumor | 0.7522 | |||
| Ce | 7 | 5 | 2 | |
| Ut | 3 | 1 | 2 | |
| Mt | 31 | 15 | 16 | |
| Lt | 30 | 17 | 13 | |
| Ae | 6 | 3 | 3 | |
| Tumor size (mm) | 5.5 (2.0–70.0) | 4.7 (1.3–32.0) | 0.0473 | |
| Depth of tumor | 0.0071 | |||
| T1a–1b | 3 | 0 | 3 | |
| 2 | 1 | 0 | 1 | |
| 3 | 54 | 26 | 28 | |
| 4a–4b | 19 | 15 | 4 | |
| Lymph node metastasis | 0.0076 | |||
| N0 | 8 | 7 | 1 | |
| N1 | 34 | 21 | 13 | |
| N2 | 20 | 5 | 15 | |
| N3 | 15 | 8 | 7 | |
| Operation time (min) | 665 (230–986) | 664 (196–1113) | 0.9756 | |
| Intraoperative blood loss (ml) | 660 (0–10000) | 280 (0–1650) | 0.0191 | |
| SCC antigen | 1.3 (0.4–20.8) | 1.1 (0.1–6.0) | 0.3091 | |
| Albumin | 3.6 (2.3–4.2) | 4.2 (3.3–4.8) | < 0.0001 | |
| CRP | 0.45 (0.01–6.02) | 0.18 (0.02–4.00) | 0.0019 | |
Cox regression analysis of CSS depending on pTNM stage
In patients with pTNM stage I, univariate analyses identified that low serum albumin levels (p = 0.0420), high CRP (p = 0.0153), and low GNRI (p = 0.0111) were significantly associated with worse CSS. Multivariate analysis revealed that CRP (HR, 7.172; 95% CI, 1.014–50.705; p = 0.0483) and GNRI (HR, 5.579; 95% CI, 1.191–26.133; p = 0.0291) were independent prognostic factors for CSS. In patients with pTNM stage II, univariate analyses confirmed that only low GNRI (p = 0.0095) was significantly associated with worse CSS; whereas, in patients with pTNM stage III, only low serum albumin levels (p = 0.0119) were significantly associated with worse CSS in the univariate analyses (Table 4).
Table 4: Prognostic factors for cancer-specific survival of patients with ESCC in each pTNM stage
| Variables | Patients | Category or characteristics | Univariate analyses | Multivariate analyses | ||||
|---|---|---|---|---|---|---|---|---|
| HR | 95%CI | p value | HR | 95%CI | p value | |||
| pTNM stage I | n = 73 | |||||||
| Gender | 11/62 | (female / male) | 1.450 | 0.181–11.610 | 0.7264 | |||
| Age | 23/46 | (< 65 / ≥ 65) | 1.358 | 0.340–5.434 | 0.6649 | |||
| BMI | 60/13 | (≥ 18.5 / < 18.5) | 2.224 | 0.460–10.760 | 0.3205 | |||
| Alb | 66/7 | (≥ 3.5 / < 3.5) | 5.148 | 1.061–24.965 | 0.0420 | 1.267 | 0.148–10.854 | 0.8290 |
| CRP | 67/6 | (< 0.5 / ≥ 0.5) | 7.636 | 1.477–39.482 | 0.0153 | 7.172 | 1.014–50.705 | 0.0483 |
| GNRI | 53/20 | (≥ 97.1 / < 97.1) | 5.537 | 1.477–20.759 | 0.0111 | 5.579 | 1.191–26.133 | 0.0291 |
| Tumor size | 54/139 | (< 3 / ≥ 3) | 0.920 | 0.247–3.428 | 0.9010 | |||
| Differentiation | 28/45 | (well/other) | 4.455 | 0.557–35.629 | 0.1590 | |||
| SCC | 60/13 | (< 1.5 / ≥ 1.5) | 2.436 | 0.504–11.764 | 0.2679 | |||
| pTNM stage II | n = 41 | |||||||
| Gender | 5/36 | (female / male) | 0.723 | 0.160–3.275 | 0.6742 | |||
| Age | 18/23 | (< 65 / ≥ 65) | 1.131 | 0.378–3.383 | 0.8261 | |||
| BMI | 30/11 | (≥ 18.5 / < 18.5) | 1.399 | 0.427–4.577 | 0.5790 | |||
| Alb | 30/11 | (≥ 3.5 / < 3.5) | 2.376 | 0.767–7.360 | 0.1335 | |||
| CRP | 29/12 | (< 0.5 / ≥ 0.5) | 1.134 | 0.348–3.693 | 0.8344 | |||
| GNRI | 21/20 | (≥ 97.1 / < 97.1) | 5.599 | 1.525–20.566 | 0.0095 | |||
| Tumor size | 54/139 | (< 3 / ≥ 3) | 2.161 | 0.477–9.796 | 0.3179 | |||
| Differentiation | 15/26 | (well / other) | 2.662 | 0.731–9.691 | 0.1374 | |||
| SCC | 32/9 | (< 1.5 / ≥ 1.5) | 0.814 | 0.180–3.678 | 0.7889 | |||
| pTNM stage III | n = 77 | |||||||
| Gender | 6/71 | (female/male) | 1.214 | 0.433–3.402 | 0.7122 | |||
| Age | 36/41 | (< 65 / ≥ 65) | 1.101 | 0.612–1.978 | 0.7483 | |||
| BMI | 54/23 | (≥ 18.5 / < 18.5) | 1.096 | 0.573–2.094 | 0.7823 | |||
| Alb | 63/14 | (≥ 3.5 / < 3.5) | 2.640 | 1.239–5.626 | 0.0119 | |||
| CRP | 52/25 | (< 0.5 / ≥ 0.5) | 1.242 | 0.665–2.321 | 0.4963 | |||
| GNRI | 36/41 | (≥ 97.1 / < 97.1) | 1.218 | 0.677–2.193 | 0.5109 | |||
| Tumor size | 54/139 | (< 3 / ≥ 3) | 1.431 | 0.512–4.000 | 0.4950 | |||
| Differentiation | 21/56 | (well / other) | 1.252 | 0.632–2.478 | 0.5191 | |||
| SCC | 47/30 | (< 1.5 / ≥ 1.5) | 0.806 | 0.441–1.473 | 0.4830 | |||
Relationship between the CSS and GNRI stratified by pTNM stage
The relationship between the CSS and GNRI in each patient group stratified by pTNM stage is shown in Figure 3. The 5-year CSS were significantly worse in patients with low GNRI than in those with normal GNRI, in both pTNM stage I (60.0% vs. 91.7%, p = 0.0044) and stage II (30.9% vs. 90.5%, p = 0.0036) groups. However, there was no significant difference in the 5-year CSS between patients with low and normal GNRIs (29.0% vs. 36.9%, p = 0.5099), respectively, in the pTNM stage III group. Similarly, patients with low GNRIs had a significantly worse OS than those with normal GNRIs (p < 0.001) in pTNM stage I (p < 0.0001) and stage II (p = 0.0020). In contrast, there was no significant association between GNRI and OS in patients with pTNM stage III (p = 0.1292) (Supplementary Figure 2A–2C).
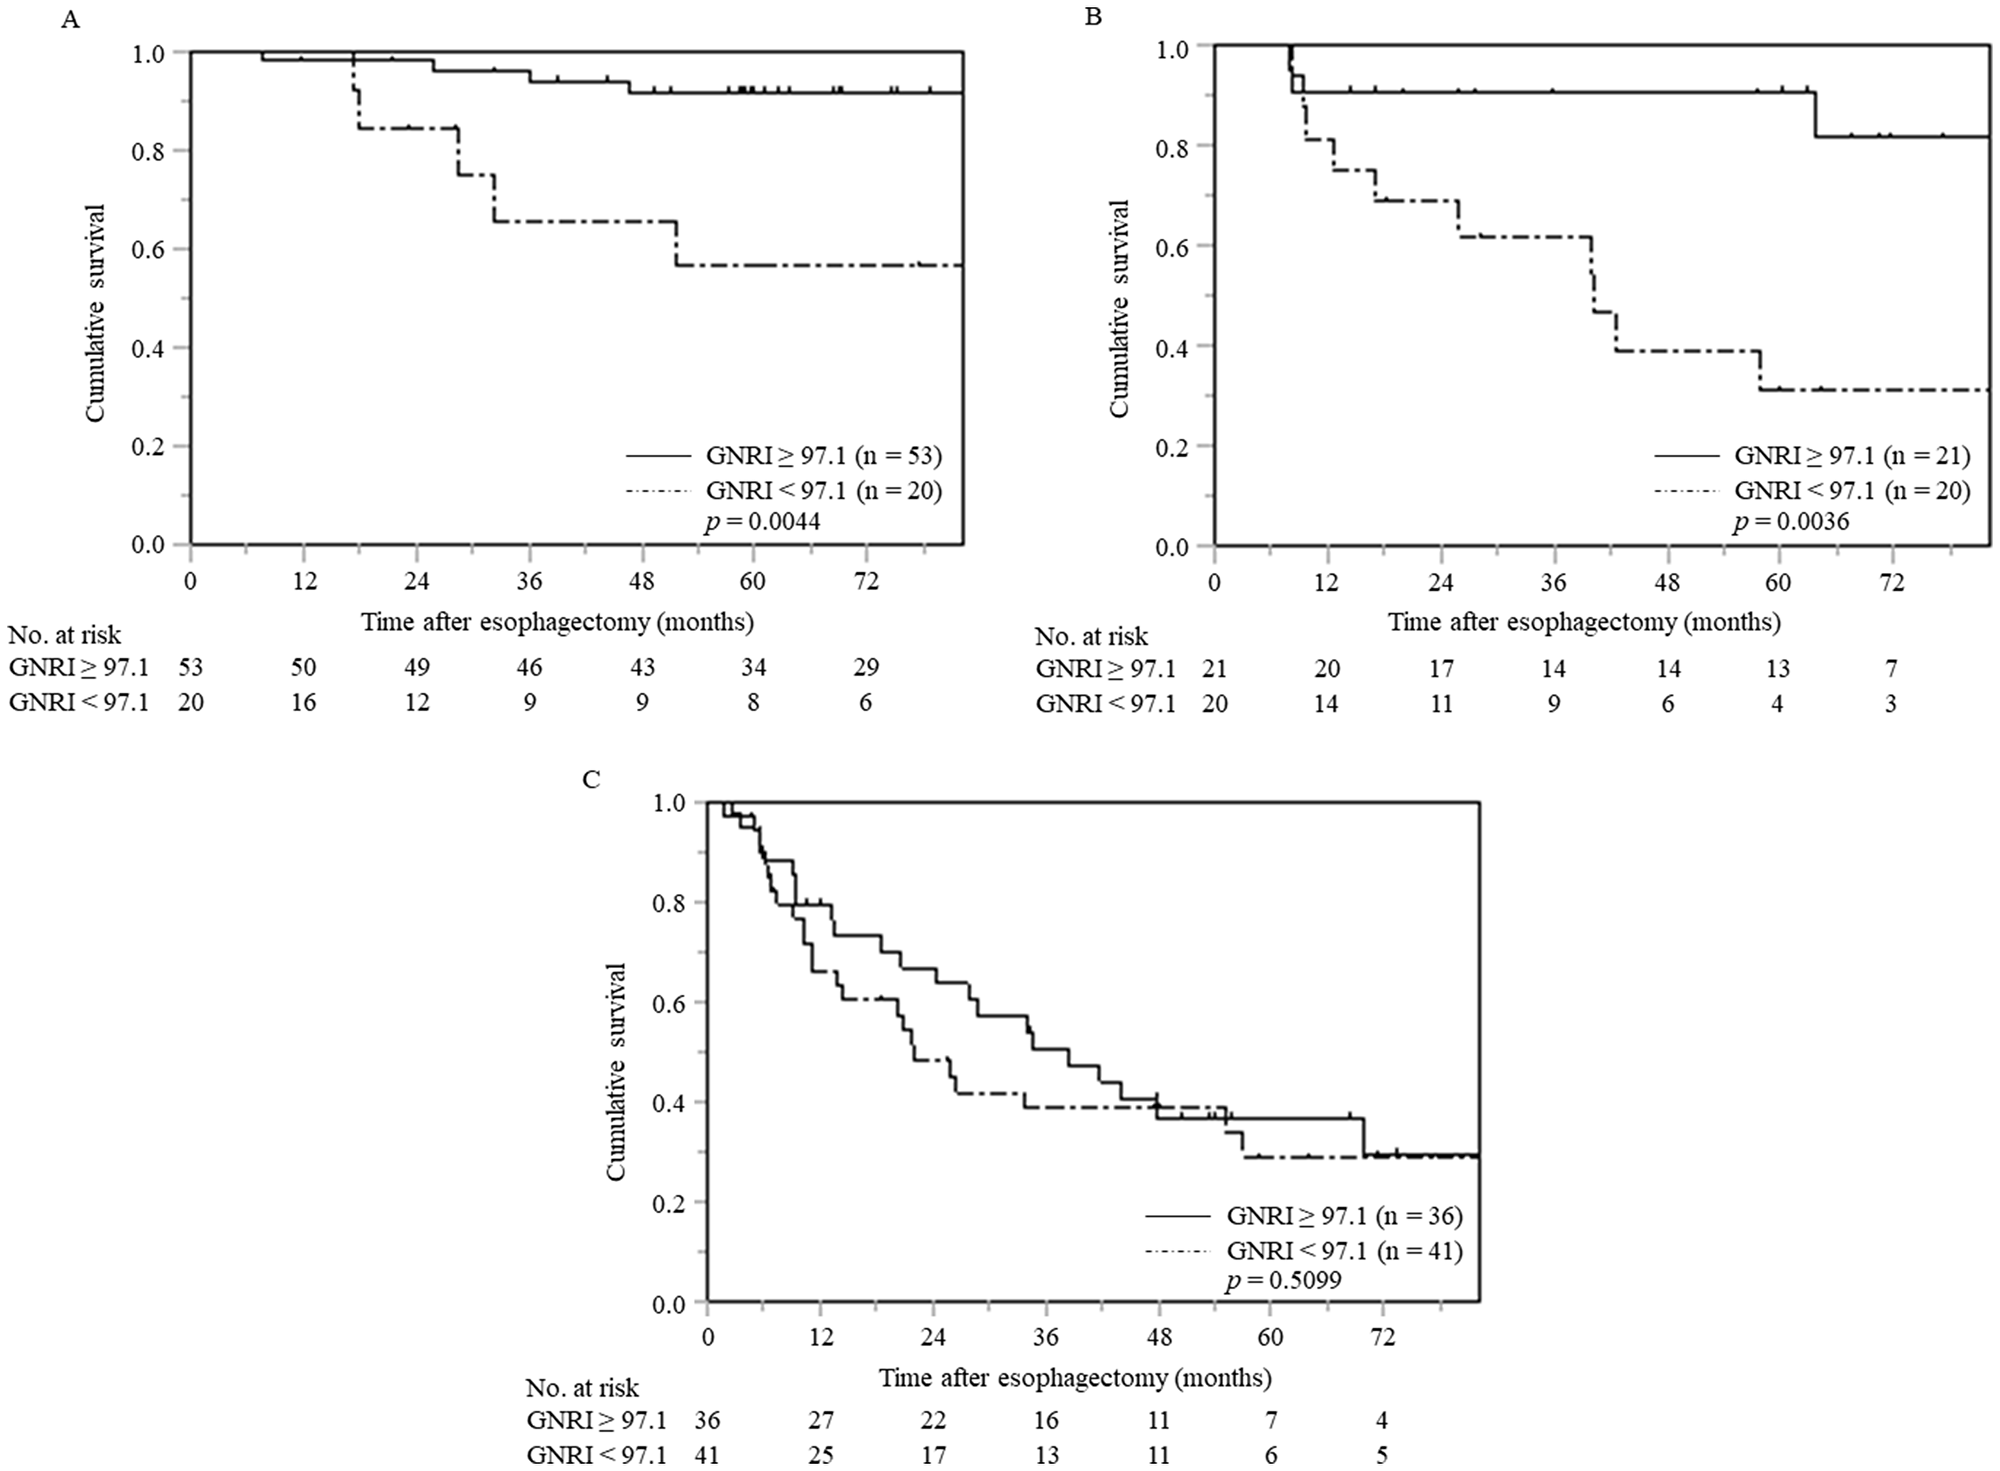
Figure 3: Cancer-specific survival curves in patients with ESCC at each pTNM stage stratified by preoperative GNRI (A) pTNM stage I (n = 73), (B) pTNM stage II (n = 41), (C) pTNM stage III (n = 77). Abbreviations: ESCC, esophageal squamous cell carcinoma; pTNM, pathological tumor-node-metastasis; GNRI, geriatric nutritional risk index.
DISCUSSION
Many studies have identified that the tumor- or nutrition-associated factors and host immunity strongly affect the prognoses in patients with cancer [13–15]. Thus, this study aimed to clarify the significance of the GNRI for predicting long-term postoperative outcomes in patients with ESCC. Survival analysis in 191 patients with ESCC who received a curative esophagectomy revealed that patients with low GNRIs had significantly worse CSS than those with normal preoperative GNRIs. Similarly, there were significant differences in OS (Supplementary Figure 1). Additionally, multivariate analysis identified GNRI as an independent risk factor for CSS. The results obtained in this study are consistent with those shown in previous reports related to lung and gastric cancers [10–12].
The TNM staging is useful for predicting the survival in patients with different stages of cancer, but a precise prediction is often difficult among those with the same stage of cancer. Therefore, additional indicators are needed to distinguish different prognoses in the same TNM stage [16]. In this study, we focused on stage-stratified survival analysis with special attention to the GNRI in patients with ESCC. Multivariate analysis identified the GNRI as an independent predictor of CSS in patients with pTNM stage I ESCC. In patients with pTNM stage II ESCC, when compared to the normal GNRI, a low GNRI was associated with a significantly worse CSS in univariate analysis; no significant differences were noted among patients with pTNM stage III ESCC. These findings suggested that malnutrition could lead to worse CSS, even in patients with pTNM stage I and II ESCC after undergoing curative esophagectomy. The basic mechanism underlying the association between low GNRI and worse prognosis is unclear. From a nutritional perspective, patients with cancer tend to be malnourished and usually show a diminished anabolic response to nutritional repletion. Additionally, albumin synthesis may be suppressed even in patients with early stage cancers [17]. However, tumor-related factors may have a stronger impact than nutrition-related ones, on the prognoses in patients with advanced stages of cancer [18, 19]. The above-mentioned facts may explain why GNRI had no significant association with CSS in patients with pTNM stage III ESCC in our study. With tumor progression, tumor-related factors, such as invasion and migration, may gradually play a more prominent role in patient survival, when compared to nutrition-related factors [20–22].
Yamana et al. were the first to demonstrate that GNRIs can be a reliable predictor of OS in esophageal cancer patients and to report the clinical significance of GNRIs by preoperative treatment modality [23]. Subsequently, Migita et al. suggested that low preoperative GNRI was associated with a higher risk of cancer death in patients who underwent curative esophagectomy for esophageal cancer [24]. Wang also reported that GNRI was a predictive marker of OS and progression-free survival (PFS) in patients aged 70 years and older who have received radiation therapy or definitive concurrent chemoradiotherapy [25]. To the best of our knowledge, our study is the first report demonstrating that preoperative GNRI is an independent prognostic factor in patients with pTNM stage I ESCC and a significant prognostic marker in patients with pTNM stage II. Our results suggested that preoperative GNRI could be a useful marker to identify patients at high-risk for ESCC and that patients with pTNM stage I and II ESCC who have low GNRIs may require more careful follow-up even after undergoing curative esophagectomy.
Our study shows some limitations in confirming our findings. First, the present study cannot unambiguously determine the prognostic role of GNRI in ESCC patients because of its retrospective nature and small sample size. Second, nutritional and inflammatory assessments by parameters other than the GNRI were not conducted. Third, the GNRI was used as the only nutritional screening tool, and its utility was not compared with those of other common assessment tools, such as the assessment of prealbumin, sarcopenia, or the Glasgow prognostic scores (GPS). To overcome these limitations, further studies with a prospective nature and a more comprehensive design are warranted.
The survival outcomes in patients with ESCC after undergoing curative resection, even in those with earlier stages of ESCC, are insufficient when compared to those in patients with other malignancies [26]. The benefit of neoadjuvant and postoperative adjuvant chemotherapies for patients with pathological stage II or III ESCC has been established in Japan; the long-term outcomes are still unsatisfactory [27, 28]. More effective personalized treatment strategies for patients with ESCC should be established.
In conclusion, preoperative GNRI can be used to sort patients into groups at high- or low-risk for shorter CSS after undergoing curative resection for ESCC, especially those with pTNM stage I and II ESCC; the interpretation should be done with care due to the differences in clinical background. Therefore, multicenter prospective validation of our findings is considered necessary to confirm the usefulness of GNRI as clinical therapeutic stratification marker for patients requiring more aggressive multimodality treatment or stringing surveillance.
Materials and Methods
Patients
We retrospectively analyzed the prognostic significance of the GNRI in a total of 191 patients with ESCC who underwent curative esophagectomies, between January 2006 and October 2017, in our institute. All patients underwent thoracoscopic subtotal esophagectomies with three-field lymph node dissections, with elevation of the gastric conduit to the neck via the posterior mediastinal approach or the retrosternal approach with anastomosis of the cervical esophagus and the gastric conduit. Postoperative adjuvant and post-recurrence chemotherapy were administered according to the guidelines edited by the Japan Esophageal Society [29, 30]. According to the guidelines, preoperative chemotherapy is recommended as grade B. However, the patients who did not wish to undergo preoperative chemotherapy were preceded by surgical therapy because the current preoperative chemotherapy with 5FU and CDDP did not provide a prognostic benefit in Stage III patients. The inclusion criteria were specified as follows: 1) histologically confirmed ESCC; 2) no preoperative anticancer treatment; 3) no history of cancer or co-existence of another synchronous cancer; and 4) complete removal of ESCC without any microscopic resection margin involvement. A perioperative multidisciplinary management team including surgeons, dental hygienists, pharmacists, and nutritionists was formed to provide preoperative enteral nutrition to optimize the preoperative condition as much as possible, which aimed to reduce the incidence of postoperative complications. A blood sample used for the analysis was collected from each patient within one week before the surgery.
The study was approved by the Ethical Review Board of Shimane University Faculty of Medicine (Shimane, Japan). The requirement for informed consent was waived because of the retrospective nature of this cohort study.
Surveillance
Postoperative follow-up evaluations were performed every 3 months for the first 2 years after the surgery, and every 6 months from the 2nd to 5th year after surgery, or until the patient died. We calculated the CSS as the date from primary esophagectomy to death due to cancer-specific causes.
The GNRI
The GNRI comprised two nutritional indicators: serum albumin levels and measured body weight compared with ideal body weight. The formula of GNRI was as follows: GNRI = [1.487 × serum albumin (g/L)] + [41.7 × measured/ideal body weight (BW) (kg)]. Ideal BW (kg) = 22 × square of height (m2) [2]. The ratio of measured BW to ideal BW was set to 1 when the measured BW of the patient exceeded the ideal BW. The ability of the GNRI to predict the CSS was assessed using a receiver operating characteristic (ROC) curve analysis, wherein the most discriminative cutoff value of GNRI was set at 97.1 with an area under curve (AUC) value of 0.608 (sensitivity, 66.9%; specificity, 58.2%) in this study (Figure 4). Patients were classified into two groups based on the cutoff value of GNRI as follows: the normal GNRI (GNRI ≥ 97.1) and low GNRI (GNRI < 97.1) groups.
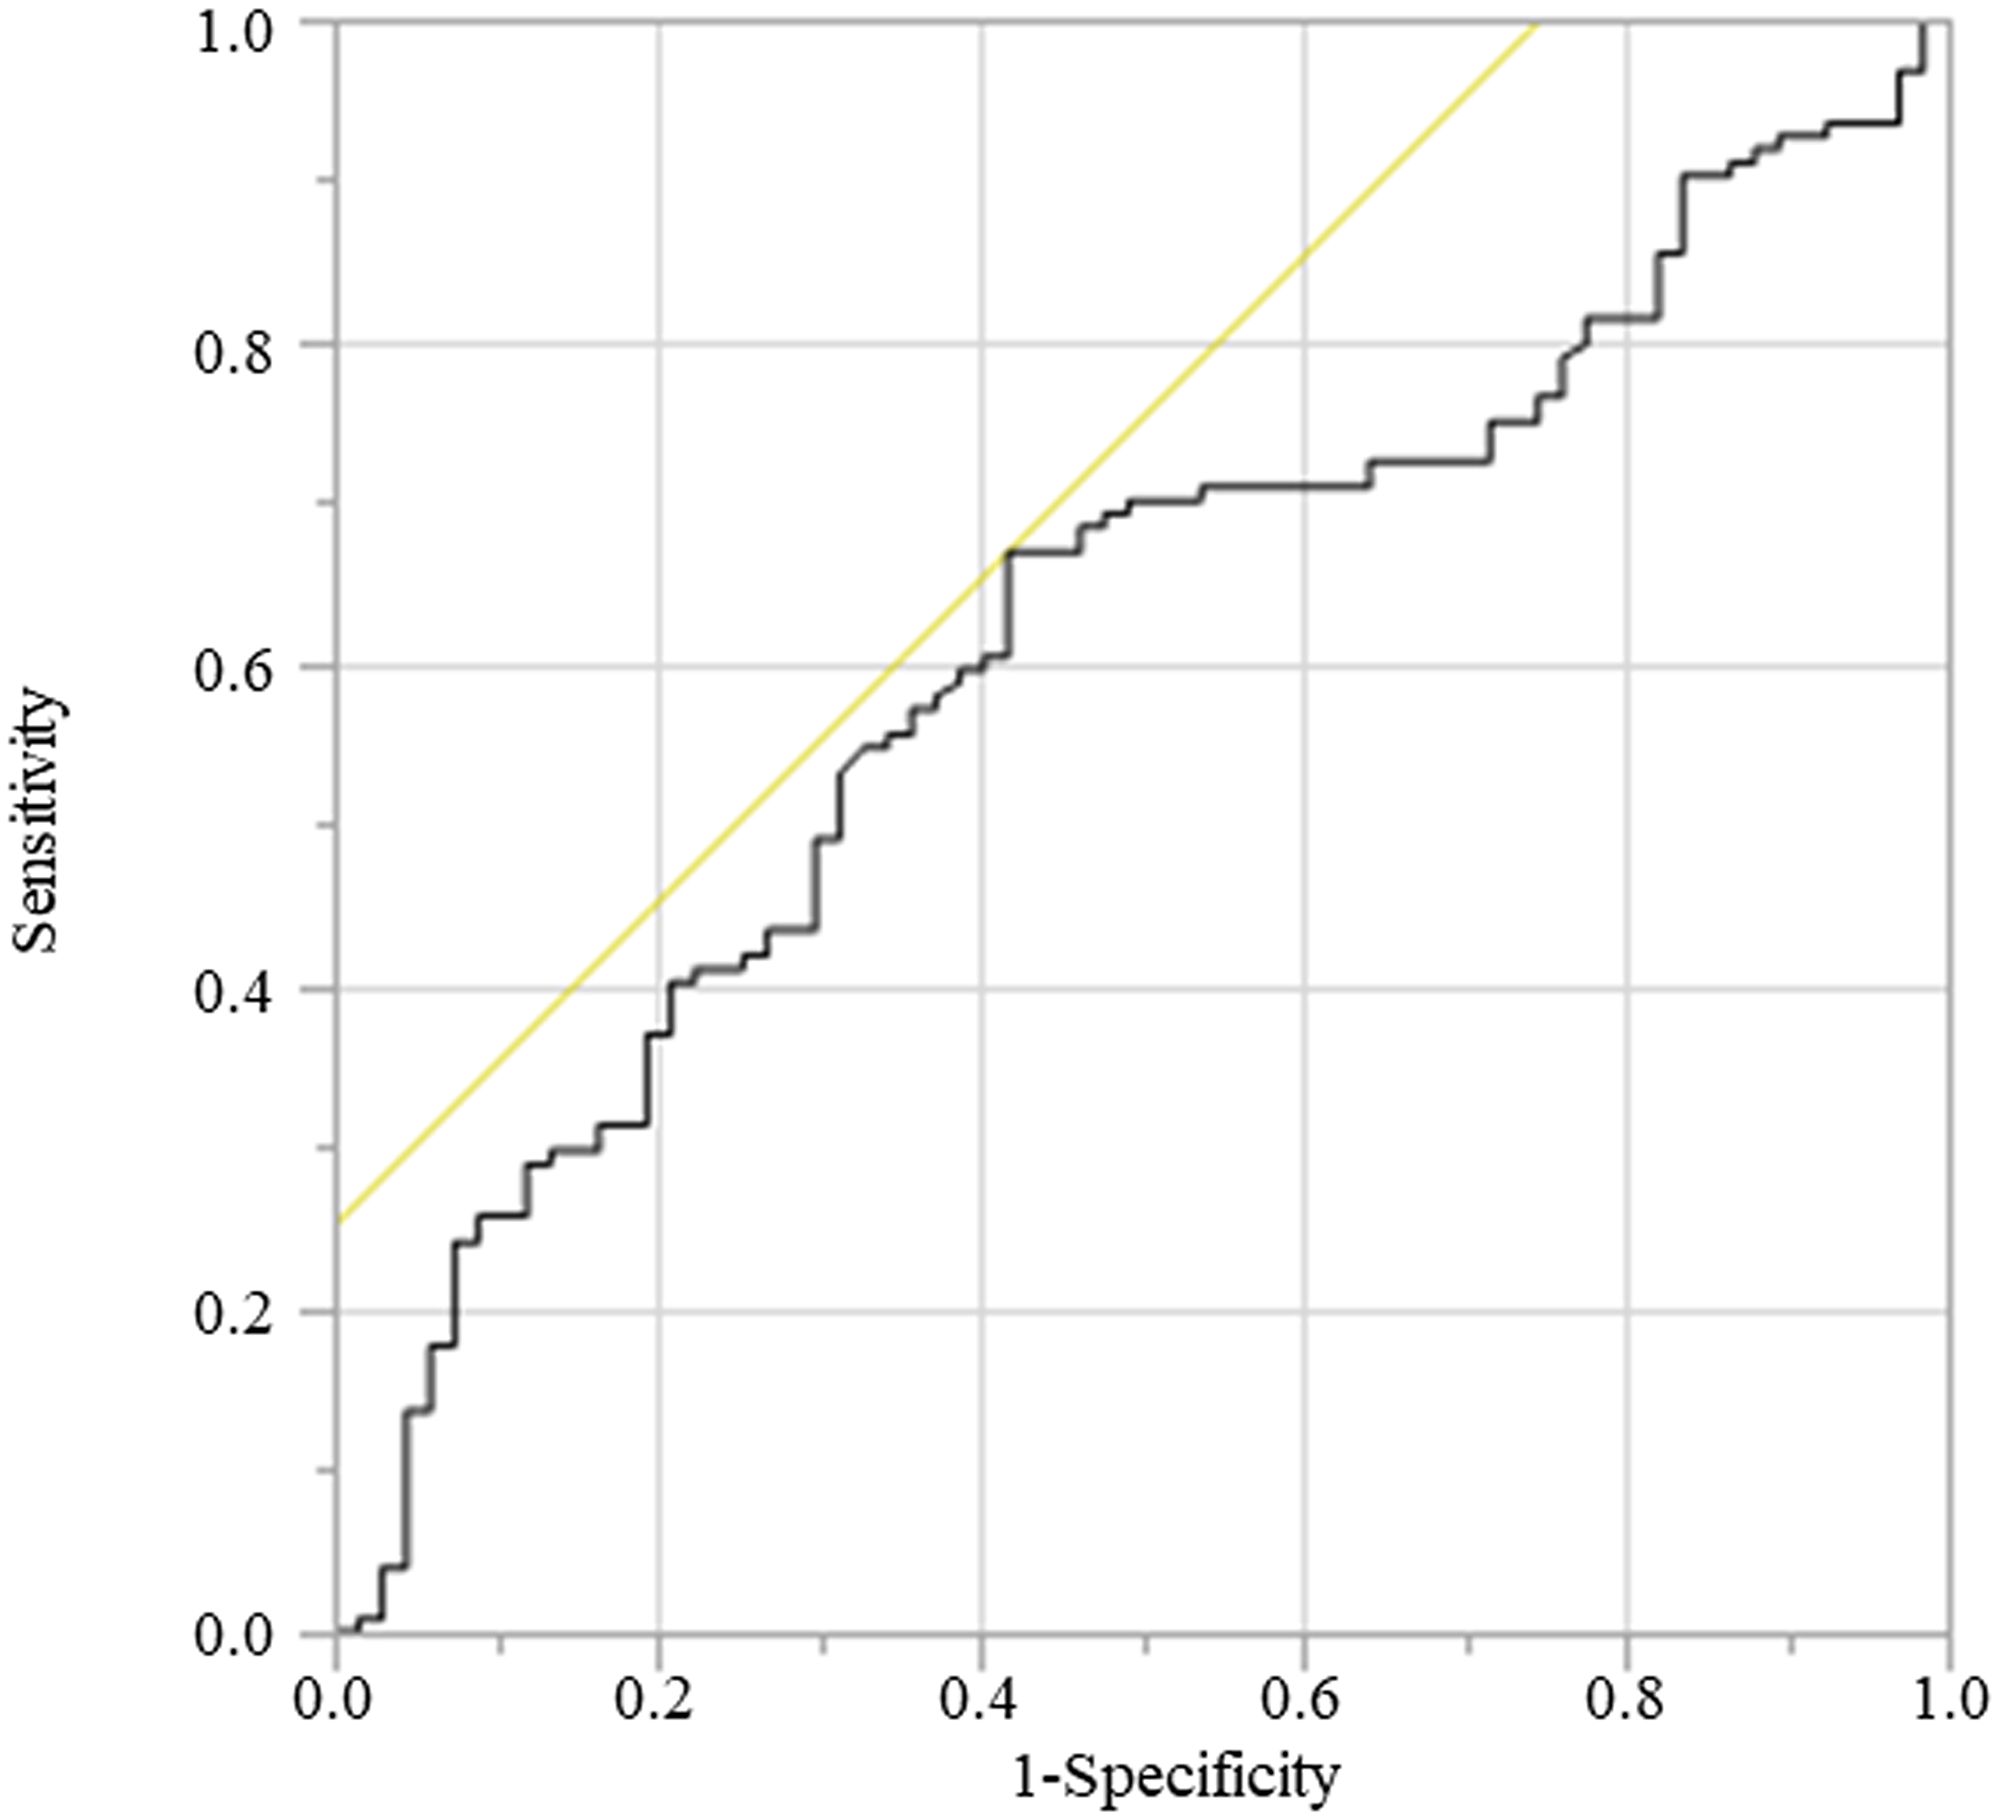
Figure 4: ROC for cancer death was plotted to verify the optimum cutoff of GNRI. Abbreviation: ROC, receiver operating characteristic.
Statistical analysis
The differences between the study groups were evaluated using the Chi-square test or Student’s t-test for categorical variables. The Kruskal–Wallis analysis was performed for non-normally distributed continuous variables among the three groups. The CSS was calculated using the Kaplan–Meier method, and the difference between the survival curves was assessed using the log-rank test.
Variables with p < 0.05 in the univariate analysis were subjected to multivariate logistic regression analysis using Cox proportional hazards model. All statistical analyses were performed using the JMP software (version 14 for Windows; SAS Institute), and statistical significance was set to p < 0.05.
Abbreviations
AUC: area under curve; BMI: Body Mass Index; CI: Confidence Interval; CRP: C-reactive protein; CSS: Cancer-specific survival; ESCC: Esophageal squamous cell carcinoma; GNRI: geriatric nutritional risk index; GPS: Glasgow prognostic score; HR: Hazard Ratio; OS: overall survival; pTNM: pathological tumor-node-metastasis; ROC: receiver operating characteristic; SCC: squamous cell carcinoma; WBC: white blood cell.
CONFLICTS OF INTEREST
Authors have no conflicts of interest to declare.
FUNDING
This study received no external sources of findings.
References
1. Meyer F, Valentini L. Disease-Related Malnutrition and Sarcopenia as Determinants of Clinical Outcome. Visc Med. 2019; 35:282–291. https://doi.org/10.1159/000502867. [PubMed].
2. Bouillanne O, Morineau G, Dupont C, Coulombel I, Vincent JP, Nicolis I, Benazeth S, Cynober L, Aussel C. Geriatric Nutritional Risk Index: a new index for evaluating at-risk elderly medical patients. Am J Clin Nutr. 2005; 82:777–783. https://doi.org/10.1093/ajcn/82.4.777. [PubMed].
3. Ozorio GA, Barão K, Forones NM. Cachexia Stage, Patient-Generated Subjective Global Assessment, Phase Angle, and Handgrip Strength in Patients with Gastrointestinal Cancer. Nutr Cancer. 2017; 69:772–779. https://doi.org/10.1080/01635581.2017.1321130. [PubMed].
4. Slee A, Birch D, Stokoe D. The relationship between malnutrition risk and clinical outcomes in a cohort of frail older hospital patients. Clin Nutr ESPEN. 2016; 15:57–62. https://doi.org/10.1016/j.clnesp.2016.06.002. [PubMed].
5. Gradel KO, Póvoa P, Garvik OS, Vinholt PJ, Nielsen SL, Jensen TG, Chen M, Dessau RB, Møller JK, Coia JE, Ljungdalh PS, Lassen AT, Frederiksen H. Longitudinal trajectory patterns of plasma albumin and C-reactive protein levels around diagnosis, relapse, bacteraemia, and death of acute myeloid leukaemia patients. BMC Cancer. 2020; 20:249. https://doi.org/10.1186/s12885-020-06754-z. [PubMed].
6. Ye J, Liao B, Jiang X, Dong Z, Hu S, Liu Y, Xiao M. Prognosis Value of Platelet Counts, Albumin and Neutrophil-Lymphocyte Ratio of Locoregional Recurrence in Patients with Operable Head and Neck Squamous Cell Carcinoma. Cancer Manag Res. 2020; 12:731–741. https://doi.org/10.2147/CMAR.S234618. [PubMed].
7. Zheng RR, Huang M, Jin C, Wang HC, Yu JT, Zeng LC, Zheng FY, Lin F. Cervical cancer systemic inflammation score: a novel predictor of prognosis. Oncotarget. 2016; 7:15230–15242. https://doi.org/10.18632/oncotarget.7378. [PubMed].
8. Bao X, Liu F, Lin J, Chen Q, Chen L, Chen F, Wang J, Qiu Y, Shi B, Pan L, Lin L, He B. Nutritional assessment and prognosis of oral cancer patients: a large-scale prospective study. BMC Cancer. 2020; 20:146. https://doi.org/10.1186/s12885-020-6604-2. [PubMed].
9. Minami S, Ihara S, Nishimatsu K, Komuta K. Low Body Mass Index Is an Independent Prognostic Factor in Patients With Non-Small Cell Lung Cancer Treated With Epidermal Growth Factor Receptor Tyrosine Kinase Inhibitor. World J Oncol. 2019; 10:187–198. https://doi.org/10.14740/wjon1244. [PubMed].
10. Shoji F, Matsubara T, Kozuma Y, Haratake N, Akamine T, Takamori S, Katsura M, Toyokawa G, Okamoto T, Maehara Y. Relationship Between Preoperative Sarcopenia Status and Immuno-nutritional Parameters in Patients with Early-stage Non-small Cell Lung Cancer. Anticancer Res. 2017; 37:6997–7003. https://doi.org/10.21873/anticanres.12168. [PubMed].
11. Kim YN, Choi YY, An JY, Choi MG, Lee JH, Sohn TS, Bae JM, Noh SH, Kim S. Comparison of Postoperative Nutritional Status after Distal Gastrectomy for Gastric Cancer Using Three Reconstructive Methods: a Multicenter Study of over 1300 Patients. J Gastrointest Surg. 2019. https://doi.org/10.1007/s11605-019-04301-1. [PubMed].
12. Hirahara N, Tajima Y, Fujii Y, Kaji S, Kawabata Y, Hyakudomi R, Yamamoto T, Taniura T. Prediction of postoperative complications and survival after laparoscopic gastrectomy using preoperative Geriatric Nutritional Risk Index in elderly gastric cancer patients. Surg Endosc. 2020. https://doi.org/10.1007/s00464-020-07487-7. [PubMed].
13. Xue W, Xu X, Tan Y, Wang Y, Wang H, Xu Y, Xi C, Jiang P, Ding W. Evaluation and validation of the prognostic value of nutrition and immunity parameters in gastric cancer after R0 resection. Medicine (Baltimore). 2020; 99:e19270. https://doi.org/10.1097/MD.0000000000019270. [PubMed].
14. Elghiaty A, Kim J, Jang WS, Park JS, Heo JE, Rha KH, Choi YD, Ham WS. Preoperative controlling nutritional status (CONUT) score as a novel immune-nutritional predictor of survival in non-metastatic clear cell renal cell carcinoma of ≤ 7 cm on preoperative imaging. J Cancer Res Clin Oncol. 2019; 145:957–965. https://doi.org/10.1007/s00432-019-02846-x. [PubMed].
15. Hamza N, Darwish A, O’Reilly DA, Denton J, Sheen AJ, Chang D, Sherlock DJ, Ammori BJ. Perioperative Enteral Immunonutrition Modulates Systemic and Mucosal Immunity and the Inflammatory Response in Patients With Periampullary Cancer Scheduled for Pancreatico-duodenectomy: A Randomized Clinical Trial. Pancreas. 2015; 44:41–52. https://doi.org/10.1097/MPA.0000000000000222. [PubMed].
16. Sobin L, Gospodarowicz M, Wittekind C, eds. International Union against Cancer (UICC). TNM classification of malignant tumors, 7th ed. New York: Wiley-Blackwell; 2010.
17. Gupta D, Lis CG. Pretreatment serum albumin as a predictor of cancer survival: a systematic review of the epidemiological literature. Nutr J. 2010; 9:69. https://doi.org/10.1186/1475-2891-9-69. [PubMed].
18. Cui L, Xu F, Wang M, Li L, Qiao T, Cui H, Li Z, Sun C. Dietary natural astaxanthin at an early stage inhibits N-nitrosomethylbenzylamine-induced esophageal cancer oxidative stress and inflammation via downregulation of NFκB and COX2 in F344 rats. Onco Targets Ther. 2019; 12:5087–5096. https://doi.org/10.2147/OTT.S197044. [PubMed].
19. Shirdel M, Andersson F, Myte R, Axelsson J, Rutegård M, Blomqvist L, Riklund K, van Guelpen B, Palmqvist R, Gylling B. Body composition measured by computed tomography is associated with colorectal cancer survival, also in early-stage disease. Acta Oncol. 2020; 31:1–10. https://doi.org/10.1080/0284186X.2020.1744716. [PubMed].
20. Imano M, Okuno K, Itoh T, Ishimaru E, Satou T, Shiozaki H. Increased osteopontin-positive macrophage expression in colorectal cancer stroma with synchronous liver metastasis. World J Surg. 2010; 34:1930–1936. https://doi.org/10.1007/s00268-010-0582-5. [PubMed].
21. Okada S, Yamazaki S, Kaiga T, Funada T, Kochi M, Takayama T. Impact of nutritional status in the era of FOLFOX/FIRI-based chemotherapy. World J Surg Oncol. 2017; 15:162. https://doi.org/10.1186/s12957-017-1226-0. [PubMed].
22. Ye J, Wang W, Xin L, Owen S, Xu L, Duan X, Cheng Y, Zhang H, Zhang S, Li T, Liu Y. The Clinicopathological Factors Associated with Disease Progression in Luminal A Breast Cancer and Characteristics of Metastasis: A Retrospective Study from A Single Center in China. Anticancer Res. 2017; 37:4549–4556. https://doi.org/10.21873/anticanres.11852. [PubMed].
23. Yamana I, Takeno S, Shimaoka H, Yamashita K, Yamada T, Shiwaku H, Hashimoto T, Yamashita Y, Hasegawa S. Geriatric Nutritional Risk Index as a prognostic factor in patients with esophageal squamous cell carcinoma -retrospective cohort study. Int J Surg. 2018; 56:44–48. https://doi.org/10.1016/j.ijsu.2018.03.052. [PubMed].
24. Migita K, Matsumoto S, Wakatsuki K, Ito M, Kunishige T, Nakade H, Sho M. The Prognostic Significance of the Geriatric Nutritional Risk Index in Patients with Esophageal Squamous Cell Carcinoma. Nutr Cancer. 2018; 70:1237–1245. https://doi.org/10.1080/01635581.2018.1512640. [PubMed].
25. Wang Y, Wang L, Fang M, Li J, Song T, Zhan W, Xu H. Prognostic Value of the Geriatric Nutritional Risk Index in Patients Exceeding 70 Years Old with Esophageal Squamous Cell Carcinoma. Nutr Cancer. 2020; 72:620–626. https://doi.org/10.1080/01635581.2019.1650189. [PubMed].
26. Motoyama S, Maeda E, Yano M, Yasuda T, Ohira M, Doki Y, Toh Y, Higashi T, Matsubara H, and Japan Esophageal Society. Appropriateness of the institute certification system for esophageal surgeries by the Japan Esophageal Society: evaluation of survival outcomes using data from the National Database of Hospital-Based Cancer Registries in Japan. Esophagus. 2019; 16:114–121. https://doi.org/10.1007/s10388-018-0646-4. [PubMed].
27. Kitagawa Y, Uno T, Oyama T, Kato K, Kato H, Kawakubo H, Kawamura O, Kusano M, Kuwano H, Takeuchi H, Toh Y, Doki Y, Naomoto Y, et al. Esophageal cancer practice guidelines 2017 edited by the Japan Esophageal Society: part 1. Esophagus. 2019; 16:1–24. https://doi.org/10.1007/s10388-018-0641-9. [PubMed].
28. Kitagawa Y, Uno T, Oyama T, Kato K, Kato H, Kawakubo H, Kawamura O, Kusano M, Kuwano H, Takeuchi H, Toh Y, Doki Y, Naomoto Y, et al. Esophageal cancer practice guidelines 2017 edited by the Japan esophageal society: part 2. Esophagus. 2019; 16:25–43. https://doi.org/10.1007/s10388-018-0642-8. [PubMed].
29. Kuwano H, Nishimura Y, Ohtsu A, Kato H, Kitagawa Y, Tamai S, Toh Y, Matsubara H. Guidelines for diagnosis and treatment of carcinoma of the esophagus April 2007 edition: part II edited by the Japan Esophageal Society. Esophagus. 2008; 5:117–132. https://doi.org/10.1007/s10388-008-0158-8.
30. Kuwano H, Nishimura Y, Oyama T, Kato H, Kitagawa Y, Kusano M, Shimada H, Takiuchi H, Toh Y, Doki Y, Naomoto Y, Matsubara H, Miyazaki T, et al. Guidelines for diagnosis and treatment of carcinoma of the esophagus April 2012 edited by the Japan Esophageal Society. Esophagus. 2015; 12:1–30. https://doi.org/10.1007/s10388-014-0465-1. [PubMed].