
Introduction
Melanoma is a cancer derived from melanocytes, the pigment-producing cells of epidermis and hair follicles. It is trending upward in incidence and mortality worldwide, and has no effective treatment post metastasis [1–3]. This complex disease is driven by both genetic and epigenetic factors, and many studies have focused on gaining a more thorough understanding of the molecular mechanisms involved in disease progression [4]. Gene expression profiling of primary [5–8] or metastatic tumor specimens, as well as cell lines [6, 9–12], have identified disease markers and gene signatures for different stages of melanoma.
High-density lipoprotein (HDL), a physiological plasma molecule long known for its atheroprotective properties [13, 14], was linked to cancer in a large meta-analysis of randomized controlled trials of lipid-altering therapies that suggested an inverse relationship between plasma HDL cholesterol (HDL-c) levels and incident development of cancer [15]. Previously, we reported a potent anti-tumorigenic activity for apolipoprotein A-I (apoA-I), the major protein component of HDL, against human melanoma A375 and the highly aggressive and metastatic mouse melanoma B16F10L [16]. Accordingly, growth of syngeneic B16F10L tumor cells was severely restricted in animals expressing human apoA-I (A-ITg+/–; high plasma HDL-c levels) relative to apoA-I null mice (A-I KO; low plasma HDL-c levels). Importantly, apoA-I therapy curbed further growth of established tumors in A-I KO and induced tumor regression, thus preventing metastases and prolonging survival [16]. Tumor inhibition by apoA-I was also observed with human melanoma A375 in nude mice. We proposed an immunomodulatory role for apoA-I in melanoma with both innate and adaptive arms of immunity mediating its anti-tumor activity [16].
Cancer cells have different metabolic requirements from normal quiescent cells, given the propensity of malignant cells to proliferate at a high rate and avoid apoptotic death signals. To fulfill these priorities, cancer cells hijack normal metabolic and signaling pathways and redirect them to meet their increased need for biomolecules to synthesize proteins, lipids, and nucleic acids [17–22]. Altered cellular metabolism is now widely considered a hallmark of cancer, and interventions to disrupt cancer metabolism are fast emerging as viable therapeutic approaches in conjunction with conventional death-inducing chemotherapies [23–27]. Statins, a family of lipid-lowering drugs that target 3-hydroxy-3-methyl-glutaryl-co-enzyme A reductase (HMG-CoA reductase), the rate-limiting enzyme at the core of the mevalonate biochemical pathway, have been a focal point of research in the cancer field because their action leads to reduced cholesterol and other key metabolic end products such as activated (prenylated) small GTPases with oncogenic activity [24, 28–31]. Statins have been associated with reduced mortality from several cancers including prostate, kidney, colorectal, breast, and lung cancer [32–39]. Meta-analyses have also suggested a positive correlation between statin use and reduced incidence of melanoma [30].
Herein, we used differential gene expression analysis of primary B16F10L melanoma homografts to investigate the role of host apoA-I in the tumor microenvironment, and identified the mevalonate and de novo serine synthesis metabolic pathways as potential targets of apoA-I anti-tumor activity.
Results
Whole-genome expression profiling and hierarchical clustering discriminate apoA-I-null-mouse-derived tumors from less aggressive tumors in apoA-I-expressing mice
To gain insight into molecular mechanisms and biological pathways underlying apoA-I tumor suppressive activity, we performed whole-genome expression profiling of B16F10L homografts from A-I Tg+/–, A-I KO, and WT mice by DNA microarray technology (a total of 24,613 probes corresponding to 17,877 mouse genes were interrogated). Previously, we reported a significant difference in tumor-associated angiogenesis between A-I KO and A-I Tg+/– seven days post tumor inoculation [16]. We therefore chose day 7 as a time point for transcriptomic analyses because adequate tumor mass could be harvested at this early time point. We compared 11 distinct primary tumors per genotype to compensate for variability when analyzing a heterogeneous population of cells, namely tumor and host tumor-infiltrating cells. The dendogram in Figure 1 illustrates the correlation analysis of log2 normalized gene expression levels where distance (y-axis) between clusters denotes divergence in the global gene expression pattern. While expression profiles of tumors from all three groups were generally similar, as reflected by the close distance between the clusters, for the most part the more aggressive A-I KO tumors clustered in a group distinct from the less aggressive tumors found in apoA-I-expressing animals (WT and A-I Tg+/–). Two of the eleven tumor gene signatures recovered from A-I KO animals, A-I KO 3 & 11, were exceptions in that they clustered within the A-I Tg+/– and WT groups. One of the WT gene signatures recovered (WT 360) was an outlier in a cluster furthest in distance from all other tumors (Figure 1).
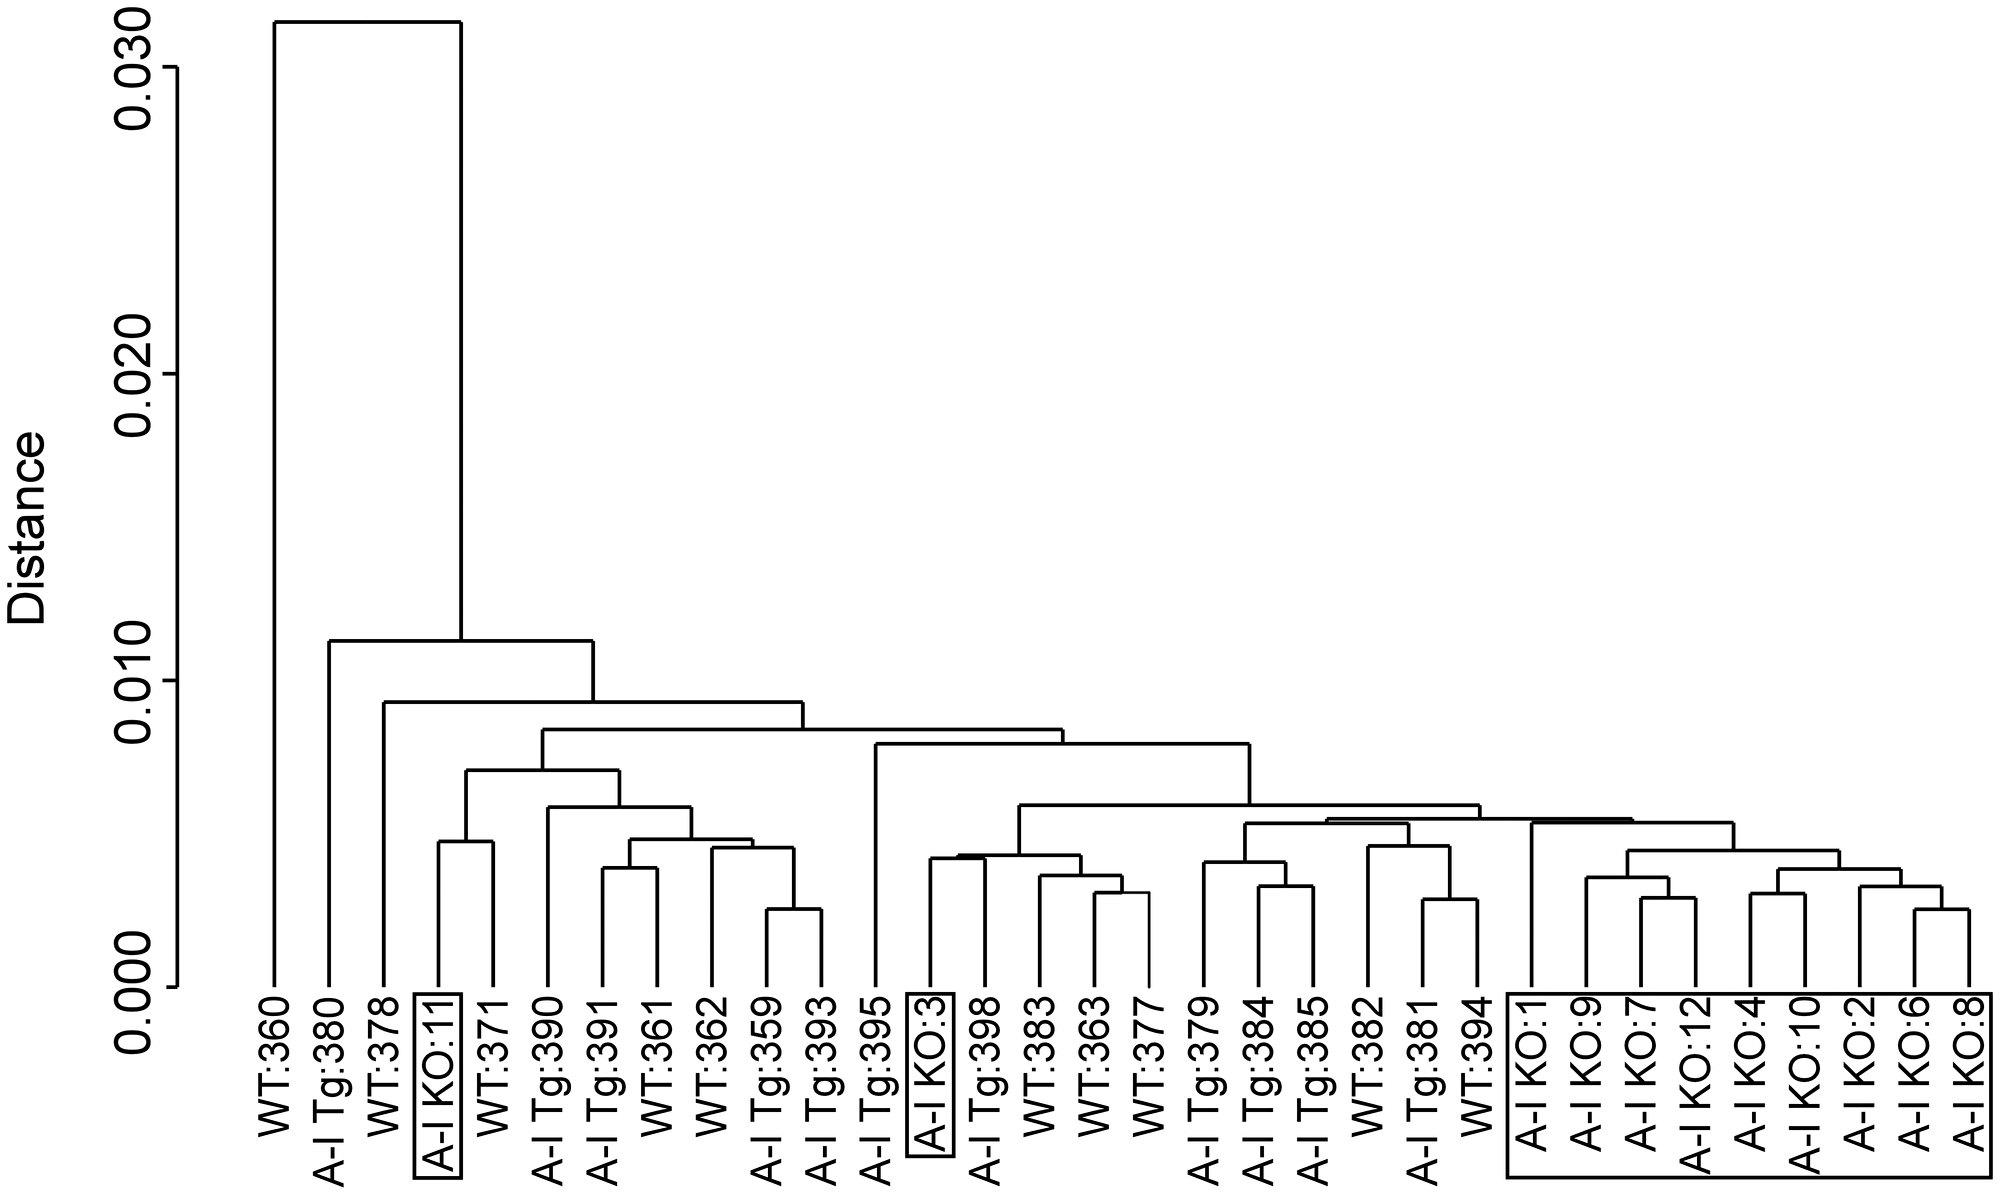
Figure 1: Dendogram of unsupervised hierarchical clustering analysis of tumor gene expression (log2 normalized) profiles discriminate A-I KO-derived tumors from less aggressive tumors of apoA-I-expressing mice (A-I Tg+/– and WT). B16F10L melanoma homograft grown in C57BL/6 mice wild type for mouse apoA-I (WT), deficient (A-I KO) or expressing human apoA-I (A-I Tg+/–) were resected 7 days after inoculation and processed for RNA isolation and microarray analysis as described in Methods.
Key biological pathways are dysregulated in B16F10L tumors from apoA-I null mice (A-I KO)
The expression array datasets between the tumor groups were analyzed (see Methods) to identify a cohort of genes that were differentially expressed. Volcano plots illustrating both statistical (y-axis, -log10 (p-value) and biological (x-axis, log2 (fold-change, FC)) significance of the differential expression analyses of A-I Tg+/– versus A-I KO or WT versus A-I KO are shown in Figure 2A. We restricted our genes to those with at least 1.2-fold differential expression and a false discovery rate (FDR)-adjusted p-value < 0.05. Use of this screening criteria resulted in 71 and 325 upregulated, and 105 and 177 downregulated transcript probes comparing A-I Tg+/– or WT versus A-I KO, respectively (Figure 2B). The heat map in Figure 2C illustrates the probes from differential expression analysis of A-I Tg+/– versus A-I KO with the expression in WT, serving as reference, to the right. Importantly, the overall gene expression pattern in WT group was approximately mid-way between A-I Tg+/– and A-I KO, supporting the tumor growth phenotype previously observed for this genotype relative to A-I KO and A-I Tg+/– (Figure 1 in [16]). The transcripts representing 68 (71 probes) up- and 91 (105 probes) downregulated genes are listed in Supplementary Tables 1 and 2, respectively. Tables 1A and 1B represent the top genes up- or downregulated in tumors from A-I Tg+/– versus A-I KO, respectively. Notably, Phgdh, the gene encoding phosphoglycerate dehydrogenase, PHGDH, was the most repressed transcript in tumors from apoA-I-expressing hosts (Table 1B). PHGDH is the first enzyme of the 3-step de novo serine synthesis pathway (Figure 3), which diverts glucose-derived carbon for synthesis of biomolecules necessary for rapid proliferation and survival. In this pathway, PHGDH oxidizes the glycolytic intermediate 3-phosphoglycerate (3PG) to 3-phospho-hydroxypyruvate (P-PYR) and couples to NADH production. Subsequently, P-PYR is transaminated by phosphoserine aminotransferase (PSAT1) with glutamate (Glu) serving as a nitrogen donor to form phosphoserine (P-Serine) and alpha-ketoglutarate (aKG), a key intermediate of the TCA cycle. P-Serine is dephosphorylated by phosphoserine phosphatase (PSPH) to form serine, which is essential for synthesis of glycine, proteins, lipids, and nucleic acids (Figure 3). Serine is also a major source of one-carbon units directed to the folate pool, which supports proliferation and transformation. The transcript for phosphoserine aminotransferase 1 (Psat1), the second enzyme of the de novo serine synthesis pathway, was similarly downregulated (Figure 3), however, the FDR-adjusted p-value (0.104) did not meet significance (p < 0.05).
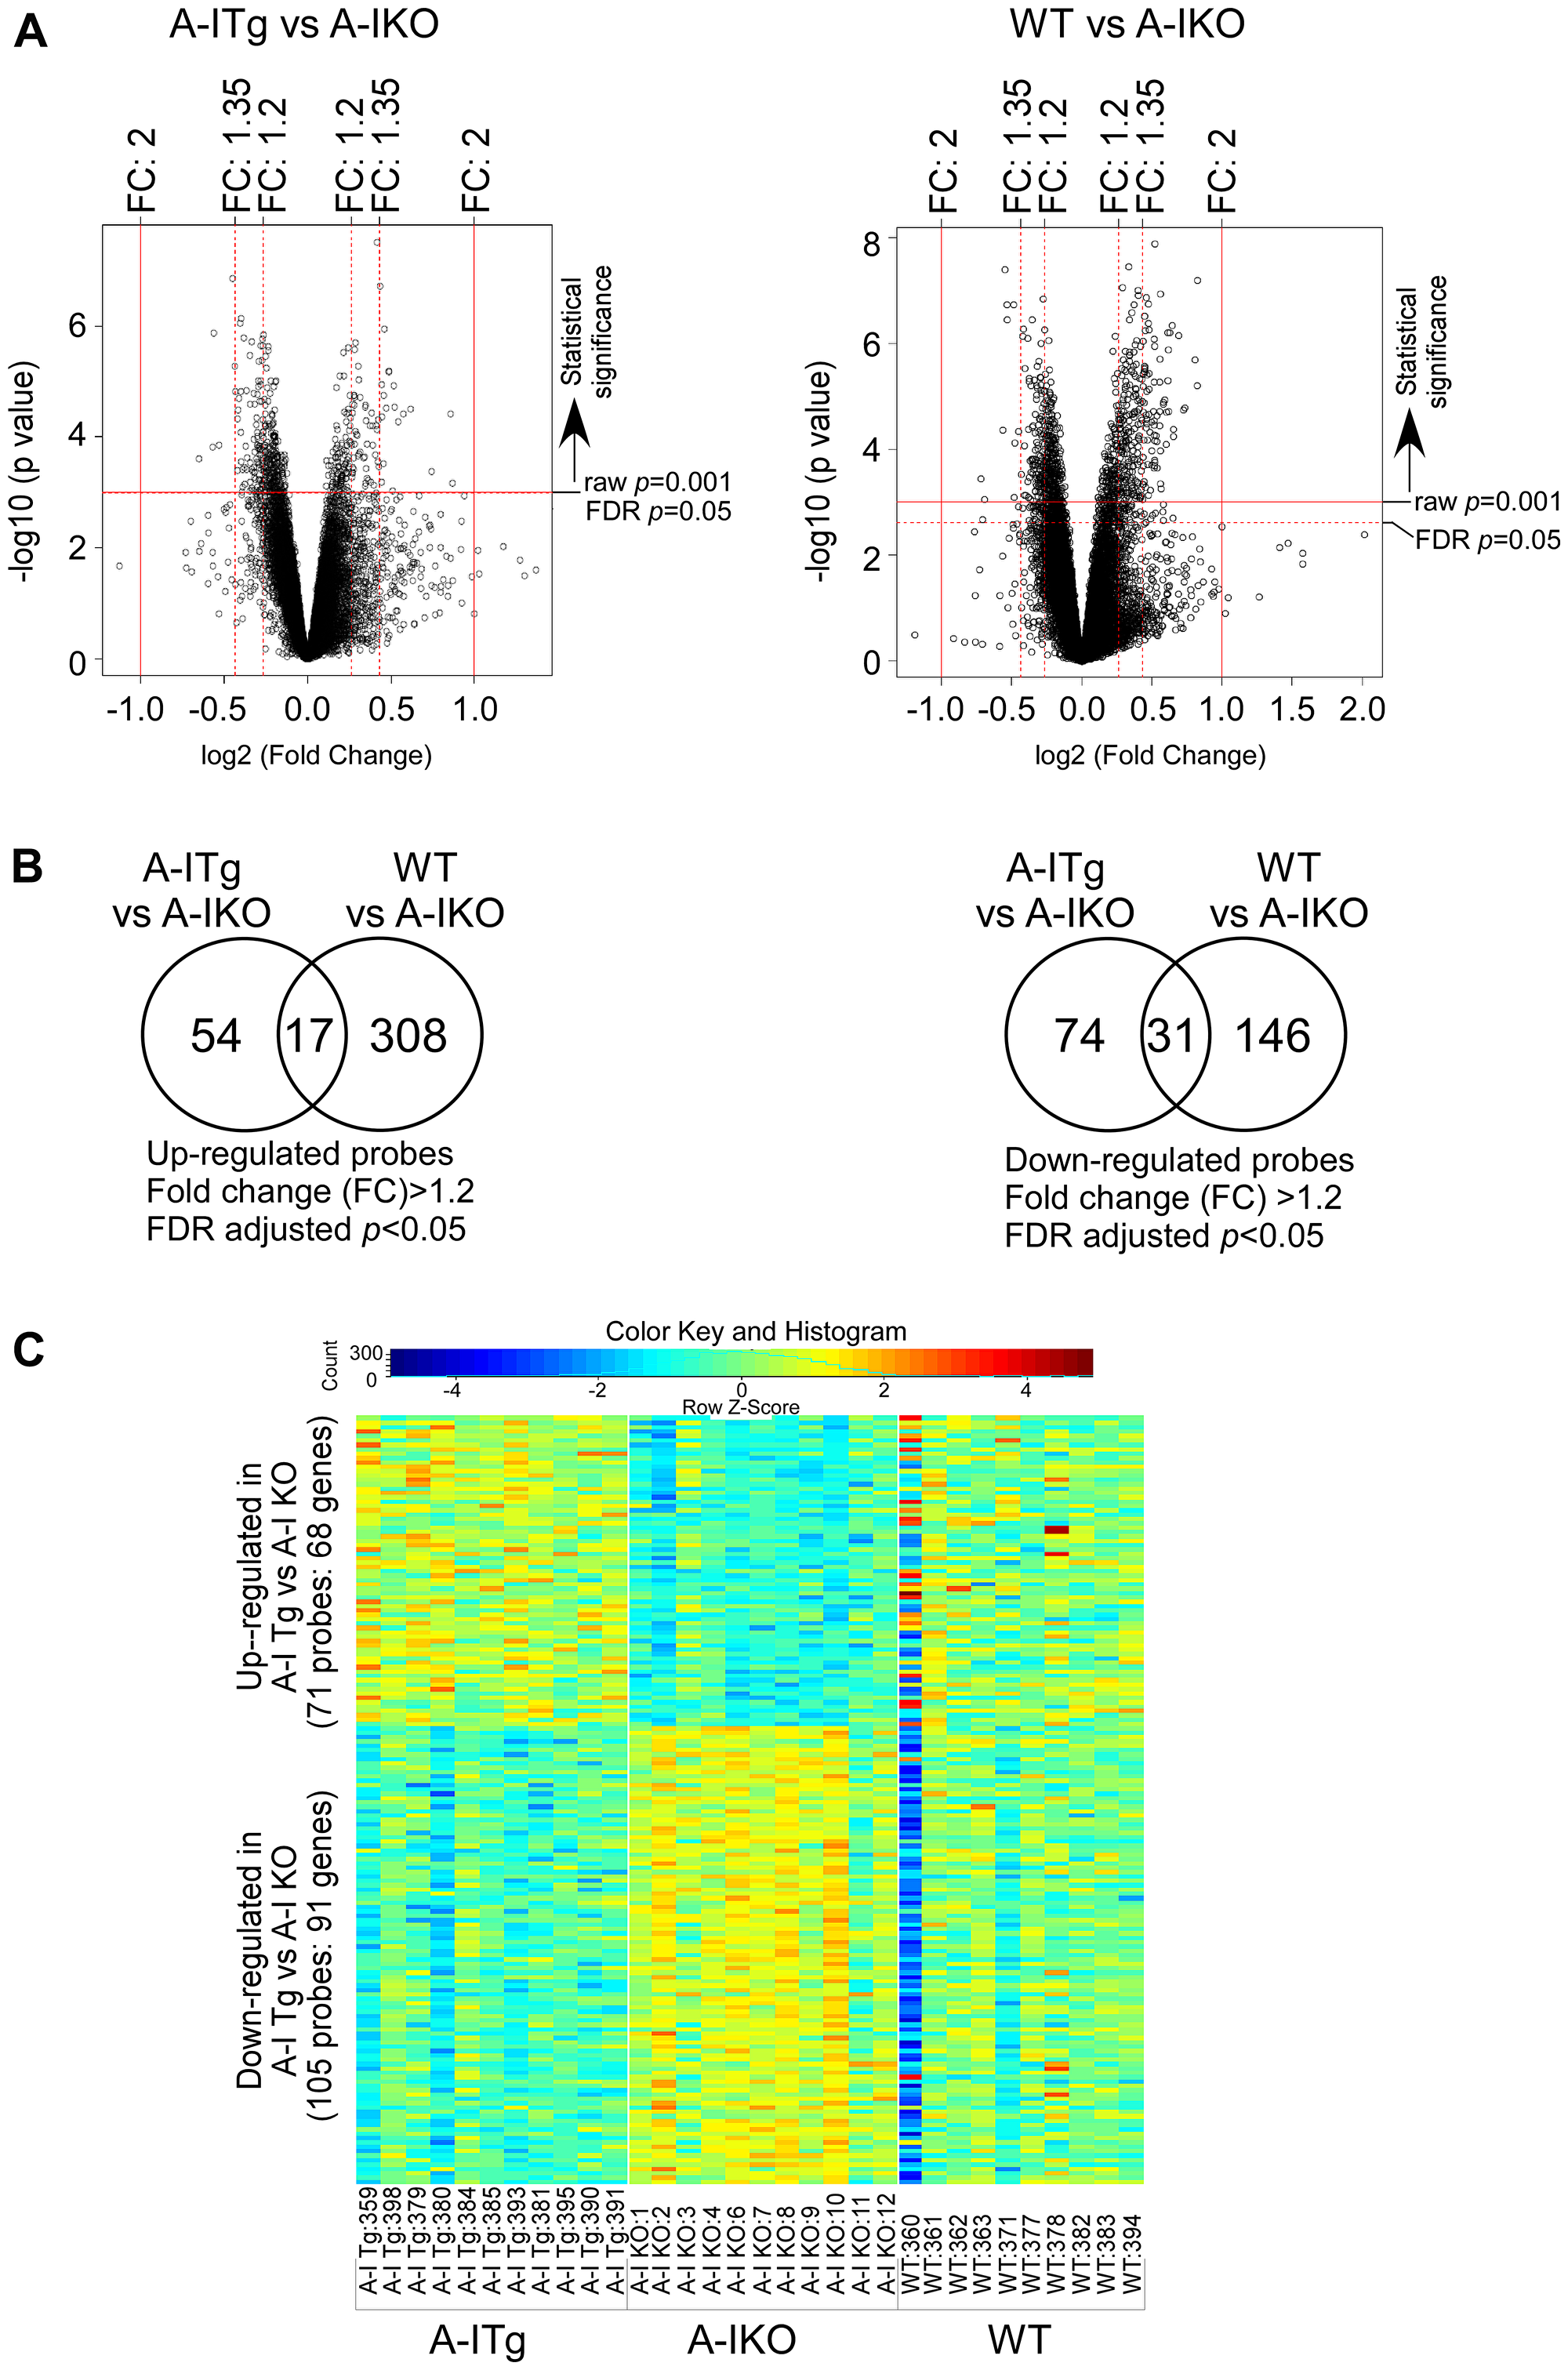
Figure 2: Identification of statistically significant transcripts from differential expression analyses. B16F10L melanoma homograft grown in C57BL/6 mice wild type for mouse apoA-I (WT), deficient (A-I KO) or expressing human apoA-I (A-I Tg+/–) were resected 7 days after inoculation and processed for RNA isolation and microarray analysis as described in Methods. (A) Volcano plots of expressed probes allowing for filtering of statistically significant (False Discover Rate (FDR) adjusted p < 0.05; Y-axis, -log10 (p-value)) and biologically significant probes (fold-change (FC), X-axis, log2(fold-change)). (B) Venn diagrams depicting the number of significant probes (FDR adjusted p < 0.05) that were up (left) or down (right) regulated (FC: 1.2) in A-I Tg+/– or WT with respect to A-I KO. (C) Two-way hierarchical heat map of significant transcripts (FDR adjusted p < 0.05) with fold-change cut off > 1.2 resulting from comparison of B16F10L tumors from A-I Tg+/– versus A-I KO mice. Columns refer to individual B16F10L primary tumors from host animals shown, and rows represent individual transcripts. Numbers following designated genotypes refer to unique mouse identifiers.
Table 1: Top genes up- or downregulated in tumors from A-I Tg+/– versus A-I KO
| Table 1A: Upregulated genes in A-ITg vs A-IKO mice | |||||
|---|---|---|---|---|---|
| Probe_ID | Accession no. | Symbol | Name | FC | adj. p-value |
| ILMN_1251748 | NM_139200.4 | Cytip | cytohesin 1 interacting protein | 1.83 | 0.04 |
| ILMN_1253182 | NM_010474.1 | Hs3st1 | heparan sulfate (glucosamine) 3-O-sulfotransferase 1 | 1.81 | 0.012 |
| ILMN_2622983 | NM_013642.2 | Dusp1 | dual specificity phosphatase 1 | 1.67 | 0.033 |
| ILMN_3161601 | NM_009221.2 | Snca | synuclein, alpha (non A4 component of amyloid precursor) | 1.54 | 0.011 |
| ILMN_2705166 | NM_145933.3 | St6gal1 | ST6 beta-galactosamide alpha-2,6-sialyltranferase 1 | 1.49 | 0.012 |
| ILMN_2722732 | NM_011157.2 | Srgn | serglycin | 1.46 | 0.015 |
| ILMN_3136638 | NM_009221.2 | Snca | synuclein, alpha (non A4 component of amyloid precursor) | 1.44 | 0.011 |
| ILMN_1254031 | NM_010638.4 | Klf9 | Kruppel-like factor 9 | 1.43 | 0.008 |
| ILMN_3161105 | NM_001033476.1 | Ahnak2 | AHNAK nucleoprotein 2 | 1.42 | 0.047 |
| ILMN_2829594 | NM_010479.2 | Hspa1a | heat shock 70kDa protein 1A | 1.4 | 0.006 |
| ILMN_2754985 | NM_009344.1 | Phlda1 | pleckstrin homology-like domain, family A, member 1 | 1.4 | 0.006 |
| ILMN_2824971 | NM_001004761.1 | Gpr158 | G protein-coupled receptor 158 | 1.39 | 0.011 |
| ILMN_2896314 | NM_015732.3 | Axin2 | axin 2 | 1.38 | 0.004 |
| ILMN_1233064 | NM_183417.2 | Cdk2 | cyclin-dependent kinase 2 | 1.37 | 0.009 |
| ILMN_2892441 | NM_010357.1 | Gsta4 | glutathione S-transferase alpha 4 | 1.37 | 0.029 |
| ILMN_2831799 | NM_019517.2 | Bace2 | beta-site APP-cleaving enzyme 2 | 1.36 | 0.013 |
| ILMN_2623280 | NM_011019.1 | Osmr | oncostatin M receptor | 1.36 | 0.008 |
| ILMN_2522236 | NM_011661.3 | Tyr | tyrosinase | 1.36 | 0.039 |
| ILMN_3114585 | NM_001039150.1 | Cd44 | CD44 molecule | 1.35 | 0.002 |
| ILMN_1252202 | NM_009397.2 | Tnfaip3 | tumor necrosis factor, alpha-induced protein 3 | 1.34 | 0.03 |
| ILMN_2612895 | NM_013484.1 | C2 | complement component 2 | 1.34 | 0.014 |
| ILMN_2680415 | NM_172537.2 | Sema6d | Semaphorin | 1.34 | 0.028 |
| ILMN_1246153 | NM_133362.2 | Erdr1 | erythroid differentiation regulator 1 | 1.34 | 0.017 |
| ILMN_1240323 | NM_018808.1 | Dnajb1 | DnaJ (Hsp40) homolog, subfamily B, member 1 | 1.34 | 0.001 |
| ILMN_2813484 | NM_011065.2 | Per1 | period circadian clock 1 | 1.33 | 0.015 |
| ILMN_2774690 | XM_001004685.1 | LOC677317 | similar to NADP-dependent malic enzyme (NADP-ME) (Malic enzyme 1) | 1.33 | 0.049 |
| ILMN_2734181 | NM_019811.3 | Acss2 | acyl-CoA synthetase short-chain family member 2 | 1.32 | 0.026 |
| ILMN_1226157 | NM_181585.5 | Pik3r3 | phosphoinositide-3-kinase, regulatory subunit 3 (gamma) | 1.32 | 0.042 |
| ILMN_2746556 | NM_015814.2 | Dkk3 | dickkopf 3 homolog (Xenopus laevis) | 1.31 | 0.022 |
| ILMN_3073563 | NM_001001884.1 | C230021P08Rik | Nckap5l NCK-associated protein 5-like | 1.31 | 0.015 |
| ILMN_2776619 | NM_008520.2 | Ltbp3 | latent transforming growth factor beta binding protein 3 | 1.3 | 0.012 |
| ILMN_1258600 | XM_001481024.1 | LOC100043671 | LOC100043671 hypothetical protein | 1.3 | 0.04 |
| ILMN_2870672 | NM_010180.1 | Fbln1 | fibulin 1 | 1.3 | 0.015 |
| Table 1B: Downregulated genes in A-ITg vs A-IKO mice | |||||
|---|---|---|---|---|---|
| Probe_ID | Accession no. | Symbol | Name | FC | adj. p-value |
| ILMN_2790181 | NM_016966.3 | Phgdh | phosphoglycerate dehydrogenase | 1.57 | 0.027 |
| ILMN_3081854 | NM_001025245.1 | Mbp | myelin basic protein | 1.48 | 0.023 |
| ILMN_2600348 | NM_009270.3 | Sqle | squalene epoxidase | 1.47 | 0.004 |
| ILMN_2634905 | NM_007994.3 | Fbp2 | fructose-1,6-bisphosphatase 2 | 1.45 | 0.022 |
| ILMN_2772274 | NM_001079694.1 | Sfrs5 | serine/arginine-rich splicing factor 5 | 1.37 | 0.002 |
| ILMN_2688075 | NM_020010.2 | Cyp51 | cytochrome P450, family 51 | 1.35 | 0.005 |
| ILMN_3148662 | NM_001079695.1 | Sfrs5 | serine/arginine-rich splicing factor 5 | 1.35 | 0.009 |
| ILMN_2712557 | NM_024439.3 | H47 | histocompatibility 47 Gene | 1.34 | 0.032 |
| ILMN_2996877 | NM_010063.1 | Dync1i1 | dynein cytoplasmic 1 intermediate chain 1 | 1.34 | 0.013 |
| ILMN_2700292 | NM_010376.3 | H13 | histocompatibility 13 | 1.33 | 0.011 |
| ILMN_2630641 | NM_009272.4 | Srm | spermidine synthase | 1.33 | 0.009 |
| ILMN_2737163 | NM_009270.3 | Sqle | squalene epoxidase | 1.32 | 0.004 |
| ILMN_2761594 | NM_007705.2 | Cirbp | cold inducible RNA binding protein | 1.32 | 0.009 |
| ILMN_2660414 | NM_025442.3 | Alg5 | ALG5, dolichyl-phosphate beta-glucosyltransferase | 1.32 | 0.018 |
| ILMN_3086899 | NM_198104.2 | Tcte3 | t-complex-associated-testis-expressed 3 | 1.32 | 0.004 |
| ILMN_2823778 | NM_025436.1 | Sc4mol | (testis meiosis-activating sterol/sterol C4-methyl oxidase–like) | 1.32 | 0.028 |
| ILMN_2642417 | NM_008590.1 | Mest | mesoderm specific transcript | 1.31 | 0.048 |
| ILMN_1247916 | NM_144862.3 | Lims2 | LIM and senescent cell antigen-like domains 2 | 1.31 | 0.044 |
| ILMN_2739825 | NM_010063.1 | Dync1i1 | dynein cytoplasmic 1 intermediate chain 1 | 1.31 | 0.032 |
| ILMN_1229529 | NM_010476.3 | Hsd17b7 | hydroxysteroid (17-beta) dehydrogenase 7 | 1.3 | 0.004 |
| ILMN_2606693 | NM_153526.4 | Insig1 | insulin induced gene 1 | 1.3 | 0.031 |
| ILMN_1238654 | NM_027352.3 | Gorasp2 | golgi reassembly stacking protein 2 | 1.3 | 0.041 |
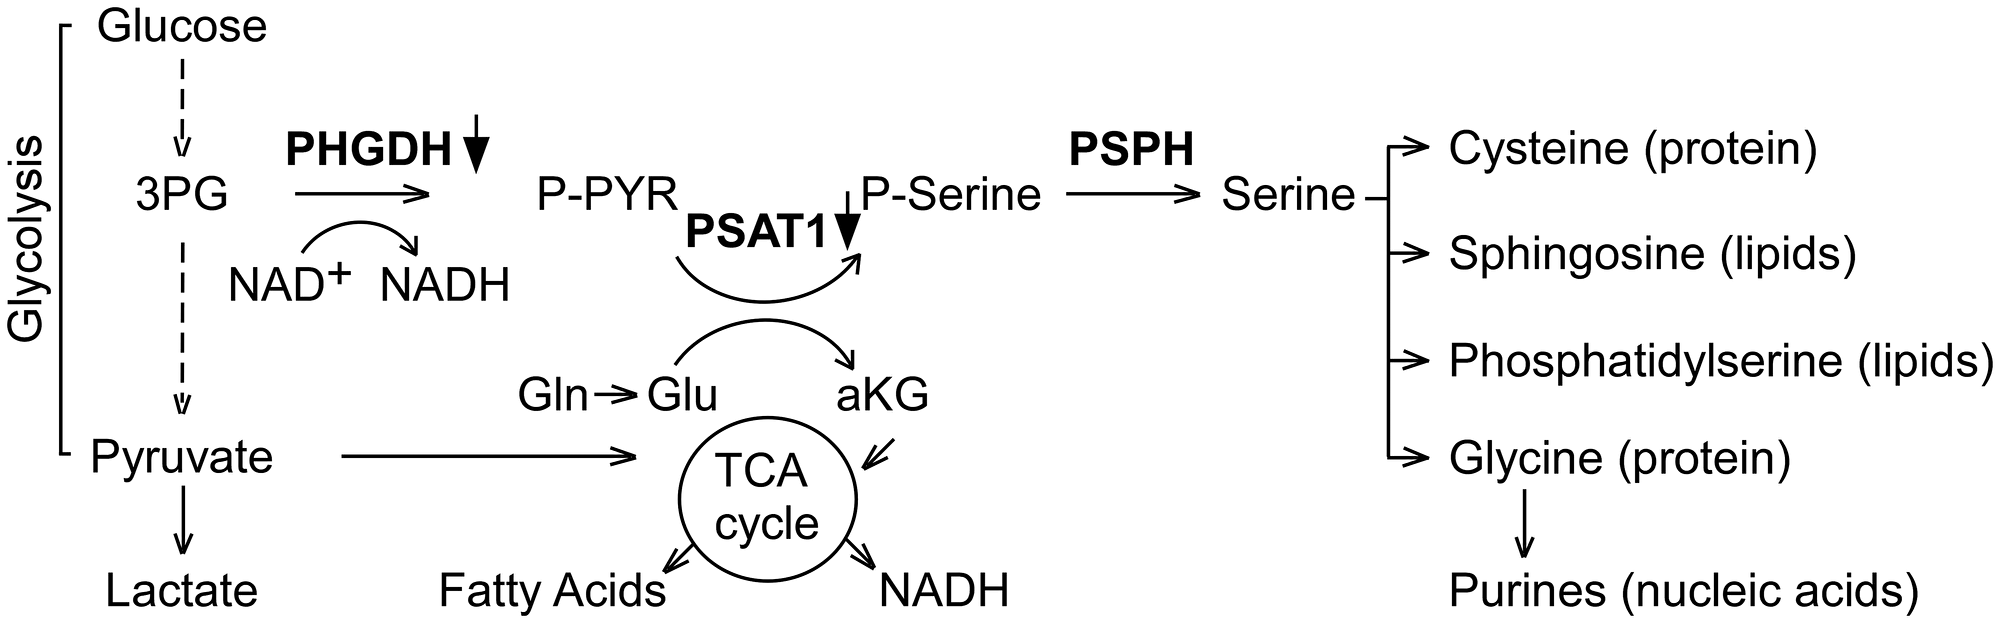
Figure 3: PHGDH, the first enzyme of de novo serine synthesis pathway, is the most repressed transcript in tumors from A-I Tg+/– animals. Eleven separate primary tumors from eleven A-I Tg+/– or A-I KO mice were subjected to differential gene expression analysis. Probes were considered significant if they met the criteria FDR adjusted p < 0.05 and fold-change (FC) cut off > 1.2. The complete list of significant genes is shown in Supplementary Tables 1 and 2. The transcripts for PHGDH and PSAT1 were down regulated (FDR adjusted p-value 0.027 and 0.104, respectively) by at least 1.2-fold in day 7 B16F10L tumor homograft from A-I Tg+/– relative to A-I KO mice. 3PG: 3-Phosphoglycerate; PHGDH: 3-Phospho-glycerate dehydrogenase; P-PYR: 3-Phospho-hydroxypyruvate; Gln: Glutamine; Glu: Glutamate; aKG: a-Ketoglutarate; PSAT1: phosphoserine aminotransferase 1; P-Serine: Phosphoserine; PSPH: Phosphoserine phosphatase.
To gain further insight into molecular mechanisms that might impart a growth advantage to tumors in the absence of host apoA-I, we compared the differentially-regulated genes listed in Supplementary Tables 1 and 2 to publically available, as well as proprietary annotated, melanoma databases for functional analyses (see Methods). Initially, we queried our list in a supervised fashion to an assortment of key biological processes relevant to cancer. These are shown in Figure 4, and the genes on this list that associated with these processes are listed in Table 2. Some genes, for example Dicer, Adamts1, and Cdc20, which were all downregulated in A-I Tg+/–, mapped to more than one biological process.
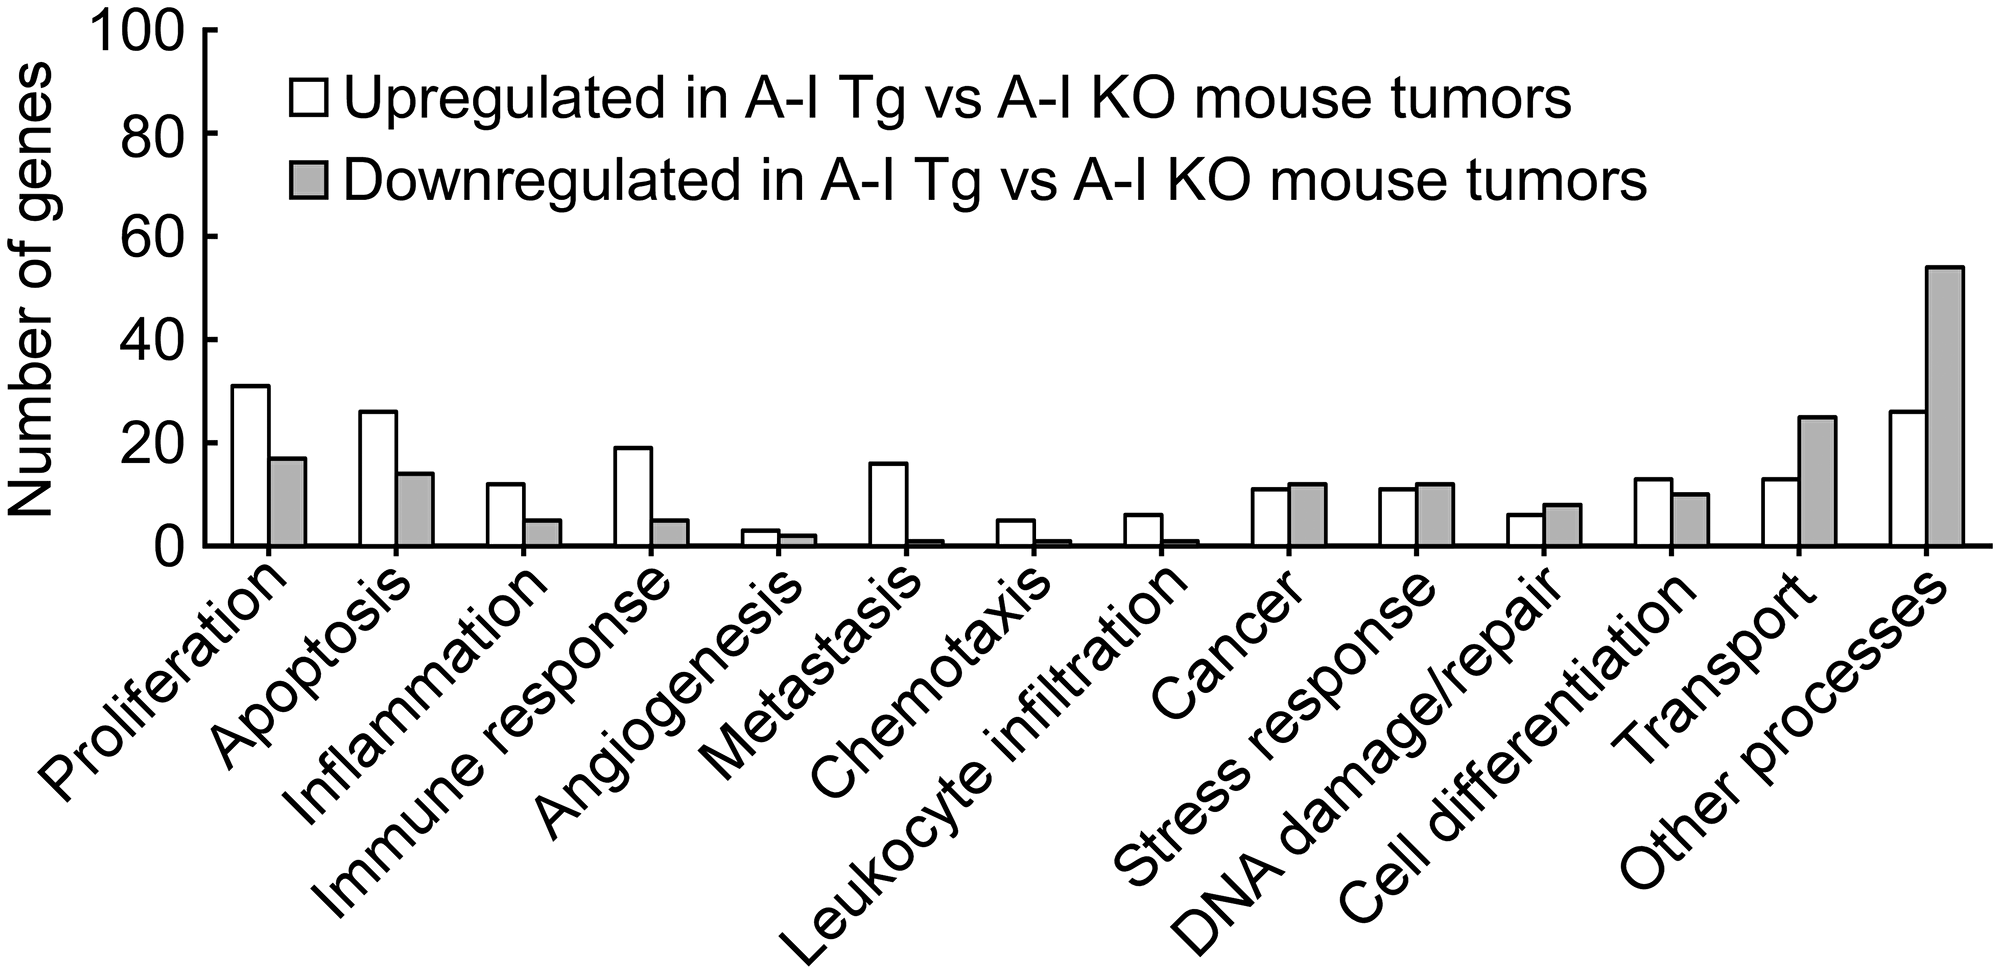
Figure 4: Genes from differential analysis of B16F10L tumors from A-I Tg+/– versus A-I KO mapped to key cancer related biological processes. The significant genes from differential analysis of day 7 B16F10L tumors from A-I Tg+/– versus A-I KO mice (listed in Supplementary Tables 1 and 2) were subjected to bioinformatics analysis. The mapping of genes to key cancer-related processes was obtained from disparate functional annotation data sources mentioned in the Methods section.
Table 2: Genes from differential analysis of B16F10L tumors from A-I Tg+/– versus A-I KO mapped to key cancer related biological processes
| Biological Processes | Up-regulated genes in A-ITg | Down-regulated genes in A-ITg |
|---|---|---|
| Proliferation | Axin2, Cd44, Cd80, Cdk2, Cxcr4, Dnajb1, Dusp1, Enpp2, Fbln1, Hspa1a, Irx3, Irx5, Klf9, Ltbp3, Mapt, Mitf, Mknk2, Nfat5, Osmr, Peli1, Per1, Phlda1, Pik3r3, Ptprs, Sort1, Srebf1, Srgn, St6gal1, Tnfaip3, Tob2, Tyr | Adamts1, Apex1, Cdc20, Cirbp, Dhcr24, Dicer1, Eif5a, Exosc4, Fadd, Gorasp2, Mbp, Mcm3, Mvd, Phgdh, Slc19a1, Tmpo, Vti1a |
| Apoptosis | Axin2, Cd44, Cdk2, Cxcr4, Dnajb1, Dusp1, Enpp2, Fbln1, Hspa1a, Ltbp3, Luc7l3, Map3k12, Mapt, Mitf, Nfat5, Peli1, Per1, Phlda1, Pik3r3, Ptprs, Snca, Sort1, Srgn, St6gal1, Tnfaip3, Tyr | Alg5, Apex1, Cdc20, Dhcr24, Dhx9, Dicer1, Eif5a, Fadd, H47, Lims2, Mbp, Slc19a1, Tcte3, Ubqln1 |
| Inflammation | C2, Cd44, Cdk2, Cxcr4, Dusp1, Osmr, Per1, Srebf1, Srgn, St6gal1, Tnfaip3, Tyr | Dicer1, Fadd, H47, Mbp, Stx18 |
| Immune response | C2, Cd44, Cd80, Cdk2, Cxcr4, Dusp1, Enpp2, Hspa1a, Klf9, Mitf, Osmr, Peli1, Per1, Snca, Srebf1, St6gal1, Tnfaip3, Tob2, Tyr | Dicer1, Fadd, H47, Mbp, Slc19a1 |
| Angiogenesis | Robo4, Cd44, Cxcr4 | Dicer1, Wars |
| Metastasis | C2, Cd44, Cxcr4, Dusp1, Enpp2, Fbln1, Map3k12, Mapt, Nfat5, Pik3r3, Robo4, Sema6d, Sort1, Srebf1, St6gal1, Tnfaip3 | Apex1 |
| Chemotaxis | Cd44, Cytip, Enpp2, Ptprs, Dusp1 | Pcdh17 |
| Leukocyte infiltration | Cd44, Cxcr4, Cytip, Mitf, Pik3r3, Snca | Dicer1 |
| Cancer | Cd44, Cdk2, Cxcr4, Enpp2, Klf9, Mitf, Osmr, Pik3r3, Srgn, Tnfaip3, Tyr | Adamts1, Cdc20, Cirbp, Dicer1, Fadd, Insig1, Mcm3, Mvd, Nme4, Slc19a1, Sqle, Srm |
| Stress response | Axin2, C2, Cd44, Dnajb1, Hspa1a, Insig2, Luc7l3, Peli1, Snca, Srebf1, Tnfaip3 | Apex1, Cirbp, Dhx9, Dicer1, Fadd, H47, Insig1, Mpv17, Rad51ap1, Sfrs5, Ubqln1, Wfdc12 |
| DNA damage/repair | Cdk2, Dnajb1, Dusp1, Hspa1a, Map3k12, Srgn | Apex1, Cdc20, Dicer1, Mcm3, Nme4, Nup107, Slc19a1, Tmpo |
| Cell differentiation | Axin2, Cd44, Cxcr4, Erdr1, Irx3, Irx5, Ltbp3, Mapt, Mitf, Robo4, Sema6d, Sort1, Tob2 | AI428936, Camk1, Cdc20, Dicer1, Eif5a, Insig1, Mbp, Nle1, Phgdh, Stk25 |
| Transport | Acsl3, Axin2, Cd44, Cdk2, Cxcr4, Elovl5, Insig2, Mapt, Ptprs, Snca, Sort1, Srebf1, Srgn | Apex1, Camk1, Dhcr24, Dync1i1, Eif5a, Fadd, H47, Il1rl1l, Insig1, Mbp, Mybbp1a, Nup107, Phgdh, Preb, Rhobtb3, Slc19a1, Snf8, Srpr, Stard4, Stard5, Stx18, Tmed4, Vti1a, Yif1a, Zfpl1 |
| Other Processes | 2700097009Rik, Acss2, Ahnak2, Bace2, Clmn, Crem, Dkk3, Efcab6, Eif4a2, Fbxo30, Gcnt2, Gpr158, Gsta4, Hs3st1, Lekr1, Loc100043671, Loc100046802, Loc677317, Nckap5l, Plekha3, Rdm1, Tex2, Ube2o, Unc119b, Zfp597, Zmynd8 | Get4, 1810065E05Rik, 2410002F23Rik, Fam176b, 3010003L21Rik, Trmt61a, Bud31, C85627, Cyp51a1, Dus1l, Elovl1, Fbp2, Fbxo36, Gale, Gmpr, Grwd1, Hm13, Hsd17b7, Oc100040592, Loc100043257, Mest, Mpdu1, Mrps18b, Msto1, Nif3l1, Nol12, Nop56, Mak16, Rnf144a, Rnf25, Rwdd3, Sc4mol, Smyd5, Snrpa, Sssca1, Sumo3, Tmem17, Tmem214, Ttc39a, Znf32 |
The Ingenuity Pathway Analysis (IPA) program was then used to generate biological networks from functional relationships between genes or proteins based on the published literature (http://www.Ingenuity.com). It identified lipid and cholesterol synthesis as top relevant pathways for genes downregulated in tumors from A-I Tg+/– mice (Supplementary Figure 1A, 1B and Supplementary Table 3A and 3B). Significantly, five of these genes (Mvd, Sqle, Cyp51, Hsd17b7, and Dhcr24) are within the core biochemical processes of the mevalonate pathway, an important target for anti-cancer therapy [24, 27]. The mevalonate pathway converts acetyl-CoA via mevalonate, the product of the tightly regulated enzyme HMG-CoA reductase and the target of statins, into a variety of end products fundamental to cellular and organismal life (Figure 5).
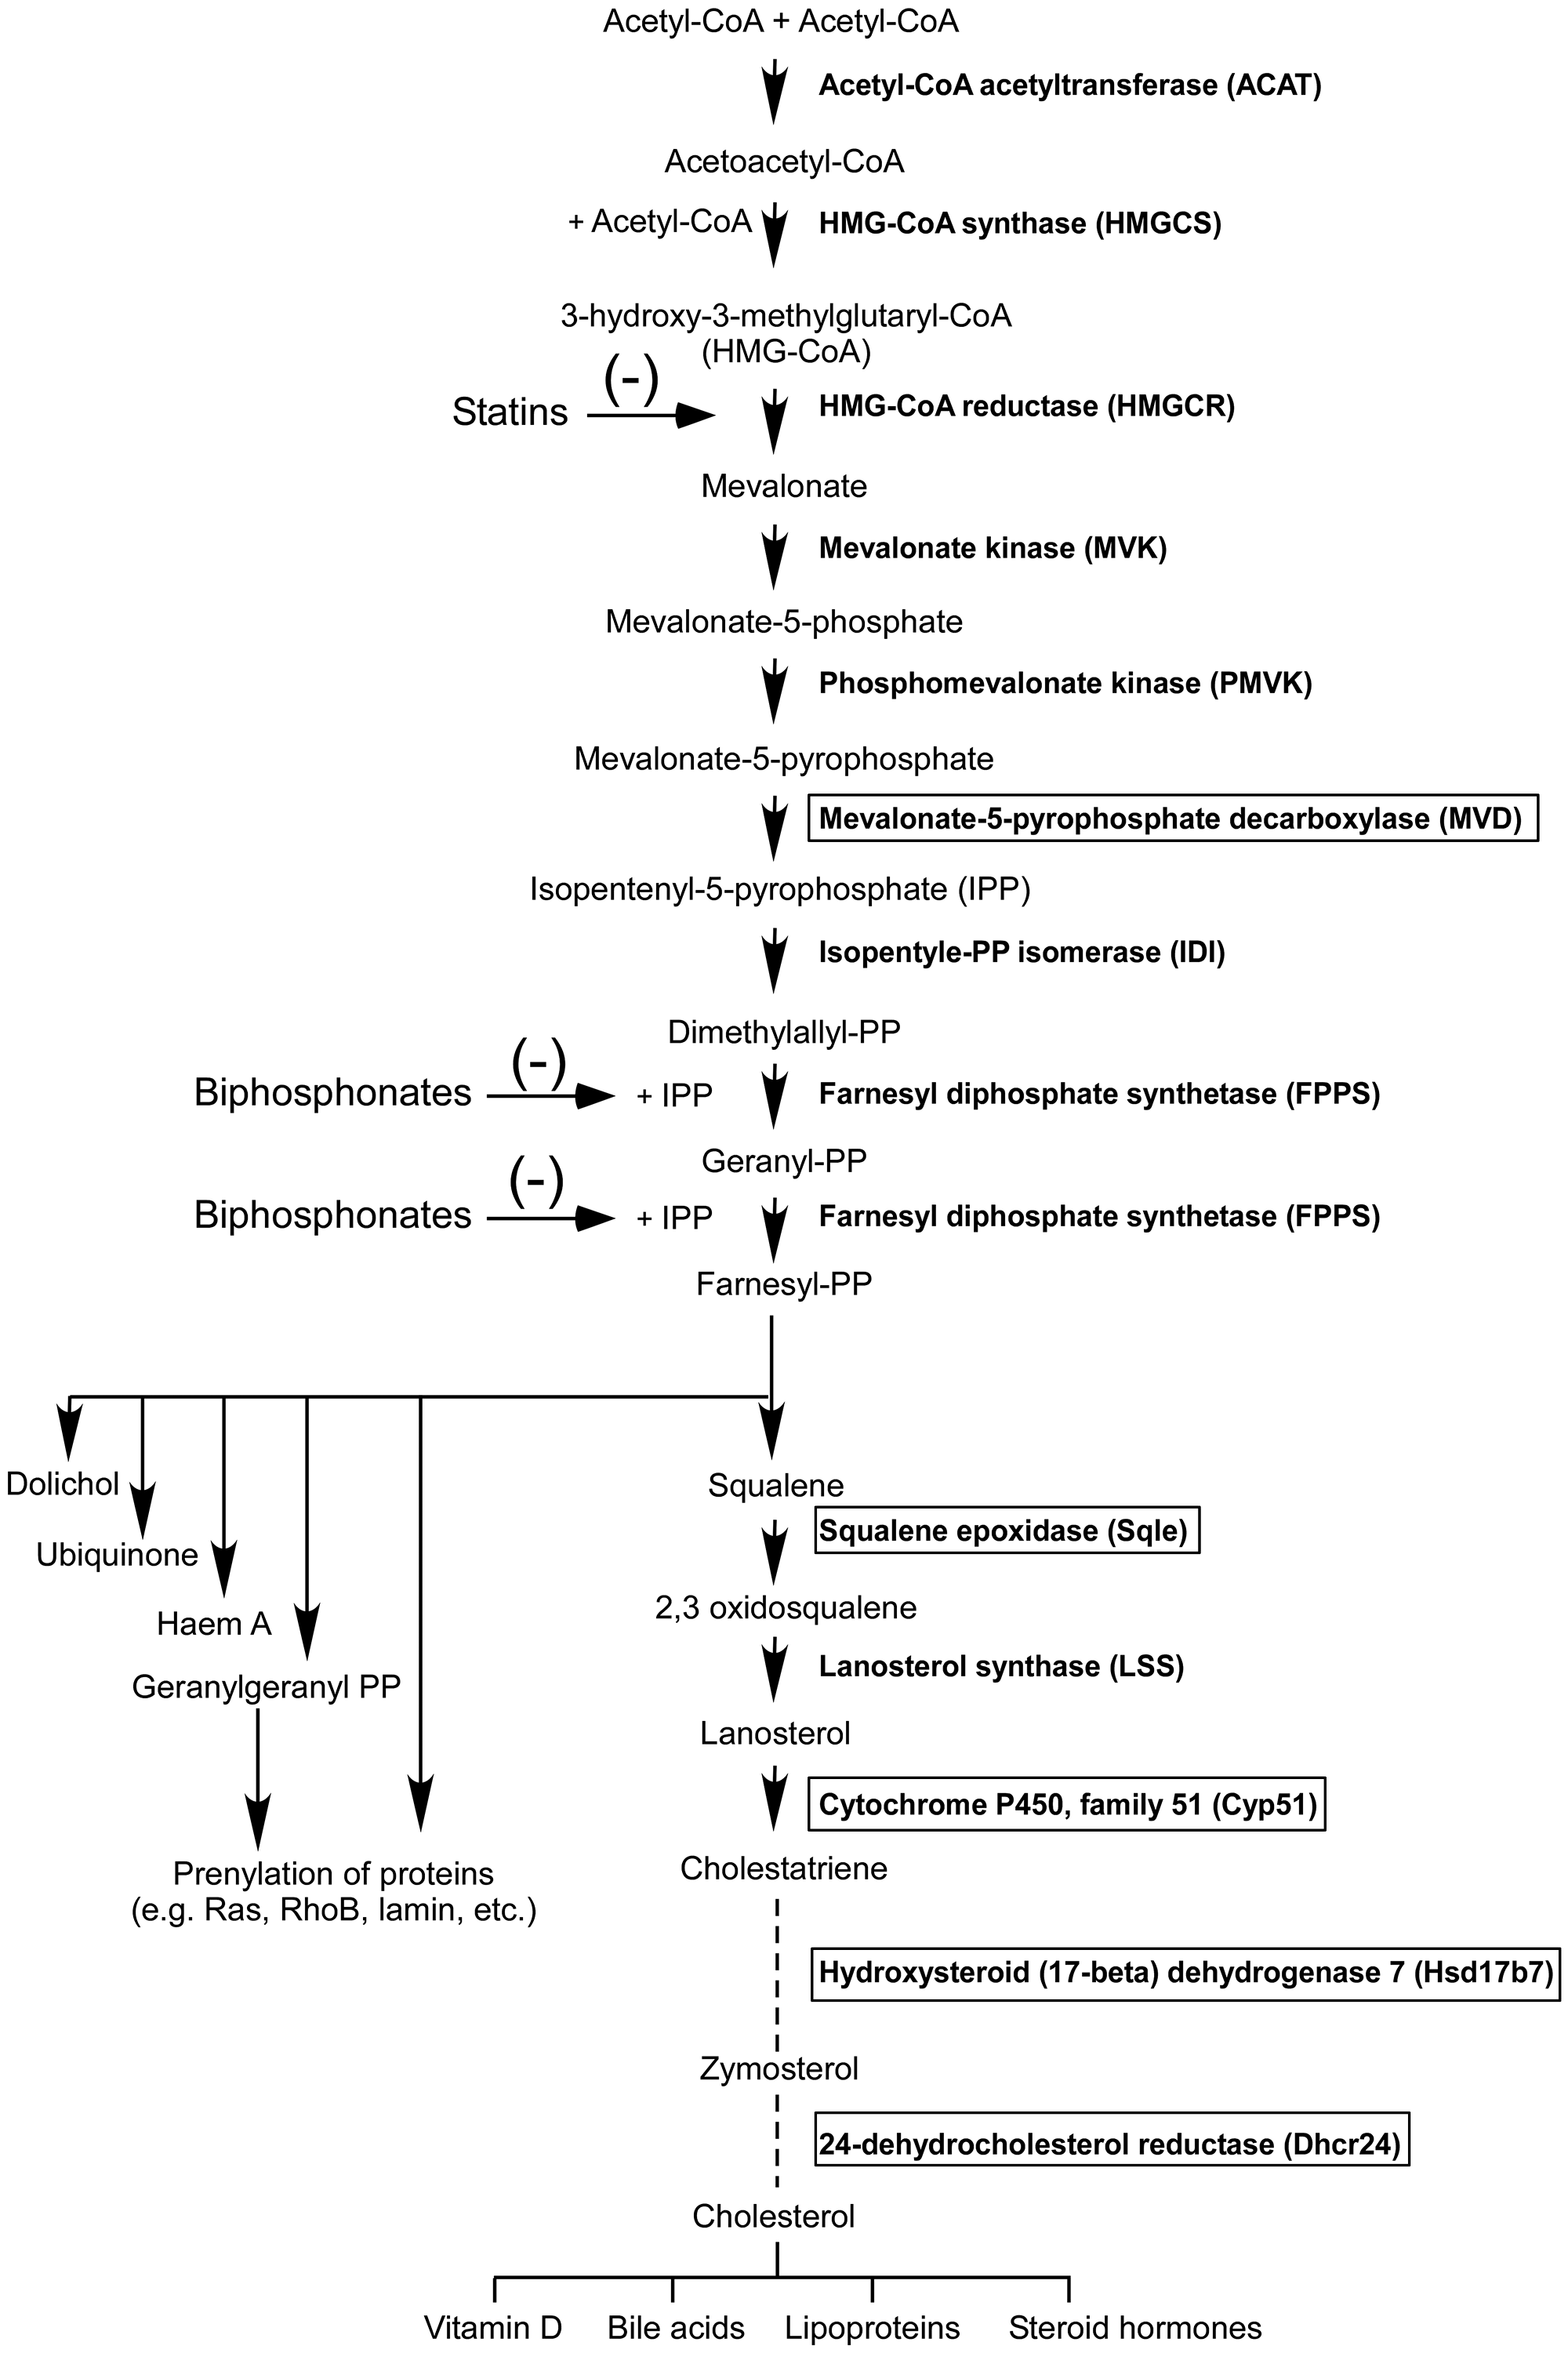
Figure 5: The mevalonate pathway. The transcripts for enzymes in boxes were down regulated (FDR adjusted p < 0.05) by at least 1.2-fold in day 7 melanoma tumor homograft from A-I Tg+/– relative to A-I KO mice.
We next tested whether or not a dose-dependent expression correlation existed between each of Phgdh, Mvd, Sqle, Cyp51, Hsd17b7, Dhcr24 and HDL-c levels. Figure 6 shows a significant inverse association between transcript levels of all six genes and HDL-c consistent with the notion that higher circulating apoA-I (HDL-c) levels inhibit expression of these genes in the developing tumor.
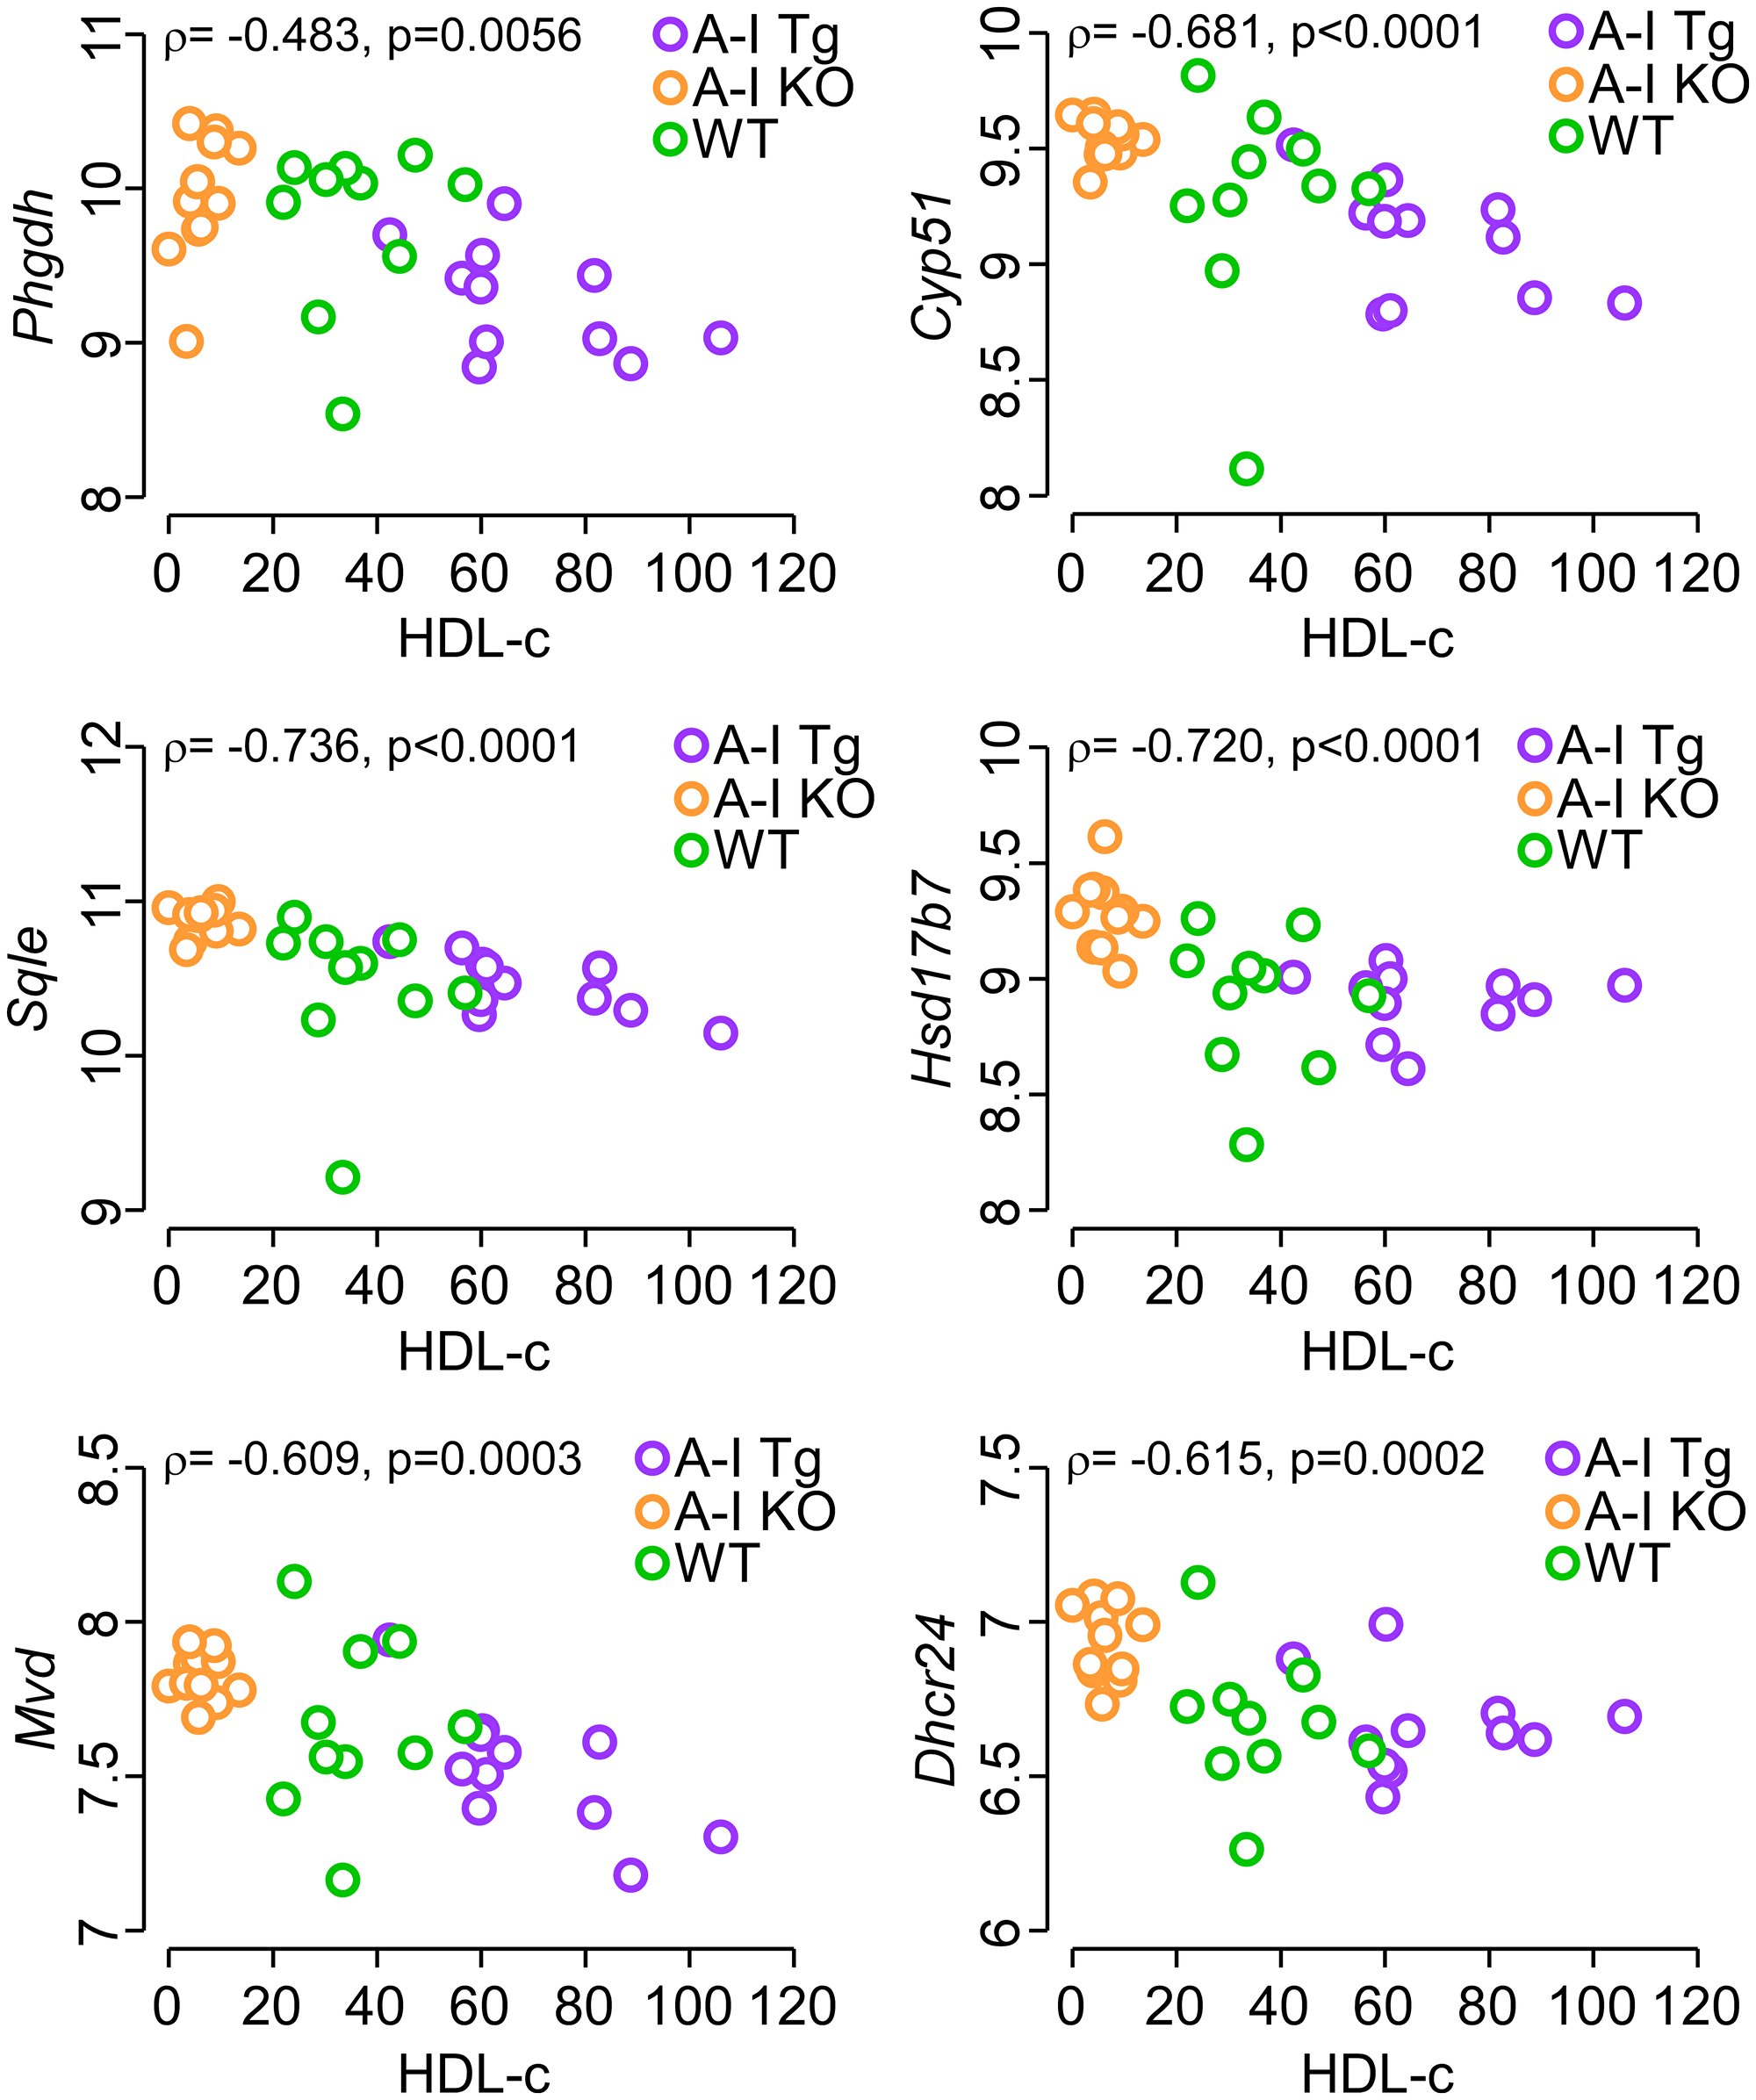
Figure 6: Inverse correlation between circulating HDL-c levels in tumor-bearing mice and tumor transcript levels of Phgdh, the first enzyme of serine synthesis pathway as well as enzymes of the mevalonate pathway. The gene chip expression signal of the indicated genes after positive background correction, log2 transformation, and quantile normalization was plotted against HDL-c levels (see Methods) in tumor bearing mice. Each data point represents the transcript signal from one tumor-bearing animal. The p-value were calculated with Spearman’s rank correlation and analyses were performed using R 3.5.3.
Gene expression profiles in tumors from A-I KO are concordant with human melanoma gene signature for adverse outcome
We previously reported that apoA-I therapy was effective against human melanoma in nude mice [16]. We next compared the gene expression data mined in this study with published human melanoma gene signatures [8] to determine whether genes known to track with poor prognosis in humans are concordant with those found in tumors in the A-I KO mice, the more aggressive tumor setting in our mouse model. Human microarray studies [8] identified the expression profile of genes associated with 4-year distant metastasis-free survival, metastasis, or death among 58 patients with 4-yr follow up. Of the 250 distinct genes identified by this human study, a total of 170 were eligible for comparison in our mouse study; the remaining 80 genes were not present on the mouse array. Of the 170 genes under consideration, 40 did not give any detectable signal on our array, leaving 130 genes for comparison with the expression dataset in this study. We interrogated the eligible genes in our day 7 gene expression dataset with respect to fold-change (A-I KO/A-I Tg+/–) in expression signal normalized to beta-2-microglobulin with a p-value cut off < 0.05 (Student’s t-test). Remarkably, 45% (58) of human genes reported to associate with poor prognosis were also concordant in tumors from A-I KO animals with only 3% (4 genes) going in the opposite direction. We observed no significant difference between A-I KO and A-I Tg+/– in the remaining 52% (68 genes). Table 3 lists the genes compared in the human and mouse study and their expression trend. Table 4 maps the genes to top functions in IPA: cell cycle, DNA replication and repair, nucleic acid metabolism, and cellular assembly and organization as well as cancer. The genes listed in Table 3 were also observed to be differentially regulated in two independent datasets, Riker and Talantov studies [7, 40] from the Oncomine datasets of cutaneous melanoma versus normal (Table 5). Forty-one (41) out of 58 concordant genes in Table 3 were observed to be differentially regulated (> 2-fold change) and statistically significant (p < 0.01) in these independent datasets. Of the genes upregulated in A-I KO (40 out of 41), 12 were concordant in both Riker and Talantov studies [7, 40] and 27 were concordant in either Riker or Talantov [7, 40] (Table 5). Only one gene, the nuclear hormone receptor-interacting protein nuclear receptor coactivator 6 (Ncoa6), was non-concordant, being upregulated in our dataset but downregulated in the Talantov study (Table 5). Gene F10, which encodes the vitamin K-dependent coagulation factor X of the blood coagulation pathway, was downregulated in our study and was also repressed in the Talantov data set (Table 5), as were the human melanoma signatures [8]. These comparisons with three distinct human melanoma studies, as well as the observed high degree of concordance of genes both upregulated or downregulated in melanomas associated with adverse outcomes with published human melanoma gene signatures, validate the mouse gene expression dataset results presented here.
Table 3: A significant number of genes associated with poor prognosis in human melanoma were also concordant in B16F10L tumors from A-I KO mice
| PROBE_ID | SYMBOL | DEFINITION | FOLD CHANGE A-IKO/A-ITg | p-value | Expression associated with adverse prognosis in humans |
|---|---|---|---|---|---|
| ILMN_1231392 | Melk | maternal embryonic leucine zipper kinase (Melk), mRNA. | 1.5 | 0.002 | Up regulated |
| ILMN_2804444 | Pcdh17 | protocadherin 17 (Pcdh17), mRNA. | 1.5 | 0.001 | Up regulated |
| ILMN_2741050 | Rfc4 | replication factor C (activator 1) 4 (Rfc4), mRNA. | 1.4 | 0.013 | Up regulated |
| ILMN_2757224 | Srp19 | signal recognition particle 19 (Srp19), mRNA. | 1.4 | 0.005 | Up regulated |
| ILMN_2711112 | Shcbp1 | Shc SH2-domain binding protein 1 (Shcbp1), mRNA. | 1.4 | 0.001 | Up regulated |
| ILMN_2878355 | Kpna2 | karyopherin (importin) alpha 2 (Kpna2), mRNA. | 1.4 | 0.005 | Up regulated |
| ILMN_2607926 | Kdelr2 | KDEL (Lys-Asp-Glu-Leu) endoplasmic reticulum protein retention receptor 2 (Kdelr2), mRNA. | 1.4 | 0.002 | Up regulated |
| ILMN_2714565 | Rrm2 | ribonucleotide reductase M2 polypeptide | 1.4 | 0.002 | Up regulated |
| ILMN_2756008 | Nasp | nuclear autoantigenic sperm protein (histone-binding) | 1.4 | 0.002 | Up regulated |
| ILMN_2816754 | Ndc80/Kntc2 | NDC80 homolog, kinetochore complex component (S. cerevisiae) (Ndc80), mRNA. | 1.4 | 0.006 | Up regulated |
| ILMN_2971845 | Dtymk | deoxythymidylate kinase (Dtymk), mRNA. | 1.4 | 0.006 | Up regulated |
| ILMN_2588362 | Cdca8 | cell division cycle associated 8 (Cdca8), mRNA. | 1.4 | 0.003 | Up regulated |
| ILMN_2934457 | Ran | RAN, member RAS oncogene family (Ran), mRNA. | 1.4 | 0.004 | Up regulated |
| ILMN_2688944 | Htra2/Prss25 | HtrA serine peptidase 2 (Htra2), nuclear gene encoding mitochondrial protein, mRNA. | 1.4 | 0.001 | Up regulated |
| ILMN_1214319 | Gemin6 | gem (nuclear organelle) associated protein 6 (Gemin6), mRNA. | 1.4 | 0.001 | Up regulated |
| ILMN_2632712 | Birc5 | baculoviral IAP repeat-containing 5 (Birc5), transcript variant 1, mRNA. | 1.4 | 0.006 | Up regulated |
| ILMN_2999654 | Psmc3ip | proteasome (prosome, macropain) 26S subunit, ATPase 3, interacting protein (Psmc3ip), mRNA. | 1.4 | 0.003 | Up regulated |
| ILMN_2780177 | Mrps5 | mitochondrial ribosomal protein S5 (Mrps5), nuclear gene encoding mitochondrial protein, mRNA. | 1.4 | 0.005 | Up regulated |
| ILMN_1244296 | Cdc14b/Znf367 | CDC14 cell division cycle 14 homolog B (S. cerevisiae) (Cdc14b), mRNA. | 1.4 | 0.024 | Up regulated |
| ILMN_1257552 | Tars | threonyl-tRNA synthetase (Tars), mRNA. | 1.4 | 0.008 | Up regulated |
| ILMN_2621422 | Kirrel | kin of IRRE like (Drosophila) (Kirrel), mRNA. | 1.3 | 0.026 | Up regulated |
| ILMN_2982965 | Prim2 | DNA primase, p58 subunit (Prim2), mRNA. | 1.3 | 0.005 | Up regulated |
| ILMN_2598852 | Ranbp1 | RAN binding protein 1 (Ranbp1), mRNA. | 1.3 | 0.007 | Up regulated |
| ILMN_3097131 | Timeless | timeless homolog (Drosophila) (Timeless), transcript variant 2, mRNA. | 1.3 | 0.013 | Up regulated |
| ILMN_2595846 | Surf4 | surfeit gene 4 (Surf4), mRNA. | 1.3 | 0.003 | Up regulated |
| ILMN_2639036 | Hspd1 | heat shock protein 1 (chaperonin) (Hspd1), mRNA. | 1.3 | 0.011 | Up regulated |
| ILMN_2745005 | Gpn3/MGC14560 | GPN-loop GTPase 3 (Gpn3), mRNA. | 1.3 | 0.005 | Up regulated |
| ILMN_2619671 | Mrps16 | mitochondrial ribosomal protein S16 (Mrps16), nuclear gene encoding mitochondrial protein, mRNA. | 1.3 | 0.011 | Up regulated |
| ILMN_2787871 | Cdca5 | cell division cycle associated 5 (Cdca5), mRNA. | 1.3 | 0.008 | Up regulated |
| ILMN_2768984 | Anln | anillin, actin binding protein (Anln), mRNA. | 1.3 | 0.032 | Up regulated |
| ILMN_2484707 | Tyms | thymidylate synthase (Tyms), mRNA. | 1.3 | 0.013 | Up regulated |
| ILMN_2919433 | Cdc45l | cell division cycle 45 homolog (S. cerevisiae)-like (Cdc45l), mRNA. | 1.3 | 0.043 | Up regulated |
| ILMN_1218967 | Kif2c | kinesin family member 2C (Kif2c), mRNA. | 1.3 | 0.015 | Up regulated |
| ILMN_1233857 | Mcm6 | minichromosome maintenance deficient 6 (MIS5 homolog, S. pombe) (S. cerevisiae) (Mcm6), mRNA. | 1.3 | 0.012 | Up regulated |
| ILMN_2749937 | Ncoa6 | nuclear receptor coactivator 6 (Ncoa6), mRNA. | 1.3 | 0.011 | Up regulated |
| ILMN_2797642 | Ncaph/Brrn1 | non-SMC condensin I complex, subunit H (Ncaph), mRNA. | 1.3 | 0.013 | Up regulated |
| ILMN_2637203 | Rfc5 | replication factor C (activator 1) 5 (Rfc5), mRNA. | 1.3 | 0.022 | Up regulated |
| ILMN_2758690 | Mrps17 | mitochondrial ribosomal protein S17 (Mrps17), mRNA. | 1.3 | 0.012 | Up regulated |
| ILMN_2706882 | Donson | downstream neighbor of SON (Donson), mRNA. | 1.3 | 0.028 | Up regulated |
| ILMN_2698282 | Fusip1 | FUSiinteracting protein | 1.3 | 0.010 | Up regulated |
| ILMN_2680648 | Atad2 | ATPase family, AAA domain containing 2 (Atad2), mRNA. | 1.3 | 0.026 | Up regulated |
| ILMN_2983686 | Trub2 | TruB pseudouridine (psi) synthase homolog 2 (E. coli) (Trub2), mRNA. | 1.3 | 0.017 | Up regulated |
| ILMN_2657844 | Cdc2a | cell division cycle 2 homolog A (S. pombe) (Cdc2a), mRNA. | 1.3 | 0.021 | Up regulated |
| ILMN_2605890 | Tk1 | thymidine kinase 1 (Tk1), mRNA. | 1.3 | 0.036 | Up regulated |
| ILMN_2677595 | Ncapg2/Mtb | non-SMC condensin II complex, subunit G2 (Ncapg2), mRNA. | 1.2 | 0.022 | Up regulated |
| ILMN_2608933 | Tcof1 | Treacher Collins Franceschetti syndrome 1, homolog (Tcof1), mRNA. | 1.2 | 0.030 | Up regulated |
| ILMN_1233065 | Rbmx | RNA binding motif protein, X chromosome (Rbmx), mRNA. | 1.2 | 0.053 | Up regulated |
| ILMN_3163044 | Ola1/PTD004 | Obg-like ATPase 1 (Ola1), transcript variant 1, mRNA. | 1.2 | 0.016 | Up regulated |
| ILMN_1236574 | Cenpa | centromere protein A (Cenpa), mRNA. | 1.2 | 0.016 | Up regulated |
| ILMN_3162184 | AU014645/Ncbp1 | expressed sequence AU014645 (AU014645), mRNA. | 1.2 | 0.010 | Up regulated |
| ILMN_1221067 | Nme1 | non-metastatic cells 1, protein (NM23A) expressed in (Nme1), mRNA. | 1.2 | 0.006 | Up regulated |
| ILMN_2830661 | Top2a | topoisomerase (DNA) II alpha (Top2a), mRNA. | 1.2 | 0.025 | Up regulated |
| ILMN_2975640 | Snrpg | small nuclear ribonucleoprotein polypeptide G (Snrpg), mRNA. | 1.2 | 0.013 | Up regulated |
| ILMN_1245757 | Nans | N-acetylneuraminic acid synthase (sialic acid synthase) (Nans), mRNA. | 1.2 | 0.027 | Up regulated |
| ILMN_2717172 | Dph3/Zcsl2 | DPH3 homolog (KTI11, S. cerevisiae) (Dph3), transcript variant 2, mRNA. | 1.2 | 0.043 | Up regulated |
| ILMN_2936427 | Mcm4 | minichromosome maintenance deficient 4 homolog (S. cerevisiae) (Mcm4), mRNA. | 1.2 | 0.050 | Up regulated |
| ILMN_1242622 | Crem | cAMP responsive element modulator (Crem), mRNA. | 0.7 | 0.002 | Up regulated |
| ILMN_2631423 | H2-Ab1/HLA-DQB1 | histocompatibility 2, class II antigen A, beta 1 (H2-Ab1), mRNA. | 0.6 | 0.005 | Down regulated |
| ILMN_2688912 | F10 | coagulation factor X | 0.4 | 0.012 | Down regulated |
| ILMN_1258462 | Hoxa9 | homeo box A9 (Hoxa9), mRNA. | 1.5 | 0.031 | Down regulated |
| ILMN_2655373 | Siat7f | CMP-NeuAC:(b)-N-acetylgalactosaminide (a)2,6-sialyltransferase member VI | 1.5 | 0.004 | Down regulated |
| ILMN_1232182 | Ctnnbip1 | catenin beta interacting protein 1 (Ctnnbip1), mRNA. | 1.3 | 0.020 | Down regulated |
Table 4: Mouse genes differentially regulated in B16F10L tumors from A-I KO and A-I Tg+/– mice and concordant with human genes associated with poor outcome in melanoma were mapped to top functions in IPA
| Expression in A-I KO relative to A-I Tg mice | Gene Symbol | Top Functions |
|---|---|---|
| ↑ | Atad2, Birc5, Cdca8, Cdk1, Cenpa, Dtymk, Htra2, Kif2c, Mcmr, Mcm6, Melk, Nasp, Ndc80, Psmc3ip, Ran, Ranbp1, Rrm2, Srp19, Timeless, Tyms | DNA Replication, Recombination and Repair, Cellular Assembly and Organization, Nucleic Acid Metabolism |
| ↓ | F10, Hla-dqb1 | |
| ↑ | Anln, Atad2, Cdc45, Cdc14b, Gpn3, Kpna2, Mrps16, Mrps17, Nans, Ncapg2, Ncaph, Rfc4, Shcbp1, Tyms | Cell Cycle, DNA Replication, Recombination and Repair, Cellular Assembly and Organization |
| ↑ | Kdelr2, Loc100505793/Fusip1, Ncp1, Ncoa6, Ola1, Prim2, Rbmx, Rfc5, Srp19, Surf4, Tars, Trub2 | Cell Cycle, Cancer, Infection Mechanism |
| ↑ | Cdca5, Gemin6, Hspd1, Nme1, Rfc4, Rfc5, Snrpg, Tcof1, Tk1, Top2a | Cell Cycle, DNA Replication, Recombination and Repair, Developmental Disorder |
Table 5: Gene expression profiles in tumors from A-I KO are concordant with human melanoma gene signature for adverse outcome
| Probe_ID | Gene Symbol | DEFINITION | A-IKO/ A-ITg (Mean) | p-value | Expression (in this study and in Oncomine’s) | Oncomine Datasets- Cutaneous Melanoma vs normal |
|---|---|---|---|---|---|---|
| ILMN_1231392 | Melk | Mus musculus maternal embryonic leucine zipper kinase (Melk), mRNA. | 1.5 | 0.002 | ↑↑ | Riker, Talantov |
| ILMN_2878355 | Kpna2 | Mus musculus karyopherin (importin) alpha 2 (Kpna2), mRNA. | 1.4 | 0.005 | ↑↑ | Riker, Talantov |
| ILMN_2714565 | Rrm2 | Mus musculus ribonucleotide reductase M2 polypeptide | 1.4 | 0.002 | ↑↑ | Riker, Talantov |
| ILMN_1214319 | Gemin6 | Mus musculus gem (nuclear organelle) associated protein 6 (Gemin6), mRNA. | 1.4 | 0.001 | ↑↑ | Riker, Talantov |
| ILMN_2632712 | Birc5 | Mus musculus baculoviral IAP repeat- containing 5 (Birc5), transcript variant 1, mRNA. | 1.4 | 0.006 | ↑↑ | Riker, Talantov |
| ILMN_2621422 | Kirrel | Mus musculus kin of IRRE like (Drosophila) (Kirrel), mRNA. | 1.3 | 0.026 | ↑↑ | Riker, Talantov |
| ILMN_2484707 | Tyms | Mus musculus thymidylate synthase (Tyms), mRNA. | 1.3 | 0.013 | ↑↑ | Riker, Talantov |
| ILMN_1218967 | Kif2c | Mus musculus kinesin family member 2C (Kif2c), mRNA. XM_986361 | 1.3 | 0.015 | ↑↑ | Riker, Talantov |
| ILMN_1233857 | Mcm6 | Mus musculus minichromosome maintenance deficient 6 (MIS5 homolog, S. pombe) (S. cerevisiae) (Mcm6), mRNA. | 1.3 | 0.012 | ↑↑ | Riker, Talantov |
| ILMN_2797642 | Ncaph/ Brrn1 | Mus musculus non-SMC condensin I complex, subunit H (Ncaph), mRNA. | 1.3 | 0.013 | ↑↑ | Riker, Talantov |
| ILMN_2677595 | Ncapg2/Mtb | Mus musculus non-SMC condensin II complex, subunit G2 (Ncapg2), mRNA. | 1.2 | 0.022 | ↑↑ | Riker, Talantov |
| ILMN_1245757 | Nans | Mus musculus N-acetylneuraminic acid synthase (sialic acid synthase) (Nans), mRNA. | 1.2 | 0.027 | ↑↑ | Riker, Talantov |
| ILMN_2804444 | Pcdh17 | Mus musculus protocadherin 17 (Pcdh17), mRNA. | 1.5 | 0.001 | ↑↑ | Riker |
| ILMN_2688944 | Htra2/ Prss25 | Mus musculus HtrA serine peptidase 2 (Htra2), nuclear gene encoding mitochondrial protein, mRNA. | 1.4 | 0.001 | ↑↑ | Riker |
| ILMN_2741050 | Rfc4 | Mus musculus replication factor C (activator 1) 4 (Rfc4), mRNA. | 1.4 | 0.013 | ↑↑ | Riker |
| ILMN_1257552 | Tars | Mus musculus threonyl-tRNA synthetase (Tars), mRNA. | 1.4 | 0.008 | ↑↑ | Riker |
| ILMN_3097131 | Timeless | Mus musculus timeless homolog (Drosophila) (Timeless), transcript variant 2, mRNA. | 1.3 | 0.013 | ↑↑ | Riker |
| ILMN_2975640 | Snrpg | Mus musculus small nuclear ribonucleoprotein polypeptide G (Snrpg), mRNA. | 1.2 | 0.013 | ↑↑ | Riker |
| ILMN_2711112 | Shcbp1 | Mus musculus Shc SH2-domain binding protein 1 (Shcbp1), mRNA. | 1.4 | 0.001 | ↑↑ | Talantov |
| ILMN_2607926 | Kdelr2 | Mus musculus KDEL (Lys-Asp-Glu-Leu) endoplasmic reticulum protein retention receptor 2 (Kdelr2), mRNA. | 1.4 | 0.002 | ↑↑ | Talantov |
| ILMN_2816754 | Ndc80/ Kntc2 | Mus musculus NDC80 homolog, kinetochore complex component (S. cerevisiae) (Ndc80), mRNA. | 1.4 | 0.006 | ↑↑ | Talantov |
| ILMN_2971845 | Dtymk | Mus musculus deoxythymidylate kinase (Dtymk), mRNA. | 1.4 | 0.006 | ↑↑ | Talantov |
| ILMN_2588362 | Cdca8 | Mus musculus cell division cycle associated 8 (Cdca8), mRNA. | 1.4 | 0.003 | ↑↑ | Talantov |
| ILMN_2934457 | Ran | Mus musculus RAN, member RAS oncogene family (Ran), mRNA. | 1.4 | 0.004 | ↑↑ | Talantov |
| ILMN_2999654 | Psmc3ip | Mus musculus proteasome (prosome, macropain) 26S subunit, ATPase 3, interacting protein (Psmc3ip), mRNA. | 1.4 | 0.003 | ↑↑ | Talantov |
| ILMN_2598852 | Ranbp1 | Mus musculus RAN binding protein 1 (Ranbp1), mRNA. | 1.3 | 0.007 | ↑↑ | Talantov |
| ILMN_2639036 | Hspd1 | Mus musculus heat shock protein 1 (chaperonin) (Hspd1), mRNA. | 1.3 | 0.011 | ↑↑ | Talantov |
| ILMN_2745005 | Gpn3/ MGC14 560 | Mus musculus GPN-loop GTPase 3 (Gpn3), mRNA. | 1.3 | 0.005 | ↑↑ | Talantov |
| ILMN_2919433 | Cdc45l/Cdc45 | Mus musculus cell division cycle 45 homolog (S. cerevisiae)-like (Cdc45l), mRNA. | 1.3 | 0.043 | ↑↑ | Talantov |
| ILMN_2749937 | Ncoa6 | Mus musculus nuclear receptor coactivator 6 (Ncoa6), mRNA. | 1.3 | 0.011 | ↑↓ | Talantov |
| ILMN_2605890 | Tk1 | Mus musculus thymidine kinase 1 (Tk1), mRNA. | 1.3 | 0.036 | ↑↑ | Talantov |
| ILMN_2706882 | Donson | Mus musculus downstream neighbor of SON (Donson), mRNA. | 1.3 | 0.028 | ↑↑ | Talantov |
| ILMN_2680648 | Atad2 | Mus musculus ATPase family, AAA domain containing 2 (Atad2), mRNA. | 1.3 | 0.026 | ↑↑ | Talantov |
| ILMN_2657844 | Cdc2a/ Cdk1 | Mus musculus cell division cycle 2 homolog A (S. pombe) (Cdc2a), mRNA. | 1.3 | 0.021 | ↑↑ | Talantov |
| ILMN_2608933 | Tcof1 | Mus musculus Treacher Collins Franceschetti syndrome 1, homolog (Tcof1), mRNA. | 1.2 | 0.030 | ↑↑ | Talantov |
| ILMN_1233065 | Rbmx | Mus musculus RNA binding motif protein, X chromosome (Rbmx), mRNA. | 1.2 | 0.053 | ↑↑ | Talantov |
| ILMN_1236574 | Cenpa | Mus musculus centromere protein A (Cenpa), mRNA. | 1.2 | 0.016 | ↑↑ | Talantov |
| ILMN_1221067 | Nme1 | Mus musculus non-metastatic cells 1, protein (NM23A) expressed in (Nme1), mRNA. | 1.2 | 0.006 | ↑↑ | Talantov |
| ILMN_2830661 | Top2a | Mus musculus topoisomerase (DNA) II alpha (Top2a), mRNA. | 1.2 | 0.025 | ↑↑ | Talantov |
| ILMN_2936427 | Mcm4 | Mus musculus minichromosome maintenance deficient 4 homolog (S. cerevisiae) (Mcm4), mRNA. | 1.2 | 0.050 | ↑↑ | Talantov |
| ILMN_2688912 | F10 | Mus musculus coagulation factor X | 0.4 | 0.012 | ↓↓ | Talantov |
DISCUSSION
In this study, we used DNA microarray technology to analyze the tumor microenvironment for transcriptomic patterns that might provide insight as to why the growth and metastasis of B16F10L melanoma was attenuated in apoA-I-expressing mice compared to A-I null animals [16]. We identified 535 transcripts that were differentially expressed in A-I KO and A-I Tg+/– tumors. Of these, 176 transcripts showed statistically significant differences between the two groups (adjusted FDR p < 0.05) with at least a 1.2-fold change in expression. We compared our gene expression dataset with published melanoma gene signatures and determined that the expression of 45% of genes associated with poor prognosis in human studies were concordant in tumors from A-I KO relative to A-I Tg+/–, thus validating our dataset for mechanistic mining purposes.
Cancer cells adapt their metabolism to fuel their increased proliferation and requisite need for biomass. Figure 3 illustrates that both glucose and glutamine are required for the de novo serine/glycine synthesis pathway. Several chemotherapeutic agents target this pathway, underscoring the significance of serine, glycine and one-carbon metabolism for tumor progression [41]. In this study, we identified the de novo serine synthesis pathway as a potential target for apoA-I anti-neoplastic activity. Phgdh, the gene encoding the first enzyme of this pathway, was the most repressed transcript in tumors recovered from A-I Tg+/– mice relative to A-I KO mice (Table 1B and Supplementary Table 2). This finding suggests that within the tumor cell and tumor microenvironment, apoA-I may inhibit a major metabolic pathway branching off the glycolytic cascade in melanoma.
In humans, the chromosomal locus of Phgdh (1p12) is amplified in a subset of melanoma and breast cancers (estrogen receptor-negative), and recent reports using an in vivo shRNA library screen and metabolomic profiling support the notion that increased expression of PHGDH promotes tumor growth trending with poor outcome [42, 43]. Importantly, shRNA against Phgdh suppressed tumor growth in a human breast xenograft model [43]. Thus, inhibition of PHGDH in cancers overexpressing this key enzyme affects glutamine flux into the TCA cycle as well as serine synthesis leading to growth arrest.
Increased copy number of the Phgdh gene in mice led to increased PHGDH expression and promoted the development of melanoma and breast cancer cells [44]. PHGDH was also recently reported to have a non-metabolic role in glioma tumorigenesis via stabilization of the transcription factor FOXM1 [45]. The expression of PHGDH (mRNA and protein), which is absent in normal brain tissue, was increased in gliomas as a direct function of tumor grade, with more aggressive tumors expressing higher levels of this protein [45]. Patient survival (5-year) within grade III and IV groups was 43.3% in the low-PHGDH expression group compared with 18.5% in the high-PHGDH expression group (p < 0.001), underscoring PHGDH as a prognostic marker for glioma [45]. Recent reports also identify FOXM1 as being overexpressed in metastatic melanoma [46, 47], and its targeting led to apoptosis in animal models of melanoma and in melanoma cells in culture [48, 49]. In our current study, FOXM1 was not differentially expressed in tumor tissue from A-I KO vs A-I Tg hosts. However, this does not rule out a role for this transcription factor in concert with PHGDH to effect melanoma progression in our animal model.
In this study, we also identified the mevalonate pathway as a potential target for apoA-I anti-tumor activity (Figure 5). Transcripts for five enzymes in this pathway were downregulated in tumors from A-I Tg+/– mice (Figure 5, enzymes highlighted in box). The mevalonate pathway feeds into several growth promoting pathways including cell signaling, lipid metabolism, cell structure, and nutrient levels [50], and has also been identified as a positive regulator of YAP and TAZ proto-oncogenes, which are targets of the Hippo tumor-suppressor pathway [51, 52]. The transcriptional expression of YAP is driven by the ETS transcript factor GA-binding protein (GABP) [53]. Interestingly, GABP DNA-binding elements were significantly enriched in the promoter region of genes down regulated in this study’s dataset (data not shown). Inactivating mutations in the tumor suppressor gene p53 has also been correlated with increased expression of mevalonate pathway genes [54]. In cancers expressing mutant p53, the latter acts as a coactivator of SREBP (sterol regulatory element-binding protein), and serves as the positive master transcription factor for enzymes of the mevalonate pathway and for fatty acid synthesis [55].
The YAP/TAZ proto-oncogenes promote cancer stemness and metastatic potential [56, 57]. Inhibition of the mevalonate pathway by statins leads to transcriptional repression of the YAP-dependent pro-metastatic gene RHAMM in breast cancer cells expressing mutant p53 [58, 59]. Four (Sqle, Cyp51, Hsd17b7, and Dhcr24) of the five negatively regulated genes in this study’s dataset are in the sterol synthesis arm of mevalonate pathway (Figure 5). The fifth, Mvd, which encodes mevalonate-5-pyrophosphate decarboxylase, is upstream of the branching point (farnesyl-diphosphate; farnesyl-PP in Figure 5) in the pathway. Thus, inhibition of MVD is likely to have a larger impact, as it affects all branches of the mevalonate pathway. The anti-tumor effect of statin therapy via inhibition of the mevalonate pathway appears to be restricted to cancers expressing mutant p53, and in breast cancers is further restricted to the hormone receptor negative subtypes (ER-/PR-) [55]. B16F10, the murine melanoma cell line used in this study expresses mutant p53 [60]. Recently, the ATP-binding cassette transporter A1 (ABCA1), which facilitates the active efflux of lipids and cholesterol to apoA-I thereby initiating HDL biogenesis, was identified as a transcriptional target of wild-type p53, and mediator of p53 inhibition of the mevalonate pathway via SREBP-2 maturation, in a murine model of liver cancer [61]. Whether apoA-I mediates mevalonate pathway inhibition through the p53/SREBP arm in melanoma remains to be determined.
Supplementary Table 2 lists genes that were downregulated in tumors from A-I Tg+/– animals (relative to A-I KO) and encode proteins that included Dicer, Adamts1 and Cdc20. Dicer, an RNase III family member, processes precursor miRNAs to smaller active species. In melanoma, miRNA have been shown to be deregulated in cell lines [62–64], metastatic lesions ([65], and primary clinical samples [66]. Increased Dicer expression was correlated with progression of melanoma from common melanocytic nevus to invasive melanoma [67]. The extracellular protease Adamts1 (a disintegrin and metalloproteinase with thrombospondin motifs 1) has been implicated in promoting cancer [68], and stroma-derived Adamts1 was recently shown to drive both the growth and metastasis of melanoma [69]. ApoA-I likely inhibits expression of Adamts1 in both tumor and stromal cells, though the mechanism remains to be elucidated.
Cdc20, a key cell cycle regulator of spindle checkpoint and mitotic exit, is suppressed by p53 tumor suppressor protein and is frequently up regulated in cancers due to inactivation of p53 [70]. Recently, systemic delivery of Cdc20 siRNA by intraperitoneal injection was shown to inhibit B16F10 melanoma growth in tumor bearing mice [71, 72] and Cdc20 has been proposed as a cancer therapeutic target [72]. In the present study, two separate probes specific for Cdc20 showed statistically significant reduced expression in 11 separate tumors resected from A-I Tg+/– animals relative to A-I KO (Supplementary Table 2).
The emerging theme in this study is that in animals expressing apoA-I, two major metabolic pathways, namely the mevalonate and serine synthesis pathways, are inhibited within the melanoma tumor microenvironment. The products of these pathways provide molecules indispensable for synthesis of essential lipids, proteins, and nucleic acids, and inhibitors of the mevalonate pathway have been shown to suppress tumor development and metastasis in both mouse [73, 74] and human melanoma cells [75, 76]. The mechanism (s) by which increased levels of apoA-I in host animals engenders this inhibition remains to be elucidated. The apoA-I receptor ABCA1 was shown to mediate inhibition of the mevalonate pathway via SREBP-2 maturation [61]. ABCA1, ABCG1 (HDL receptor) and SRBP-1 (HDL receptor) are candidates for further investigation as potential mediators of apoA-I anti-tumor activity in B16F10 melanoma.
Finally, recent studies with statin treatment of melanoma cells concluded that inhibition of the mevalonate pathway stimulates melanoma immunogenicity [76] and leads to increased adaptive [77, 78] and innate [75] immune response against the tumor [76]. Our current study comparing A-I Tg+/– and A-I KO tumor bearing mice suggest that apoA-I may target cancer metabolism. Importantly, we observed an inverse correlation between circulating HDL-c and transcript levels of Phgdh and five enzymes of the mevalonate pathway (Mvd, Sqle, Cyp51, Hsd17b7, and Dhcr24) in tumor bed, suggestive of an inhibitory role for apoA-I/HDL in cancer cell metabolism (Figure 6). Thus, apoA-I has emerged as a viable therapeutic participant at the crossroads between cardiovascular disease and cancer, considering the growing evidence of biological and mechanistic overlap between these two main causes of mortality worldwide [79–81].
Materials and Methods
All chemicals were from Sigma Chemical (St. Louis, MO) and all solvents were HPLC grade unless otherwise indicated.
Mice
All mouse studies were performed under approved Institutional Animal Care and Use Committee protocols at the Cleveland Clinic. C57BL/6J (wild type (WT) mice), A-I KO, A-I Tg+/+, mice were purchased from Jackson Laboratories and bred at Cleveland Clinic’s Biological Research Unit (BRU).
Plasma HDL-c levels
Blood was drawn at the time of tumor resection by cardiac puncture from anaesthetized (300 mg/kg ketamine (Ketaset (Ketamine HCl Injection, USP) Zoetis 100 mg/mL) plus 30 mg/kg xylazine (AnaSed Injection Akorn Animal Health 100 mg/mL NDC 59399-111-50) mice on day-7 post tumor inoculation. Plasma (EDTA) was separated and diluted in saline for HDL-c measurements on an Architect ci8200 (Abbott Diagnostics, Abbot Park, IL) using the Ultra HDL assay kit (3K33-20).
Tumor cell line
Mouse tumor cell lines B16F10 melanoma were obtained from American Type Culture Collection (ATTC, Bethesda, MD) and cultured in DMEM supplemented with 10% heat-inactivated fetal calf serum (FCS), 2 mM L-glutamine and antibiotic/antimycotic (Invitrogen, Grand Island, NY) at 37°C and 5% CO2 in a humidified atmosphere. B16F10L was isolated from lung metastasis in WT C57BL/6J and a variant expressing luciferase (firefly, Photinus pyralis) was engineered by cotransfecting B16F10L cells with pKCPIRlucBGH5.3 (kind gift from Yan Xu, Indiana University School of Medicine) and pcDNA3 (Invitrogen, 3:1 ratio) using Lipofectamine (Invitrogen) and selected with 1.1 mg/mL G418 (Invitrogen) over 3 wk. Pools of luciferase expressing tumor cells were used for the study.
RNA isolation from tumor tissue
Eight to ten (8–10) week male and female animals were inoculated subcutaneously on both flanks with 105 B16F10L tumor cells per site (2 sites/flank). Tumor tissue from one flank was resected on day 7 post inoculation and stored in RNA later. Tumor tissue (30 mg) was homogenized with zirconium oxide beads using the Bullet blender tissue homogenizer (Next Advance, Troy, NY, USA) and total RNA was prepared (RNeasy Mini kit, Qiagen, Valencia, CA) with on column DNase treatment (Cat# 79254, Qiagen).
Gene expression analysis
Global gene expression patterns were obtained using Illumina gene chips. Total RNA, prepared as described above, was amplified and biotinylated for hybridization to Illumina Murine Beadchips (mouseRef-8 v.2, Illumina, Inc., San Diego, CA) using Illumina TotalPrep RNA Amplification Kit (AMIL1791, Applied Biosystems, Life Technologies) according to the manufacturer’s protocol. Arrays were scanned in an Illumina Bead Station and the images were processed using Illumina Bead Studio software. The complete microarray data have been deposited in the Gene Express Omnibus (GEO) database (GEO: GSE137532). Gene expression profiles were compared using unsupervised hierarchical clustering analysis.
Validation of mouse gene expression set with studies with human melanoma
Gene expression data were analyzed in GenomeStudio. Raw data were quantile-normalized, background corrected, and filtered with a detection p < 0.05 and a 1.2-fold-change in expression between A-I KO and A-I Tg+/–. One-hundred-thirty (130) human genes previously identified as part of a gene signature associated with poor prognosis in melanoma [8] were compared with genes identified in this study from the differential analysis of day 7 B16F10L melanoma tumors with respect to fold-change (A-I KO/A-I Tg+/–) in expression signal normalized to beta-2-microglobulin with a p-value cut off < 0.05 (Student’s t-test). The human microarray study identified the expression profile of genes associated with 4-year distant metastasis-free survival, metastasis, or death among 58 patients with 4-yr follow up [8]. Of the 250 human genes identified, only 130 were eligible for comparison in our current study.
Statistical analysis of gene expression data: unbiased mining for significant genes with differential regulation in A-I Tg+/-vs A-I KO mouse tumors
Raw data were read in GenomeStudio and exported for further data processing and analysis in R software (http://www.r-project.org/). Analyses were done on the data after force-positive background correction, log2 transformation, and quantile normalization. Quality control analysis was performed. Comparisons were made to check differences between each of two groups Tg+/– vs KO and WT vs KO. The comparisons were performed using linear models. Empirical Bayes and other shrinkage methods were used to borrow information across genes. FDR (Benjamini & Hochberg correction,) adjusted p-values were calculated to account for multi-testing. R limma package was used. Genes are significantly expressed if FDR adjusted p< 0.05. Volcano plots were made to show both the statistical significance (y axis, -log10(p- value), the higher the number is, the more significant the test is) and biological significance (x axis, log2(Fold-Change), the further right from the zero point, the more upregulated, the further left, the more down regulated). Heatmap and dendrogram from unsupervised hierarchical clustering analysis were plotted.
Bioinformatics analyses
Functional annotation of statistically significant list of genes, in terms of how they relate to key processes or pathways of interest, were obtained using publicly available genome annotation tools and pathway databases such as KEGG, DAVID, GOTermMapper, GOTermFinder, Mouse Genome Informatics, and the commercial pathway analysis tools Metacore (Metacore™, https://portal.genego.com/) and Ingenuity Pathway Analysis (Ingenuity® Systems, http://www.ingenuity.com/). Commercial pathway databases were used in addition to publicly available databases because they provided more comprehensive functional information for these genes, not only in the context of physiological processes and pathway but also their molecular interaction networks, drug targets, diseases, and other vital information. For genes that did not map to any known pathways, a map of proteins interacting upstream or downstream of these genes were obtained from these commercially available pathway analysis. The data discussed in this publication have been deposited in NCBI′s Gene Expression Omnibus (Edgar et al., 2002) and are accessible through GEO Series accession number GSE137532, https://www.ncbi.nlm.nih.gov/geo/query/acc.cgi?acc= GSE137532).
Abbreviations
3PG: 3-phosphoglycerate; A-I KO: apoA-I knockout; A-I Tg+/–: apoA-I transgenic (heterozygous); ABCA1: ATP binding cassette subfamily A member 1; ABCG1: ATP-binding cassette (ABC) G-1; Adamts1: a disintegrin and metalloproteinase with thrombospondin type 1 motif; aKG: alpha-ketoglutarate; ApoA-I: apolipoprotein A-I; Cdc20: cell division cycle 20 homolog; Cyp51: sterol 14α-demethylase cytochrome P450; Dhcr24: 24-dehydrocholesterol reductase; F10: vitamin K-dependent coagulation factor X; FDR: false discovery rate; FOXM1: forkhead box protein M1; GABP: GA-binding protein; Glu: glutamate; HDL: high density lipoprotein; HDL-c: high density lipoprotein-cholesterol; HMG-CoA: 3-hydroxy-3-methyl-glutaryl-co-enzyme A; Hsd17b7: 3-keto-steroid reductase; IPA: Ingenuity pathway Analysis; MVD: mevalonate-5-pyrophosphate decarboxylase; Ncoa6: nuclear receptor coactivator 6; P-PYR: 3-phospho-hydroxypyruvate; P-serine: phosphoserine; Phgdh: phosphoglycerate dehydrogenase; PSAT1: phosphoserine aminotransferase; PSPH: phosphoserine phosphatase; RHAMM: hyaluronan-mediated motility receptor; Sqle: squalene epoxidase; SREBP: sterol regulatory element-binding protein; TAZ: tafazzin; TCA cycle: the citric acid cycle; WT: wild type; YAP: yes-associated protein.
ACKNOWLEDGMENTS
We thank the Flow Cytometry, Genomics Resource, and Tumor Biology Cores at the Lerner Research Institute for assistance.
CONFLICTS OF INTEREST
Dr. Hazen reports being named as co-inventor on pending and issued patents held by the Cleveland Clinic relating to cardiovascular diagnostics and therapeutics. Dr. Hazen also reports being a paid consultant for P&G, having received research funds from P&G and Roche Diagnostics, and being eligible to receive royalty payments for inventions or discoveries related to cardiovascular diagnostics or therapeutics from Cleveland HeartLab and P&G. All remaining authors declare that they have no conflicts of interest with the contents of this article.
FUNDING
This study was supported by National Institutes of Health grants R01 HL128300, P01 HL098055, P01 HL076491 (SLH), and the Athymic Animal and Xenograft Core of the Case Comprehensive Cancer Center (NCI P30 CA043703). This work was also supported in part by a grant from the LeDucq Fondation. SLH is also partially supported by a gift from the Leonard Krieger fund.
References
1. Godar DE. Worldwide increasing incidences of cutaneous malignant melanoma. J Skin Cancer. 2011; 2011:858425. https://doi.org/10.1155/2011/858425. [PubMed].
2. Linos E, Swetter SM, Cockburn MG, Colditz GA, Clarke CA. Increasing burden of melanoma in the United States. J Invest Dermatol. 2009; 129:1666–74. https://doi.org/10.1038/jid.2008.423. [PubMed].
3. MacKie RM, Bray CA, Hole DJ, Morris A, Nicolson M, Evans A, Doherty V, Vestey J; Scottish Melanoma Group. Incidence of and survival from malignant melanoma in Scotland: an epidemiological study. Lancet. 2002; 360:587–591. https://doi.org/10.1016/S0140-6736(02)09779-9. [PubMed].
4. van den Hurk K, Niessen HE, Veeck J, van den Oord JJ, van Steensel MA, Zur Hausen A, van Engeland M, Winnepenninckx VJ. Genetics and epigenetics of cutaneous malignant melanoma: a concert out of tune. Biochim Biophys Acta. 2012; 1826:89–102. https://doi.org/10.1016/j.bbcan.2012.03.011. [PubMed].
5. Alonso SR, Tracey L, Ortiz P, Perez-Gomez B, Palacios J, Pollan M, Linares J, Serrano S, Saez-Castillo AI, Sanchez L, Pajares R, Sanchez-Aguilera A, Artiga MJ, et al. A high-throughput study in melanoma identifies epithelial-mesenchymal transition as a major determinant of metastasis. Cancer Res. 2007; 67:3450–3460. https://doi.org/10.1158/0008-5472.CAN-06-3481. [PubMed].
6. Haqq C, Nosrati M, Sudilovsky D, Crothers J, Khodabakhsh D, Pulliam BL, Federman S, Miller JR 3rd, Allen RE, Singer MI, Leong SP, Ljung BM, Sagebiel RW, et al. The gene expression signatures of melanoma progression. Proc Natl Acad Sci U S A. 2005; 102:6092–6097. https://doi.org/10.1073/pnas.0501564102. [PubMed].
7. Talantov D, Mazumder A, Yu JX, Briggs T, Jiang Y, Backus J, Atkins D, Wang Y. Novel genes associated with malignant melanoma but not benign melanocytic lesions. Clin Cancer Res. 2005; 11:7234–7242. https://doi.org/10.1158/1078-0432.CCR-05-0683. [PubMed].
8. Winnepenninckx V, Lazar V, Michiels S, Dessen P, Stas M, Alonso SR, Avril MF, Ortiz Romero PL, Robert T, Balacescu O, Eggermont AM, Lenoir G, Sarasin A, et al. Gene expression profiling of primary cutaneous melanoma and clinical outcome. J Natl Cancer Inst. 2006; 98:472–82. https://doi.org/10.1093/jnci/djj103. [PubMed].
9. Bittner M, Meltzer P, Chen Y, Jiang Y, Seftor E, Hendrix M, Radmacher M, Simon R, Yakhini Z, Ben-Dor A, Sampas N, Dougherty E, Wang E, et al. Molecular classification of cutaneous malignant melanoma by gene expression profiling. Nature. 2000; 406:536–540. https://doi.org/10.1038/35020115. [PubMed].
10. Carr KM, Bittner M, Trent JM. Gene-expression profiling in human cutaneous melanoma. Oncogene. 2003; 22:3076–3080. https://doi.org/10.1038/sj.onc.1206448. [PubMed].
11. Clark EA, Golub TR, Lander ES, Hynes RO. Genomic analysis of metastasis reveals an essential role for RhoC. Nature. 2000; 406:532–535. https://doi.org/10.1038/35020106. [PubMed].
12. Hoek K, Rimm DL, Williams KR, Zhao H, Ariyan S, Lin A, Kluger HM, Berger AJ, Cheng E, Trombetta ES, Wu T, Niinobe M, Yoshikawa K, et al. Expression profiling reveals novel pathways in the transformation of melanocytes to melanomas. Cancer Res. 2004; 64:5270–5282. https://doi.org/10.1158/0008-5472.CAN-04-0731. [PubMed].
13. Khera AV, Cuchel M, de la Llera-Moya M, Rodrigues A, Burke MF, Jafri K, French BC, Phillips JA, Mucksavage ML, Wilensky RL, Mohler ER, Rothblat GH, Rader DJ. Cholesterol efflux capacity, high-density lipoprotein function, and atherosclerosis. N Engl J Med. 2011; 364:127–135. https://doi.org/10.1056/NEJMoa1001689. [PubMed].
14. Rye KA, Bursill CA, Lambert G, Tabet F, Barter PJ. The metabolism and anti-atherogenic properties of HDL. J Lipid Res. 2009; 50:S195–S200. https://doi.org/10.1194/jlr.R800034-JLR200. [PubMed].
15. Jafri H, Alsheikh-Ali AA, Karas RH. Baseline and on-treatment high-density lipoprotein cholesterol and the risk of cancer in randomized controlled trials of lipid-altering therapy. J Am Coll Cardiol. 2010; 55:2846–2854. https://doi.org/10.1016/j.jacc.2009.12.069. [PubMed].
16. Zamanian-Daryoush M, Lindner D, Tallant TC, Wang Z, Buffa J, Klipfell E, Parker Y, Hatala D, Parsons-Wingerter P, Rayman P, Yusufishaq MS, Fisher EA, Smith JD, et al. The cardioprotective protein apolipoprotein A1 promotes potent anti-tumorigenic effects. J Biol Chem. 2013; 288:21237–21252. https://doi.org/10.1074/jbc.M113.468967. [PubMed].
17. Daye D, Wellen KE. Metabolic reprogramming in cancer: unraveling the role of glutamine in tumorigenesis. Semin Cell Dev Biol. 2012; 23:362–369. https://doi.org/10.1016/j.semcdb.2012.02.002. [PubMed].
18. Hsu PP, Sabatini DM. Cancer cell metabolism: Warburg and beyond. Cell. 2008; 134:703–707. https://doi.org/10.1016/j.cell.2008.08.021. [PubMed].
19. Johnson C, Warmoes MO, Shen X, Locasale JW. Epigenetics and cancer metabolism. Cancer Lett. 2015; 356:309–314. https://doi.org/10.1016/j.canlet.2013.09.043. [PubMed].
20. Vander Heiden MG, Cantley LC, Thompson CB. Understanding the Warburg effect: the metabolic requirements of cell proliferation. Science. 2009; 324:1029–1033. https://doi.org/10.1126/science.1160809. [PubMed].
21. Gruenbacher G, Thurnher M. Mevalonate Metabolism in Cancer Stemness and Trained Immunity. Front Oncol. 2018; 8:394. https://doi.org/10.3389/fonc.2018.00394. [PubMed].
22. Kuzu OF, Noory MA, Robertson GP. The Role of Cholesterol in Cancer. Cancer Res. 2016; 76:2063–2070. https://doi.org/10.1158/0008-5472.CAN-15-2613. [PubMed].
23. Berndt N, Hamilton AD, Sebti SM. Targeting protein prenylation for cancer therapy. Nat Rev Cancer. 2011; 11:775–791. https://doi.org/10.1038/nrc3151. [PubMed].
24. Clendening JW, Penn LZ. Targeting tumor cell metabolism with statins. Oncogene. 2012; 31:4967–4978. https://doi.org/10.1038/onc.2012.6. [PubMed].
25. Jones NP, Schulze A. Targeting cancer metabolism–aiming at a tumour’s sweet-spot. Drug Discov Today. 2012; 17:232–241. https://doi.org/10.1016/j.drudis.2011.12.017. [PubMed].
26. Pratt MR. Small-molecule reprogramming of cancer metabolism. Chem Biol. 2012; 19:1084–1085. https://doi.org/10.1016/j.chembiol.2012.09.001. [PubMed].
27. Swanson KM, Hohl RJ. Anti-cancer therapy: targeting the mevalonate pathway. Curr Cancer Drug Targets. 2006; 6:15–37. https://doi.org/10.2174/156800906775471743. [PubMed].
28. Boudreau DM, Yu O, Johnson J. Statin use and cancer risk: a comprehensive review. Expert Opin Drug Saf. 2010; 9:603–621. https://doi.org/10.1517/14740331003662620. [PubMed].
29. Graaf MR, Beiderbeck AB, Egberts AC, Richel DJ, Guchelaar HJ. The risk of cancer in users of statins. J Clin Oncol. 2004; 22:2388–2394. https://doi.org/10.1200/JCO.2004.02.027. [PubMed].
30. Hindler K, Cleeland CS, Rivera E, Collard CD. The role of statins in cancer therapy. Oncologist. 2006; 11:306–315. https://doi.org/10.1634/theoncologist.11-3-306. [PubMed].
31. Safwat S, Ishak RA, Hathout RM, Mortada ND. Statins anticancer targeted delivery systems: re-purposing an old molecule. J Pharm Pharmacol. 2017; 69:613–624. https://doi.org/10.1111/jphp.12707. [PubMed].
32. Alfaqih MA, Allott EH, Hamilton RJ, Freeman MR, Freedland SJ. The current evidence on statin use and prostate cancer prevention: are we there yet? Nat Rev Urol. 2017; 14:107–119. https://doi.org/10.1038/nrurol.2016.199. [PubMed].
33. Cardwell CR, Mc Menamin U, Hughes CM, Murray LJ. Statin use and survival from lung cancer: a population-based cohort study. Cancer Epidemiol Biomarkers Prev. 2015; 24:833–841. https://doi.org/10.1158/1055-9965.EPI-15-0052. [PubMed].
34. Gray RT, Coleman HG, Hughes C, Murray LJ, Cardwell CR. Statin use and survival in colorectal cancer: Results from a population-based cohort study and an updated systematic review and meta-analysis. Cancer Epidemiol. 2016; 45:71–81. https://doi.org/10.1016/j.canep.2016.10.004. [PubMed].
35. Huang WY, Li CH, Lin CL, Liang JA. Long-term statin use in patients with lung cancer and dyslipidemia reduces the risk of death. Oncotarget. 2016; 7:42208–42215. https://doi.org/10.18632/oncotarget.9906. [PubMed].
36. Manthravadi S, Shrestha A, Madhusudhana S. Impact of statin use on cancer recurrence and mortality in breast cancer: A systematic review and meta-analysis. Int J Cancer. 2016; 139:1281–1288. https://doi.org/10.1002/ijc.30185. [PubMed].
37. Nayan M, Punjani N, Juurlink DN, Finelli A, Austin PC, Kulkarni GS, Uleryk E, Hamilton RJ. Statin use and kidney cancer survival outcomes: A systematic review and meta-analysis. Cancer Treat Rev. 2017; 52:105–116. https://doi.org/10.1016/j.ctrv.2016.11.009. [PubMed].
38. Nielsen SF, Nordestgaard BG, Bojesen SE. Statin use and reduced cancer-related mortality. N Engl J Med. 2012; 367:1792–1802. https://doi.org/10.1056/NEJMoa1201735. [PubMed].
39. Wu QJ, Tu C, Li YY, Zhu J, Qian KQ, Li WJ, Wu L. Statin use and breast cancer survival and risk: a systematic review and meta-analysis. Oncotarget. 2015; 6:42988–43004. https://doi.org/10.18632/oncotarget.5557. [PubMed].
40. Riker AI, Enkemann SA, Fodstad O, Liu S, Ren S, Morris C, Xi Y, Howell P, Metge B, Samant RS, Shevde LA, Li W, Eschrich S, et al. The gene expression profiles of primary and metastatic melanoma yields a transition point of tumor progression and metastasis. BMC Med Genomics. 2008; 1:13. https://doi.org/10.1186/1755-8794-1-13. [PubMed].
41. Locasale JW. Serine, glycine and one-carbon units: cancer metabolism in full circle. Nat Rev Cancer. 2013; 13:572–583. https://doi.org/10.1038/nrc3557. [PubMed].
42. Locasale JW, Grassian AR, Melman T, Lyssiotis CA, Mattaini KR, Bass AJ, Heffron G, Metallo CM, Muranen T, Sharfi H, Sasaki AT, Anastasiou D, Mullarky E, et al. Phosphoglycerate dehydrogenase diverts glycolytic flux and contributes to oncogenesis. Nat Genet. 2011; 43:869–874. https://doi.org/10.1038/ng.890. [PubMed].
43. Possemato R, Marks KM, Shaul YD, Pacold ME, Kim D, Birsoy K, Sethumadhavan S, Woo HK, Jang HG, Jha AK, Chen WW, Barrett FG, Stransky N, et al. Functional genomics reveal that the serine synthesis pathway is essential in breast cancer. Nature. 2011; 476:346–350. https://doi.org/10.1038/nature10350. [PubMed].
44. Sullivan MR, Mattaini KR, Dennstedt EA, Nguyen AA, Sivanand S, Reilly MF, Meeth K, Muir A, Darnell AM, Bosenberg MW, Lewis CA, Vander Heiden MG. Increased Serine Synthesis Provides an Advantage for Tumors Arising in Tissues Where Serine Levels Are Limiting. Cell Metab. 2019; 29:1410–21.e4. https://doi.org/10.1016/j.cmet.2019.02.015. [PubMed].
45. Liu J, Guo S, Li Q, Yang L, Xia Z, Zhang L, Huang Z, Zhang N. Phosphoglycerate dehydrogenase induces glioma cells proliferation and invasion by stabilizing forkhead box M1. J Neurooncol. 2013; 111:245–255. https://doi.org/10.1007/s11060-012-1018-x. [PubMed].
46. Ito T, Kohashi K, Yamada Y, Maekawa A, Kuda M, Furue M, Oda Y. Prognostic significance of forkhead box M1 (FoxM1) expression and antitumour effect of FoxM1 inhibition in melanoma. Histopathology. 2016; 69:63–71. https://doi.org/10.1111/his.12909. [PubMed].
47. Miyashita A, Fukushima S, Nakahara S, Yamashita J, Tokuzumi A, Aoi J, Ichihara A, Kanemaru H, Jinnin M, Ihn H. Investigation of FOXM1 as a Potential New Target for Melanoma. PLoS One. 2015; 10:e0144241. https://doi.org/10.1371/journal.pone.0144241. [PubMed].
48. Bhat UG, Zipfel PA, Tyler DS, Gartel AL. Novel anticancer compounds induce apoptosis in melanoma cells. Cell Cycle. 2008; 7:1851–1855. https://doi.org/10.4161/cc.7.12.6032. [PubMed].
49. Kruiswijk F, Hasenfuss SC, Sivapatham R, Baar MP, Putavet D, Naipal KA, van den Broek NJ, Kruit W, van der Spek PJ, van Gent DC, Brenkman AB, Campisi J, Burgering BM, et al. Targeted inhibition of metastatic melanoma through interference with Pin1-FOXM1 signaling. Oncogene. 2016; 35:2166–2177. https://doi.org/10.1038/onc.2015.282. [PubMed].
50. Mullen PJ, Yu R, Longo J, Archer MC, Penn LZ. The interplay between cell signalling and the mevalonate pathway in cancer. Nat Rev Cancer. 2016; 16:718–731. https://doi.org/10.1038/nrc.2016.76. [PubMed].
51. Sorrentino G, Ruggeri N, Specchia V, Cordenonsi M, Mano M, Dupont S, Manfrin A, Ingallina E, Sommaggio R, Piazza S, Rosato A, Piccolo S, Del Sal G. Metabolic control of YAP and TAZ by the mevalonate pathway. Nat Cell Biol. 2014; 16:357–366. https://doi.org/10.1038/ncb2936. [PubMed].
52. Santinon G, Pocaterra A, Dupont S. Control of YAP/TAZ Activity by Metabolic and Nutrient-Sensing Pathways. Trends Cell Biol. 2016; 26:289–299. https://doi.org/10.1016/j.tcb.2015.11.004. [PubMed].
53. Wu H, Xiao Y, Zhang S, Ji S, Wei L, Fan F, Geng J, Tian J, Sun X, Qin F, Jin C, Lin J, Yin ZY, et al. The Ets transcription factor GABP is a component of the hippo pathway essential for growth and antioxidant defense. Cell Rep. 2013; 3:1663–1677. https://doi.org/10.1016/j.celrep.2013.04.020. [PubMed].
54. Freed-Pastor WA, Prives C. Mutant p53: one name, many proteins. Genes Dev. 2012; 26:1268–1286. https://doi.org/10.1101/gad.190678.112. [PubMed].
55. Freed-Pastor WA, Mizuno H, Zhao X, Langerod A, Moon SH, Rodriguez-Barrueco R, Barsotti A, Chicas A, Li W, Polotskaia A, Bissell MJ, Osborne TF, Tian B, et al. Mutant p53 disrupts mammary tissue architecture via the mevalonate pathway. Cell. 2012; 148:244–258. https://doi.org/10.1016/j.cell.2011.12.017. [PubMed].
56. Chen D, Sun Y, Wei Y, Zhang P, Rezaeian AH, Teruya-Feldstein J, Gupta S, Liang H, Lin HK, Hung MC, Ma L. LIFR is a breast cancer metastasis suppressor upstream of the Hippo-YAP pathway and a prognostic marker. Nat Med. 2012; 18:1511–1517. https://doi.org/10.1038/nm.2940. [PubMed].
57. Cordenonsi M, Zanconato F, Azzolin L, Forcato M, Rosato A, Frasson C, Inui M, Montagner M, Parenti AR, Poletti A, Daidone MG, Dupont S, Basso G, et al. The Hippo transducer TAZ confers cancer stem cell-related traits on breast cancer cells. Cell. 2011; 147:759–772. https://doi.org/10.1016/j.cell.2011.09.048. [PubMed].
58. Girardini JE, Napoli M, Piazza S, Rustighi A, Marotta C, Radaelli E, Capaci V, Jordan L, Quinlan P, Thompson A, Mano M, Rosato A, Crook T, et al. A Pin1/mutant p53 axis promotes aggressiveness in breast cancer. Cancer Cell. 2011; 20:79–91. https://doi.org/10.1016/j.ccr.2011.06.004. [PubMed].
59. Wang Z, Wu Y, Wang H, Zhang Y, Mei L, Fang X, Zhang X, Zhang F, Chen H, Liu Y, Jiang Y, Sun S, Zheng Y, et al. Interplay of mevalonate and Hippo pathways regulates RHAMM transcription via YAP to modulate breast cancer cell motility. Proc Natl Acad Sci U S A. 2014; 111:E89–E98. https://doi.org/10.1073/pnas.1319190110. [PubMed].
60. Mansour M, Pohajdak B, Kast WM, Fuentes-Ortega A, Korets-Smith E, Weir GM, Brown RG, Daftarian P. Therapy of established B16-F10 melanoma tumors by a single vaccination of CTL/T helper peptides in VacciMax. J Transl Med. 2007; 5:20. https://doi.org/10.1186/1479-5876-5-20. [PubMed].
61. Moon SH, Huang CH, Houlihan SL, Regunath K, Freed-Pastor WA, Morris JP 4th, Tschaharganeh DF, Kastenhuber ER, Barsotti AM, Culp-Hill R, Xue W, Ho YJ, Baslan T, et al. p53 Represses the Mevalonate Pathway to Mediate Tumor Suppression. Cell. 2019; 176:564–80.e19. https://doi.org/10.1016/j.cell.2018.11.011. [PubMed].
62. Caramuta S, Egyhazi S, Rodolfo M, Witten D, Hansson J, Larsson C, Lui WO. MicroRNA expression profiles associated with mutational status and survival in malignant melanoma. J Invest Dermatol. 2010; 130:2062–2070. https://doi.org/10.1038/jid.2010.63. [PubMed].
63. Mueller DW, Rehli M, Bosserhoff AK. miRNA expression profiling in melanocytes and melanoma cell lines reveals miRNAs associated with formation and progression of malignant melanoma. J Invest Dermatol. 2009; 129:1740–1751. https://doi.org/10.1038/jid.2008.452. [PubMed].
64. Stark MS, Tyagi S, Nancarrow DJ, Boyle GM, Cook AL, Whiteman DC, Parsons PG, Schmidt C, Sturm RA, Hayward NK. Characterization of the Melanoma miRNAome by Deep Sequencing. PLoS One. 2010; 5:e9685. https://doi.org/10.1371/journal.pone.0009685. [PubMed].
65. Segura MF, Belitskaya-Levy I, Rose AE, Zakrzewski J, Gaziel A, Hanniford D, Darvishian F, Berman RS, Shapiro RL, Pavlick AC, Osman I, Hernando E. Melanoma MicroRNA signature predicts post-recurrence survival. Clin Cancer Res. 2010; 16:1577–1586. https://doi.org/10.1158/1078-0432.CCR-09-2721. [PubMed].
66. Jukic DM, Rao UN, Kelly L, Skaf JS, Drogowski LM, Kirkwood JM, Panelli MC. Microrna profiling analysis of differences between the melanoma of young adults and older adults. J Transl Med. 2010; 8:27. https://doi.org/10.1186/1479-5876-8-27. [PubMed].
67. Ma Z, Swede H, Cassarino D, Fleming E, Fire A, Dadras SS. Up-regulated Dicer expression in patients with cutaneous melanoma. PLoS One. 2011; 6:e20494. https://doi.org/10.1371/journal.pone.0020494. [PubMed].
68. Cal S, Lopez-Otin C. ADAMTS proteases and cancer. Matrix Biol. 2015; 44–46:77–85. https://doi.org/10.1016/j.matbio.2015.01.013. [PubMed].
69. Fernandez-Rodriguez R, Rodriguez-Baena FJ, Martino-Echarri E, Peris-Torres C, Plaza-Calonge MD, Rodriguez-Manzaneque JC. Stroma-derived but not tumor ADAMTS1 is a main driver of tumor growth and metastasis. Oncotarget. 2016; 7:34507–19. https://doi.org/10.18632/oncotarget.8922. [PubMed].
70. Kidokoro T, Tanikawa C, Furukawa Y, Katagiri T, Nakamura Y, Matsuda K. CDC20, a potential cancer therapeutic target, is negatively regulated by p53. Oncogene. 2008; 27:1562–1571. https://doi.org/10.1038/sj.onc.1210799. [PubMed].
71. Mukherjee A, Bhattacharyya J, Sagar MV, Chaudhuri A. Liposomally encapsulated CDC20 siRNA inhibits both solid melanoma tumor growth and spontaneous growth of intravenously injected melanoma cells on mouse lung. Drug Deliv Transl Res. 2013; 3:224–234. https://doi.org/10.1007/s13346-013-0141-3. [PubMed].
72. Wang Z, Wan L, Zhong J, Inuzuka H, Liu P, Sarkar FH, Wei W. Cdc20: a potential novel therapeutic target for cancer treatment. Curr Pharm Des. 2013; 19:3210–3214. https://doi.org/10.2174/1381612811319180005. [PubMed].
73. Ledezma E, Wittig O, Alonso J, Cardier JE. Potentiated cytotoxic effects of statins and ajoene in murine melanoma cells. Melanoma Res. 2009; 19:69–74. https://doi.org/10.1097/CMR.0b013e32831bc45a. [PubMed].
74. Tanimori Y, Tsubaki M, Yamazoe Y, Satou T, Itoh T, Kidera Y, Yanae M, Yamamoto C, Kaneko J, Nishida S. Nitrogen-containing bisphosphonate, YM529/ONO-5920, inhibits tumor metastasis in mouse melanoma through suppression of the Rho/ROCK pathway. Clin Exp Metastasis. 2010; 27:529–538. https://doi.org/10.1007/s10585-010-9342-z. [PubMed].
75. Pich C, Teiti I, Rochaix P, Mariame B, Couderc B, Favre G, Tilkin-Mariame AF. Statins Reduce Melanoma Development and Metastasis through MICA Overexpression. Front Immunol. 2013; 4:62. https://doi.org/10.3389/fimmu.2013.00062. [PubMed].
76. Sarrabayrouse G, Pich C, Teiti I, Tilkin-Mariame AF. Regulatory properties of statins and rho gtpases prenylation inhibitiors to stimulate melanoma immunogenicity and promote anti-melanoma immune response. Int J Cancer. 2017; 140:747–755. https://doi.org/10.1002/ijc.30422. [PubMed].
77. Sarrabayrouse G, Pich C, Moriez R, Armand-Labit V, Rochaix P, Favre G, Tilkin-Mariame AF. Melanoma cells treated with GGTI and IFN-gamma allow murine vaccination and enhance cytotoxic response against human melanoma cells. PLoS One. 2010; 5:e9043. https://doi.org/10.1371/journal.pone.0009043. [PubMed].
78. Tilkin-Mariame AF, Cormary C, Ferro N, Sarrabayrouse G, Lajoie-Mazenc I, Faye JC, Favre G. Geranylgeranyl transferase inhibition stimulates anti-melanoma immune response through MHC Class I and costimulatory molecule expression. FASEB J. 2005; 19:1513–1515. https://doi.org/10.1096/fj.04-3482fje. [PubMed].
79. Likus W, Siemianowicz K, Bienk K, Pakula M, Pathak H, Dutta C, Wang Q, Shojaei S, Assaraf YG, Ghavami S, Cieslar-Pobuda A, Los MJ. Could drugs inhibiting the mevalonate pathway also target cancer stem cells? Drug Resist Updat. 2016; 25:13–25. https://doi.org/10.1016/j.drup.2016.02.001. [PubMed].
80. Opie L. Cancer and cardiovascular disease: more tightly linked than by chance. Lancet. 2015; 385:1182. https://doi.org/10.1016/S0140-6736(15)60635-3. [PubMed].
81. Regulska K, Regulski M, Karolak B, Murias M, Stanisz B. Can cardiovascular drugs support cancer treatment? The rationale for drug repurposing. Drug Discov Today. 2019; 24:1059–1065. https://doi.org/10.1016/j.drudis.2019.03.010. [PubMed].