
Introduction
The chloride intracellular channel (CLIC) family is broadly conserved and includes six genes (CLIC1-6), three of which colocalize with RUNX and RCAN genes in ACD (for AML/RUNX, CLIC, and DSCR/RCAN) clusters (CLIC4, CLIC5, and CLIC6 in ACD1, ACD6, and ACD21, respectively) thought to have arisen through two rounds of whole genome duplication and one segmental duplication. The maintenance of this clustering in jawed vertebrates may be due to functional cooperation during immune responses [1]. CLIC proteins are structurally metamorphic and can reversibly transit between membrane-inserted and soluble states to participate in diverse cellular functions. Membrane-inserted CLICs can form ion channels, primarily in intracellular organelles, though they are not selective for chloride ions. Several members of this protein family also exist in a soluble form, where they participate in a wide range of biochemical processes such as oxidoreduction and preventing protein dephosphorylation [2].
CLIC4 has been implicated in angiogenesis [3–5], pulmonary arterial hypertension [6, 7], epithelial differentiation [8], myofibroblast differentiation [9–11], response to oxidative stress [12–15], cellular adhesion and integrin trafficking [16–18], immunity [19–22], and cancer [23–31]. Despite the elucidation of many CLIC4 functions, little is known regarding the regulation of CLIC4 expression. Both NANOG and SOX2, but not OCT4, bind to a region approximately 2 kb upstream of the CLIC4 transcription start site in human embryonic stem cells, but no functional studies have been performed to investigate this interaction [32]. Our laboratory identified p53 and AP-1 binding sites upstream of CLIC4 that are required for the induction of CLIC4 by DNA damaging stimuli and calcium-induced differentiation, respectively [8, 33, 34]. Subsequent analyses also identified MYC binding sites and that co-expression of MYC and p53 leads to synergistic activation of the CLIC4 promoter [35]. CLIC4 expression is similarly upregulated following exposure to TNF-α and TGF-β [33, 36]. Recent studies have also shown that G-quadruplex structures near the CLIC4 promoter are capable of regulating CLIC4 transcription [37].
Other modulators of CLIC4 expression have also been described. In primary murine bone marrow-derived macrophages (BMDM), Clic4 transcription is rapidly induced following treatment with lipopolysaccharide (LPS) or other toll-like receptor (TLR) agonists, even in the presence of cycloheximide, suggesting that the factors required for Clic4 expression do not require de novo synthesis following TLR activation [19]. In murine fibrosarcoma cells, Clic4 is upregulated in response to mitochondrial DNA depletion in a p53- and CREB-dependent manner [38]. In normal human bronchial epithelial cells transduced with oncogenic KRASG12V, CLIC4 protein expression is reduced, indicating that KRAS or its downstream effectors induce negative regulators of CLIC4 expression [27]. Despite these findings, a comprehensive study of the regulatory mechanisms governing CLIC4 expression in human cancer has never been performed.
We previously described alterations in CLIC4 expression and localization during malignant progression in several human cancer types. As tumors progress from early to late stages, detection of CLIC4 protein is lost in tumor epithelial cells with a concomitant upregulation in tumor stromal cells that acquire phenotypic markers of myofibroblasts [23]. We have shown that the stromal upregulation of CLIC4 is due to action of tumor epithelial cell-derived TGF-β on stromal fibroblasts [11]. However, the mechanism of CLIC4 loss in tumor epithelium is unknown. Here, we perform a comprehensive analysis of putative CLIC4 regulators using genomic and epigenomic data, single-cell RNA sequencing data, molecular assays, tissue staining, and in vivo xenografts and show that a microRNA, miR-142-3p, is a previously undescribed regulator of CLIC4. We leveraged analyses with spatial resolution to demonstrate the localization and expression of both CLIC4 and miR-142-3p within a specific cancer type, head and neck squamous cell carcinoma, which both highlights the limitations of bulk tumor analysis and introduces important considerations for the utility of CLIC4 and miR-142-3p as cancer biomarkers.
Results
CLIC4 protein is differentially localized in human squamous carcinoma
We have performed extensive immunohistochemical (IHC) staining of human tumors derived from distinct anatomical sites and cellular origins to characterize the pattern of CLIC4 protein distribution. In cancers of epithelial origin, such as squamous cell carcinoma (SCC), CLIC4 levels tend to be reduced in the epithelial compartment with a concomitant upregulation of CLIC4 protein in the nuclei and cytoplasm of tumor-associated stromal cells. However, we observed variable patterns of expression for adenocarcinomas (ADCs) derived from glandular tissue, even when assessing cancers from the same organ site. For example, in the normal stratified epithelium of the ectocervix, CLIC4 expression is highest in the basal cell layer (Figure 1A), while cervical SCCs display epithelial downregulation and stromal upregulation of CLIC4 (Figure 1B). In contrast, cervical ADCs are strongly positive for CLIC4 (Figure 1C). In the esophagus, however, both SCCs and ADCs have low CLIC4 expression in the tumor compartment and high stromal expression, while normal tissue expresses low levels of CLIC4 (Figure 1D–1F). In head and neck tissue such as tongue, CLIC4 is localized to the basal layer in normal tissue and predominant in the stroma of SCC, similar to the cervix (Figure 1G, 1H). Further heterogeneity is observed when assessing CLIC4 distribution in other tumor types (data not shown). Many factors, including cell of origin, genetic drivers, interactions with the microenvironment, and exposure to cellular stressors can promote changes in CLIC4 expression, function, and localization. The dynamic and variable regulation of CLIC4 prompted our further investigation into the mechanisms underlying these CLIC4 alterations.
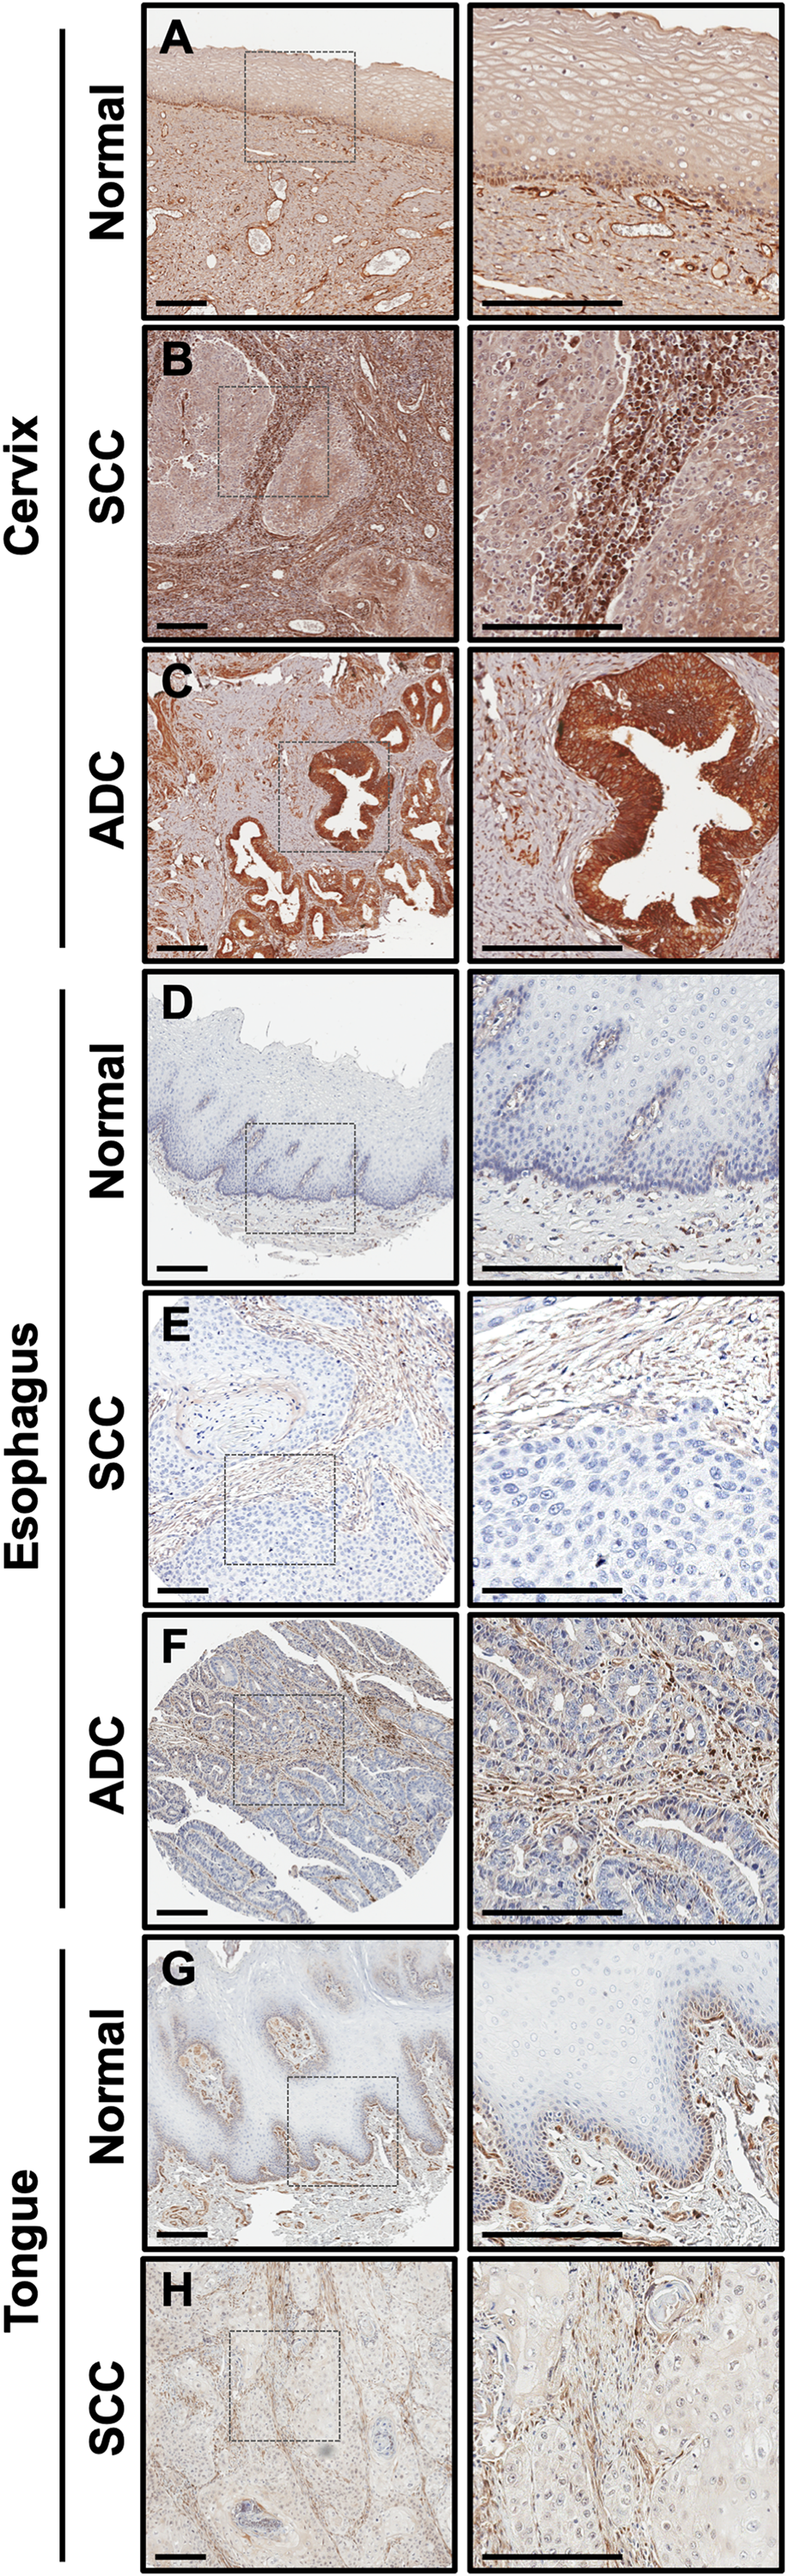
Figure 1: CLIC4 expression is low in epithelia of multiple squamous cancers but elevated in stromal cells. CLIC4 expression was determined by immunohistochemistry in (A) normal cervix, (B) cervical SCC, (C) cervical ADC, (D) normal esophagus, (E) esophageal SCC, (F) esophageal ADC, (G) normal tongue, and (H) tongue SCC. Left, lower magnification (10×). Dotted box represents the regions magnified on the right. Scale bar = 200 μm. SCC, squamous cell carcinoma. ADC, adenocarcinoma.
CLIC4 is rarely altered at the genomic level in human cancers
We previously showed that CLIC4 is not deleted or mutated in any of the tumor cell lines represented in the NCI-60 panel [23]. To confirm this finding in clinical specimens, we utilized cBioPortal to query datasets from the TCGA PanCancer Atlas [39, 40]. CLIC4 was altered in 93/9870 (0.9%) of queried samples (Figure 2A). No recurrent copy number alterations or mutations predominated, and very few CLIC4 genomic alterations were detected in each cancer type. In total, 25 amplifications, 22 homozygous deletions, 9 fusions (with SLC45A1, CACHD1, UBAP2L, DNAJA4, PLOD1, CCDC28B, ARFGAP3, PACSIN2, and CEP85), 4 frame shift deletions (recurrent, K204Nfs*11), 29 missense mutations (none recurrent), 3 nonsense mutations (S132*, E239*, and E213*), and 1 nonstop mutation (*254Yext*26) were present (Supplementary Table 1). Two samples had both fusions and amplifications. The missense mutations are of unknown significance, but two have the potential to disrupt phosphorylation sites that we previously identified (S27N, putative CK2 site; S38F, putative PKC site) [33]. When assessing CLIC4 RNA expression levels across these datasets, no trends were observed regarding expression and cell/tissue type or the presence of genomic alterations (Figure 2B). Thus, differential regulation of CLIC4 in cancer must be due to transcriptional/translational or post-transcriptional/translational mechanisms.
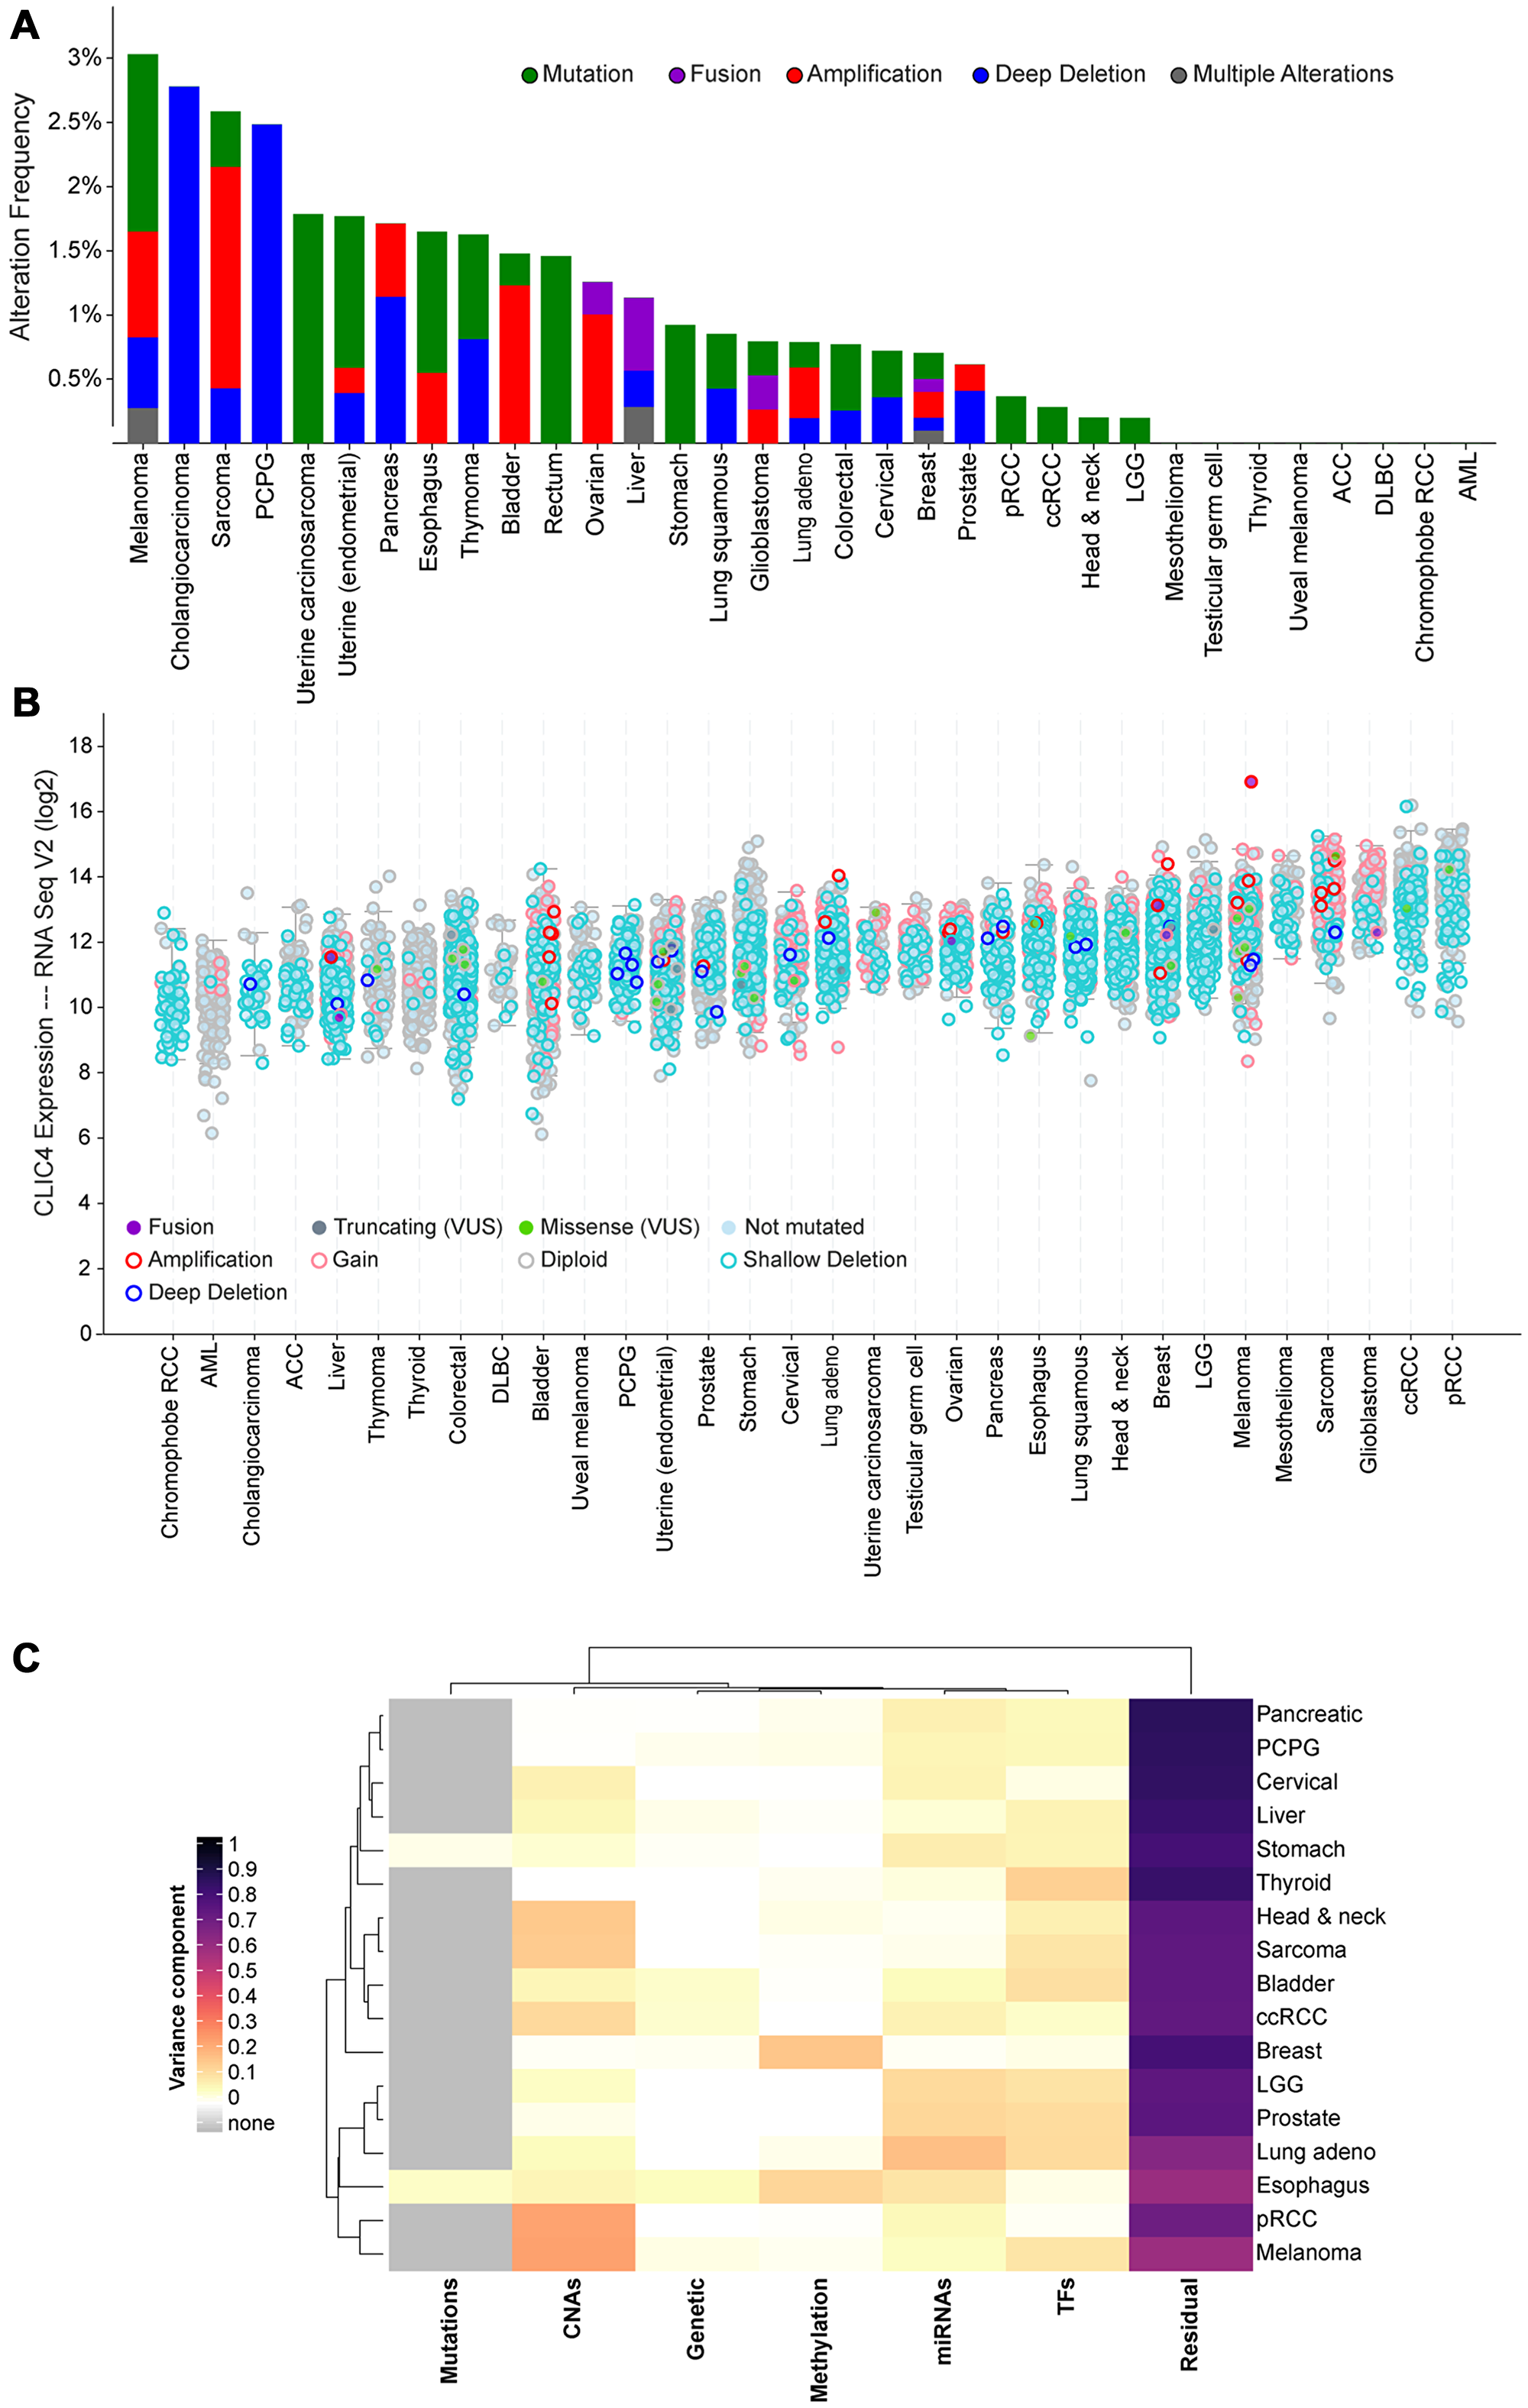
Figure 2: Screening for putative drivers of CLIC4 expression variation in human cancers. (A) Frequency of alterations in the CLIC4 gene in human cancers in the TCGA dataset. (B) Expression level of CLIC4 RNA in human cancers in the TCGA dataset with gene alterations indicated by colors. (C) Variance component estimates for molecular factors on CLIC4 expression from EDGE in TCGA. PCPG, pheochromocytoma and paraganglioma; pRCC, papillary renal cell carcinoma; ccRCC, clear cell renal cell carcinoma; LGG, brain lower grade glioma; ACC, adrenocortical carcinoma; DLBC, diffuse large B-cell lymphoma; AML, acute myeloid leukemia; VUS, variant of unknown significance; CNAs, copy number alterations; miRNAs, microRNAs; TFs, transcription factors.
Putative transcriptional regulators of CLIC4 expression
To further assess putative regulators of CLIC4 expression other than genomic alteration, we utilized the Exploring Drivers of Gene Expression in The Cancer Genome Atlas (EDGE in TCGA) application. EDGE in TCGA utilizes processed TCGA level 3 data to attribute the variance in gene expression to several molecular variables such as somatic mutations, germ-line polymorphisms, promoter methylation, or miRNA and transcription factor abundance [41]. No major source of molecular variation was apparent across the cancer types, exemplified by the predominance of the residual component (Figure 2C). This analysis was limited to samples present in the TCGA for which all data types were available (n = 3228).
Additional information about transcription factor binding and promoter methylation was obtained using the UCSC Genome Browser and ENCODE Transcription Factor ChIP tracks [42]. There are three major DNase hypersensitivity (DHS) clusters spanning and upstream of the CLIC4 promoter where transcription factor binding is localized (Figure 3A). Transcription factor binding is most enriched at the promoter-proximal DHS cluster, with binding of factors such as ATF2 and 3, MYC and MAX, FOS and JUN, NRF1, CEBPB, TCF3, EBF1, and RUNX3 that are known to regulate immune cell function and response to stress. This list is not exhaustive, as it is limited to the 161 transcription factors in 91 cell lines represented within the ENCODE dataset. The second DHS cluster co-localizes with the p53, MYC, and AP-1 sites and the third DHS cluster co-localizes with the distal p53 sites we previously described [8, 34, 35]. Differential expression and activity of these upstream regulators are likely to contribute in part to changes in CLIC4 expression.
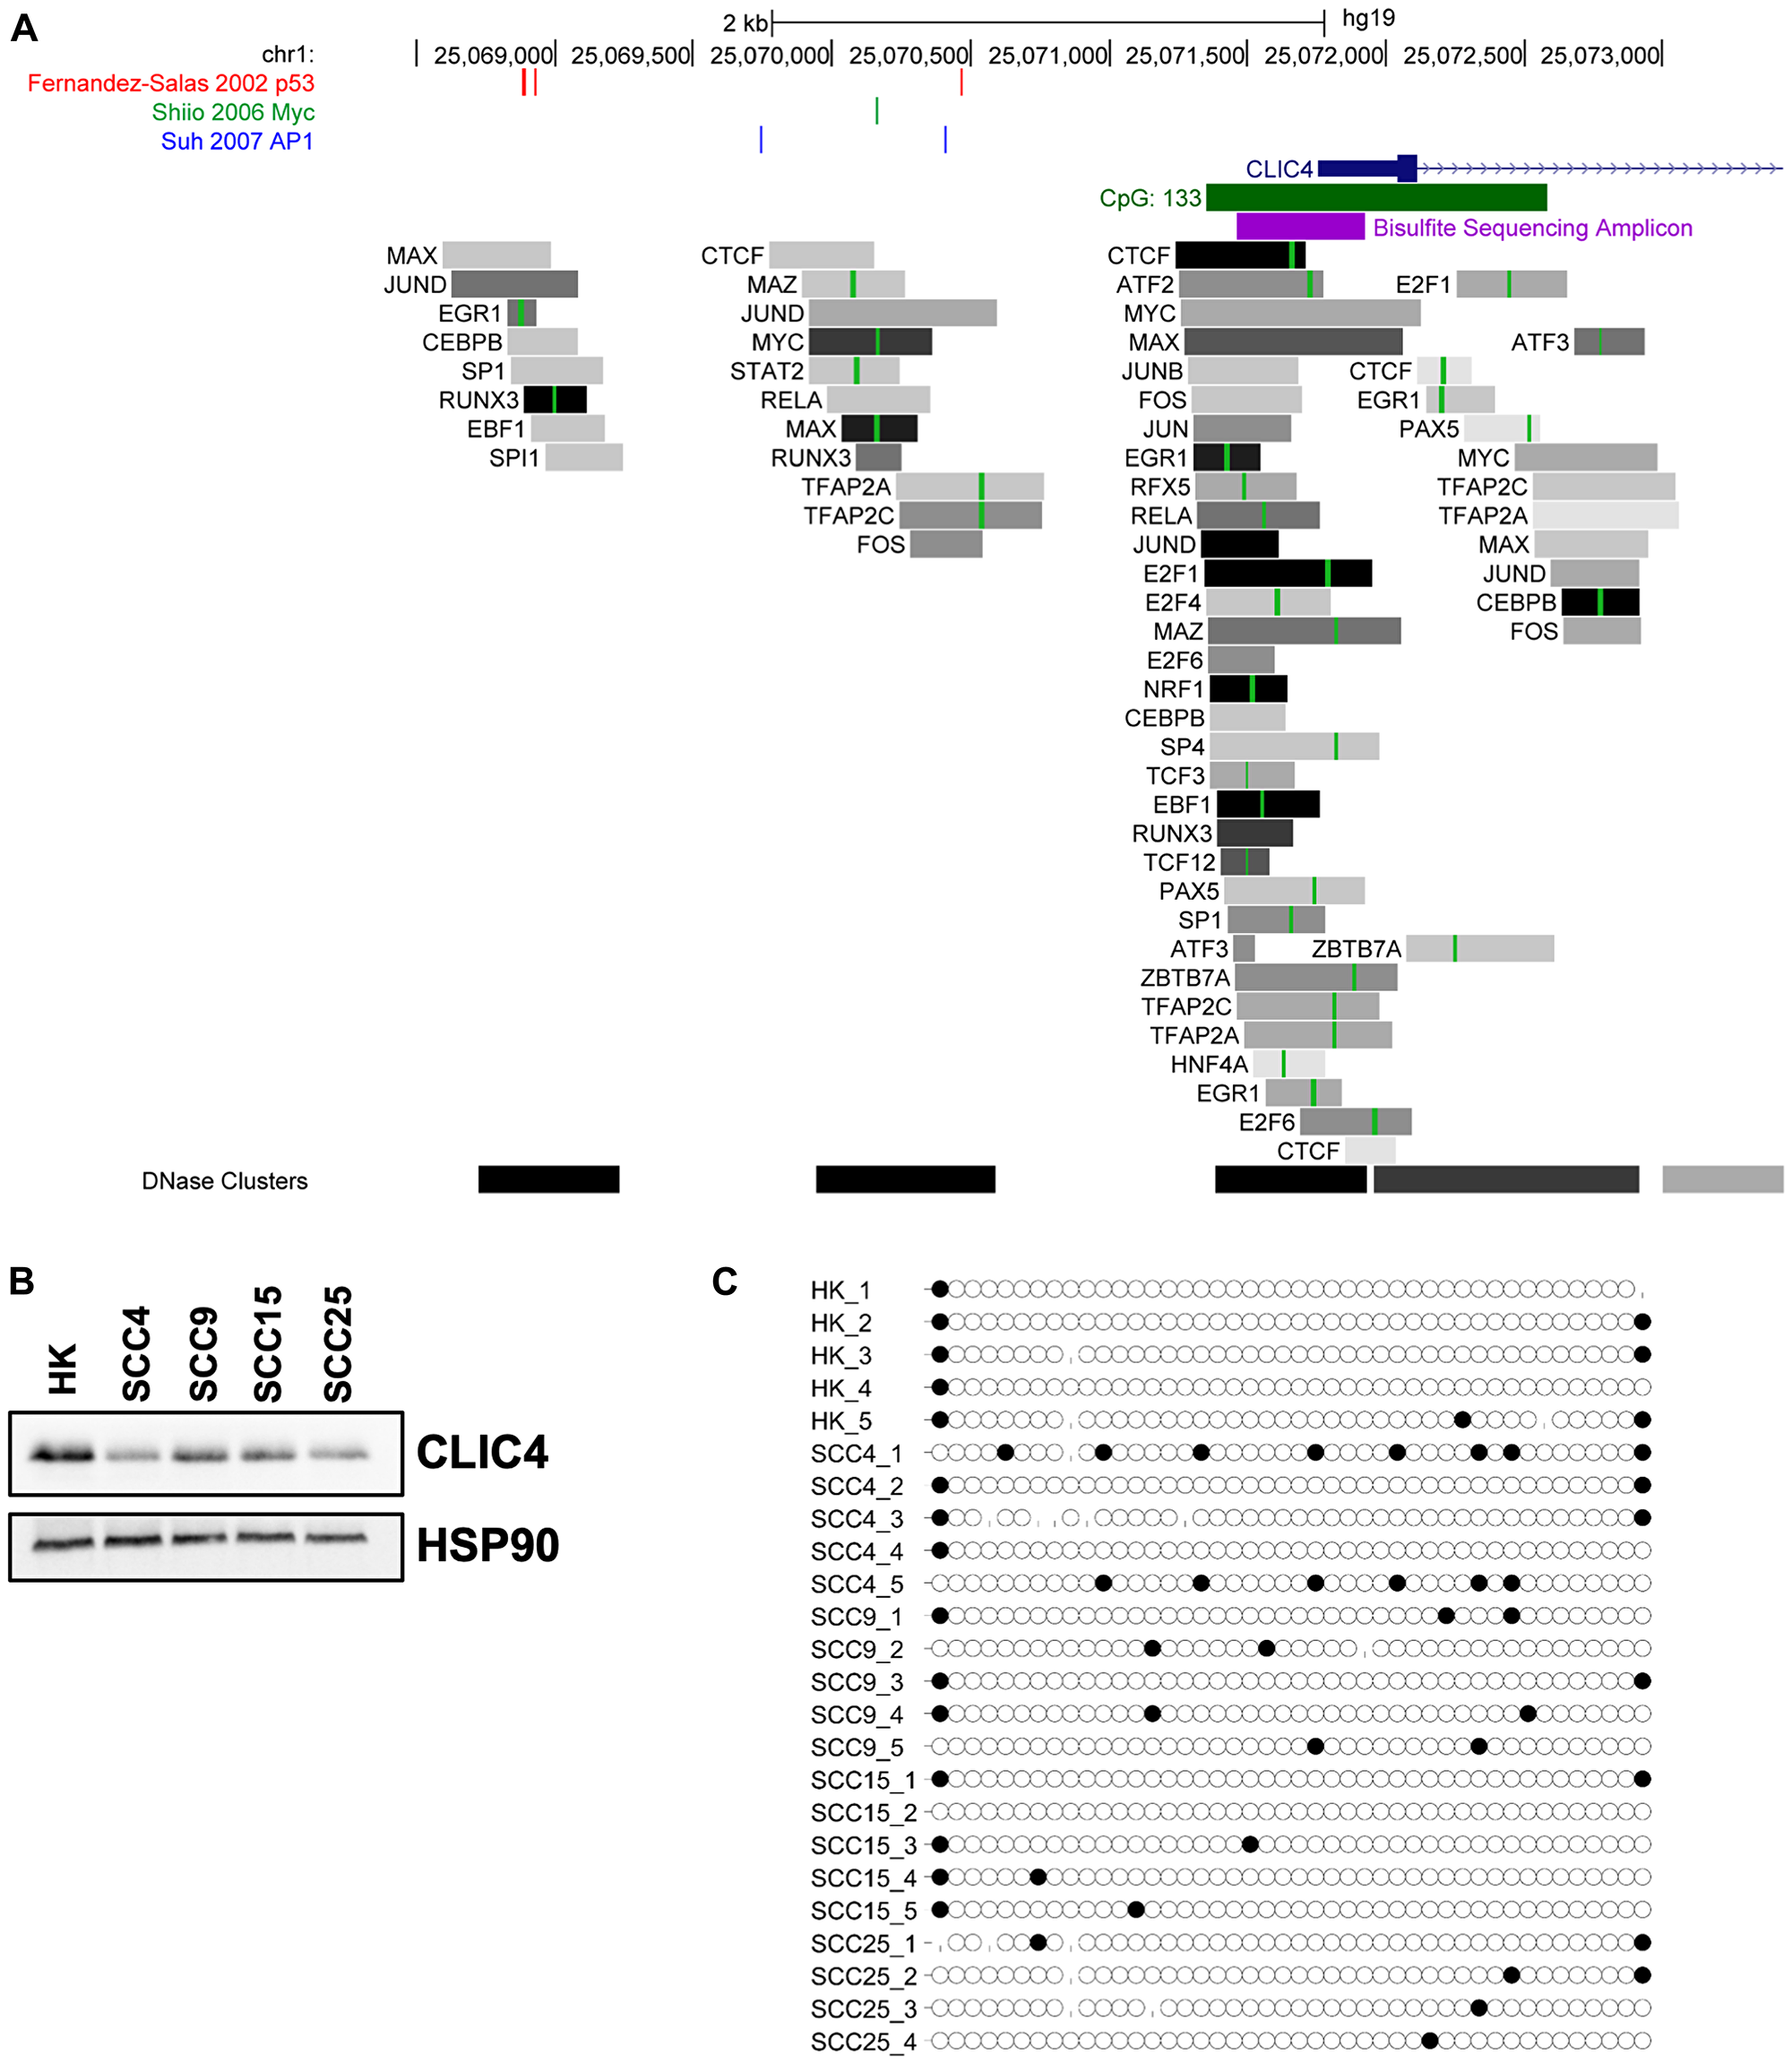
Figure 3: Cancer-associated transcription factors, but not CpG island methylation, regulate CLIC4 expression. (A) Schematic of the promoter region of the human CLIC4 locus from the UCSC Genome Browser. The location of previously published p53 binding sites are shown in red, Myc binding sites in green, and AP1 binding sites in blue. The promoter-associated CpG island is indicated with a green rectangle, and region amplified for bisulfite sequencing with a purple rectangle. Tracks from ENCODE transcription factor ChIP-seq are also shown. Each gray box represents the peak of transcription factor occupancy, and the shading intensity is proportional to the signal strength. Green lines within the box represent canonical binding motifs for the transcription factor. (B) Western blot analysis of CLIC4 and HSP90 (loading control) protein expression in cultures of primary keratinocytes (HK) and SCC4, SCC9, SCC15, and SCC25 cell lines. (C) Bisulfite sequencing reads from the bisulfite sequencing amplicon indicated in (A) from DNA extracted from the cells shown in (B). Each circle represents a cytosine residue from a CpG dinucleotide, with 44 assayed within the amplicon. Black filled circles represent a methylated residue. Missing circles indicate incomplete sequencing data. Reads from 4–5 independent sequencing clones are shown.
A CpG island spans the CLIC4 promoter region, so we performed bisulfite sequencing of normal human keratinocytes and several squamous cell carcinoma cell lines with differential CLIC4 expression (Figure 3B) to determine if CpG methylation could account for these changes. An amplicon containing 50 of the 133 CpGs within the island was amplified from bisulfite-converted DNA, cloned, and sequenced. No substantial differential methylation was detected (Figure 3C). Queries of publicly available data also showed limited methylation in this region (data not shown), suggesting that promoter methylation is not a mechanism of CLIC4 loss in epithelial tumors.
CLIC4 expression can be modulated by miRNAs
Because miRNAs are heavily dysregulated in cancer and can promote tumor growth by targeting factors involved in apoptosis [43], one of many functions we have defined for CLIC4 [44], we sought to identify miRNAs that can modulate CLIC4 expression. To computationally predict miRNAs targeting CLIC4, we queried TargetScan [45], DIANA-microT [46], and miRmap [47], the methodologies with the best predictive performance among all currently available tools [48]. Most of the putative targeting miRNAs were identified by only one algorithm (TargetScan, 136; DIANA, 132; miRmap, 119), so we chose to first investigate the 32 miRNAs shared by all three lists (Figure 4A, Supplementary Table 2). We further ranked the miRNAs by their algorithm scores and pursued the ten with the best rank sum. To test their ability to regulate CLIC4 expression, we performed an in vitro reporter assay by co-transfecting a plasmid containing the CLIC4 3′UTR downstream of luciferase and mimics for each miRNA into 293T cells. All ten mimics reduced luciferase expression as compared to a non-targeting negative control mimic, but to different extents (Figure 4B). miR-122 and miR-142-3p induced the strongest repression, which was validated at the CLIC4 protein level in 293T cells (Figure 4C). miR-122 is largely considered liver-specific and has been implicated in hepatocellular carcinoma [49], while miR-142-3p is highly expressed in hematopoietic cells and has been investigated in multiple cellular contexts and diseases [50]. Therefore, we chose to focus on miR-142-3p for subsequent experiments.
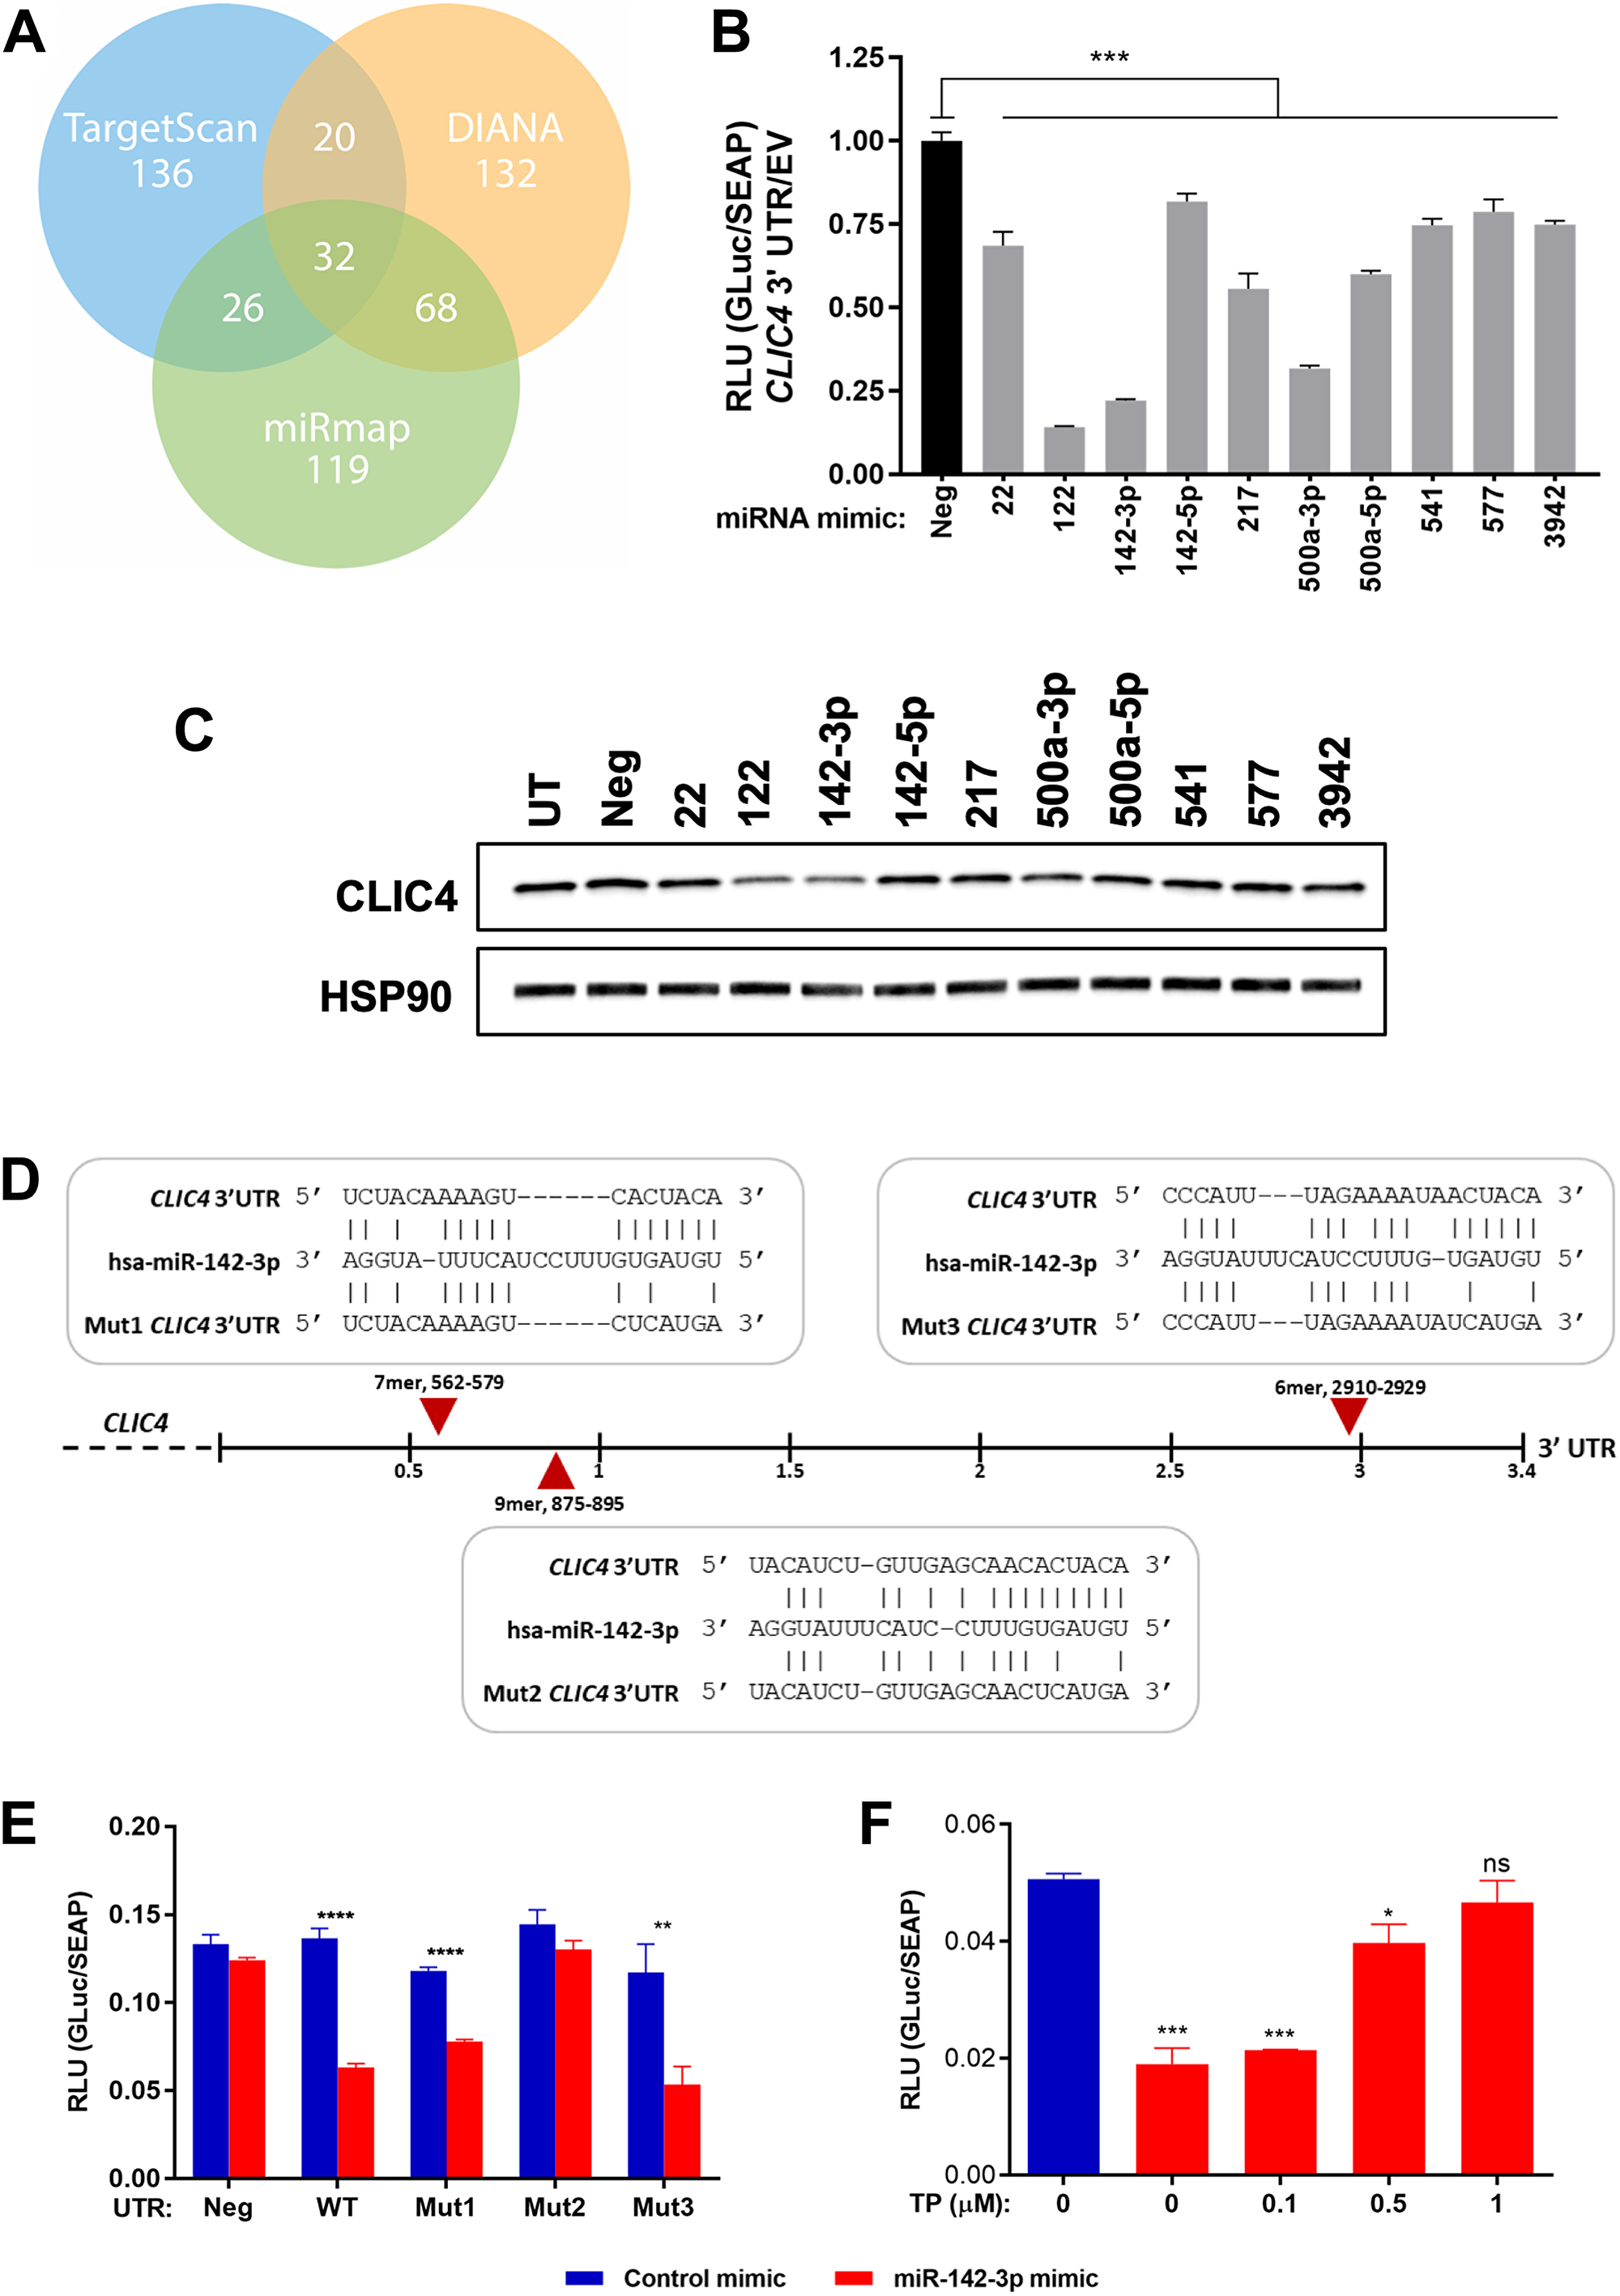
Figure 4: miR-142-3p targets CLIC4 by recognizing a specific site in the CLIC4 3′UTR. (A) Number of putative miRNAs proposed to target CLIC4 using the TargetScan (blue), DIANA (orange), or miRmap (green) search algorithms. The numbers of overlapping miRNAs are indicated at the intersection of each circle. (B) Relative luminescence detected at 48 hours following the co-transfection of either Gaussia luciferase (GLuc) empty vector (EV) or CLIC4 3′UTR-GLuc and each miRNA mimic (20 nM) in 293T cells. ***p ≤ 0.001 for ANOVA with Dunnett’s correction for multiple comparisons, Neg vs. each mimic. (C) Western blot analysis of CLIC4 and HSP90 (loading control) protein expression at 48 hours after transfection of each indicated miRNA mimic (20 nM) in 293T cells. (D) Schematic of the CLIC4 3′UTR with the sequence and relative position of each putative miR-142-3p binding site indicated with a red arrow. The disruption of base pairing in the miRNA seed region for each mutagenized reporter plasmid (Mut1-3) is shown below each site. (E) Relative luminescence detected at 48 hours following the co-transfection of either Gaussia luciferase (GLuc) empty vector (Neg), wild-type CLIC4 3′UTR-GLuc (WT), or Mut1-3 CLIC4 3′UTR-GLuc (Mut1, Mut2, Mut3) and either non-targeting control mimic or miR-142-3p mimic (10 nM) in 293T cells. **p ≤ 0.01, ****p ≤ 0.0001 for Student’s t-test comparing control mimic vs. miR-142-3p mimic for each UTR vector. (F) Relative luminescence detected at 72 hours following the co-transfection of wild-type CLIC4 3′UTR-GLuc, non-targeting control mimic or miR-142-3p mimic (10 nM) and increasing concentrations of target protector (TP) designed to block the interaction of miR-142-3p with site 2 of the CLIC4 3′UTR in 293T cells. *p ≤ 0.05, ***p ≤ 0.001, ns p > 0.05 for ANOVA with Dunnett’s correction for multiple comparisons, control mimic vs. each miR-142-3p/TP concentration. For (B), (E), and (F), secreted alkaline phosphatase (SEAP) is expressed from an independent promoter in the sample plasmid and was used to normalize for transfection efficiency. UTR, untranslated region; RLU, relative luminescence units; Neg, negative control (non-targeting) mimic; UT, untransfected.
miR-142-3p represses CLIC4 by interacting with the CLIC4 3′UTR
Several putative miR-142-3p binding sites were identified in the CLIC4 3′UTR, a 7-mer at position 562-579, a 9-mer at position 875-895, and a 6-mer at position 2910-2929. Key residues in the seed binding region of each site of the CLIC4 3′UTR reporter plasmid were mutagenized individually to disrupt the ability of miR-142-3p to bind (Figure 4D). Only mutagenesis of the second putative site (9-mer at 875-895 bp downstream of CLIC4 stop codon) was able to abolish the repression, indicating that this site is required for miR-142-3p to exert its repressive effect on CLIC4 (Figure 4E). This was further validated with a target protector (TP), a modified RNA designed to bind to and disrupt this specific site in the CLIC4 3′UTR without affecting the stability of the mRNA. Co-transfection of the wild-type CLIC4 3′UTR reporter plasmid, miR-142-3p mimic, and increasing concentrations of the TP attenuated miR-142-3p-induced repression in a dose-dependent manner (Figure 4F). Thus, CLIC4 is a bona fide target of miR-142-3p, which targets the transcript through interaction with a site at position 875 of the CLIC4 3′UTR.
miR-142-3p can target CLIC4 in HNSCC
Upregulation of miR-142-3p in head and neck squamous cell carcinoma (HNSCC) has been reported previously [51]. To determine the relationship between miR-142-3p and CLIC4 in HNSCC, we queried miRTarBase, which utilizes a selection of curated miRNA-seq and RNA-seq data from TCGA that contain matched tumor and normal samples from the same patients [52]. For HNSCC (n = 42), miR-142-3p and CLIC4 displayed an inverse expression pattern with a significant negative Pearson correlation (r = –0.503, p = 0.0003; Figure 5A). We surveyed several HNSCC cell lines (SCC4, 9, 15, and 25) and found that while CLIC4 is moderately abundant in vitro, its protein level can be downregulated by the addition of miR-142-3p mimic, to a level comparable or greater than that of a CLIC4 siRNA (Figure 5B). Of these cell lines, only SCC4 expressed modest levels of endogenous miR-142-3p, but this did not correlate with the level of CLIC4 (Figure 5C). Following the addition of a miR-142-3p inhibitor RNA in SCC4 cells, we observed a slight dose-dependent increase in the protein level of CLIC4 and transforming growth factor beta receptor 1 (TGFBR1), an experimentally validated miR-142-3p target [53] (Figure 5D). We also observed that cultures treated with 75–100 nM miR-142-3p inhibitor failed to become confluent (Figure 5E), potentially due to upregulation of CLIC4 or p21 (Figure 4D) and subsequent cell cycle arrest or apoptosis [44, 54]. These data demonstrate that exposure to exogenous miR-142-3p is capable of downregulating CLIC4 protein in human HNSCC cell lines and endogenous miR-142-3p expression has a significant reciprocal relationship with CLIC4 expression in HNSCC tissue in vivo.
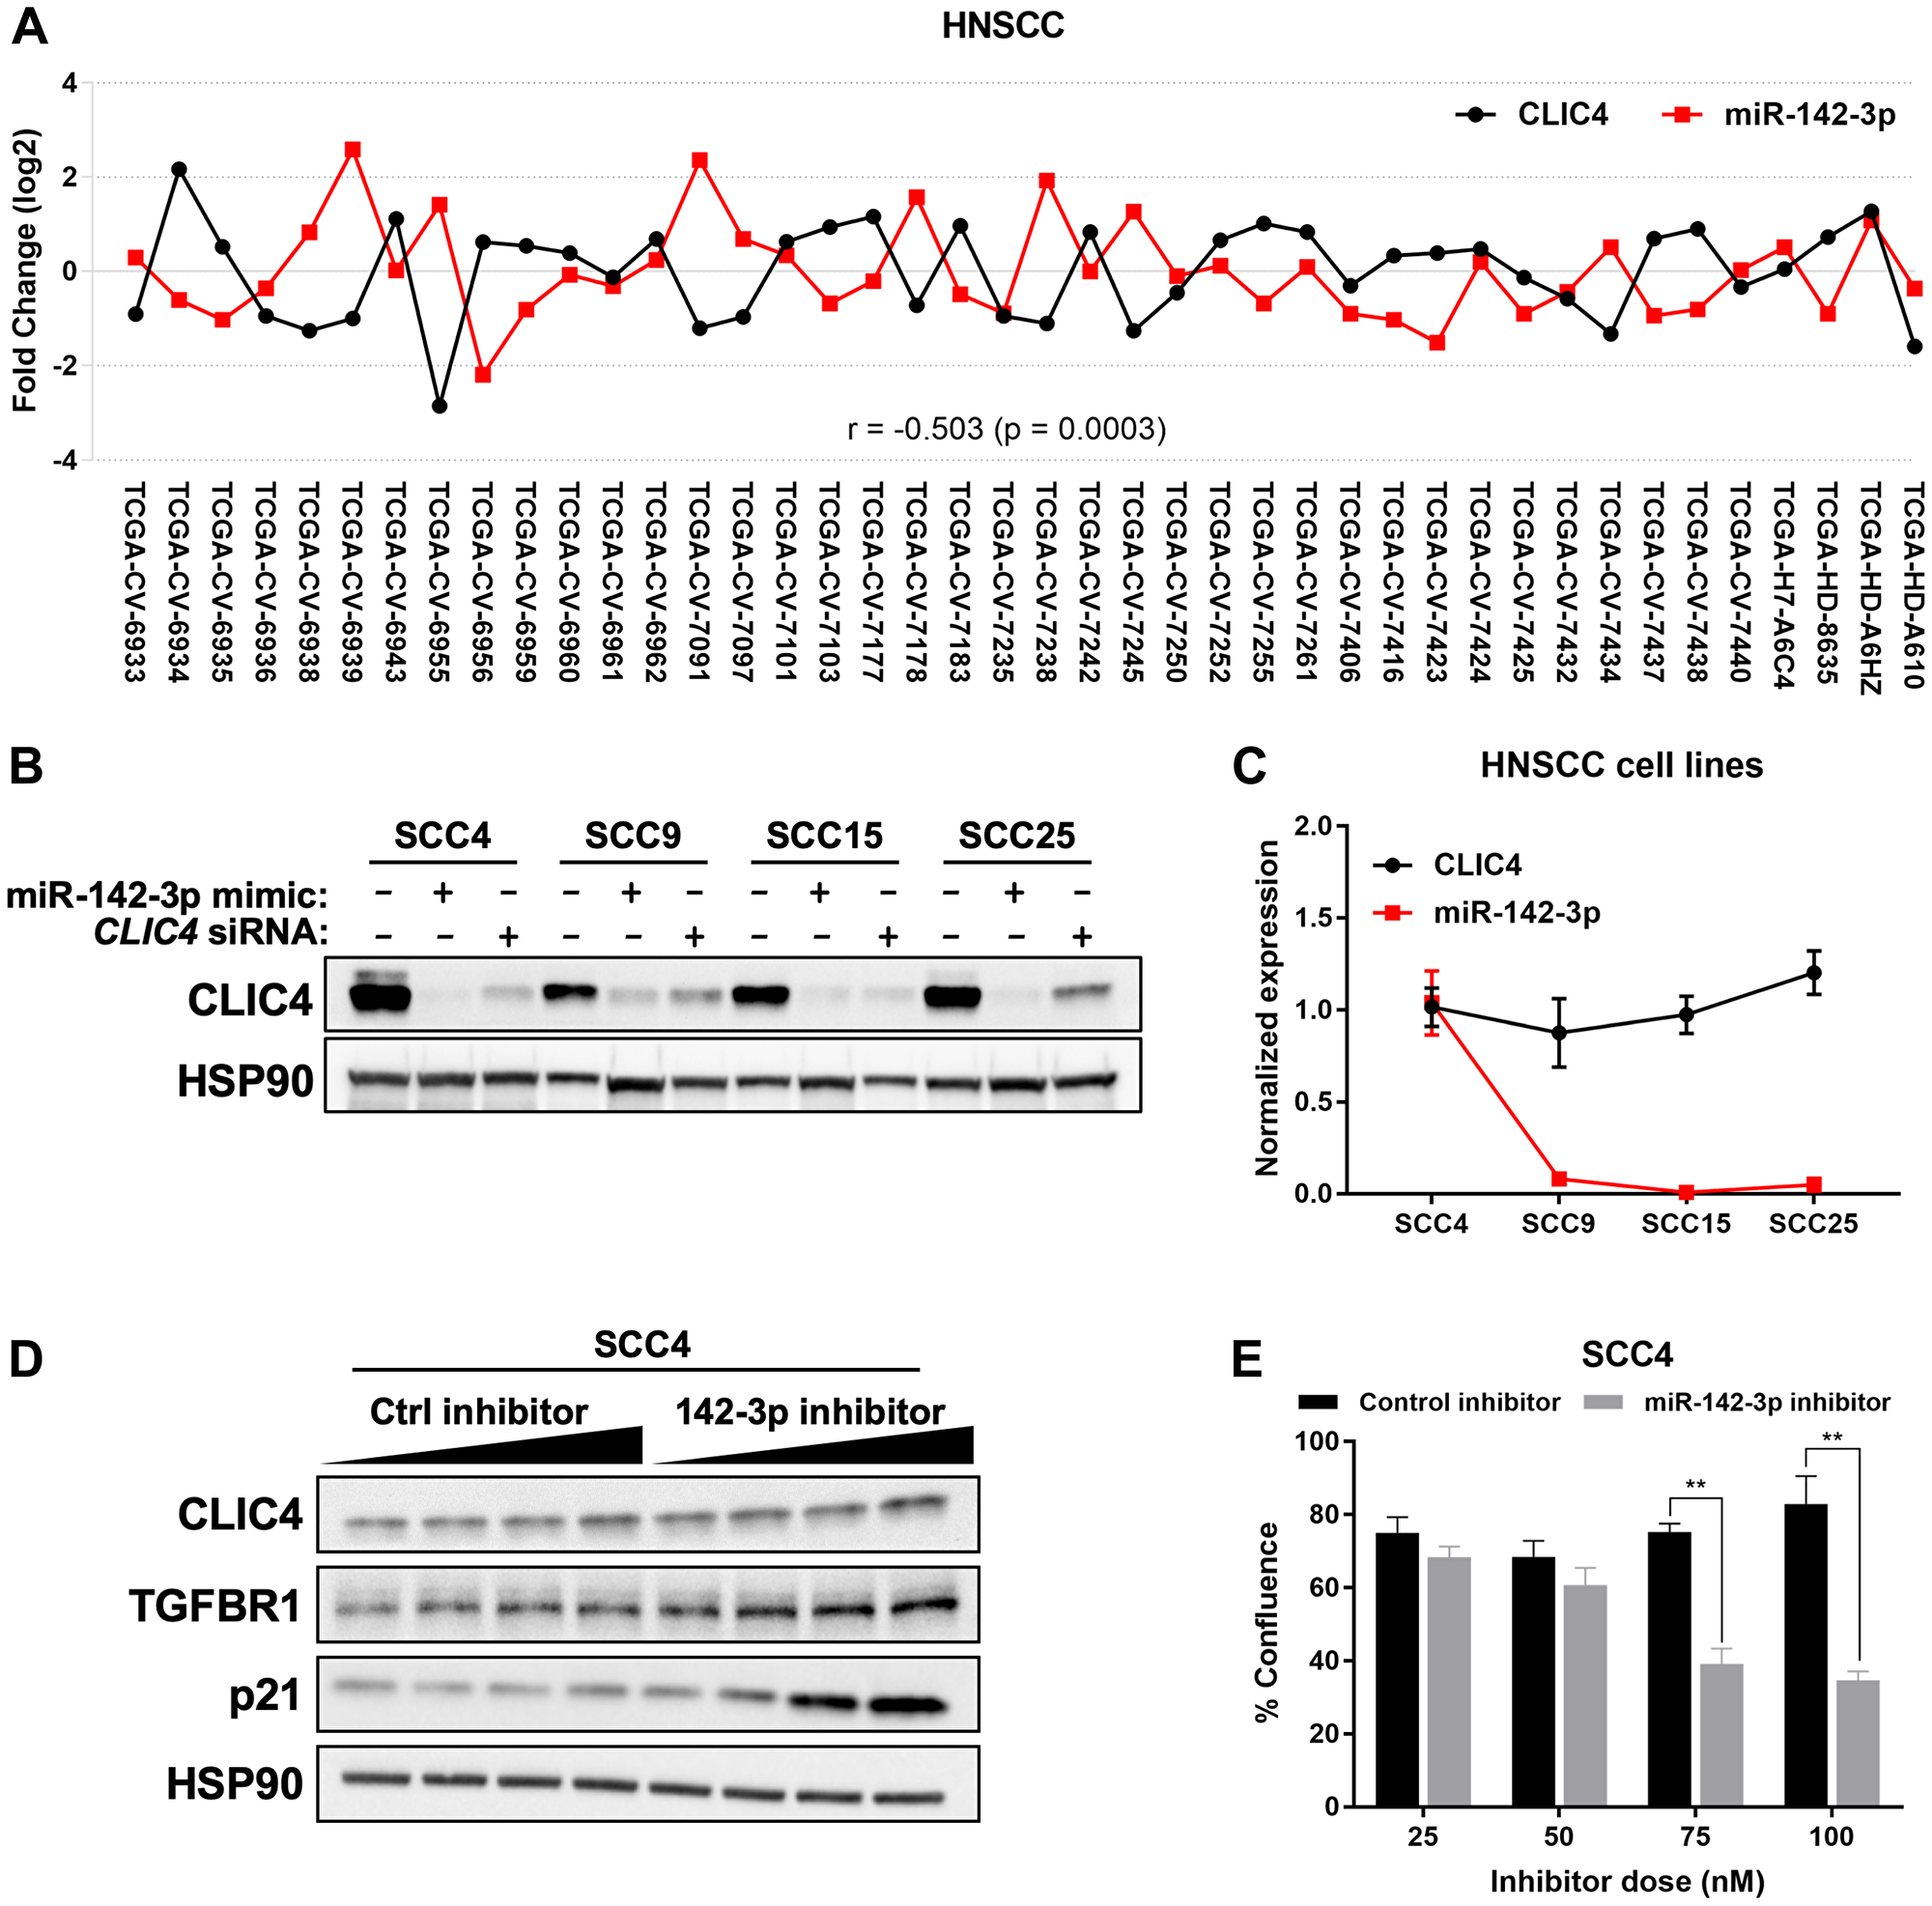
Figure 5: miR-142-3p modulates CLIC4 expression in HNSCC. (A) Fold change in CLIC4 and miR-142-3p in tumor compared with matched normal tissue for HNSCC from TCGA data processed by miRTarBase (n = 42). Statistics represent the Pearson correlation coefficient. Individual TCGA identifiers are shown on the x-axis. (B) Western blot analysis of CLIC4 and HSP90 (loading control) protein expression at 72 hours after transfection of miR-142-3p mimic or CLIC4 siRNA (20 nM) in SCC4, SCC9, SCC15, and SCC25 cell lines. (C) qPCR analysis of endogenous CLIC4 and miR-142-3p RNA expression in SCC4, SCC9, SCC15, and SCC25 cell lines. mRNA expression was normalized using the expression of RPL37, and miRNA expression was normalized using the expression of RNU6. (D) Western blot analysis of CLIC4, TGFBR1, p21, and HSP90 (loading control) protein expression at 48 hours after transfection of 25, 50, 75, or 100 nM (increasing dose indicated by black wedge) of control inhibitor or miR-142-3p inhibitor in SCC4 cells. (E) Percent confluence of SCC4 cells in plates from (D) at 48 hours post-transfection. Black, control inhibitor; Gray, miR-142-3p inhibitor. **p ≤ 0.01 for Student’s t-test comparing control inhibitor vs. miR-142-3p inhibitor at each individual dose. HNSCC, head and neck squamous cell carcinoma; TCGA, The Cancer Genome Atlas; qPCR, quantitative polymerase chain reaction.
miR-142-3p and CLIC4 expression levels are inversely correlated in progressive squamous cancers
miRTarBase miRNA/mRNA TCGA expression data (Figure 5A) was limited to samples with matched normal tissue (n = 42). To determine if the inverse relationship between the expression of miR-142-3p and CLIC4 is preserved when considering all tumor samples, we compared their expression values in the entire TCGA HNSCC dataset (n = 475). We also assessed cervical SCC (n = 252), for which we observed epithelial downregulation of CLIC4 (Figure 1B). In HNSCC, there was a significant negative correlation between CLIC4 and miR-142-3p expression (Figure 6A, ρ = –0.1797, p = 7.99e-05). This relationship was not significant in stage I/II cancers (Figure 6B, ρ = –0.03285, p = 0.739), but there was a stronger negative correlation in stage III/IV cancers (Figure 6C, ρ = –0.2229, p = 1.47e-05). The same held true for cervical SCC, where a negative correlation was observed (Figure 6D, ρ = –0.1493, p = 0.0178), and while the correlation was not significant for stage I/II cancers (Figure 6E, ρ = –0.1050, p = 0.153), a stronger negative correlation was observed for stage III/IV cervical SCC (Figure 6F, ρ = –0.3348, p = 0.0105). The more notable inverse relationship between CLIC4 and miR-142-3p in stage III/IV squamous cancers (Figure 6G) suggests that miR-142-3p regulation of CLIC4 may occur predominantly in advanced cancers.
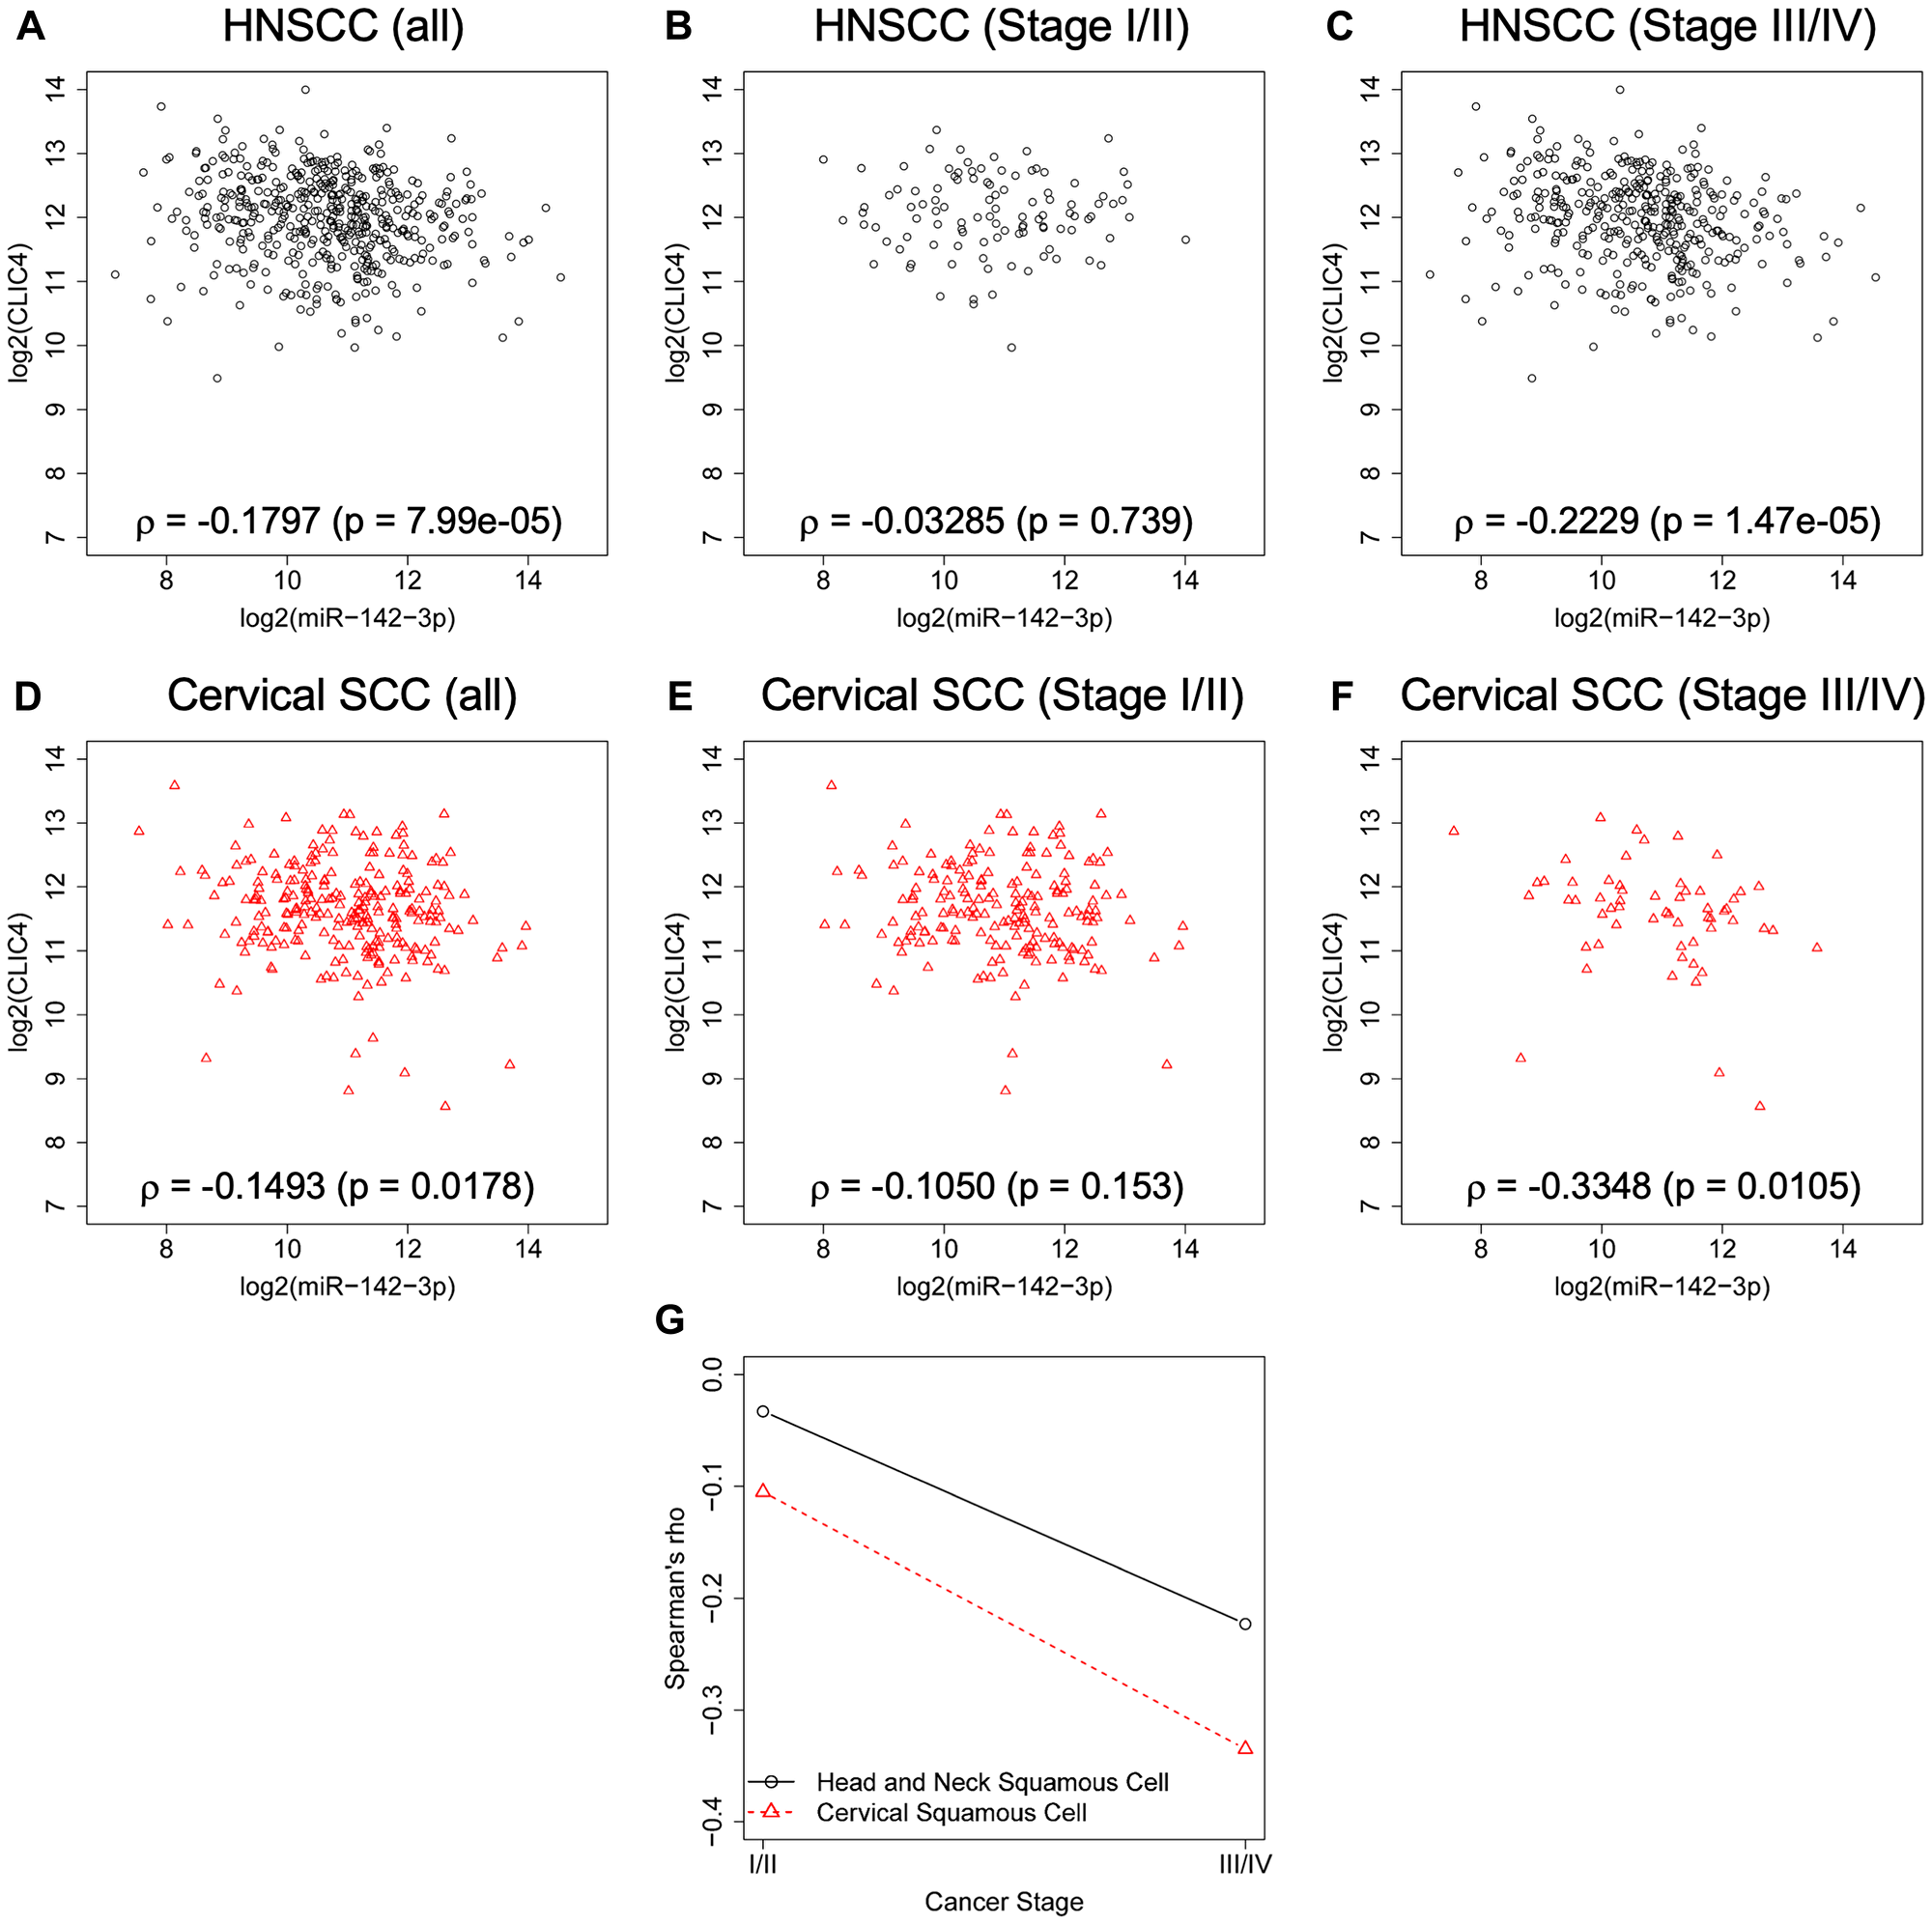
Figure 6: CLIC4 and miR-142-3p are inversely related in advanced squamous cell cancers. Relationship between the expression level of CLIC4 and miR-142-3p in subsets of TCGA data. (A) Expression in all primary HNSCC tumors with complete mRNA and miRNA data (n = 475). (B) Expression in stage I (n = 26) and stage II (n = 78) HNSCC tumors from (A) (n = 104). (C) Expression in stage III (n = 86) and stage IV (n = 285) HNSCC tumors from (A) (n = 371). (D) Expression in all primary cervical SCC tumors with complete mRNA and miRNA data (n = 252). (E) Expression in stage I (n = 125) and stage II (n = 62) cervical SCC tumors from (D) (n = 187). (F) Expression in stage III (n = 42) and stage IV (n = 16) cervical SCC tumors from (D) (n = 58). Tumors with no staging data were excluded from the staged analysis (n = 7). Statistics represent Spearman’s rho. (G) Comparison of the value of Spearman’s rho for stage I/II and stage III/IV tumors. HNSCC, black open circles; Cervical SCC, red open triangles; HNSCC, head and neck squamous cell carcinoma; SCC, squamous cell carcinoma.
scRNA-seq reveals abundant CLIC4 expression in HNSCC tumor stroma
Though we observed significant negative correlations between CLIC4 and mir-142-3p expression in human HNSCC (Figure 6), the modest amplitude of the correlation in light of strong molecular in vitro data (Figure 4, Figure 5B) led us to question whether the strength of the interaction was masked by the loss of spatial resolution in TCGA bulk analysis and disparate levels of CLIC4 expression between tumor and stromal compartments [23]. Cellular deconvolution techniques can be applied to bulk tumor gene expression datasets to estimate tumor purity and the infiltration of stromal and immune cells [55], but recent advances in single-cell RNA-sequencing (scRNA-seq) allow for direct profiling of intratumoral cellular heterogeneity and expression variation in discrete compartments [56]. We assessed CLIC4 expression in the scRNA-seq dataset generated by Puram et al. [57], which profiled 6,000 single cells from HNSCC patients. We were unable to leverage this dataset to compare the levels of CLIC4 and miR-142-3p in single cells because current technical challenges limit simultaneous detection of miRNA and mRNA transcriptomes [58]. The curated data distinguished malignant from non-malignant cells based on global expression patterns, epithelial origin, and inferred karyotype. Our application of dimensional reduction to the non-malignant cell data revealed ten distinct clusters based on expression states (Figure 7A, Supplementary Table 3) that broadly match the cell type annotations distinguished by Puram et al. (Figure 7B). CLIC4 is highly expressed in HNSCC tumor-associated fibroblasts and endothelial cells, expressed at lower levels in macrophages, mast cells, and B cells, and is remarkably absent in T cells (Figure 7C and 7D, Supplementary Table 3). Among fibroblast subsets, CLIC4 is highest in myofibroblasts, which is consistent with our previous findings that CLIC4 plays an integral role in TGF-β-dependent myofibroblast differentiation [11]. CLIC4 is also significantly higher in cancer-associated fibroblasts (CAFs) than in other non-malignant cell types, and is among the top 150 differentially expressed genes that differentiate the CAF1 from CAF2 subsets as described by Puram et al. [57]. The abundance of CLIC4 in stromal cells prompted us to further compare the relative expression level of CLIC4 between the malignant tumor cell population and each non-malignant cell type (Figure 7E, Supplementary Table 3). CLIC4 expression was significantly lower in the malignant cells than in tumor-associated fibroblasts (-3.6-FC; -1.3-logFC) and endothelial cells (-3.3-FC; -1.2-logFC). These findings suggest that the contribution of stromal CLIC4 can confound analyses regarding the level of CLIC4 in tumors and the miR-142-3p/CLIC4 relationship in bulk expression data, necessitating analyses that preserve spatial localization.
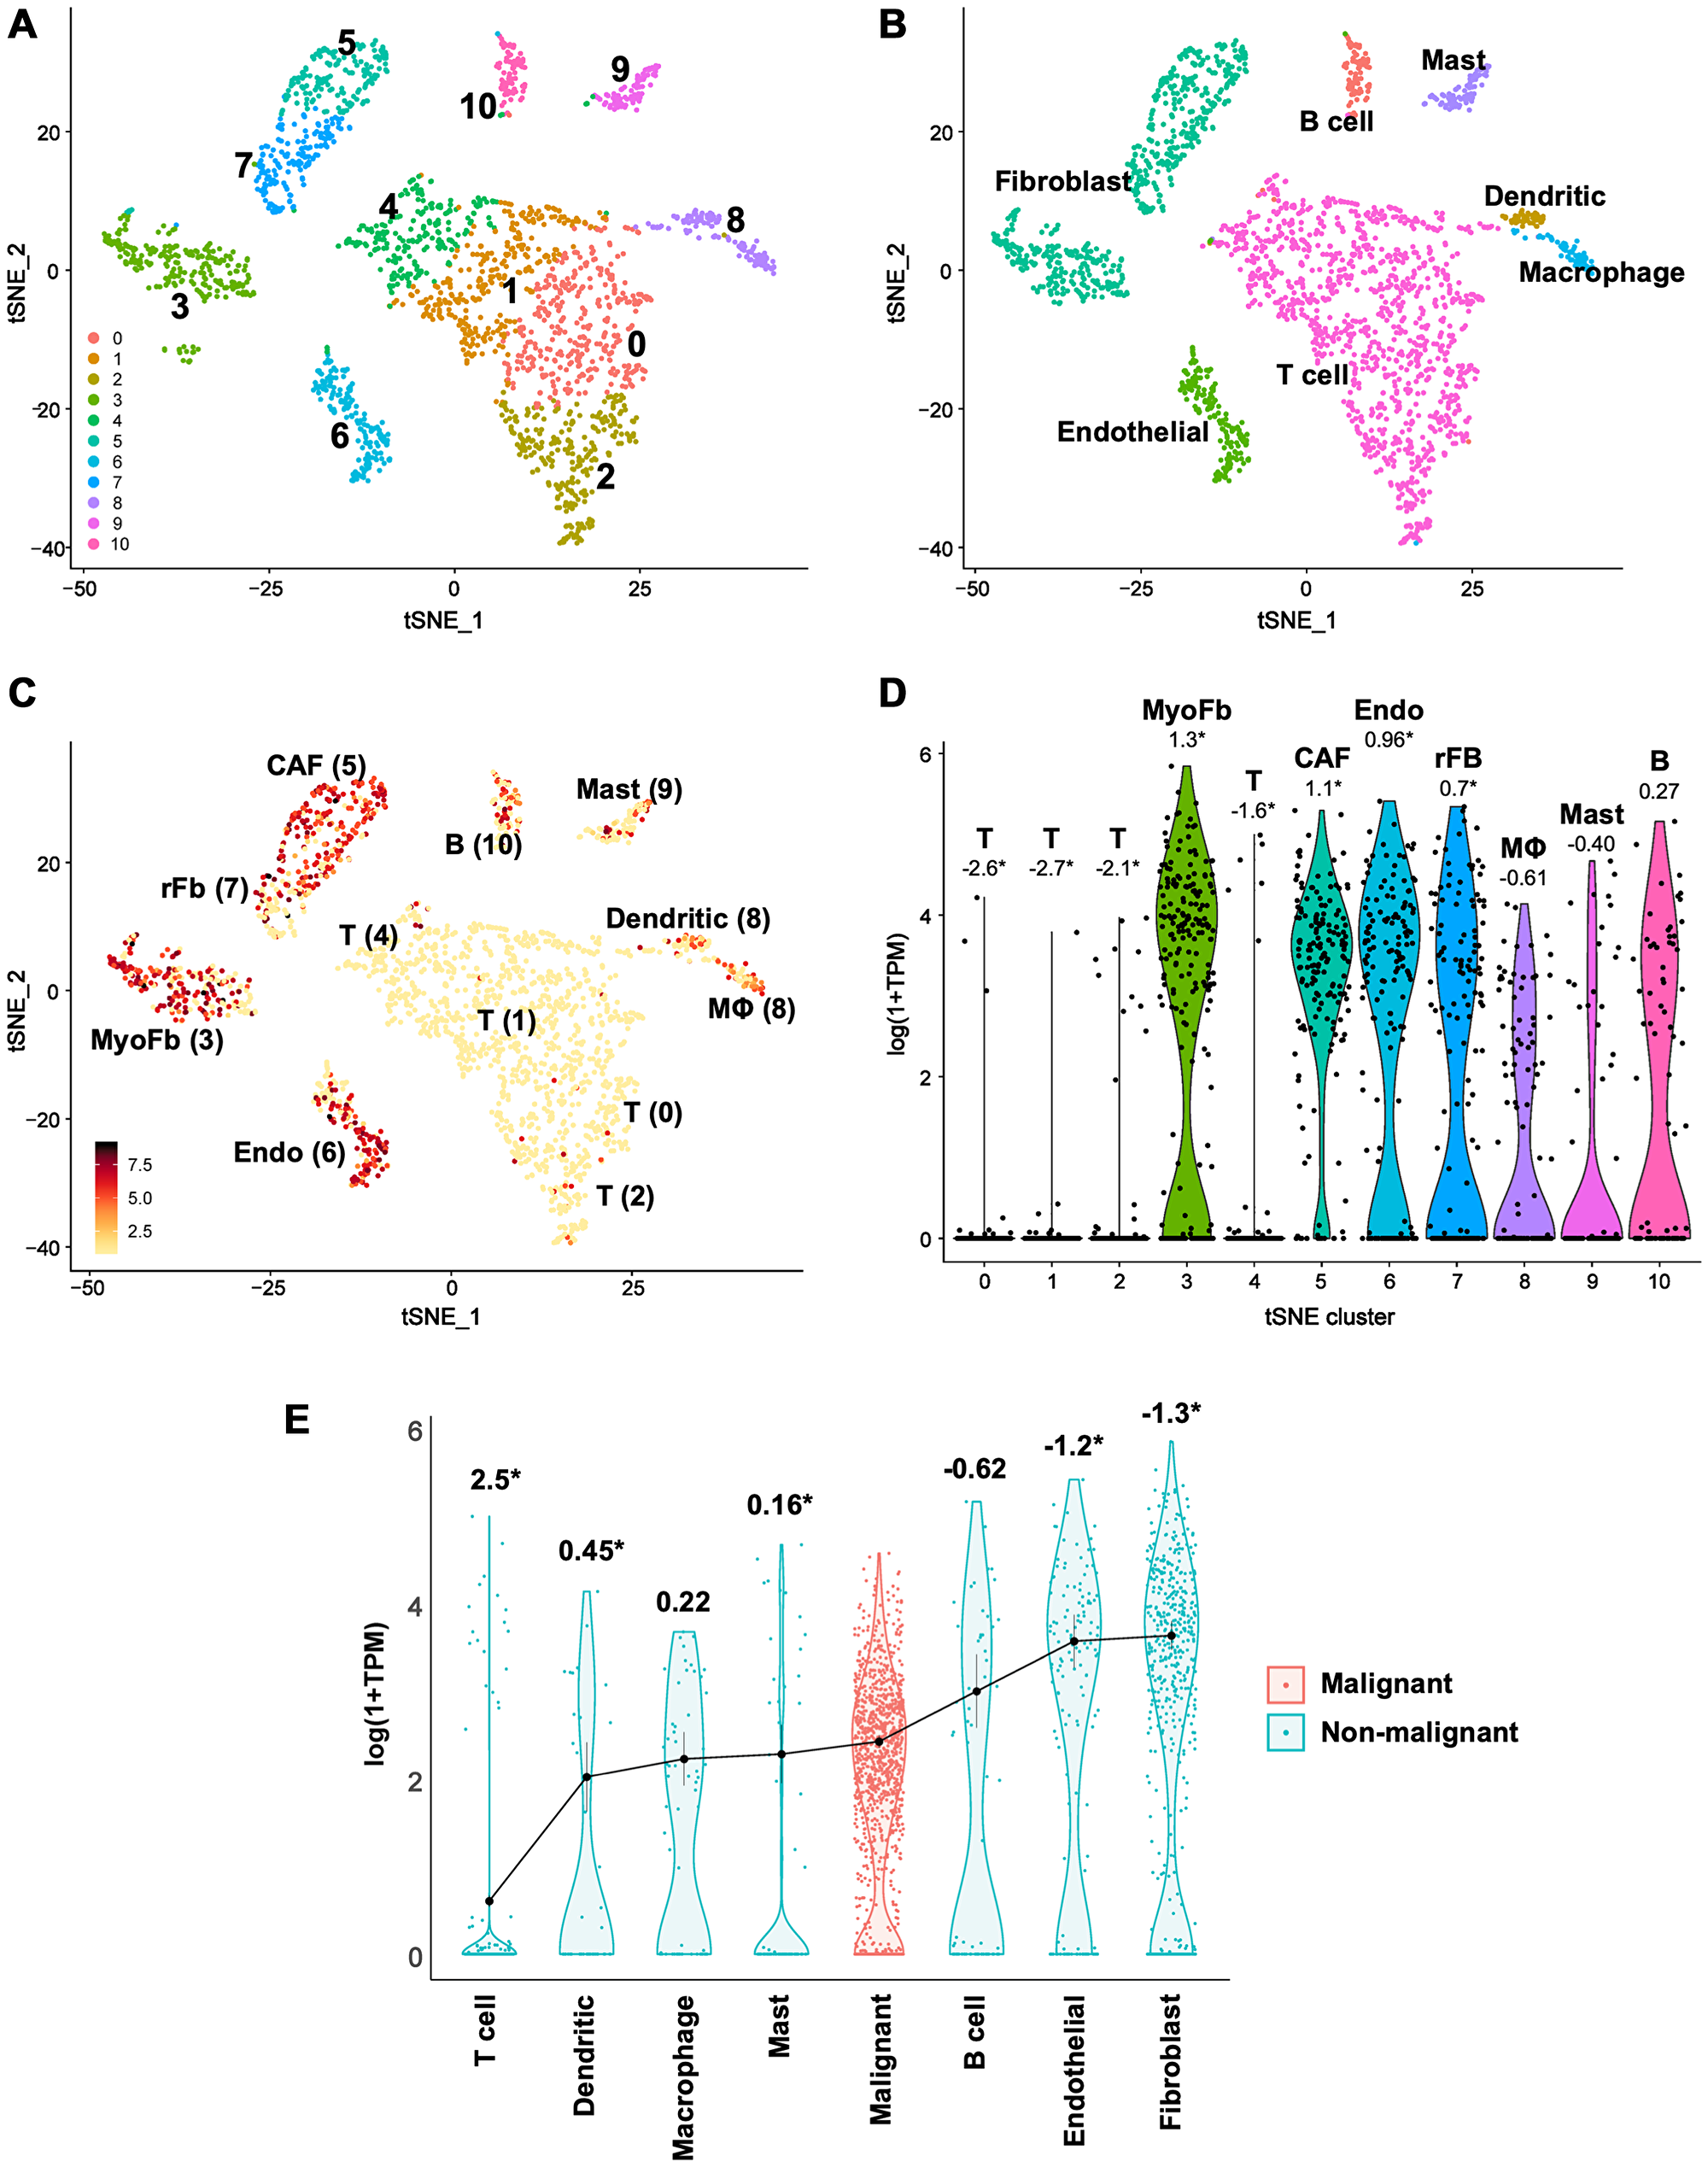
Figure 7: Single-cell RNA-seq data reveal lower CLIC4 expression in malignant tumor cells than in stromal fibroblasts in HNSCC. (A–C) t-distributed Stochastic Neighbor Embedding (t-SNE) plots. (A) t-SNE clusters of all non-malignant cell types. Ten unique clusters were discriminated. (B) Cell type annotation from Puram et al. [57]. (C) CLIC4 expression within t-SNE clusters, imaged values are log (1+TPM). Additional cell type annotations from Puram et al. [57] are indicated near the relevant cluster. (D) Violin plots of CLIC4 expression distribution in cells assigned to the t-SNE clusters. Numbers shown are average log fold change in CLIC4 expression within a cluster vs. the other populations of cells, *indicates significant differential expression detected in a cluster (Bonferroni corrected p ≤ 0.05). (E) Violin plots of CLIC4 expression distribution in the identified cell types. The distributions are ordered by the mean expression of CLIC4 within a cell type. Numbers shown are average log fold change in CLIC4 expression within malignant cells vs. the specified non-malignant cell type, *indicates significant differential expression between malignant and non-malignant cells (Bonferroni corrected p ≤ 0.05). B, B cell; CAF, cancer-associated fibroblast; Endo, endothelial; MΦ, macrophage; MyoFb, myofibroblast; rFb, resting fibroblast; T, T cell; TPM, transcripts per kilobase million.
Stromal immune cells express miR-142-3p in HNSCC tissue
To address the compartmentalization of CLIC4- and miR-142-3p-expressing cells within tumors, we performed in situ hybridization (ISH) for miR-142-3p on serial sections of a human HNSCC tumor tissue microarray. Bright punctate positive signals for the miR-142-3p probe were abundant in the tumor stroma (Figure 8A–8C), while only signals from auto-fluorescing red blood cells were observed for the control scrambled probe (Figure 8D–8F). Subsequent immunohistochemical staining of a serial section for CLIC4 confirmed lower expression in tumor epithelia relative to the stromal compartment regardless of location or stage (Figure 8G–8I). Further staining for T cells (CD3; Figure 8J–8L) and macrophages (CD68; Figure 8M–8O) in additional serial sections found that these immune cells were also abundant in the tumor stroma concurrent with stromal miR-142-3p-positive cells. Although co-localization could not be definitively determined with the techniques employed here, extensive literature describing roles for miR-142-3p within hematopoietic cells strengthens the likelihood that miR-142-3p is present within tumor-associated stromal immune cells [50]. Diffuse miR-142-3p staining was detected in the tumor compartment in some but not all tumors (Figure 8C), suggesting heterogeneity in tumor epithelial cell expression of miR-142-3p or paracrine uptake from neighboring immune cells, which has been documented [59]. Nevertheless, CLIC4 tissue expression appears to be independent of the extent of miR-142-3p-positive infiltrating cells, indicating that additional factors contribute to CLIC4 regulation in vivo.
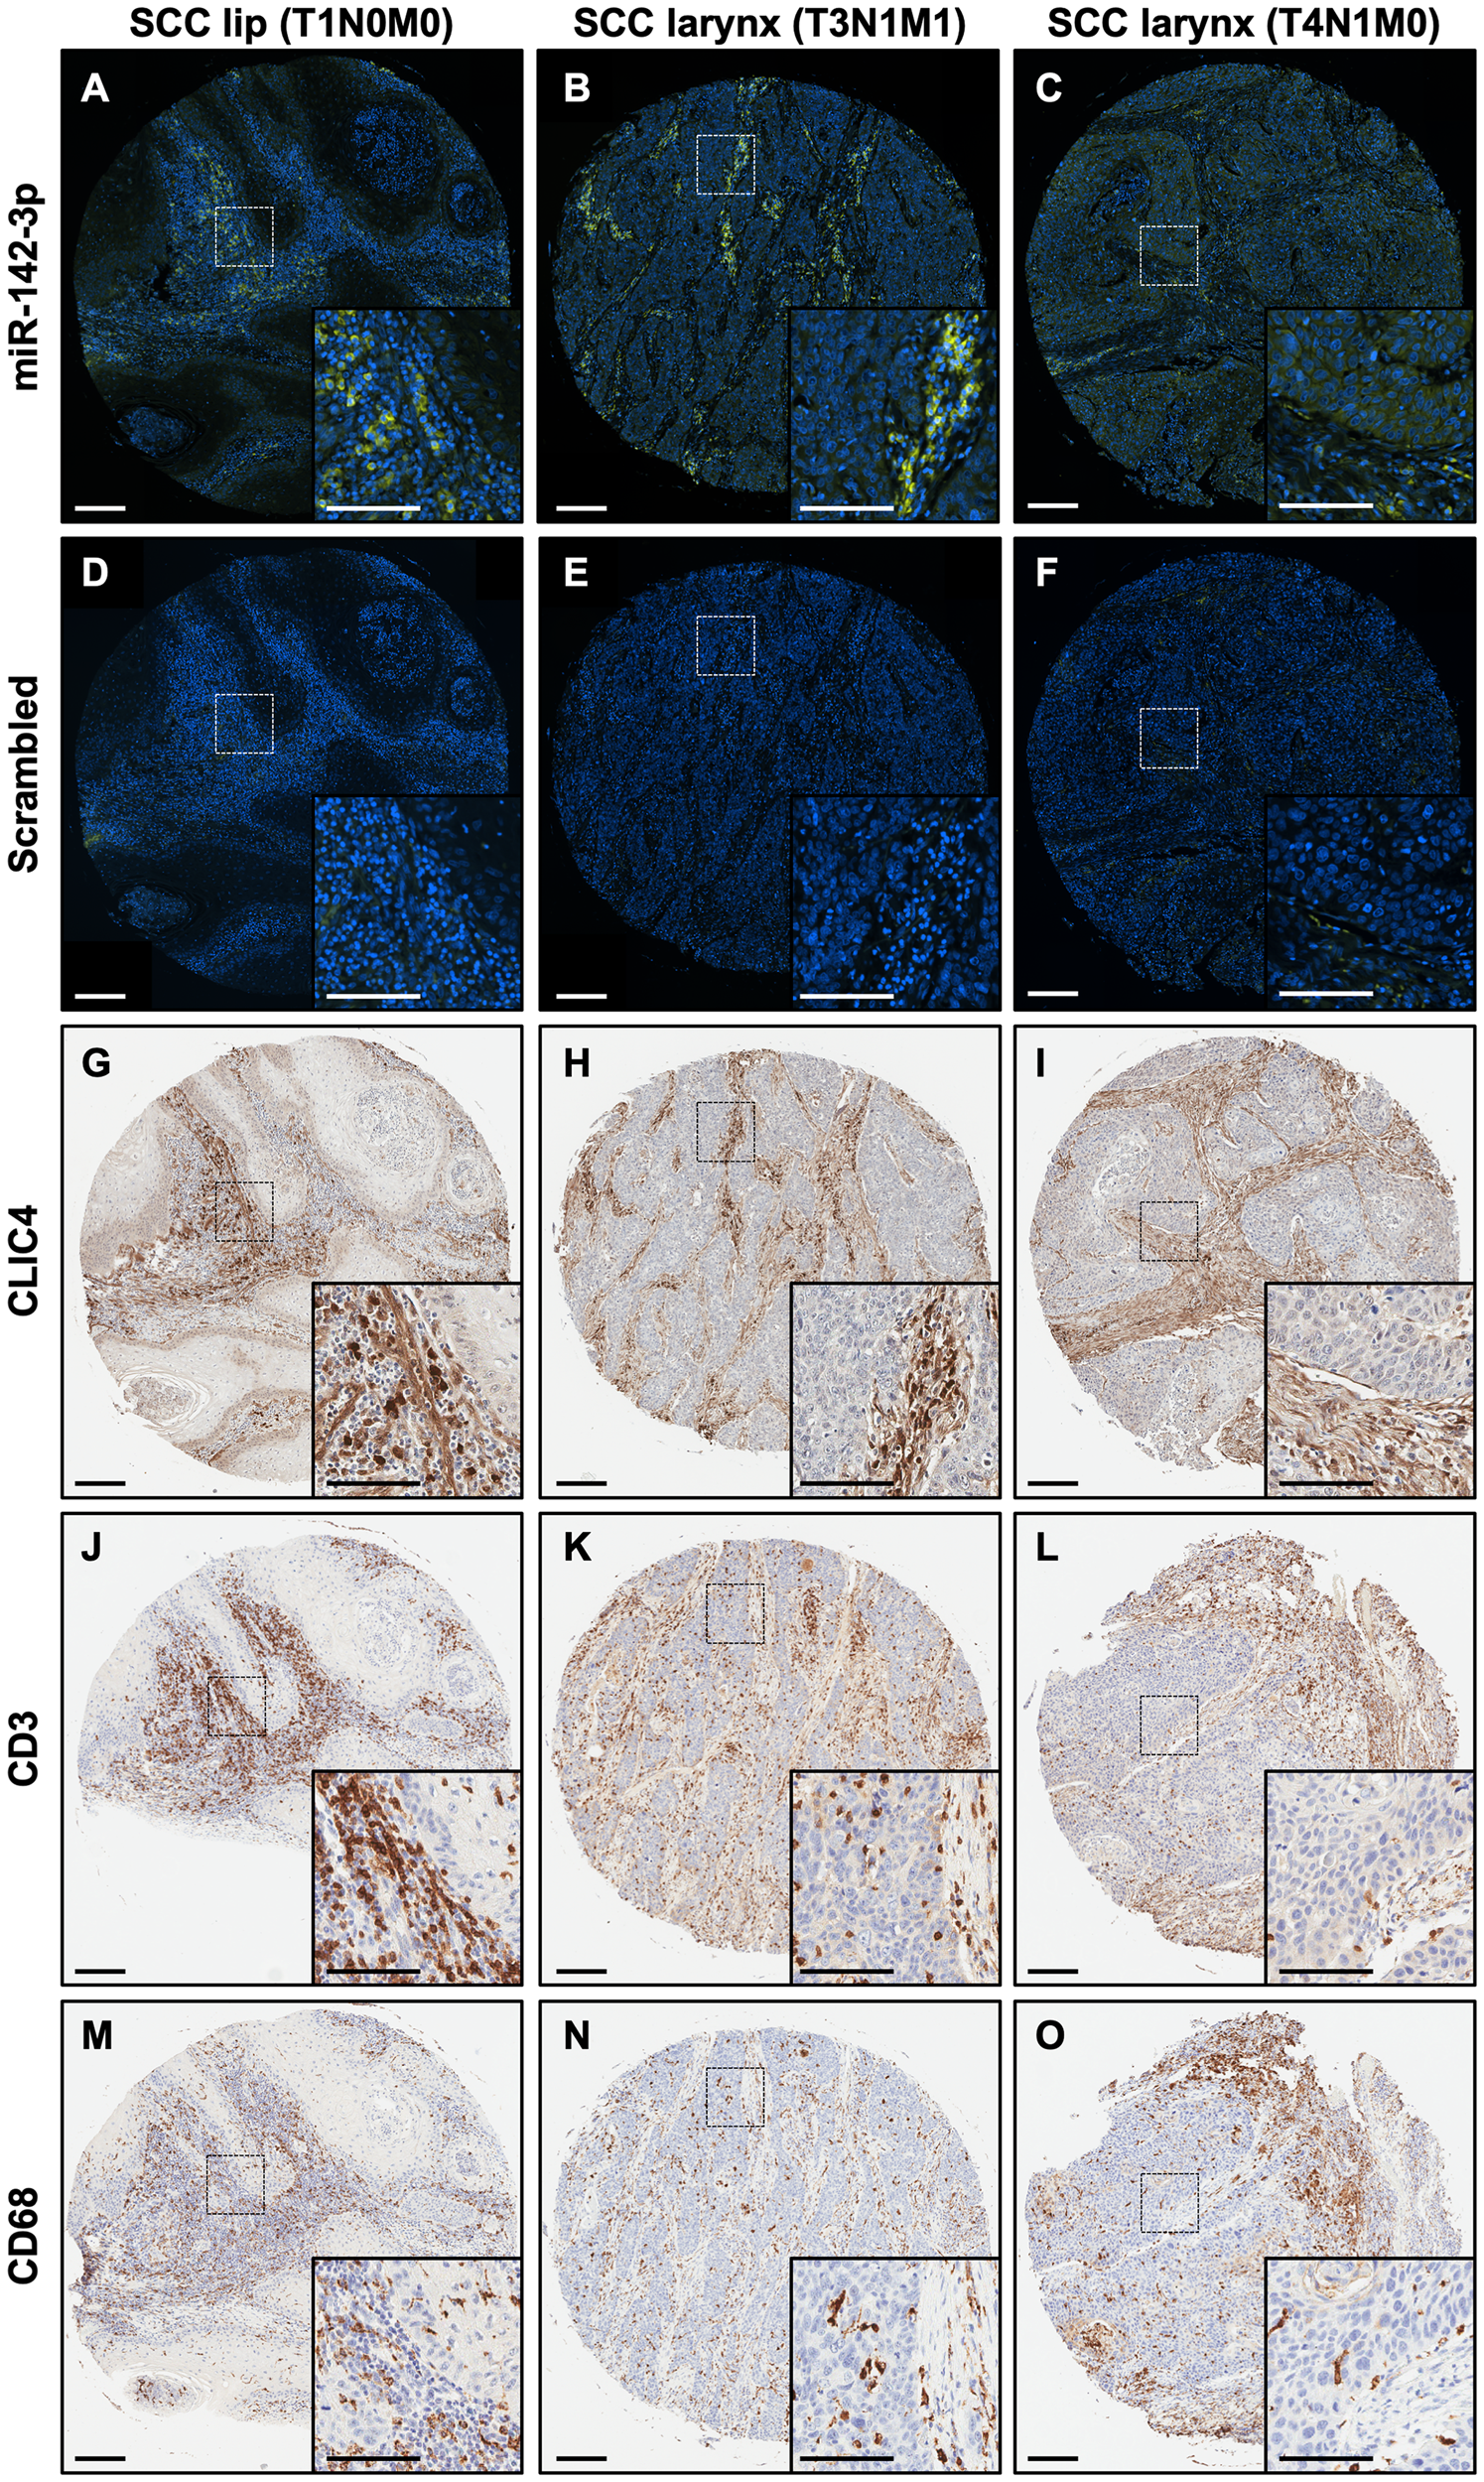
Figure 8: miR-142-3p is expressed in the stromal compartment along with immune cells in HNSCC. (A–C) In situ hybridization with a miR-142-3p probe (green) in human HNSCC. Nuclei are counterstained with DAPI. (D–F) In situ hybridization with a scrambled probe (green) in human HNSCC. Nuclei are counterstained with DAPI. (G–I) Immunohistochemistry for CLIC4 in human HNSCC. (J–L) Immunohistochemistry for CD3, a marker of T cells, in human HNSCC. (M–O) Immunohistochemistry for CD68, a marker of monocytes, in human SCC. Each panel shows a lower magnification (10×) and a dotted box shows the region that is magnified in the inset. Primary scale bar = 200 μm. Inset scale bar = 100 μm. The first column shows consecutive sections of lip SCC tissue (stage T1N0M0), the second column shows consecutive sections of larynx SCC (stage T3N1M1), and the third column shows consecutive sections of larynx SCC (stage T4N1M0). HNSCC, head and neck squamous cell carcinoma; SCC, squamous cell carcinoma.
CLIC4 expression is reduced and miR-142-3p expression elevated when SCC cell lines are transferred from in vitro to form tumors in vivo
Based on the abundance of miR-142-3p in human HNSCC stroma, we reasoned that CLIC4 may be differentially regulated in vivo as compared with in vitro culture because of exposure to microenvironmental factors such as miR-142-3p. We generated xenografts in nude mice with two HNSCC cell lines, SCC4, which expresses low levels of endogenous miR-142-3p, and SCC25, which does not express miR-142-3p in vitro (Figure 5C). Tumor-specific CLIC4 expression was measured using qPCR primers that recognize human (tumor), but not mouse (host), CLIC4. However, because the sequences of human and mouse miR-142-3p are identical, the source of miR-142-3p in vivo could not be distinguished using qPCR. Both SCC4 and SCC25 expressed lower levels of CLIC4 when placed in vivo than when grown in culture (Figure 9A). Conversely, miR-142-3p was more highly expressed in bulk tumors than in either isolated cell line in vitro (Figure 9B). Immunohistochemical staining showed that CLIC4 expression was lower in the tumor compartment in both SCC4 and SCC25 xenografts than in the tumor stroma, which was also positive for αSMA, a marker of myofibroblasts (Figure 9C–9F). Furthermore, despite the use of nude mice that are deficient for T cells, tumors showed infiltration of cells expressing CD45 (Figure 9G, 9H), which is expressed on all nucleated hematopoietic cells, including F4/80-positive macrophages (Figure 9I, 9J) and Ly6G-positive granulocytes/neutrophils (Figure 9K, 9L). While these data do not eliminate the possibility that the SCC cell lines upregulated miR-142-3p when placed in vivo, the abundance of infiltrating immune cells make it likely that the apparent upregulation of miR-142-3p is due to the presence of these high miR-142-3p expressors in bulk tumor lysates. Furthermore, the ability to differentiate between tumor and host CLIC4 with species-specific primers circumvents the limitations of bulk analysis and confirms downregulation of CLIC4 following the transition from in vitro to in vivo growth and exposure to the microenvironmental milieu.
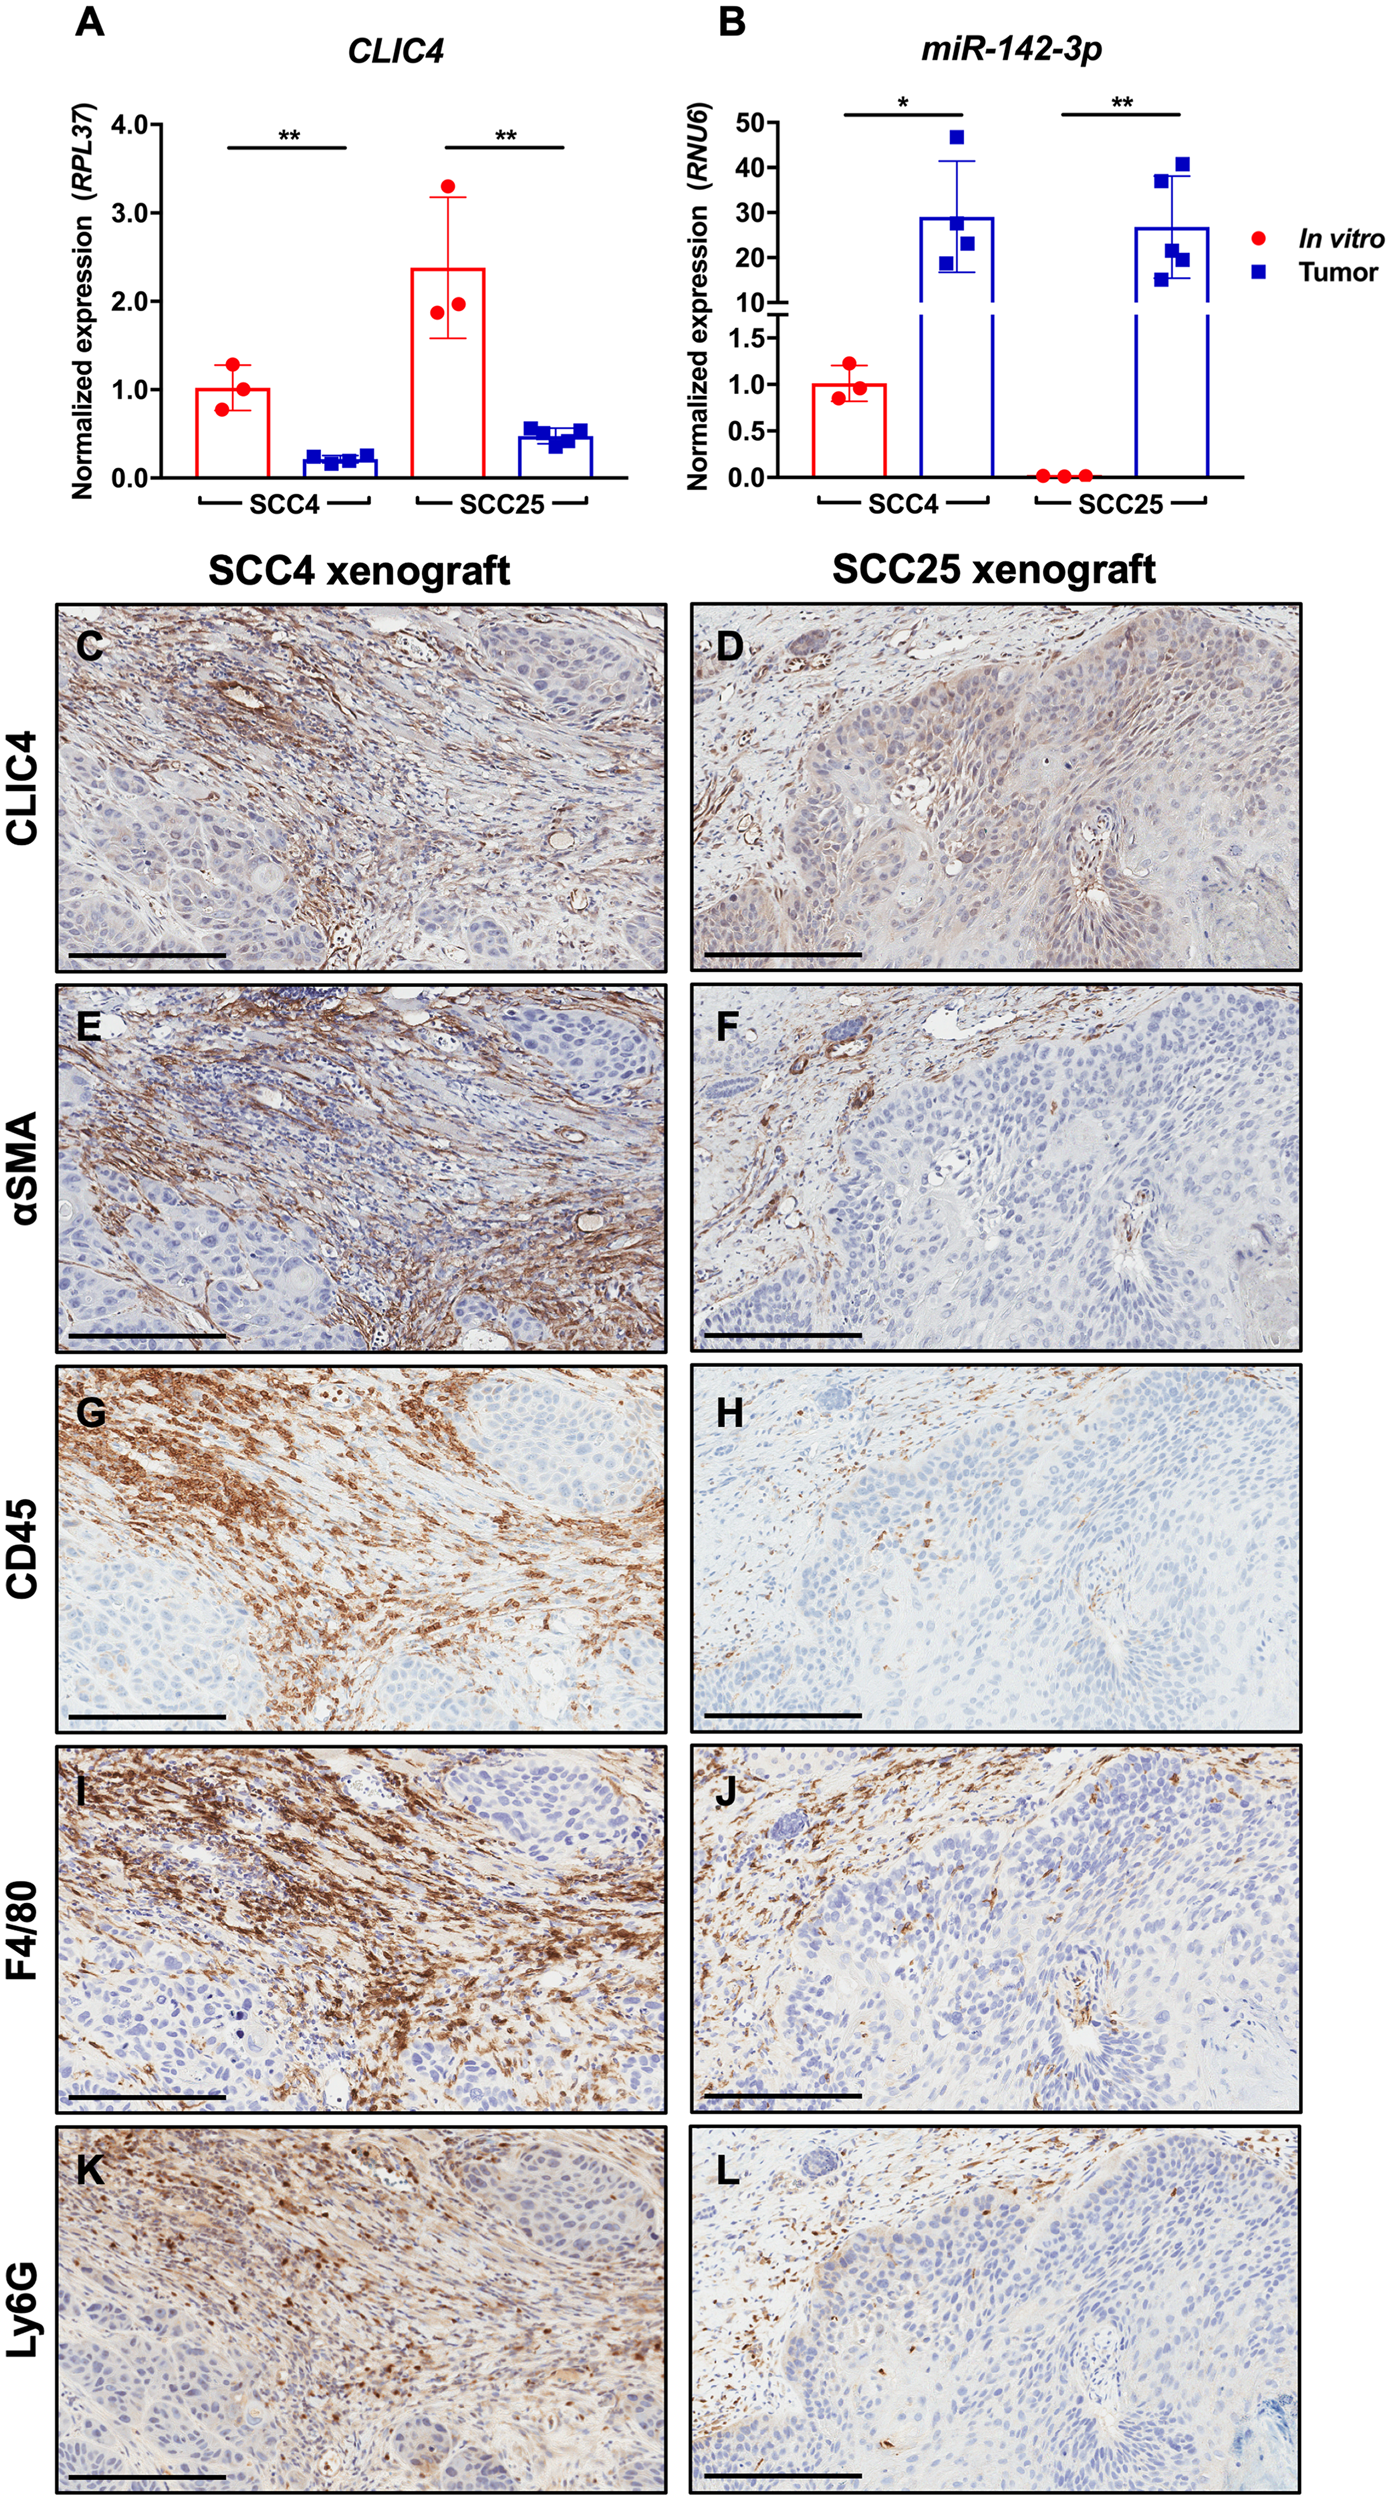
Figure 9: CLIC4 is downregulated in SCC xenografts concurrent with immune cell infiltration and miR-142-3p upregulation. SCC cell line xenografts contain more miR-142-3p and less CLIC4 in vivo. (A) qPCR analysis of human CLIC4 RNA expression in SCC4 and SCC25 cells cultured in vitro and from in vivo xenograft tumors in nude mice. Human-specific primers differentiate between SCC-derived and host-derived (mouse) CLIC4. **p ≤ 0.01 for Student’s t-test comparing in vitro vs. tumor gene expression for SCC4 or SCC25. (B) qPCR analysis of miR-142-3p expression in samples from (A). Human- and mouse-derived miR-142-3p cannot be distinguished. *p ≤ 0.05, **p ≤ 0.01 for Student’s t-test comparing in vitro vs. tumor gene expression for SCC4 or SCC25. (C–D) Immunohistochemistry for CLIC4. (E–F) Immunohistochemistry for αSMA, a marker of activated fibroblasts. (G–H) Immunohistochemistry for CD45, a marker of mouse hematopoietic cells. (I–J) Immunohistochemistry for F4/80, a marker of mouse macrophages. (K–L) Immunohistochemistry for Ly6G, a marker of mouse granulocytes/neutrophils. For all immunohistochemistry, the left column shows consecutive sections of a SCC4 xenograft, and the right column shows consecutive sections of a SCC25 xenograft. Magnification 10 ×. Scale bar = 200 μm. qPCR, quantitative polymerase chain reaction; αSMA, alpha smooth muscle actin.
DISCUSSION
The reduction of CLIC4 in tumor cells in progressing cancers of certain organs, particularly squamous cancers, suggests a tumor suppressor role for the protein. Indeed, in a cutaneous cancer model, overexpression of CLIC4 in epidermis by transgene targeting or administration of exogenous CLIC4 via viral transduction are effective in reducing tumor growth [24]. We now show three tumor types (cervix, esophagus, and head and neck) with low CLIC4 expression in parenchyma relative to stroma. To elucidate the molecular basis for this phenomenon, we first assessed TCGA data and identified few overall and no recurrent CLIC4 mutations and no predominant molecular variable that could explain the changes in CLIC4 expression. We used ENCODE data to analyze protein binding near the CLIC4 promoter and identified binding by members of transcription factor families with known involvement in cancer such as MYC (MYC, MAX), p53 (TP53), AP-1 (FOS, JUN, JUNB, JUND, ATF2), NF-κB (RELA), CTCF, PAX5, and RUNX3 [60]. Although there is a CpG island spanning the CLIC4 promoter, we did not detect differential methylation of this region, suggesting that CLIC4 is not epigenetically silenced by DNA methylation in this context. We also demonstrated for the first time that several miRNAs, including miR-142-3p, are capable of downregulating CLIC4 at the post-transcriptional level. These data lead us to propose that deregulation of CLIC4 in cancer results from the convergence of multiple upstream and downstream regulatory factors, and that different mechanisms of regulation are likely in play within different cell types within the tumor and microenvironment.
miRNAs are heavily dysregulated in cancer, and a single miRNA may have specificity for several hundred mRNA targets [61]. Consequently, aberrant miRNA expression can promote broad regulatory changes that sustain malignant transformation or maintenance [43]. Divergent roles for miR-142-3p as both an oncogene and a tumor suppressor are pervasive in the literature [50], though it is not clear if this is due to cancer-specific intrinsic dependencies or experimental artifacts. For instance, transfection with miRNA mimics at 100 nM results in an intracellular mimic level of 1.8 million copies after 6 hours, a concentration in vast excess of the 100,000 copies of total endogenous mature miRNA per cell. Exposure to supraphysiological miRNA levels leads to non-specific gene expression changes through several mechanisms [62]. Variation in response across cell lines can also be ascribed to differential sensitivity to double-stranded RNA exposure and non-specific interferon-dependent apoptosis [63]. In our study, we sought to limit the use of miRNA mimics and used them only for a few confirmatory studies. We also used mutagenesis to definitively demonstrate that miR-142-3p-mediated downregulation of CLIC4 is dependent on a specific site in the CLIC4 3′UTR. Most importantly, we relied on endogenous miR-142-3p whenever possible and employed in vivo characterization to identify putative interactions between CLIC4 and miR-142-3p in biologically relevant contexts.
We chose to focus on miR-142-3p because of its documented roles in cancer [50], but had difficulty identifying HNSCC cell lines with endogenous expression of miR-142-3p. SCC4 cells had detectable levels of expression, but neither the additional UM-SCC cell lines [64] we screened nor in silico analysis of the Cancer Cell Line Encyclopedia (CCLE) [65] identified any other HNSCC cell lines with endogenous miR-142-3p expression. In fact, CCLE data suggest that miR-142-3p expression is largely restricted to hematopoietic cells and its genomic locus is heavily methylated in most other cell types (data not shown). Indeed, treatment with 5-aza-2’-deoxycytidine to inhibit CpG methylation is sufficient to induce miR-142-3p expression in murine fibroblasts and human mesenchymal cells, suggesting that the miR-142 gene is epigenetically repressed by DNA methylation in non-hematopoietic cell types [66, 67]. Another study suggests that miR-142-3p is expressed in oral SCC cell lines but selectively secreted in extracellular vesicles (EVs) to decrease its intracellular concentration [68], but we could not independently replicate these findings and CCLE data indicate that the miR-142 locus is also methylated in the Cal27 cell line used in the study (data not shown). Nonetheless, other data confirm that miR-142-3p is indeed released in EVs, particularly from bone marrow-derived cells, and can affect target gene expression in recipient cells in a paracrine manner. This has been directly documented for macrophages [59, 69, 70], T cells [71–73], and bone marrow-derived mesenchymal stem/stromal cells [74], with uptake and activity in recipient endothelial and cancer cells [59, 69–71, 74]. Additional data support the use of miR-142-3p as a biomarker due to elevation of circulating miR-142-3p levels in various pathological states [75–96]. In fact, a recent review defined miR-142-3p as one of a core set of biomarker miRNAs for atopic diseases because of its frequent association with allergic inflammation and immune cell dysfunction [97].
Our validation of CLIC4 as a genuine miR-142-3p target provides one putative mechanism for CLIC4 regulation within tumors. We were encouraged by our identification of a reciprocal relationship between CLIC4 and miR-142-3p expression, particularly in stage III/IV cervical SCC and HNSCC samples from TCGA, which is further supported by reports of stage-specific miR-142-3p upregulation during human bronchial squamous carcinogenesis [98]. Thus, miR-142-3p levels are highest in advanced squamous tumors where we previously noted the lowest levels of CLIC4 in tumor epithelium [23]. Several other studies report an association between high miR-142-3p levels in HNSCC and clinical features such as nodal invasion, poor prognosis, and reduced progression-free survival [99–102]. However, when considering that HNSCCs are among the most highly immune-infiltrated cancer types [103] and the known abundance of miR-142-3p within immune cells [50], we sought to determine the source of elevated miR-142-3p detected in bulk HNSCC tumors by leveraging the spatial resolution afforded by ISH. This revealed that miR-142-3p-expressing cells were localized predominantly to the stromal compartment. Immunostaining of serial tumor sections confirmed that CLIC4 expression was lower in tumor than stroma and that immune cell infiltrates positive for CD3 (T cells) and CD68 (monocytes) were abundant in the stroma. In other circumstances of miR-142-3p upregulation in bulk tissue, such as psoriasis [104] and intestinal allograft rejection [105], ISH has also shown that the source of miR-142-3p is infiltrating immune cells positive for markers of either T cells or monocytes/macrophages. Reports of dynamic evolution of tumor-infiltrating immune populations during HNSCC progression may also account for the stronger inverse relationship between CLIC4 and miR-142-3p in advanced tumors if miR-142-3p is more strongly expressed or secreted by a distinct immune cell type [106]. Thus, the miR-142-3p upregulation described in certain cancers may be due to the presence of immune cells in tissue homogenates, which can only be distinguished by single-cell sequencing or in situ analysis. This, as well as the specific immune cell types expressing miR-142-3p, should be considered in future analyses, and those ascribing biomarker function to miR-142-3p should determine if it is a tumor cell-autonomous biomarker, a general marker of inflammation, or a marker of specific tumor-associated immune cell states, the latter of which could have implications for sensitivity to immunotherapy [107].
The contribution of stromal CLIC4 to overall expression levels in bulk analysis was also made clear by our assessment of publicly available HNSCC scRNA-seq data [57]. Though we previously described reciprocal changes in CLIC4 expression between tumor epithelium and stroma during disease progression [23], this has never been quantified at the resolution made possible by scRNA-seq. We found that CLIC4 expression was higher in tumor-associated fibroblasts and endothelial cells than in malignant tumor epithelial cells. This is supported by known roles of CLIC4 in supporting myofibroblast differentiation [11] and in endothelial cell proliferation and angiogenesis [4, 5]. CLIC4 was notably absent from tumor-infiltrating T cells of all subtypes, despite prior documented expression in T cells [108]. Therefore, T cells, which are known to express miR-142-3p, may represent a cellular context in which miR-142-3p represses CLIC4 to promote intrinsic phenotypic changes. CLIC4 is also highly expressed in other immune cells and is particularly abundant in activated macrophages [20]. At this time, it is not clear if the biological role for the interaction between CLIC4 and miR-142-3p is to fine-tune gene expression within immune cells or if miR-142-3p is transferred from immune cells to tumor cells to downregulate CLIC4 in a paracrine manner, but this will be the basis of future investigation.
Our finding that CLIC4 is expressed in several HNSCC cell lines in vitro but is downregulated upon shifting from culture to growth as in vivo xenografts suggests that CLIC4 expression is altered by the transition to anchorage-independent growth or exposure to factors from the host microenvironment. Xue et al. also reported CLIC4 expression in HN4, an additional HNSCC cell line, but suggested that CLIC4 is elevated in HNSCC and its knockdown sensitizes HN4 cells to apoptosis [109]. However, we contend that the study design and exclusive use of in vitro manipulations, in light of the dynamic regulation of CLIC4 in vivo, does not tell the entire story. The influence of extracellular factors to modulate CLIC4 expression has been demonstrated for stromal fibroblasts, which depend on tumor cell-derived TGF-β for CLIC4 induction [11]. Our proposal that paracrine miR-142-3p is responsible for CLIC4 downregulation in tumor epithelium is with the caveat that miR-142-3p could have the same effect on CLIC4 in fibroblasts. While exosomes have been documented to have different tropisms for localization and uptake based on patterns of integrin expression [110], we have yet to determine if miR-142-3p is indeed released from immune cell exosomes into tumor or stromal fibroblasts in this context, or if the quantity would be sufficient to downregulate CLIC4 to the extent observed within tumors. The degree of miRNA-mediated repression is dependent on both the miRNA and target gene expression level, resulting in either on/off switch-like regulation or more discrete fine-tuning [111]. Thus, cells such as tumor-associated fibroblasts, in which TGF-β drives strong upregulation of CLIC4 may be less sensitive to miRNA regulation of CLIC4 than a cell with intermediate expression [11]. Based on our findings, we conclude that miR-142-3p is unlikely the sole cause of attenuated CLIC4 expression in HNSCC tumor epithelium, but one of many regulators. Our initial miRNA screen also identified miR-122-5p as a regulator of CLIC4, and miR-122-5p was recently reported to be elevated in the saliva of patients with HNSCC [112]. Thus, other miRNAs and microenvironmental factors, including cytokines known to induce CLIC4 such as TGF-β and TNF-α, likely work in concert to modulate CLIC4 expression [11, 33, 113].
This is the first study to definitively demonstrate that CLIC4 is not regulated by somatic mutation, copy number alteration, or promoter methylation in SCC. Our identification of CLIC4 as a bona fide target of miR-142-3p has profound implications for future studies of CLIC4 biology, particularly if the interaction is identified in an endogenous context rather than following forced overexpression. Finally, our application of in situ and single-cell analysis to demonstrate discrete patterns of expression for both CLIC4 and miR-142-3p underscores the fact that bulk expression data should be used with caution. Particularly, the cell of origin should be clearly identified for any molecule proposed as a biomarker, which is becoming more realistic in the modern era of rapidly improving and increasingly accessible single-cell technology.
Materials and Methods
Immunohistochemistry
Immunohistochemistry was performed on serial sections from tissue microarrays (HN803e, BCN963b, and ES804) from US Biomax and cervical cancer specimens were provided by the Naval Medical Center San Diego. Immunohistochemistry for CLIC4 (Cell Signaling Technology Cat# 12644; RRID: AB_2797976) and αSMA (Cell Signaling Technology Cat# 19245; RRID: AB_2734735) was performed as described in our protocol at dx. doi. org/10.17504/protocols.io.2figbke. Immunohistochemistry for CD3, CD68, CD45, F4/80, and Ly6G was performed by the Pathology/Histotechnology Laboratory at the Frederick National Laboratory for Cancer Research. Brightfield images were obtained with an Aperio AT2 digital slide scanner followed by analysis with Aperio ImageScope software (Leica Biosystems).
Bioinformatic analysis
The Cancer Genome Atlas (TCGA, RRID: SCR_003193) was queried using cBioPortal [39, 40] (RRID: SCR_014555) and EDGE in TCGA [41]. To assess CLIC4 alteration frequency, all TCGA Pan Cancer Atlas studies were selected and filtered to include only those with both mutations and copy number alteration data (n = 9870). For EDGE analysis we accessed the EDGE R/Shiny application at http://ls-shiny-prod.uwm.edu/edge_in_tcga/ and queried the “gene-wise pan-cancer” tool for CLIC4 (n = 3228). The UCSC Genome Browser (RRID: SCR_005780) was utilized to align ENCODE Regulation Transcription Factor ChIP tracks (RRID: SCR_006793), CpG islands, and other features at the CLIC4 locus [42]. TargetScan (RRID: SCR_010845), DIANA-microT-CDS (RRID: SCR_016510), and miRmap (RRID: SCR_016508) were used to identify putative CLIC4-targeting miRNAs [45–47]. miRTarBase was used to assess fold change in expression for CLIC4 and miR-142-3p in HNSCC vs. matched normal samples [52]. For expression correlation analysis, data from HNSCC and cervical SCC in TCGA were obtained and imported into the R statistical program [114] (RRID: SCR_001905) using the RTCGA package [115]: specifically, normalized miRNA-seq read counts, normalized RNA-seq read counts, and collated clinical data. Cancer staging was primarily determined with pathologic stage, as provided by TCGA, and supplemented with clinical stage as needed. Spearman’s correlation was used to evaluate the relationship between miR-142-3p and CLIC4. For CLIC4 expression distribution analysis in HNSCC single cells, public scRNA-seq data from 18 patients [57] were downloaded from GEO (RRID: SCR_005012) accession number GSE103322. The t-distributed Stochastic Neighbor Embedding (t-SNE) method was applied for clustering of a subset of 2158 non-malignant cells processed with the Super Script II enzyme. The R Seurat package [116] was used to generate the t-SNE mapping with default parameters and principal component analysis (PCA) reduction with eight principal components. A Wilcoxon rank-sum test was performed to estimate differential upregulation or downregulation of CLIC4 in a cluster vs. the other populations of cells or between malignant and non-malignant cell types (R Seurat FindAllMarkers function).
Cell culture
293T cells were cultured in Dulbecco’s modified Eagle’s medium (DMEM) containing 10% fetal bovine serum (FBS; Gibco, Thermo Fisher Scientific) and penicillin/streptomycin. Human neonatal epidermal keratinocytes (HK; Lonza Cat# 00192906) were cultured in EpiLife medium (Thermo Fisher Scientific). SCC4 (ATCC Cat# CRL-1624; RRID: CVCL_1684), SCC9 (ATCC Cat# CRL-1629; RRID: CVCL_1685), SCC15 (ATCC Cat# CRL-1623; RRID: CVCL_1681), and SCC25 (ATCC Cat# CRL-1628; RRID: CVCL_1682) cells were obtained from the American Type Culture Collection (ATCC) and were cultured in DMEM/F12 (Mediatech, Corning Life Sciences) containing 10% FBS, penicillin/streptomycin, and 400 ng/mL hydrocortisone (Sigma-Aldrich). Cell morphology and confluence assessments were performed using an IncuCyte FLR live cell imaging system (Essen BioScience).
Bisulfite sequencing
Genomic DNA was isolated from HK, SCC4, SCC9, SCC15, and SCC25 cells by incubating cell pellets overnight at 55°C in lysis buffer (100 mM NaCl, 10 mM Tris-Cl pH 8.0, 25 mM EDTA pH 8.0, 0.5% SDS, and 0.1 μg/μL proteinase K) followed by phenol/chloroform extraction and ethanol precipitation. Bisulfite conversion and purification of converted DNA was performed using a Bisulfite Conversion Kit (Active Motif) according to the manufacturer’s instructions. The test region was amplified by PCR using AmpliTaq Gold 360 (Applied Biosystems) with primers shown in Supplementary Table 4. PCR products were cloned using TOPO-TA cloning according to the manufacturer’s instructions (Thermo Fisher Scientific). Individual clones were isolated and sequenced by the CCR Genomics Core (National Cancer Institute, Bethesda, MD, USA) using an M13R primer (Thermo Fisher Scientific). Sequencing reads were trimmed in Sequencher (Gene Codes) and bisulfite conversion rate and methylated CpGs were determined using BiQ Analyzer (RRID: SCR_008423).
Luciferase reporter assay
miTarget CLIC4 3′UTR target reporter and pEZX-MT05 control plasmids were obtained from Genecopoeia. The plasmids contain the CLIC4 3′UTR downstream of Gaussia luciferase (GLuc) or GLuc alone and secreted alkaline phosphatase (SEAP) for normalization. 293T cells were seeded in 48-well plates at 60,000 cells/cm2. The next day, cells were transfected using Lipofectamine 3000 (Thermo Fisher Scientific) according to the manufacturer’s protocol with 62.5 ng of reporter plasmid and miRNA mimics at a final concentration of 10–20 nM (Dharmacon) or target protector (QIAGEN) at 0.1–1 μM per well. Transfections were performed in antibiotic-free DMEM containing 10% FBS, and the medium was changed 24 hours after transfection. Supernatants were harvested at 48–72 hours after transfection. GLuc and SEAP activity were quantified using the Secrete-Pair Dual Luminescence Assay Kit (Genecopoeia) according to the manufacturer’s protocol. Luminescence was detected using an Infinite M200 plate reader (Tecan).
Western blotting
Cell lysates were prepared using radioimmunoprecipitation assay (RIPA) buffer (Cell Signaling Technology) containing protease inhibitors (Thermo Fisher Scientific). Protein concentrations were determined using the Pierce BCA Protein Assay Kit (Thermo Fisher Scientific). Equal amounts of protein were resolved on 4–20% Criterion TGX gels (Bio-Rad) and transferred to nitrocellulose membranes using the Trans-Blot Turbo Transfer System (Bio-Rad). Membranes were blocked in 5% milk dissolved in tris-buffered saline with 0.1% Tween 20 (TBST) for 1 hour at room temperature. Membranes were then incubated with primary antibody diluted in 3% bovine serum albumin (BSA) in TBST at 4°C overnight, followed by washing in TBST, incubation with HRP-conjugated goat anti-rabbit secondary antibody at 1:10,000 (Cell Signaling Technology Cat# 7074, RRID: AB_2099233) in 3% BSA/TBST for 1 hour at room temperature, and a final set of washes in TBST. Proteins were detected using the SuperSignal West Pico Chemiluminescent Substrate (Thermo Fisher Scientific) and visualized using a ChemiDoc Touch Imager (Bio-Rad). Primary antibodies and dilutions included CLIC4 at 1:3000 (Cell Signaling Technology Cat# 12644, RRID: AB_2797976), HSP90 at 1:3000 (Cell Signaling Technology Cat# 4877, RRID: AB_2233307), TGFBR1 at 1:500 (Abcam Cat# ab31013, RRID: AB_778352), and p21 at 1:1000 (Cell Signaling Technology Cat# 2947, RRID: AB_823586).
Site-directed mutagenesis
Site-directed mutagenesis of the CLIC4 3′UTR reporter plasmid was performed using the QuikChange Lightning Site-Directed Mutagenesis Kit (Agilent) according to the manufacturer’s protocol. Mutagenesis primer sequences are shown in Supplementary Table 4.
Mimic and inhibitor transfection
SCC4 cells were seeded at 10,000/cm2 and SCC9, SCC15, and SCC25 cells were seeded at 20,000/cm2 in 6-well plates. The next day, control mimic (Dharmacon), miR-142-3p mimic (Dharmacon), or CLIC4 siRNA (QIAGEN) were transfected at 20 nM using Lipofectamine 3000 (Thermo Fisher Scientific) according to the manufacturer’s instructions. For inhibitor experiments, 25–100 nM control inhibitor (Dharmacon) or miR-142-3p inhibitor (Dharmacon) was transfected into SCC4 cells with Attractene (QIAGEN) according to the manufacturer’s instructions. Dishes were rinsed with PBS and snap frozen for later protein extraction at 48–72 hours after transfection.
In situ hybridization
Serial sections of a human HNSCC tumor tissue microarray (HN802e) were obtained from US Biomax. miRNA in situ hybridization was performed by Multiplex DX (Gaithersburg, MD, USA) with a double-DIG-labeled locked-nucleic acid miR-142-3p probe (QIAGEN) or control scrambled probe as previously described [117]. Fluorescent images were obtained using a Nikon ECLIPSE Ti2 microscope and an identical exposure time and intensity settings were used for all images.
Quantitative reverse transcription PCR
RNA was extracted using the miRNeasy Mini Kit and the QIAcube platform (QIAGEN). mRNA was reverse transcribed using the iScript cDNA Synthesis Kit (Bio-Rad). For miRNA, gene-specific reverse transcription was performed as described by Kramer 2011 [118] using NxGen M-MuLV Reverse Transcriptase, NxGen RNAse Inhibitor, and PCR Grade dNTPs (Lucigen). PCR was performed with iQ SYBR Green Supermix (Bio-Rad). Primer sequences are shown in Supplementary Table 4. Thermal cycling and detection were performed using the CFX Connect Real-Time PCR Detection System (Bio-Rad) and data were processed using CFX Manager software (Bio-Rad).
SCC xenografts
Mouse studies were performed under a protocol approved by the National Cancer Institute and the National Institutes of Health Animal Care and Use Committee. SCC4 cells (1 × 10⁶) or SCC25 cells (2 × 10⁶) were injected intradermally into the back of 6-12-week-old female athymic nude mice. Tumors were harvested when they reached at least 200 mm3. Portions of each tumor were flash frozen for subsequent biochemical analysis or fixed in 10% neutral buffered formalin (Fisher Scientific) followed by paraffin embedding and sectioning (Histoserv, Germantown, MD, USA).
Statistical analysis
All cell line and xenograft data were analyzed using GraphPad Prism. For data with more than two groups, significance was determined using an analysis of variance (ANOVA) test with Dunnett’s correction for multiple comparisons. For data with two groups, significance was determined using an unpaired Student’s t-test. *p ≤ 0.05, **p ≤ 0.01, ***p ≤ 0.001, ****p ≤ 0.0001.
Abbreviations
ACD: AML/RUNX, CLIC, DSCR/RCAN; ADC: adenocarcinoma; AP-1: activator protein 1; αSMA: alpha smooth muscle actin; ATF: activating transcription factor; bp: base pair; BMDM: bone marrow-derived macrophage; CAF: cancer-associated fibroblast; CCLE: cancer cell line encyclopedia; CCR: Center for Cancer Research; CEBPB: CCAAT enhancer binding protein beta; ChIP: chromatin immunoprecipitation; CK2: casein kinase 2; CLIC: chloride intracellular channel; CTCF: CCCTC-binding factor; CREB: cyclic AMP response element-binding protein; DHS: DNase hypersensitivity site; EDGE: exploring drivers of gene expression; ENCODE: encyclopedia of DNA elements; EV: extracellular vesicle; FC: fold-change; GEO: gene expression omnibus; GLuc: Gaussia luciferase; HNSCC: head and neck squamous cell carcinoma; IHC: immunohistochemistry; ISH: in situ hybridization; LPS: lipopolysaccharide; MAX: MYC-associated factor X; μM: micromolar; miRNA/miR: microRNA; NCI: National Cancer Institute; NF-κB: nuclear factor kappa-light-chain-enhancer of activated B cells; nM: nanomolar; NRF1: nuclear respiratory factor 1; OCT4: octamer-binding transcription factor 4; PAX5: paired box 5; PKC: protein kinase C; qPCR: quantitative polymerase chain reaction; RCAN: regulator of calcineurin; scRNA-seq: single-cell RNA sequencing; SEAP: secreted alkaline phosphatase; SCC: squamous cell carcinoma; siRNA: small interfering RNA; SOX2: SRY-box transcription factor 2; TCF3: transcription factor 3; TCGA: The Cancer Genome Atlas; TGF-β: transforming growth factor beta; TLR: toll-like receptor; TNF-α: tumor necrosis factor alpha; TP: target protector; TP53: tumor protein 53; t-SNE: t-distributed Stochastic Neighbor Embedding; UCSC: University of California, Santa Cruz; UTR: untranslated region.
ACKNOWLEDGMENTS
The results shown here are in whole or part based upon data generated by the TCGA Research Network: https://cancergenome.nih.gov/. We would like to thank Ross Lake of the Laboratory of Genitourinary Cancer Pathogenesis Microscopy Core Facility for miRNA in situ imaging and Jennifer Dwyer of the Laboratory of Cancer Biology and Genetics Molecular Pathology Unit for IHC slide scanning.
CONFLICTS OF INTEREST
The authors declare no conflicts of interest.
FUNDING
This work was supported by National Cancer Institute intramural support Project ZIA BC 005445.
References
1. Serrano-Candelas E, Farre D, Aranguren-Ibanez A, Martinez-Hoyer S, Perez-Riba M. The vertebrate RCAN gene family: novel insights into evolution, structure and regulation. PLoS One. 2014; 9:e85539. https://doi.org/10.1371/journal.pone.0085539. [PubMed].
2. Peretti M, Angelini M, Savalli N, Florio T, Yuspa SH, Mazzanti M. Chloride channels in cancer: Focus on chloride intracellular channel 1 and 4 (CLIC1 AND CLIC4) proteins in tumor development and as novel therapeutic targets. Biochim Biophys Acta. 2015; 1848:2523–2531. https://doi.org/10.1016/j.bbamem.2014.12.012. [PubMed].
3. Bohman S, Matsumoto T, Suh K, Dimberg A, Jakobsson L, Yuspa S, Claesson-Welsh L. Proteomic analysis of vascular endothelial growth factor-induced endothelial cell differentiation reveals a role for chloride intracellular channel 4 (CLIC4) in tubular morphogenesis. J Biol Chem. 2005; 280:42397–42404. https://doi.org/10.1074/jbc.M506724200. [PubMed].
4. Tung JJ, Hobert O, Berryman M, Kitajewski J. Chloride intracellular channel 4 is involved in endothelial proliferation and morphogenesis in vitro. Angiogenesis. 2009; 12:209–220. https://doi.org/10.1007/s10456-009-9139-3. [PubMed].
5. Ulmasov B, Bruno J, Gordon N, Hartnett ME, Edwards JC. Chloride intracellular channel protein-4 functions in angiogenesis by supporting acidification of vacuoles along the intracellular tubulogenic pathway. Am J Pathol. 2009; 174:1084–1096. https://doi.org/10.2353/ajpath.2009.080625. [PubMed].
6. Wojciak-Stothard B, Abdul-Salam VB, Lao KH, Tsang H, Irwin DC, Lisk C, Loomis Z, Stenmark KR, Edwards JC, Yuspa SH, Howard LS, Edwards RJ, Rhodes CJ, et al. Aberrant chloride intracellular channel 4 expression contributes to endothelial dysfunction in pulmonary arterial hypertension. Circulation. 2014; 129:1770–1780. https://doi.org/10.1161/CIRCULATIONAHA.113.006797. [PubMed].
7. Abdul-Salam VB, Russomanno G, Chien-Nien C, Mahomed AS, Yates LA, Wilkins MR, Zhao L, Gierula M, Dubois O, Schaeper U, Endruschat J, Wojciak-Stothard B. CLIC4/Arf6 pathway. Circ Res. 2019; 124:52–65. https://doi.org/10.1161/CIRCRESAHA.118.313705. [PubMed].
8. Suh KS, Mutoh M, Mutoh T, Li L, Ryscavage A, Crutchley JM, Dumont RA, Cheng C, Yuspa SH. CLIC4 mediates and is required for Ca2+-induced keratinocyte differentiation. J Cell Sci. 2007; 120:2631–2640. https://doi.org/10.1242/jcs.002741. [PubMed].
9. Rønnov-Jessen L, Villadsen R, Edwards JC, Petersen OW. Differential expression of a chloride intracellular channel gene, CLIC4, in transforming growth factor-β1-mediated conversion of fibroblasts to myofibroblasts. Am J Pathol. 2002; 161:471–480. https://doi.org/10.1016/S0002-9440(10)64203-4. [PubMed].
10. Yao Q, Qu X, Yang Q, Wei M, Kong B. CLIC4 mediates TGF-β1-induced fibroblast-to-myofibroblast transdifferentiation in ovarian cancer. Oncol Rep. 2009; 22:541–548. https://doi.org/10.3892/or_00000469. [PubMed].
11. Shukla A, Edwards R, Yang Y, Hahn A, Folkers K, Ding J, Padmakumar VC, Cataisson C, Suh KS, Yuspa SH. CLIC4 regulates TGF-β-dependent myofibroblast differentiation to produce a cancer stroma. Oncogene. 2014; 33:842–850. https://doi.org/10.1038/onc.2013.18. [PubMed].
12. Chen L, Wu W, Dentchev T, Zeng Y, Wang J, Tsui I, Tobias JW, Bennett J, Baldwin D, Dunaief JL. Light damage induced changes in mouse retinal gene expression. Exp Eye Res. 2004; 79:239–247. https://doi.org/10.1016/j.exer.2004.05.002. [PubMed].
13. Palmfeldt J, Vang S, Stenbroen V, Pavlou E, Baycheva M, Buchal G, Monavari AA, Augoustides-Savvopoulou P, Mandel H, Gregersen N. Proteomics reveals that redox regulation is disrupted in patients with ethylmalonic encephalopathy. J Proteome Res. 2011; 10:2389–2396. https://doi.org/10.1021/pr101218d. [PubMed].
14. Xu Y, Kang J, Yuan Z, Li H, Su J, Li Y, Kong X, Zhang H, Wang W, Sun L. Suppression of CLIC4/mtCLIC enhances hydrogen peroxide-induced apoptosis in C6 glioma cells. Oncol Rep. 2013; 29:1483–1491. https://doi.org/10.3892/or.2013.2265. [PubMed].
15. Guo D, Xie W, Xiong P, Li H, Wang S, Chen G, Gao Y, Zhou J, Zhang Y, Bu G, Xue M, Zhang J. Cyclin-dependent kinase 5-mediated phosphorylation of chloride intracellular channel 4 promotes oxidative stress-induced neuronal death. Cell Death Dis. 2018; 9:951. https://doi.org/10.1038/s41419-018-0983-1. [PubMed].
16. Chuang JZ, Chou SY, Sung CH. Chloride intracellular channel 4 is critical for the epithelial morphogenesis of RPE cells and retinal attachment. Mol Biol Cell. 2010; 21:3017–28. https://doi.org/10.1091/mbc.E09-10-0907. [PubMed].
17. Argenzio E, Margadant C, Leyton-Puig D, Janssen H, Jalink K, Sonnenberg A, Moolenaar WH. CLIC4 regulates cell adhesion and β1 integrin trafficking. J Cell Sci. 2014; 127:5189–5203. https://doi.org/10.1242/jcs.150623. [PubMed].
18. Argenzio E, Klarenbeek J, Kedziora KM, Nahidiazar L, Isogai T, Perrakis A, Jalink K, Moolenaar WH, Innocenti M. Profilin 1 binding couples chloride intracellular channel protein CLIC4 to RhoA–mDia2 signaling and filopodium formation. J Biol Chem. 2018; 293:19161–19176. https://doi.org/10.1074/jbc.ra118.002779. [PubMed].
19. He G, Ma Y, Chou SY, Li H, Yang C, Chuang JZ, Sung CH, Ding A. Role of CLIC4 in the host innate responses to bacterial lipopolysaccharide. Eur J Immunol. 2011; 41:1221–1230. https://doi.org/10.1002/eji.201041266. [PubMed].
20. Malik M, Jividen K, Padmakumar VC, Cataisson C, Li L, Lee J, Howard OMZ, Yuspa SH. Inducible NOS-induced chloride intracellular channel 4 (CLIC4) nuclear translocation regulates macrophage deactivation. Proc Natl Acad Sci U S A. 2012; 109:6130–6135. https://doi.org/10.1073/pnas.1201351109. [PubMed].
21. Raedler D, Ballenberger N, Klucker E, Böck A, Otto R. Costa OPd, Holst O, Illig T, Buch T, Mutius Ev, Schaub B. Identification of novel immune phenotypes for allergic and nonallergic childhood asthma. J Allergy Clin Immunol. 2015; 135:81–91. https://doi.org/10.1016/j.jaci.2014.07.046. [PubMed].
22. Domingo-Fernandez R, Coll RC, Kearney J, Breit S, O’Neill LAJ. The intracellular chloride channel proteins CLIC1 and CLIC4 induce IL-1β transcription and activate the NLRP3 inflammasome. J Biol Chem. 2017; 292:12077–12087. https://doi.org/10.1074/jbc.M117.797126. [PubMed].
23. Suh KS, Crutchley JM, Koochek A, Ryscavage A, Bhat K, Tanaka T, Oshima A, Fitzgerald P, Yuspa SH. Reciprocal modifications of CLIC4 in tumor epithelium and stroma mark malignant progression of multiple human cancers. Clin Cancer Res. 2007; 13:121–131. https://doi.org/10.1158/1078-0432.CCR-06-1562. [PubMed].
24. Suh KS, Malik M, Shukla A, Ryscavage A, Wright L, Jividen K, Crutchley JM, Dumont RA, Fernandez-Salas E, Webster JD, Simpson RM, Yuspa SH. CLIC4 is a tumor suppressor for cutaneous squamous cell cancer. Carcinogenesis. 2012; 33:986–995. https://doi.org/10.1093/carcin/bgs115. [PubMed].
25. Tang HY, Beer LA, Tanyi JL, Zhang R, Liu Q, Speicher DW. Protein isoform-specific validation defines multiple chloride intracellular channel and tropomyosin isoforms as serological biomarkers of ovarian cancer. J Proteomics. 2013; 89:165–178. https://doi.org/10.1016/j.jprot.2013.06.016. [PubMed].
26. Deng YJ, Tang N, Liu C, Zhang JY, An SL, Peng YL, Ma LL, Li GQ, Jiang Q, Hu CT, Wang YN, Liang YZ, Bian XW, et al. CLIC4, ERp29, and Smac/DIABLO derived from metastatic cancer stem-like cells stratify prognostic risks of colorectal cancer. Clin Cancer Res. 2014; 20:3809–3817. https://doi.org/10.1158/1078-0432.CCR-13-1887. [PubMed].
27. Okudela K, Katayama A, Woo T, Mitsui H, Suzuki T, Tateishi Y, Umeda S, Tajiri M, Masuda M, Nagahara N, Kitamura H, Ohashi K. Proteome analysis for downstream targets of oncogenic KRAS–the potential participation of CLIC4 in carcinogenesis in the lung. PLoS One. 2014; 9:e87193. https://doi.org/10.1371/journal.pone.0087193. [PubMed].
28. Tasiopoulou V, Magouliotis D, Solenov EI, Vavougios G, Molyvdas PA, Gourgoulianis KI, Hatzoglou C, Zarogiannis SG. Transcriptional over-expression of chloride intracellular channels 3 and 4 in malignant pleural mesothelioma. Comput Biol Chem. 2015; 59:111–6. https://doi.org/10.1016/j.compbiolchem.2015.09.012. [PubMed].
29. Zou Q, Yang Z, Li D, Liu Z, Yuan Y. Association of chloride intracellular channel 4 and Indian hedgehog proteins with survival of patients with pancreatic ductal adenocarcinoma. Int J Exp Pathol. 2016; 97:422–429. https://doi.org/10.1111/iep.12213. [PubMed].
30. Kenny TC, Schmidt H, Adelson K, Hoshida Y, Koh AP, Shah N, Mandeli J, Ting J, Germain D. Patient-derived interstitial fluids and predisposition to aggressive sporadic breast cancer through collagen remodeling and inactivation of p53. Clin Cancer Res. 2017; 23:5446–5459. https://doi.org/10.1158/1078-0432.CCR-17-0342. [PubMed].
31. Singha B, Harper SL, Goldman AR, Bitler BG, Aird KM, Borowsky ME, Cadungog MG, Liu Q, Zhang R, Jean S, Drapkin R, Speicher DW. CLIC1 and CLIC4 complement CA125 as a diagnostic biomarker panel for all subtypes of epithelial ovarian cancer. Sci Rep. 2018; 8:14725. https://doi.org/10.1038/s41598-018-32885-2. [PubMed].
32. Boyer LA, Lee TI, Cole MF, Johnstone SE, Levine SS, Zucker JP, Guenther MG, Kumar RM, Murray HL, Jenner RG, Gifford DK, Melton DA, Jaenisch R, et al. Core transcriptional regulatory circuitry in human embryonic stem cells. Cell. 2005; 122:947–956. https://doi.org/10.1016/j.cell.2005.08.020. [PubMed].
33. Fernandez-Salas E, Sagar M, Cheng C, Yuspa SH, Weinberg WC. p53 and tumor necrosis factor alpha regulate the expression of a mitochondrial chloride channel protein. J Biol Chem. 1999; 274:36488–36497. https://doi.org/10.1074/jbc.274.51.36488. [PubMed].
34. Fernandez-Salas E, Suh KS, Speransky VV, Bowers WL, Levy JM, Adams T, Pathak KR, Edwards LE, Hayes DD, Cheng C, Steven AC, Weinberg WC, Yuspa SH. mtCLIC/CLIC4, an organellular chloride channel protein, is increased by DNA damage and participates in the apoptotic response to p53. Mol Cell Biol. 2002; 22:3610–3620. https://doi.org/10.1128/MCB.22.11.3610-3620.2002. [PubMed].
35. Shiio Y, Suh KS, Lee H, Yuspa SH, Eisenman RN, Aebersold R. Quantitative proteomic analysis of myc-induced apoptosis: a direct role for Myc induction of the mitochondrial chloride ion channel, mtCLIC/CLIC4. J Biol Chem. 2006; 281:2750–2756. https://doi.org/10.1074/jbc.M509349200. [PubMed].
36. Shukla A, Malik M, Cataisson C, Ho Y, Friesen T, Suh KS, Yuspa SH. TGF-β signalling is regulated by Schnurri-2-dependent nuclear translocation of CLIC4 and consequent stabilization of phospho-Smad2 and 3. Nat Cell Biol. 2009; 11:777–784. https://doi.org/10.1038/ncb1885. [PubMed].
37. Huang MC, Chu IT, Wang ZF, Lin S, Chang TC, Chen CT. A G-quadruplex structure in the promoter region of CLIC4 functions as a regulatory element for gene expression. Int J Mol Sci. 2018; 19. https://doi.org/10.3390/ijms19092678. [PubMed].
38. Arnould T, Mercy L, Houbion A, Vankoningsloo S, Renard P, Pascal T, Ninane N, Demazy C, Raes M. mtCLIC is up-regulated and maintains a mitochondrial membrane potential in mtDNA-depleted L929 cells. FASEB J. 2003; 17:2145–2147. https://doi.org/10.1096/fj.03-0075fje. [PubMed].
39. Cerami E, Gao J, Dogrusoz U, Gross BE, Sumer SO, Aksoy BA, Jacobsen A, Byrne CJ, Heuer ML, Larsson E, Antipin Y, Reva B, Goldberg AP, et al. The cBio cancer genomics portal: an open platform for exploring multidimensional cancer genomics data. Cancer Discov. 2012; 2:401–404. https://doi.org/10.1158/2159-8290.CD-12-0095. [PubMed].
40. Gao J, Aksoy BA, Dogrusoz U, Dresdner G, Gross B, Sumer SO, Sun Y, Jacobsen A, Sinha R, Larsson E, Cerami E, Sander C, Schultz N. Integrative analysis of complex cancer genomics and clinical profiles using the cBioPortal. Sci Signal. 2013; 6:pl1. https://doi.org/10.1126/scisignal.2004088. [PubMed].
41. Rau A, Flister M, Rui H, Auer PL. Exploring drivers of gene expression in The Cancer Genome Atlas. Bioinformatics. 2018; 35:62–68. https://doi.org/10.1093/bioinformatics/bty551. [PubMed].
42. Kent WJ, Sugnet CW, Furey TS, Roskin KM, Pringle TH, Zahler AM, Haussler D. The human genome browser at UCSC. Genome Res. 2002; 12:996–1006. https://doi.org/10.1101/gr.229102. [PubMed].
43. Peng Y, Croce CM. The role of MicroRNAs in human cancer. Signal Transduct Target Ther. 2016; 1:15004. https://doi.org/10.1038/sigtrans.2015.4. [PubMed].
44. Suh KS, Mutoh M, Nagashima K, Fernandez-Salas E, Edwards LE, Hayes DD, Crutchley JM, Marin KG, Dumont RA, Levy JM, Cheng C, Garfield S, Yuspa SH. The organellular chloride channel protein CLIC4/mtCLIC translocates to the nucleus in response to cellular stress and accelerates apoptosis. J Biol Chem. 2004; 279:4632–4641. https://doi.org/10.1074/jbc.M311632200. [PubMed].
45. Agarwal V, Bell GW, Nam JW, Bartel DP. Predicting effective microRNA target sites in mammalian mRNAs. eLife. 2015; 4. https://doi.org/10.7554/eLife.05005. [PubMed].
46. Paraskevopoulou MD, Georgakilas G, Kostoulas N, Vlachos IS, Vergoulis T, Reczko M, Filippidis C, Dalamagas T, Hatzigeorgiou AG. DIANA-microT web server v5.0: service integration into miRNA functional analysis workflows. Nucleic Acids Res. 2013; 41:W169–73. https://doi.org/10.1093/nar/gkt393. [PubMed].
47. Vejnar CE, Zdobnov EM. MiRmap: comprehensive prediction of microRNA target repression strength. Nucleic Acids Res. 2012; 40:11673–11683. https://doi.org/10.1093/nar/gks901. [PubMed].
48. Fan X, Kurgan L. Comprehensive overview and assessment of computational prediction of microRNA targets in animals. Brief Bioinform. 2015; 16:780–794. https://doi.org/10.1093/bib/bbu044. [PubMed].
49. Chang J, Nicolas E, Marks D, Sander C, Lerro A, Buendia M, Xu C, Mason WS, Moloshok T, Bort R, Zaret KS, Taylor JM. miR-122, a mammalian liver-specific microRNA, is processed from hcr mRNA and may downregulate the high affinity cationic amino acid transporter CAT-1. RNA Biol. 2004; 1:106–13. https://doi.org/10.4161/rna.1.2.1066. [PubMed].
50. Shrestha A, Mukhametshina RT, Taghizadeh S, Vasquez-Pacheco E, Cabrera-Fuentes H, Rizvanov A, Mari B, Carraro G, Bellusci S. MicroRNA-142 is a multifaceted regulator in organogenesis, homeostasis, and disease. Dev Dyn. 2017; 246:285–290. https://doi.org/10.1002/dvdy.24477. [PubMed].
51. Courthod G, Franco P, Palermo L, Pisconti S, Numico G. The Role of microRNA in Head and Neck Cancer: Current Knowledge and Perspectives. Molecules. 2014; 19:5704–16. https://doi.org/10.3390/molecules19055704. [PubMed].
52. Chou C, Shrestha S, Yang C, Chang N, Lin Y, Liao K, Huang W, Sun T, Tu S, Lee W, Chiew M, Tai C, Wei T, et al. miRTarBase update 2018: a resource for experimentally validated microRNA-target interactions. Nucleic Acids Res. 2017; 46:D296–D302. https://doi.org/10.1093/nar/gkx1067. [PubMed].
53. Lei Z, Xu G, Wang L, Yang H, Liu X, Zhao J, Zhang HT. MiR-142-3p represses TGF-β-induced growth inhibition through repression of TGFβR1 in non-small cell lung cancer. FASEB J. 2014; 28:2696–2704. https://doi.org/10.1096/fj.13-247288. [PubMed].
54. Datto MB, Li Y, Panus JF, Howe DJ, Xiong Y, Wang XF. Transforming growth factor beta induces the cyclin-dependent kinase inhibitor p21 through a p53-independent mechanism. Proc Natl Acad Sci U S A. 1995; 92:5545–9. https://doi.org/10.1073/pnas.92.12.5545. [PubMed].
55. Yoshihara K, Shahmoradgoli M, Martínez E, Vegesna R, Kim H, Torres-Garcia W, Treviño V, Shen H, Laird PW, Levine DA, Carter SL, Getz G, Stemke-Hale K, et al. Inferring tumour purity and stromal and immune cell admixture from expression data. Nat Commun. 2013; 4:2612. https://doi.org/10.1038/ncomms3612. [PubMed].
56. Yu X, Chen YA, Conejo-Garcia JR, Chung CH, Wang X. Estimation of immune cell content in tumor using single-cell RNA-seq reference data. BMC Cancer. 2019; 19:715. https://doi.org/10.1186/s12885-019-5927-3. [PubMed].
57. Puram SV, Tirosh I, Parikh AS, Patel AP, Yizhak K, Gillespie S, Rodman C, Luo CL, Mroz EA, Emerick KS, Deschler DG, Varvares MA, Mylvaganam R, et al. Single-cell transcriptomic analysis of primary and metastatic tumor ecosystems in head and neck cancer. Cell. 2017; 171:1611–24.e24. https://doi.org/10.1016/j.cell.2017.10.044. [PubMed].
58. Xiao Z, Cheng G, Jiao Y, Pan C, Li R, Jia D, Zhu J, Wu C, Zheng M, Jia J. Holo-Seq: single-cell sequencing of holo-transcriptome. Genome Biol. 2018; 19:163. https://doi.org/10.1186/s13059-018-1553-7. [PubMed].
59. Zhang J, Shan WF, Jin TT, Wu GQ, Xiong XX, Jin HY, Zhu SM. Propofol exerts anti-hepatocellular carcinoma by microvesicle-mediated transfer of miR-142-3p from macrophage to cancer cells. J Transl Med. 2014; 12:279. https://doi.org/10.1186/s12967-014-0279-x. [PubMed].
60. Lambert M, Jambon S, Depauw S, David-Cordonnier MH. Targeting transcription factors for cancer treatment. Molecules. 2018; 23. https://doi.org/10.3390/molecules23061479. [PubMed].
61. Jansson MD, Lund AH. MicroRNA and cancer. Mol Oncol. 2012; 6:590–610. https://doi.org/10.1016/j.molonc.2012.09.006. [PubMed].
62. Jin HY, Gonzalez-Martin A, Miletic AV, Lai M, Knight S, Sabouri-Ghomi M, Head SR, Macauley MS, Rickert RC, Xiao C. Transfection of microRNA mimics should be used with caution. Front Genet. 2015; 6:340. https://doi.org/10.3389/fgene.2015.00340. [PubMed].
63. Goldgraben MA, Russell R, Rueda OM, Caldas C, Git A. Double-stranded microRNA mimics can induce length- and passenger strand-dependent effects in a cell type-specific manner. RNA. 2016; 22:193–203. https://doi.org/10.1261/rna.054072.115. [PubMed].
64. Brenner JC, Graham MP, Kumar B, Saunders LM, Kupfer R, Lyons RH, Bradford CR, Carey TE. Genotyping of 73 UM-SCC head and neck squamous cell carcinoma cell lines. Head Neck. 2010; 32:417–426. https://doi.org/10.1002/hed.21198. [PubMed].
65. Barretina J, Caponigro G, Stransky N, Venkatesan K, Margolin AA, Kim S, Wilson CJ, Lehár J, Kryukov GV, Sonkin D, Reddy A, Liu M, Murray L, et al. The Cancer Cell Line Encyclopedia enables predictive modelling of anticancer drug sensitivity. Nature. 2012; 483:603–607. https://doi.org/10.1038/nature11003. [PubMed].
66. Skarn M, Baroy T, Stratford EW, Myklebost O. Epigenetic regulation and functional characterization of microRNA-142 in mesenchymal cells. PLoS One. 2013; 8:e79231. https://doi.org/10.1371/journal.pone.0079231. [PubMed].
67. Razak SRA, Baba Y, Nakauchi H, Otsu M, Watanabe S. DNA methylation is involved in the expression of miR-142-3p in fibroblasts and induced pluripotent stem cells. Stem Cells Int. 2014; 2014:101349. https://doi.org/10.1155/2014/101349. [PubMed].
68. Dickman CT, Lawson J, Jabalee J, MacLellan SA, LePard NE, Bennewith KL, Garnis C. Selective extracellular vesicle exclusion of miR-142-3p by oral cancer cells promotes both internal and extracellular malignant phenotypes. Oncotarget. 2017; 8:15252–15266. https://doi.org/10.18632/oncotarget.14862. [PubMed].
69. Aucher A, Rudnicka D, Davis DM. MicroRNAs transfer from human macrophages to hepato-carcinoma cells and inhibit proliferation. J Immunol. 2013; 191:6250–6260. https://doi.org/10.4049/jimmunol.1301728. [PubMed].
70. Squadrito M, Baer C, Burdet F, Maderna C, Gilfillan GD, Lyle R, Ibberson M, De Palma M. Endogenous RNAs modulate microRNA sorting to exosomes and transfer to acceptor cells. Cell Rep. 2014; 8:1432–46. https://doi.org/10.1016/j.celrep.2014.07.035. [PubMed].
71. Sukma Dewi I, Celik S, Karlsson A, Hollander Z, Lam K, McManus JW, Tebbutt S, Ng R, Keown P, McMaster R, McManus B, Ohman J, Gidlof O. Exosomal miR-142-3p is increased during cardiac allograft rejection and augments vascular permeability through down-regulation of endothelial RAB11FIP2 expression. Cardiovasc Res. 2017; 113:440–452. https://doi.org/10.1093/cvr/cvw244. [PubMed].
72. Tung SL, Boardman DA, Sen M, Letizia M, Peng Q, Cianci N, Dioni L, Carlin LM, Lechler R, Bollati V, Lombardi G, Smyth LA. Regulatory T cell-derived extracellular vesicles modify dendritic cell function. Sci Rep. 2018; 8:6065. https://doi.org/10.1038/s41598-018-24531-8. [PubMed].
73. Guay C, Kruit JK, Rome S, Menoud V, Mulder NL, Jurdzinski A, Mancarella F, Sebastiani G, Donda A, Gonzalez BJ, Jandus C, Bouzakri K, Pinget M, et al. Lymphocyte-derived exosomal microRNAs promote pancreatic β cell death and may contribute to type 1 diabetes development. Cell Metab. 2019; 29:348–61.e6. https://doi.org/10.1016/j.cmet.2018.09.011. [PubMed].
74. Li H, Li F. Exosomes from BM-MSCs increase the population of CSCs via transfer of miR-142-3p. Br J Cancer. 2018; 119:744–755. https://doi.org/10.1038/s41416-018-0254-z. [PubMed].
75. Gu H, Li H, Zhang L, Luan H, Huang T, Wang L, Fan Y, Zhang Y, Liu X, Wang W, Yuan Z. Diagnostic role of microRNA expression profile in the serum of pregnant women with fetuses with neural tube defects. J Neurochem. 2012; 122:641–649. https://doi.org/10.1111/j.1471-4159.2012.07812.x. [PubMed].
76. Makino K, Jinnin M, Kajihara I, Honda N, Sakai K, Masuguchi S, Fukushima S, Inoue Y, Ihn H. Circulating miR-142-3p levels in patients with systemic sclerosis. Clin Exp Dermatol. 2012; 37:34–39. https://doi.org/10.1111/j.1365-2230.2011.04158.x. [PubMed].
77. Ellis KL, Cameron VA, Troughton RW, Frampton CM, Ellmers LJ, Richards AM. Circulating microRNAs as candidate markers to distinguish heart failure in breathless patients. Eur J Heart Fail. 2013; 15:1138–1147. https://doi.org/10.1093/eurjhf/hft078. [PubMed].
78. Kaduthanam S, Gade S, Meister M, Brase JC, Johannes M, Dienemann H, Warth A, Schnabel PA, Herth FJF, Sültmann H, Muley T, Kuner R. Serum miR-142-3p is associated with early relapse in operable lung adenocarcinoma patients. Lung Cancer. 2013; 80:223–227. https://doi.org/10.1016/j.lungcan.2013.01.013. [PubMed].
79. Kumar P, Dezso Z, MacKenzie C, Oestreicher J, Agoulnik S, Byrne M, Bernier F, Yanagimachi M, Aoshima K, Oda Y. Circulating miRNA biomarkers for Alzheimer’s disease. PLoS One. 2013; 8:e69807. https://doi.org/10.1371/journal.pone.0069807. [PubMed].
80. Ortega FJ, Mercader JM, Catalan V, Moreno-Navarrete JM, Pueyo N, Sabater M, Gomez-Ambrosi J, Anglada R, Fernandez-Formoso JA, Ricart W, Fruhbeck G, Fernandez-Real JM. Targeting the circulating microRNA signature of obesity. Clin Chem. 2013; 59:781–792. https://doi.org/10.1373/clinchem.2012.195776. [PubMed].
81. Prats-Puig A, Ortega FJ, Mercader JM, Moreno-Navarrete JM, Moreno M, Bonet N, Ricart W, Lopez-Bermejo A, Fernandez-Real JM. Changes in circulating microRNAs are associated with childhood obesity. J Clin Endocrinol Metab. 2013; 98:E1655–E1660. https://doi.org/10.1210/jc.2013-1496. [PubMed].
82. Summerer I, Unger K, Braselmann H, Schuettrumpf L, Maihoefer C, Baumeister P, Kirchner T, Niyazi M, Sage E, Specht HM, Multhoff G, Moertl S, Belka C, et al. Circulating microRNAs as prognostic therapy biomarkers in head and neck cancer patients. Br J Cancer. 2015; 113:76–82. https://doi.org/10.1038/bjc.2015.111. [PubMed].
83. Yang S, Li H, Ge Q, Guo L, Chen F. Deregulated microRNA species in the plasma and placenta of patients with preeclampsia. Mol Med Rep. 2015; 12:527–534. https://doi.org/10.3892/mmr.2015.3414. [PubMed].
84. Borges E Jr, Setti AS, Braga DP, Geraldo MV, Figueira RC, Iaconelli A Jr. miR-142-3p as a biomarker of blastocyst implantation failure - A pilot study. JBRA Assist Reprod. 2016; 20:200–205. https://doi.org/10.5935/1518-0557.20160039. [PubMed].
85. Feng Y, Zou L, Yan D, Chen H, Xu G, Jian W, Cui P, Chao W. Extracellular MicroRNAs Induce Potent Innate Immune Responses via TLR7/MyD88-Dependent Mechanisms. J Immunol. 2017; 199:2106–2117. https://doi.org/10.4049/jimmunol.1700730. [PubMed].
86. Sukma Dewi I, Hollander Z, Lam KK, McManus JW, Tebbutt SJ, Ng RT, Keown PA, McMaster RW, McManus BM, Gidlof O, Ohman J. Association of serum miR-142-3p and miR-101-3p levels with acute cellular rejection after heart transplantation. PLoS One. 2017; 12:e0170842. https://doi.org/10.1371/journal.pone.0170842. [PubMed].
87. Zununi Vahed S, Poursadegh Zonouzi A, Ghanbarian H, Ghojazadeh M, Samadi N, Omidi Y, Ardalan M. Differential expression of circulating miR-21, miR-142-3p and miR-155 in renal transplant recipients with impaired graft function. Int Urol Nephrol. 2017; 49:1681–1689. https://doi.org/10.1007/s11255-017-1602-2. [PubMed].
88. Al-Rawaf HA. Circulating microRNAs and adipokines as markers of metabolic syndrome in adolescents with obesity. Clin Nutr. 2019; 38:2231–2238. https://doi.org/10.1016/j.clnu.2018.09.024. [PubMed].
89. Chen X, Huang F, Qi Y, Zhou M, Yin Q, Peng Y, Zhou Y, Ning G, Wang S. Serum and thyroid tissue level of let-7b and their correlation with TRAb in Graves’ disease. J Transl Med. 2018; 16:188. https://doi.org/10.1186/s12967-018-1565-9. [PubMed].
90. Gholaminejad A, Abdul Tehrani H, Gholami Fesharaki M. Identification of candidate microRNA biomarkers in renal fibrosis: a meta-analysis of profiling studies. Biomarkers. 2018; 23:713–724. https://doi.org/10.1080/1354750X.2018.1488275. [PubMed].
91. Matamala JM, Arias-Carrasco R, Sanchez C, Uhrig M, Bargsted L, Matus S, Maracaja-Coutinho V, Abarzua S, van Zundert B, Verdugo R, Manque P, Hetz C. Genome-wide circulating microRNA expression profiling reveals potential biomarkers for amyotrophic lateral sclerosis. Neurobiol Aging. 2018; 64:123–138. https://doi.org/10.1016/j.neurobiolaging.2017.12.020. [PubMed].
92. Toro R, Blasco-Turrion S, Morales-Ponce FJ, Gonzalez P, Martinez-Camblor P, Lopez-Granados A, Brugada R, Campuzano O, Perez-Serra A, Rosa Longobardo F, Mangas A, Llorente-Cortes V, de Gonzalo-Calvo D. Plasma microRNAs as biomarkers for Lamin A/C-related dilated cardiomyopathy. J Mol Med (Berl). 2018; 96:845–856. https://doi.org/10.1007/s00109-018-1666-1. [PubMed].
93. Zhong Z, Hou J, Zhang Q, Zhong W, Li B, Li C, Liu Z, Yang M, Zhao P. Circulating microRNA expression profiling and bioinformatics analysis of dysregulated microRNAs of patients with coronary artery disease. Medicine (Baltimore). 2018; 97:e11428. https://doi.org/10.1097/MD.0000000000011428. [PubMed].
94. Barcelo M, Castells M, Bassas L, Vigues F, Larriba S. Semen miRNAs contained in exosomes as non-invasive biomarkers for prostate cancer diagnosis. Sci Rep. 2019; 9:13772. https://doi.org/10.1038/s41598-019-50172-6. [PubMed].
95. Dombkowski AA, Cukovic D, Bagla S, Jones M, Caruso JA, Chugani HT, Chugani DC. TLR7 activation in epilepsy of tuberous sclerosis complex. Inflamm Res. 2019; 68:993–998. https://doi.org/10.1007/s00011-019-01283-3. [PubMed].
96. Njock MS, Guiot J, Henket MA, Nivelles O, Thiry M, Dequiedt F, Corhay JL, Louis RE, Struman I. Sputum exosomes: promising biomarkers for idiopathic pulmonary fibrosis. Thorax. 2019; 74:309–312. https://doi.org/10.1136/thoraxjnl-2018-211897. [PubMed].
97. Specjalski K, Jassem E. MicroRNAs: potential biomarkers and targets of therapy in allergic diseases? Arch Immunol Ther Exp (Warsz). 2019; 67:213–223. https://doi.org/10.1007/s00005-019-00547-4. [PubMed].
98. Mascaux C, Laes JF, Anthoine G, Haller A, Ninane V, Burny A, Sculier JP. Evolution of microRNA expression during human bronchial squamous carcinogenesis. Eur Respir J. 2009; 33:352–359. https://doi.org/10.1183/09031936.00084108. [PubMed].
99. Hui ABY, Lenarduzzi M, Krushel T, Waldron L, Pintilie M, Shi W, Perez-Ordonez B, Jurisica I, O’Sullivan B, Waldron J, Gullane P, Cummings B, Liu FF. Comprehensive microRNA profiling for head and neck squamous cell carcinomas. Clin Cancer Res. 2010; 16:1129–1139. https://doi.org/10.1158/1078-0432.CCR-09-2166. [PubMed].
100. Lin RJ, Xiao DW, Liao LD, Chen T, Xie ZF, Huang WZ, Wang WS, Jiang TF, Wu BL, Li EM, Xu LY. MiR-142-3p as a potential prognostic biomarker for esophageal squamous cell carcinoma. J Surg Oncol. 2012; 105:175–182. https://doi.org/10.1002/jso.22066. [PubMed].
101. Summerer I, Niyazi M, Unger K, Pitea A, Zangen V, Hess J, Atkinson MJ, Belka C, Moertl S, Zitzelsberger H. Changes in circulating microRNAs after radiochemotherapy in head and neck cancer patients. Radiat Oncol. 2013; 8:296. https://doi.org/10.1186/1748-717X-8-296. [PubMed].
102. Manikandan M, Deva Magendhra Rao AK, Arunkumar G, Manickavasagam M, Rajkumar KS, Rajaraman R, Munirajan AK. Oral squamous cell carcinoma: microRNA expression profiling and integrative analyses for elucidation of tumourigenesis mechanism. Mol Cancer. 2016; 15:28. https://doi.org/10.1186/s12943-016-0512-8. [PubMed].
103. Mandal R, Şenbabaoğlu Y, Desrichard A, Havel JJ, Dalin MG, Riaz N, Lee KW, Ganly I, Hakimi AA, Chan TA, Morris LG. The head and neck cancer immune landscape and its immunotherapeutic implications. JCI Insight. 2016; 1:e89829. https://doi.org/10.1172/jci.insight.89829. [PubMed].
104. Joyce CE, Zhou X, Xia J, Ryan C, Thrash B, Menter A, Zhang W, Bowcock AM. Deep sequencing of small RNAs from human skin reveals major alterations in the psoriasis miRNAome. Hum Mol Genet. 2011; 20:4025–4040. https://doi.org/10.1093/hmg/ddr331. [PubMed].
105. Asaoka T, Sotolongo B, Island ER, Tryphonopoulos P, Selvaggi G, Moon J, Tekin A, Amador A, Levi DM, Garcia J, Smith L, Nishida S, Weppler D, et al. MicroRNA signature of intestinal acute cellular rejection in formalin-fixed paraffin-embedded mucosal biopsies. Am J Transplant. 2012; 12:458–468. https://doi.org/10.1111/j.1600-6143.2011.03807.x. [PubMed].
106. De Costa AMA, Schuyler CA, Walker DD, Young MRI. Characterization of the evolution of immune phenotype during the development and progression of squamous cell carcinoma of the head and neck. Cancer Immunol Immunother. 2012; 61:927–939. https://doi.org/10.1007/s00262-011-1154-8. [PubMed].
107. Canning M, Guo G, Yu M, Myint C, Groves MW, Byrd JK, Cui Y. Heterogeneity of the Head and Neck Squamous Cell Carcinoma Immune Landscape and Its Impact on Immunotherapy. Front Cell Dev Biol. 2019; 7:52. https://doi.org/10.3389/fcell.2019.00052. [PubMed].
108. Padmakumar V, Masiuk KE, Luger D, Lee C, Coppola V, Tessarollo L, Hoover SB, Karavanova I, Buonanno A, Simpson RM, Yuspa SH. Detection of differential fetal and adult expression of chloride intracellular channel 4 (CLIC4) protein by analysis of a green fluorescent protein knock-in mouse line. BMC Dev Biol. 2014; 14:24. https://doi.org/10.1186/1471-213X-14-24. [PubMed].
109. Xue H, Lu J, Yuan R, Liu J, Liu Y, Wu K, Wu J, Du J, Shen B. Knockdown of CLIC4 enhances ATP-induced HN4 cell apoptosis through mitochondrial and endoplasmic reticulum pathways. Cell Biosci. 2016; 6:5. https://doi.org/10.1186/s13578-016-0070-1. [PubMed].
110. Hoshino A, Costa-Silva B, Shen TL, Rodrigues G, Hashimoto A, Tesic Mark M, Molina H, Kohsaka S, Di Giannatale A, Ceder S, Singh S, Williams C, Soplop N, et al. Tumour exosome integrins determine organotropic metastasis. Nature. 2015; 527:329–335. https://doi.org/10.1038/nature15756. [PubMed].
111. Mukherji S, Ebert MS, Zheng GX, Tsang JS, Sharp PA, van Oudenaarden A. MicroRNAs can generate thresholds in target gene expression. Nat Genet. 2011; 43:854–859. https://doi.org/10.1038/ng.905. [PubMed].
112. Salazar-Ruales C, Arguello JV, Lopez-Cortes A, Cabrera-Andrade A, Garcia-Cardenas JM, Guevara-Ramirez P, Peralta P, Leone PE, Paz YMC. Salivary MicroRNAs for Early Detection of Head and Neck Squamous Cell Carcinoma: A Case-Control Study in the High Altitude Mestizo Ecuadorian Population. Biomed Res Int. 2018; 2018:9792730. https://doi.org/10.1155/2018/9792730. [PubMed].
113. Yuan Y, Jiang YC, Sun CK, Chen QM. Role of the tumor microenvironment in tumor progression and the clinical applications. Oncol Rep. 2016; 35:2499–2515. https://doi.org/10.3892/or.2016.4660. [PubMed].
114. R Core Team. R: A language and environment for statistical computing. Vienna, Austria: R Foundation for Statistical Computing; 2018.
115. Kosinski M, Biecek P, Chodor W. RTCGA: The Cancer Genome Atlas data integration. 2019.
116. Stuart T, Butler A, Hoffman P, Hafemeister C, Papalexi E, Mauck WM 3rd, Hao Y, Stoeckius M, Smibert P, Satija R. Comprehensive integration of single-cell data. Cell. 2019; 177:1888–902.e21. https://doi.org/10.1016/j.cell.2019.05.031. [PubMed].
117. Renwick N, Cekan P, Bognanni C, Tuschl T. Multiplexed miRNA fluorescence in situ hybridization for formalin-fixed paraffin-embedded tissues. Methods Mol Biol. 2014; 1211:171–187. https://doi.org/10.1007/978-1-4939-1459-3_14. [PubMed].
118. Kramer MF. Stem-Loop RT-qPCR for miRNAs. Curr Protoc Mol Biol. 2011; Chapter 15:Unit 15.10. https://doi.org/10.1002/0471142727.mb1510s95. [PubMed].