
Introduction
Phosphorylation by protein kinases is a major post-translational modification in cell signaling. Higher eukaryotes encode for 518 putative protein kinases and many of them are expressed in cells at the same time [1]. While there are hundreds of kinases, only three amino acids, serine, threonine, and tyrosine, undergo modification by kinases in eukaryotes [2]. Analysis of the sequence and structure of phosphorylation sites has revealed only limited specificity in vivo and in vitro [3]. Given the large number of kinases and their limited specificity, protein phosphorylation apparently undergoes several layers of regulation. Recruitment of kinases and control of their activity substantially contribute to the regulation of protein phosphorylation in vivo [4].
The question of the number of kinases that can participate in phosphorylation of a target site in vivo is difficult to answer. Kinases can be removed by genetic knockout or by RNA interference-mediated downregulation. Alternatively, the activity of kinases can be inhibited by chemical inhibitors of varying specificity [5]. Notably, such inhibitors are of high therapeutical interest, as many kinases are involved in human cancer [6]. However, all these approaches usually do not represent a direct proof for the phosphorylation of a substrate by a specific kinase in vivo.
Cyclin-dependent kinase 9 (CDK9) is a central regulator of eukaryotic transcription and a promising therapeutical target in cancer and other diseases [7]. In mammals, CDK9 is the kinase subunit of Positive Transcription Elongation Factor b (P-TEFb). Its role in releasing promoter-proximal paused RNA Polymerase II (Pol II) is well established, and several substrates of CDK9 in this process have been described previously: Pol II at its C-terminal repeat domain (CTD), negative elongation factor NELF, and DSIF which promotes transcription elongation upon phosphorylation [8–10]. Recent in vitro studies identified multiple novel substrates of CDK9 and previously unknown phospho-acceptor sites [11, 12]. However, such approaches cannot provide information about the activity of CDK9 in a cellular context.
We have recently created a human B cell line expressing an analog-sensitive CDK9 (CDK9as). These cells are homozygous for F103A mutations at CDK9 gene loci, which renders them sensitive to inhibition by a specific adenine analog. Using this cell line, we previously studied the effects of CDK9 inhibition in cells and demonstrated that CDK9 stimulates release of paused polymerase and activates transcription by increasing the number of transcribing polymerases [13]. Here, we combined this analog-sensitive cell line with phosphoproteomics to study the cellular substrates of CDK9 in a quantitative way.
Results
Analog-sensitive CDK9 cells allow for quantitative phosphoproteomics
CDK9as cells were recently used to study the effects of CDK9 inhibition on nascent transcription in cells [13]. Here, we utilized this cell line to study substrates of CDK9 in a cellular context and quantitate the contribution of CDK9 to individual phosphosites (Supplementary Figure 1A). First, we analyzed RNA Pol II phospho-CTD levels at different time points of 1-NA-PP1 treatment by western blot (Supplementary Figure 1B). Reduction of phosphorylation levels was weak after 15 min but very robust after 2 h of inhibition. Thus, we next decided to treat CDK9as with 1-NA-PP1 for one hour followed by quantitative phospho-proteomics using SILAC (Figure 1A). Three paired replicates were analyzed and 1102 common phosphosites were detected. Phosphosites showed strong correlation among all replicates and Pearson correlation coefficients ranged from r = 0.71 to r = 0.89 (Figure 1B and Supplementary Figure 2). We identified 120 phosphosites as significantly decreased (p-value < 0.05) upon inhibition of CDK9 whereas 172 were increased (data supplement, Supplementary Table 1). Sequence motif analysis of decreased phosphorylations revealed a strong preference for serine as phospho-acceptor (92%) and a moderate preference for proline in the +1 position (45%) (Figure 1C).
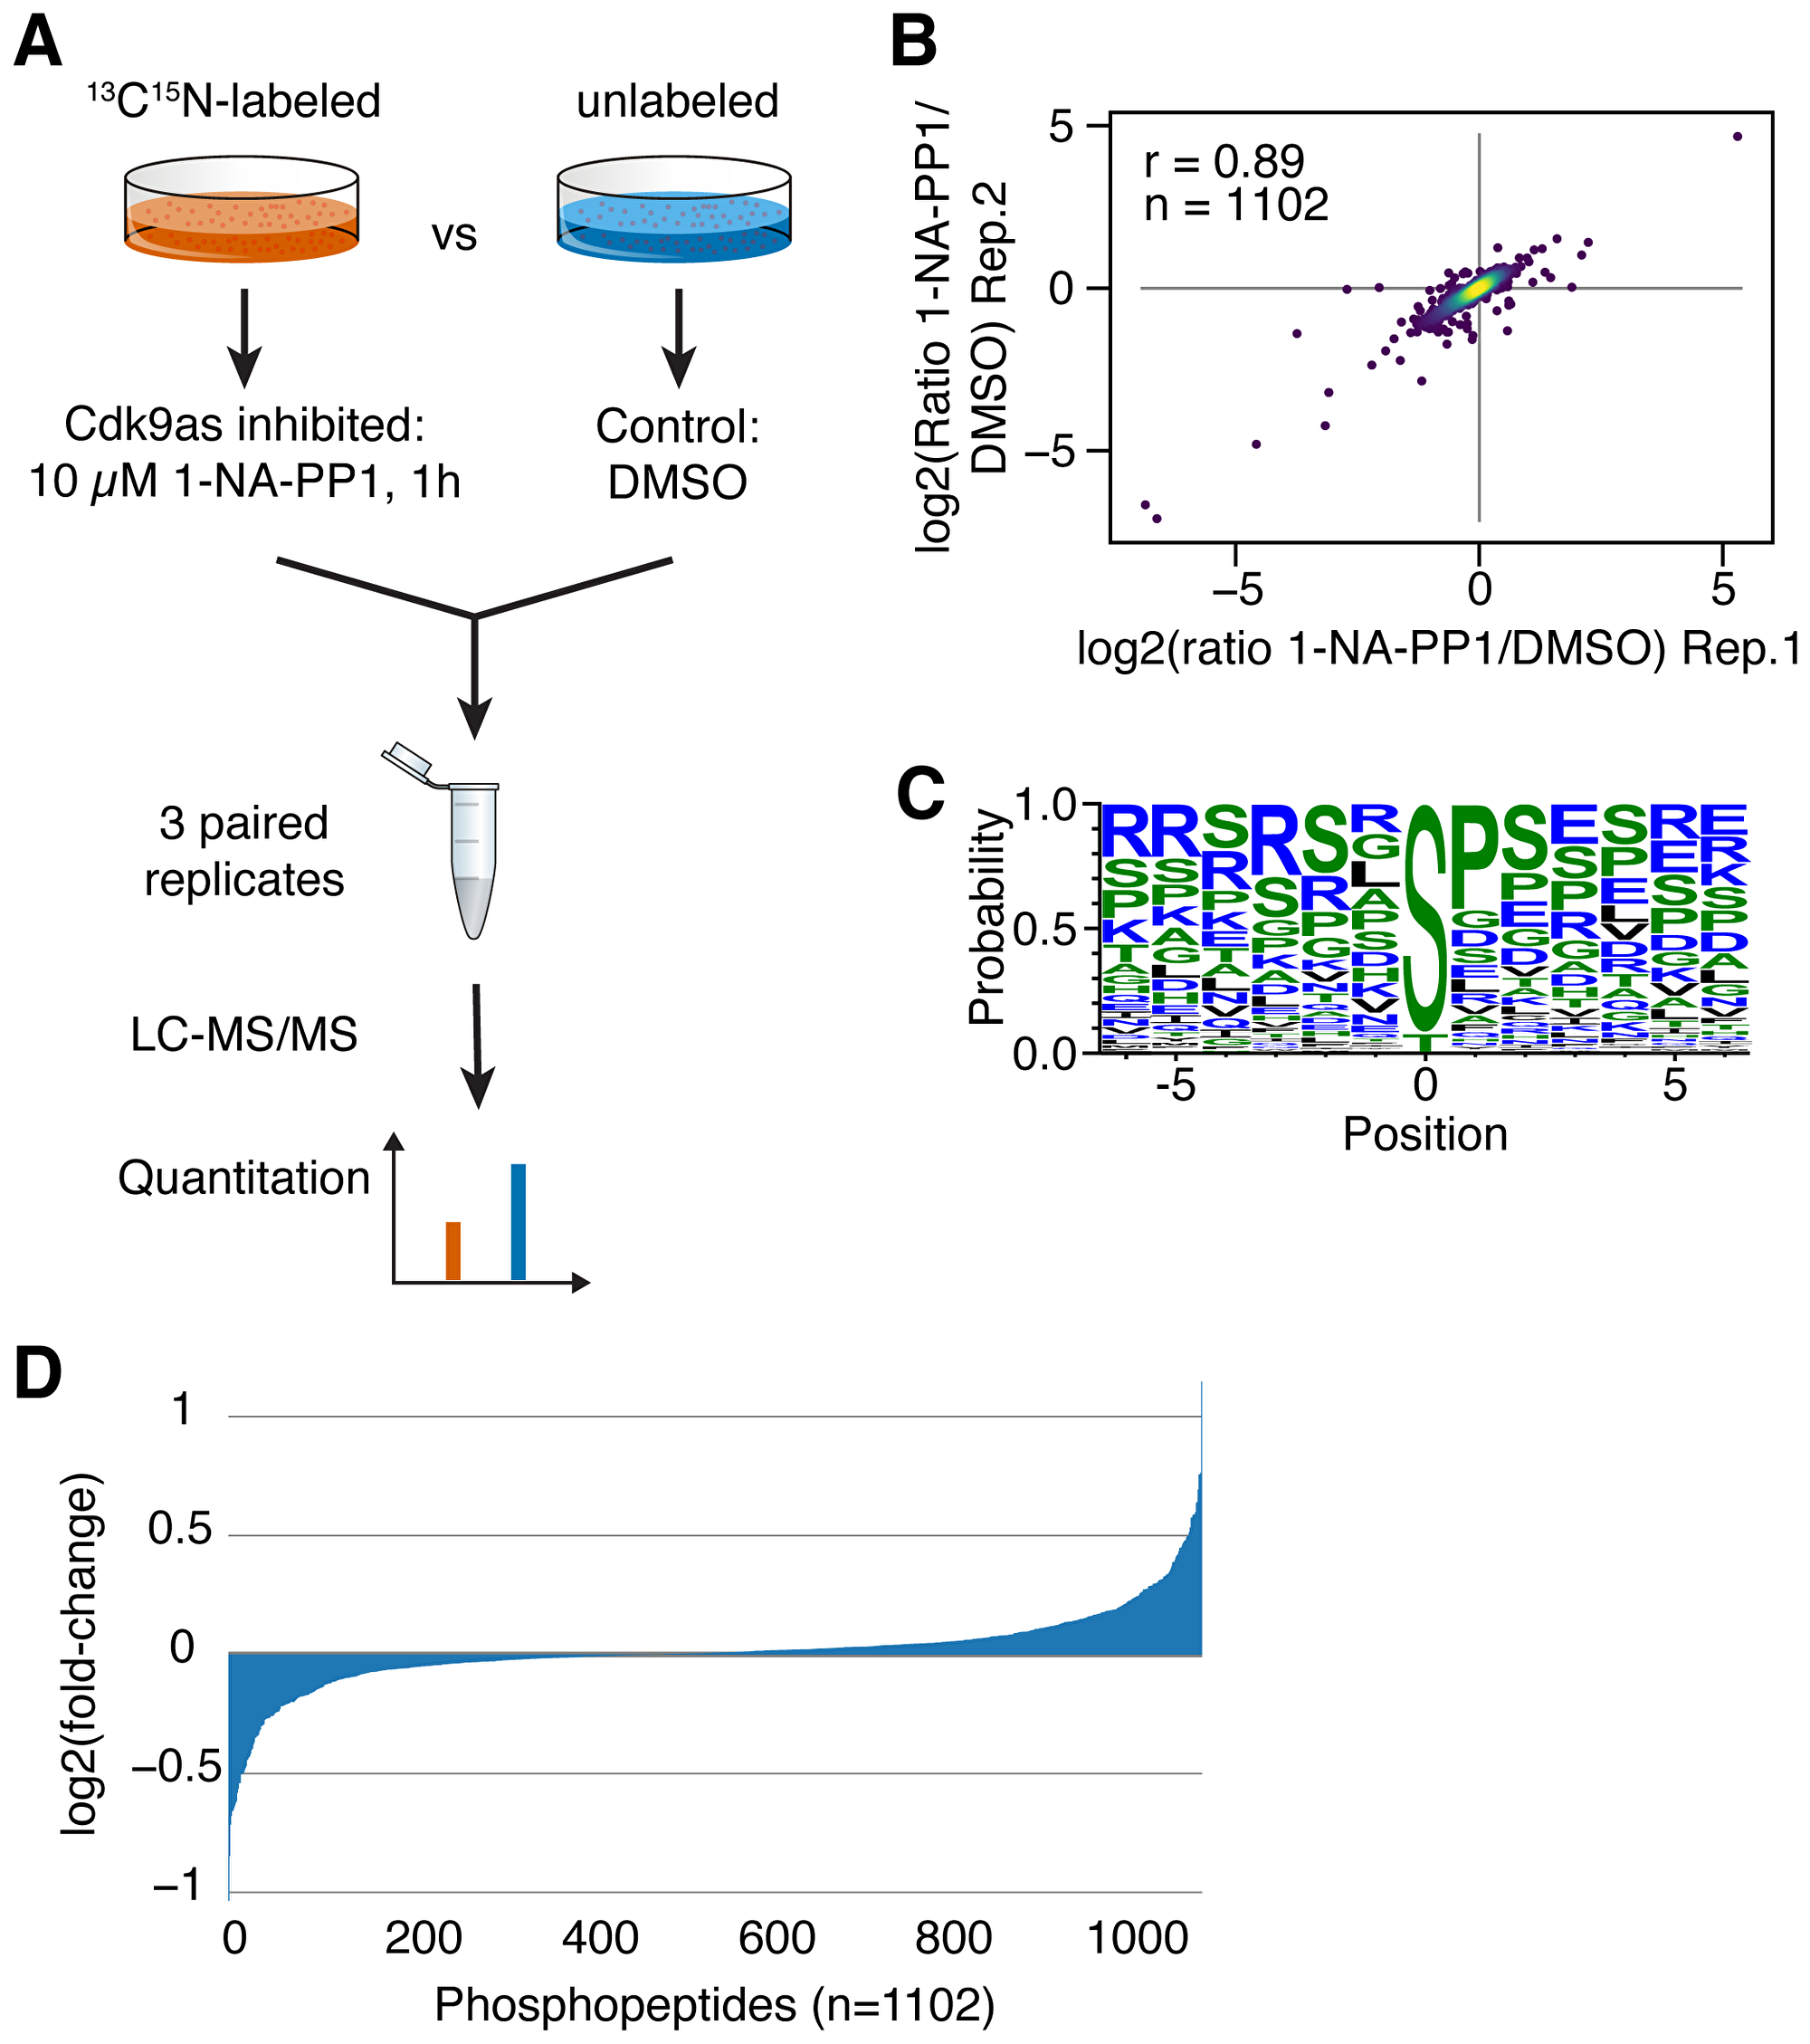
Figure 1: (A) Quantitative phosphoproteomics: Inhibition of analog-sensitive CDK9 was combined with SILAC mass spectrometry to quantitate protein phosphorylation. (B) Correlation of 1NA-PP1/DMSO ratios among replicates was determined (r = Spearman correlation coefficient). (C) Phosphosite motif analysis was performed with Weblogo. (D) Distribution of changes in phosphorylation of detected phosphopeptides.
Our quantitative phosphoproteomics approach allows for precise measurement of minor changes in the phosphorylation steady state of a given phosphosite upon inhibition of CDK9. Thus, we next sorted all significantly (p-value < 0.05) affected phosphosites by fold-change to identify those cellular substrates that were most affected by inhibition of CDK9. Interestingly, most phosphosites were only moderately affected with log2 fold changes below 0.5 (Figure 1D). However, there were several substantially reduced phosphosites (Table 1), indicating that CDK9 considerably contributes to phosphorylation levels of some proteins and less to others, including sites with low turnover of phosphorylation. Together, these findings demonstrate that we can determine even minor changes in the CDK9 phosphoproteome quantitatively. Furthermore, this allows for a deeper analysis of proteins with significantly decreased phosphorylation which will be called CDK9 substrates, hereafter.
Table 1: Top 30 reduced CDK9 substrates, ranked by log2(fold-change)
| Name | Uniprot | Phosphosite | Log2(FC) | P-value |
|---|---|---|---|---|
| FUNDC2 | Q9BWH2 | S151 | –1.04 | 4.96E-07 |
| U2SURP | E7ET15 | S945, S947, S950 | –0.85 | 3.89E-05 |
| NFATC2 | Q13469 | S757, S759 | –0.71 | 0.000382 |
| LBR | C9JXK0 | S97, S99 | –0.68 | 0.000298 |
| SRSF9 | Q13242 | S211, S216 | –0.66 | 0.000685 |
| MARCKSL1 | P49006 | S101, S104 | –0.66 | 0.00191 |
| C18orf25 | K7EQH1 | S66 | –0.63 | 0.0363 |
| PDCD4 | Q53EL6 | S76 | –0.62 | 0.00634 |
| NCBP1 | F2Z2T1 | S7 | –0.58 | 0.00656 |
| BCLAF1 | E9PK09 | T257, S268 | –0.56 | 6.37E-06 |
| STX7 | O15400 | S126, S129 | –0.54 | 0.0104 |
| TRIM28 | Q13263 | S473 | –0.5 | 7.99E-05 |
| MED1 | Q15648 | S1192 | –0.5 | 0.000182 |
| RHBDF2 | Q6PJF5 | S325, S328 | –0.5 | 0.000814 |
| RPS6KA1 | Q15418 | T359, S363 | –0.5 | 0.0364 |
| WDCP | Q9H6R7 | S690 | –0.48 | 0.00544 |
| RANBP2 | P49792 | S1160 | –0.44 | 1.26E-05 |
| YBX1 | P67809 | S165 | –0.43 | 4.21E-05 |
| SRRM2 | Q9UQ35 | S1443, S1444 | –0.4 | 0.00184 |
| MIER1 | Q8N108 | S483, S488 | –0.4 | 0.00654 |
| ACLY | P53396 | S455 | –0.37 | 0.00519 |
| SCAF11 | A0A0A0MTP7 | S711, S716 | –0.35 | 0.00198 |
| LAS1L | Q9Y4W2 | S560 | –0.34 | 0.000311 |
| LBR | C9JXK0 | S99 | –0.34 | 0.000474 |
| PRRC2A | P48634 | S761 | –0.32 | 0.0173 |
| SMARCA4 | P51532 | S695, S699 | –0.3 | 0.000665 |
| CCDC86 | Q9H6F5 | S58 | –0.3 | 0.00126 |
| DNAJC2 | F2Z3H0 | S47, S49 | –0.27 | 0.000589 |
| EIF4B | P23588 | S445 | –0.27 | 0.00139 |
| FNBP1 | B7ZL14 | S296 | –0.27 | 0.00727 |
Transcription- and splicing-associated factors are the major substrates of CDK9
Due to the well-described role of CDK9 in transcription regulation, we performed gene ontology analysis with CDK9 substrates that were identified in this study. We found 50.5% of CDK9 substrates to be proteins involved in transcription or chromatin regulation and mRNA splicing (Figure 2A and 2B). Interestingly, when weighting substrates by fold change, this majority increased to 58.2%, demonstrating that CDK9 also phosphorylates transcription and splicing-associated factors on a quantity basis (Supplementary Figure 3). Notably, four out of the top ten reduced substrates have no annotated roles in transcription or splicing (FUNDC2, LBR, MARCKSL1, c18orf25). Together, the substrates identified in this study are in line with the role of CDK9 in transcription regulation and further emphasize the role of this kinase in splicing.
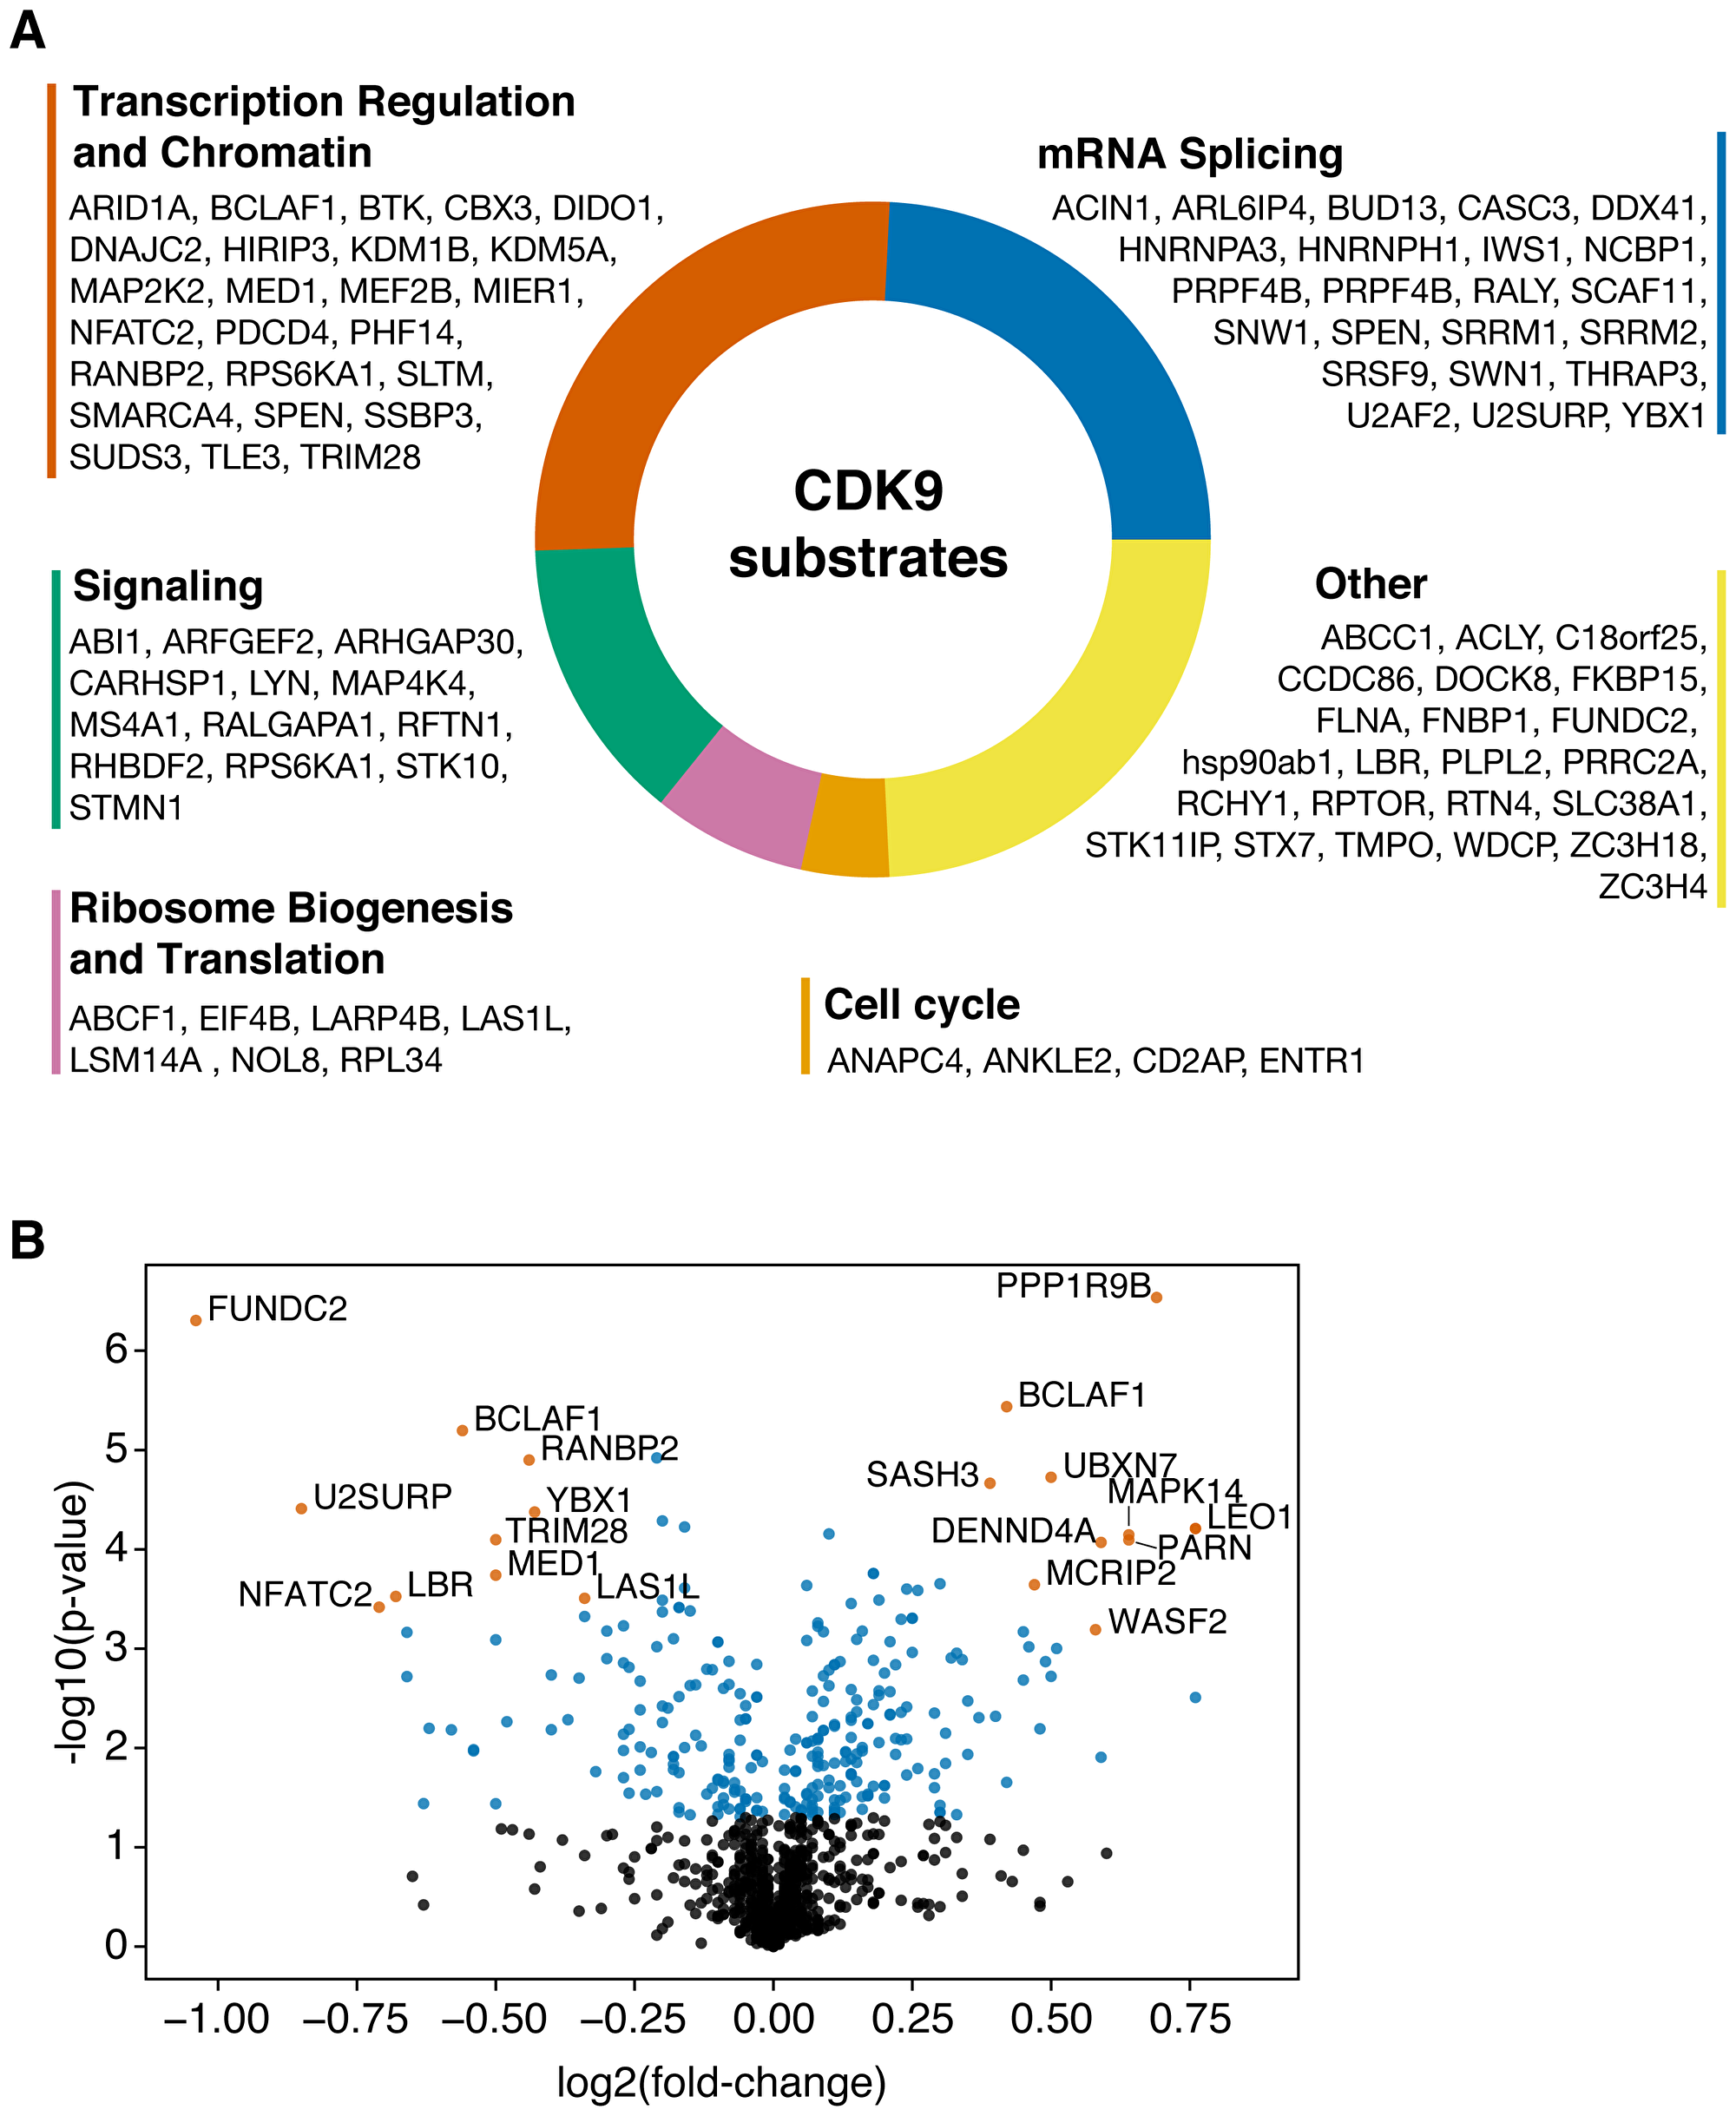
Figure 2: (A) Gene ontology analysis of CDK9 substrates. (B) Volcano plot showing the CDK9 phosphoproteome. Most significantly up- and downregulated (by p-value, log2 fold-change > 0.3) phosphopeptides are annotated.
Cellular CDK9 substrates show little overlap with in vitro substrates
Specificity of kinase inhibitors as well as the study of kinase substrates is typically performed in vitro. While in vitro approaches allow identification of potential CDK9 substrates, they cannot provide information about the activity of CDK9 in cells. Thus, we compared our cellular set of CDK9 substrates to the results of the Fisher lab that determined CDK9 substrates in vitro using a combined analog-sensitive and chemical approach [11]. Of 120 cellular substrates, four (HS90B, IWS1, PRRC2A, SRRM2) could be co-identified in the in vitro dataset, but only for HS90B we found a matching phosphosite on S255 (Figure 3A). The minimal overlap of cellular and in vitro data suggests, that in vitro analysis alone limits the understanding of kinases and their inhibitors that can be won in such experiments.
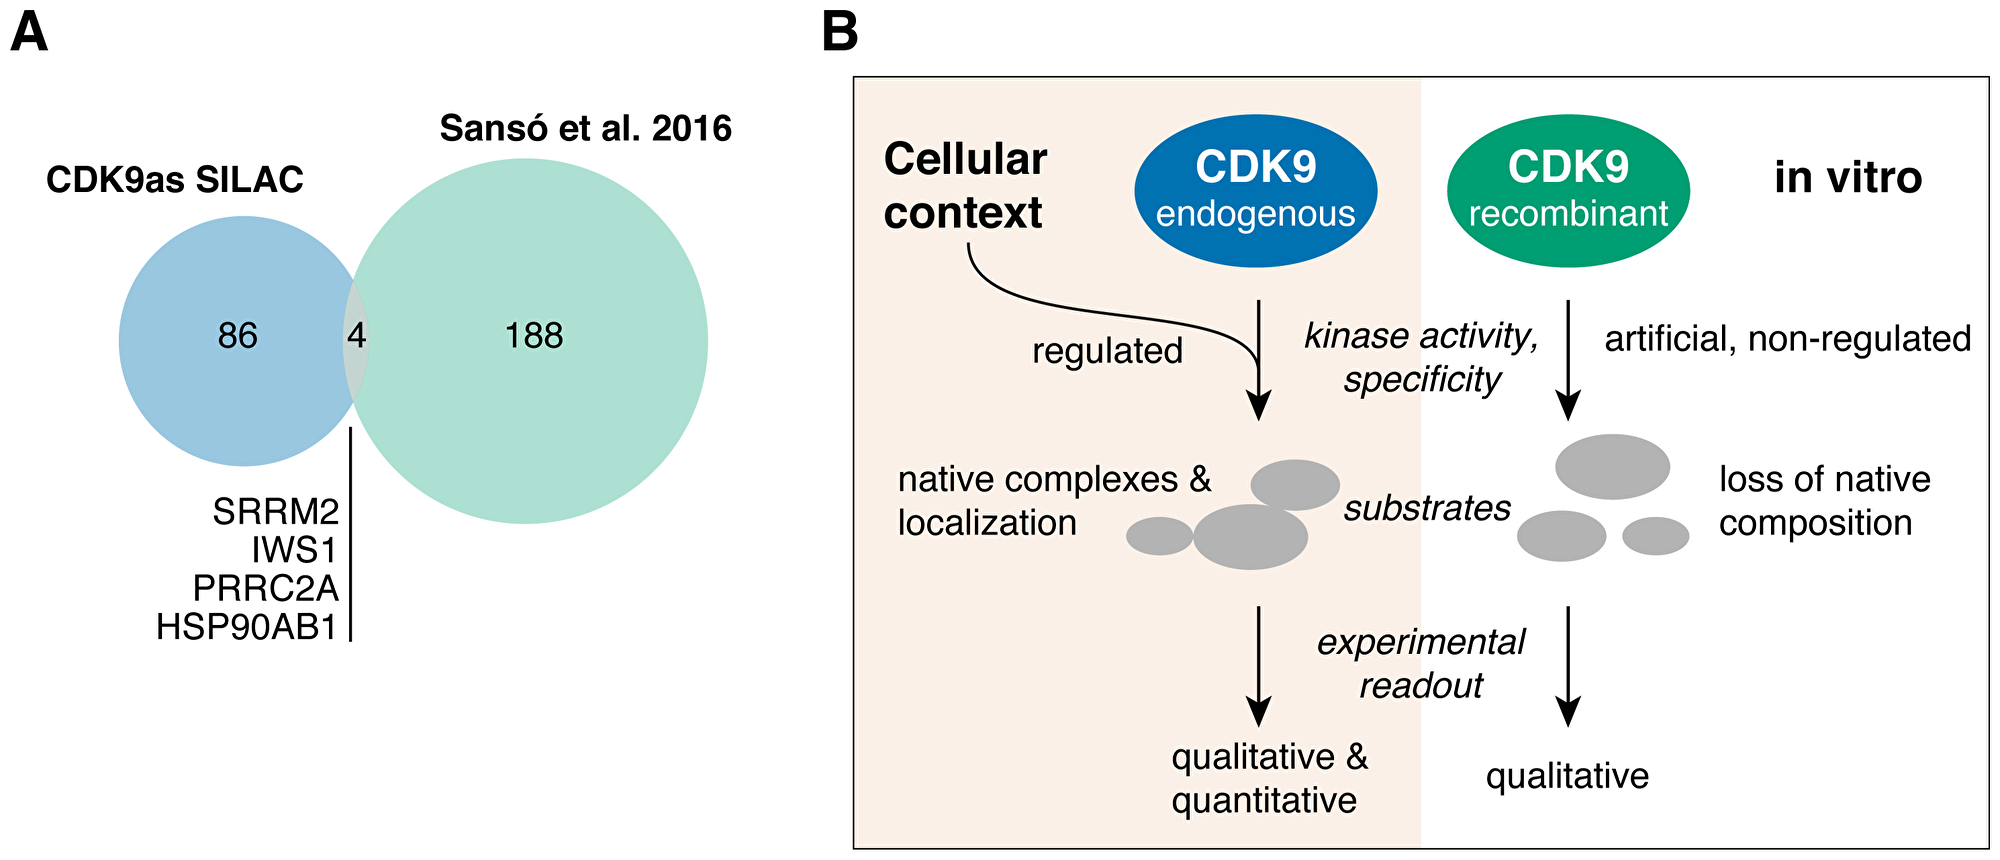
Figure 3: (A) Venn diagram depicting the overlap between cellular (this study, CDK9as SILAC) and in vitro (11) CDK9 substrates. (B) Model: The study of protein kinases and their substrates fundamentally differs when performed outside of cellular context.
DISCUSSION
Quantitative phosphoproteomics puts CDK9 in the center of co-transcriptional events
The canonical role of CDK9 as the kinase subunit of P-TEFb in the release of promoter-proximal pausing of RNA Pol II is well established and has been demonstrated in various studies [8–10]. Surprisingly, our list of CDK9 substrates did not contain several of those substrates, that are mostly linked with the canonical role of CDK9, including Pol II CTD, NELF, and DSIF. This might be explained by the complex nature of our sample, in which peptides of these proteins may be masked by others that are more abundant. Importantly, we did not include any fractionation to enrich for specific proteins in our sample preparation to maintain an unbiased approach, and to specifically identify those phosphopeptides that are quantitatively most important.
Several high confidence substrates identified in the present study are associated with events in early transcription as well, including Mediator subunit MED1 which is part of the pre-initiation complex [14, 15] and TRIM28 (KAP1) which was recently found to recruit the inactive P-TEFb (7SK snRNP) complex [16]. We also detected elongation factor IWS1, although its phosphorylation was only moderately reduced. Notably, IWS1 was also identified as a CDK9 substrate in vitro [11], validating this factor as a high confidence substrate of CDK9. IWS1 is recruited to elongating Pol II by SPT6 and promotes mRNA export and recruitment of histone methyltransferase Setd1 [17, 18]. Recent work demonstrated a link between CDK9 and gene silencing at heterochromatic loci and reported SMARCA4 (BRG1) as a direct phosphorylation substrate of CDK9 [19]. We also identified SMARCA4 as a CDK9 substrate, although the phosphosites differ from those detected in the mentioned study. This expands the spectrum of CDK9 substrates by several factors that are central to transcription initiation and elongation.
Intriguingly, we identified a substantial number of additional cellular CDK9 substrates that have a role in mRNA splicing. Indeed, the second most downregulated phosphoprotein in our dataset was U2SURP, which is part of the spliceosome and together with RBM17 and CHERP forms a minimal module that binds the U2 snRNP [20]. Moreover, SRSF9 (SRp30c), a SR protein and regulator of alternative splicing [21, 22], also showed substantially reduced phosphorylation in our dataset. Importantly, alternative splicing was recently found to be increased in tumors [23] and changes in alternative splicing may drive functional transformations in cancer [24]. The coupling of transcription with splicing events is well established [25]. However, the role of individual factors and mechanisms involved are poorly described. P-TEFb has been linked to regulation of splicing before. In a functional proteomics approach, the CDK9 interactome was found enriched for splicing factors, suggesting that these factors are part of the basal CDK9 complex [26]. Furthermore, CDK9 and Cyclin T1 co-localize with splicing speckles in HeLa cells [27]. Another study demonstrated the importance of 7SK snRNP integrity for alternative splicing using cellular splicing assays [28]. In the same study, knockdown of 7SK snRNP subunits larp7 or bcdin3 orthologues in zebrafish embryos resulted in aberrant splicing. Vice versa, splicing factors stimulate transcription elongation [29, 30], and splicing inhibition downregulates Pol II CTD phosphorylation at serine-2 sites [31], indicating reciprocal regulation of the two mechanisms. Together with the evidence from previous studies, our findings suggest that the kinase activity of CDK9 plays a key role in the regulation of RNA splicing by phosphorylation of splicing factors.
Quantitative phosphoproteomics identifies potential CDK9 substrates
We found a number of new CDK9 substrates that were substantially impacted upon inhibition of CDK9. In our analysis, the top target identified as FUN14 domain-containing protein 2 (FUNDC2). Little is known about this membrane protein, but mitochondrial FUNDC2 has been reported to support platelet survival via the AKT pathway [32]. It is unclear if and how FUNDC2 connects to the function of CDK9 in transcription, but it has been found in the proteome of the human sperm nucleus [33]. The third most reduced phosphorylation was measured for transcription factor NFATC2 at S757 and S759 residues. However, phosphorylation of more amino-terminal serines were found to regulate nuclear localization and transcriptional activation of NFATC2 in previous studies [34, 35]. Thus, phosphorylation by CDK9 might provide similar functional control in a co-transcriptional way. Particularly, CDK9 may phosphorylate NFATC2 to trigger its re-localization to the cytoplasm, establishing a feedback-loop that links elongation to transcription initiation. Moreover, we found NCBP1, a component of the cap-binding complex (CBC), to be strongly reduced in phosphorylation at S7 in CDK9-inhibited cells. This phosphorylation has been demonstrated to be placed by S6 Kinase B1 (RPS6KB1) and activate the CBC [36]. Interestingly, we found S6 Kinase A1 (RPS6KA1), a member of the same kinase family, to be reduced in phosphosites that positively regulate the activity of S6 Kinase A1. This observation indicates both that CDK9 activates other kinases and that it is involved in RNA-export and translation initiation, further expanding its role as a central regulator of co- and post-transcriptional processes.
Cellular context substantially determines the activity of CDK9
The use of analog-sensitive kinases reduces the risk of off-target inhibition when using generic kinase inhibitors that often lack desirable specificity [37]. Notably, analog-sensitive CDK12 was recently used to study its cellular substrates by mass spectrometry [38], demonstrating that this approach further expands the understanding of transcriptional kinases. CDK9 substrates identified in our study show little overlap with a recent in vitro study that used a similar analog-sensitive kinase strategy in combination with cellular extracts [11]. This discrepancy can partly be explained by lack of sensitivity of our phosphoproteomics strategy. In addition, the differences in cell type (B-cell lymphoma versus colon carcinoma) and source of analog-sensitive CDK9 (endogenously expressed versus excess of recombinantly purified) may provide further explanation. Notably, Sansó et al. found that 50% of their CDK9 substrates have functions in transcription and RNA metabolism and splicing, which is similar to our findings. However, the observed differences emphasize that in vitro methods cannot sufficiently predict the effects of kinase inhibition in a cellular context (Figure 3B). This notion is of particular importance when evaluating novel kinase inhibitors for therapeutic purposes. Importantly, a kinase might act on a substrate in vitro but its impact on the cellular steady-state of the same phosphosite might be insignificant. In cells, the amount of CDK9 is limited, its recruitment is tightly coordinated, and its activity is highly regulated. Thus, quantitative cell-based methods such as SILAC combined with phosphoproteomics provide valuable insights into the activity of CDK9 and its impact on the phosphorylation state of its substrates.
Materials and Methods
CDK9as cell line
CDK9 analog-sensitive Raji B cells (CDK9as) used in this study were described previously [13]. CDK9as are homozygous for F103A mutation at CDK9 gene loci, which were introduced using the CRISPR-Cas9 system.
Western blot analysis and antibodies
Cells were lysed in 2x laemmli buffer before submission to SDS-PAGE. Proteins were transferred to a nitrocellulose membrane (GE) and unspecific binding of antibodies was blocked by 1 h incubation of the membrane with 5% milk (w/v) in Tris-buffered saline plus 1% Tween-20 (TBS-T). Next, the following primary antibodies were added and incubated overnight at 4°C: alpha-Tubulin (Sigma T9026), Cdk9 (Santa Cruz sc-484), Rpb1 (Pol3/3), CTD phospho-specific antibodies: Ser2-P (3E10), Ser5-P (3E8) [39]. The membrane was washed in TBS-T and incubated for 90 min at room temperature with IRDye-labelled, secondary antibodies against rat/rabbit (680 nm; Invitrogen) and mouse (800 nm; Rockford, Biomol) and imaged using an Odyssey Imaging System (Li-Cor).
Cell culture and SILAC labeling
Cells were maintained in RPMI1640 without arginine, glutamine, and lysine (Silantes, Munich, Germany) supplemented with 10% dialyzed fetal bovine serum (Silantes), 2 mM L-alanyl-L-glutamine (Thermo Fisher Scientific), 100 U/mL penicillin and 100 µg/mL streptomycin (Thermo Fisher Scientific), and 100 µM sodium pyruvate (Thermo Fisher Scientific) at 37°C and 5% CO2. For stable isotope labeling with amino acids in cell culture (SILAC), either 13C15N-labeled or unlabeled L-arginine (40 mg/L) and L-lysine (200 mg/L) (Silantes) were added. Cells were labeled for 12 days prior to CDK9 inhibition assays. Labelling efficiency of CDK9as was validated by mass spectrometry analysis periodically.
Inhibition of analog-sensitive CDK9
1 × 10⁷ cells were treated with 10 µM 1-NA-PP1 (Merck Millipore) or DMSO (Sigma-Aldrich) for 1 hour. Cells were pelleted by centrifugation and washed once in phosphate buffered saline (PBS). 1-NA-PP1-treated cells and DMSO control cells were pooled resulting in 2 × 10⁷ total cells per replicate. Four biological replicates of labeled, 1-NA-PP1-treated cells pooled with unlabeled, DMSO-treated cells were prepared. In addition, four corresponding label-swapped replicates were prepared, in which unlabeled cells were treated with 1-NA-PP1 and DMSO control cells were labeled with 13C15N-containing arginine and lysine, resulting in 4 paired replicates.
Cell lysis and phosphopeptide enrichment
Subsequent sample preparation was essentially based on the EasyPhos method [40] with modifications as follows. Pooled cells were washed once in PBS, solubilized in 400 µL lysis buffer (4% SDS, 100 mM tris pH 8.5, 10 mM tris(2-carboxyethyl)-phosphine (TCEP, Sigma-Aldrich), 40 mM chloroacetamide (CAA, Sigma-Aldrich) and heated at 95°C for 5 min. Lysates were cooled on ice, sonicated (Branson Sonifier 250, 3x 10 pulses, output 5, duty cycle 50%) and heated again at 95°C for 5 min. Lysates were once more cooled on ice and processed on a Bioruptor UCD-200 (Diagenode, 15x [30 sec ON + 30 sec OFF] at high setting). Lysates were centrifuged for 30 min at 3,500 g at 4°C. The supernatant was transferred into a clean tube and protein concentration was determined by BCA assay (Pierce Microplate BCA Protein Assay Kit - Reducing Agent Compatible).
Samples were normalized to a protein concentration of 5 mg/mL and protein was precipitated over night by adding 4x volume of –20°C acetone. Precipitated protein was collected by centrifugation (15 min at 2,000 g) and washed twice in –20°C acetone and by resuspension in the Bioruptor (20 sec, high). Protein pellets were resuspended in 500 µL TFE digestion buffer (10% 2,2,2-trifluoroethanol [Sigma-Aldrich], 100 mM ammonium bicarbonate). Protein digest and phosphopeptide enrichment were performed as described in Humphrey et al., 2015. Protein digest was performed using Trypsin and LysC. For phosphopeptide enrichment Titansphere Phos-TiO Beads 10 µm were used (GL Sciences). Eluted phosphopeptides were concentrated by speed-vac and brought to 3% TFA.
Desalting and LC-MS/MS
For desalting, peptides were loaded onto 2x layers styrenedivinylbenzene-reversed phase-sulfonated StageTips (SDB-RPS; 3M Empore) and washed 1) in 100 μL SDB-RPS wash buffer 1 (99% isopropanol, 1% trifluroacetic acid [TFA]) and 2) in 100 µL SDB-RPS wash buffer 2 (0.2% TFA). Phosphopeptides were eluted with 60 μL SDB-RPS elution buffer (80% acetonitrile, 1.25% NH4OH [25%, HPLC grade]) into a clean protein low-binding tube by centrifugation for 5 min at 500 g. Peptides were concentrated by speed-vac for 30 min at 45°C, or until ~2 μL remained. Samples were resuspended in 7 μL MS loading buffer (2% acetonitrile, 0.3% TFA) and injected in an Ultimate 3000 RSLCnano system (Thermo), separated in a 15-cm analytical column (75 μm ID home-packed with ReproSil-Pur C18-AQ 2.4 μm from Dr. Maisch) with a 50-min gradient from 3 to 16% acetonitrile in 0.1% formic acid followed by a 10-min gradient from 16 to 26% acetonitrile in 0.1% formic acid. The effluent from the HPLC was directly electrosprayed into a Q Exactive HF (Thermo) operated in data-dependent mode to automatically switch between full scan MS and MS/MS acquisition. Survey full scan MS spectra (from m/z 375–1600) were acquired with resolution 60,000 at m/z 400 (AGC target of 3 × 10⁶) and MS/MS spectra with resolution 15,000 at m/z 400 (AGC target of 1 × 10⁵). The 10 most intense peptide ions with charge states between 2 and 5 were sequentially isolated to a target value of 1 × 10⁵, and fragmented at 27% normalized collision energy. Typical MS conditions were: spray voltage, 1.5 kV; no sheath and auxiliary gas flow; heated capillary temperature, 250°C; ion selection threshold, 33.000 counts.
Data analysis
Normalized heavy to light ratios reported by MaxQuant were log2 transformed for statistical analyses. We then selected the best 3 out of 4 paired replicates to reduce the number of dropouts caused by missing values. Missing value imputation was not performed. Differential abundance of peptides based on inhibitor administration was estimated by t-tests (with Welch correction, two sided, unpaired) on the log ratios of forward versus reverse labelled replicates. This approach avoids systematic errors based on arginine to proline conversion [41] leading to a systematic distortion of heavy/light ratios. MS data plots were prepared using Python libraries matplotlib, seaborn, and plotly. Sequence motif plots were prepared with WebLogo 3 [42]. Gene ontology analysis was done with DAVID 3.8 GOTERM_BP_DIRECT and proteins were further grouped into six categories based on the DAVID results [43, 44].
The mass spectrometry proteomics data and the data supplement have been deposited to the ProteomeXchange Consortium via the PRIDE [45] partner repository with the dataset identifier PXD014825 at https://www.ebi.ac.uk/pride/archive/.
Abbreviations
CDK9: cyclin-dependent kinase 9; Pol II: RNA polymerase II; CTD: C-terminal domain; SILAC: stable isotope labeling with amino acids in cell culture; 1-NA-PP1: 1-(1,1-dimethylethyl)-3-(1-naphthalenyl)-1H-pyrazolo[3,4-d]pyrimidin-4-amine.
ACKNOWLEDGMENTS
We thank Umut Erdogdu for his help with initial labeling experiments.
CONFLICTS OF INTEREST
The authors declare that they have no conflicts of interest with the contents of this article.
FUNDING
Funding was provided by the Deutsche Forschungsgemeinschaft (DFG), SFB 1064 collaborative research center (CRC) – Chromatin Dynamics and DFG Research Fellowship DE 3069/1-1 (TMD).
References
1. Manning G, Whyte DB, Martinez R, Hunter T, Sudarsanam S. The protein kinase complement of the human genome. Science. 2002; 298:1912–34. https://doi.org/10.1126/science.1075762. [PubMed].
2. Lindberg RA, Quinn AM, Hunter T. Dual-specificity protein kinases: will any hydroxyl do? Trends Biochem Sci. 1992; 17:114–9. https://doi.org/10.1016/0968-0004(92)90248-8. [PubMed].
3. Miller CJ, Turk BE. Homing in: Mechanisms of Substrate Targeting by Protein Kinases. Trends Biochem Sci. 2018; 43:380–94. https://doi.org/10.1016/j.tibs.2018.02.009. [PubMed].
4. Ochoa D, Jonikas M, Lawrence RT, El Debs B, Selkrig J, Typas A, Villén J, Santos SD, Beltrao P. An atlas of human kinase regulation. Mol Syst Biol. 2016; 12:888. https://doi.org/10.15252/msb.20167295. [PubMed].
5. Roskoski R Jr. A historical overview of protein kinases and their targeted small molecule inhibitors. Pharmacol Res. 2015; 100:1–23. https://doi.org/10.1016/j.phrs.2015.07.010. [PubMed].
6. Rask-Andersen M, Zhang J, Fabbro D, Schiöth HB. Advances in kinase targeting: current clinical use and clinical trials. Trends Pharmacol Sci. 2014; 35:604–20. https://doi.org/10.1016/j.tips.2014.09.007. [PubMed].
7. Franco LC, Morales F, Boffo S, Giordano A. CDK9: A key player in cancer and other diseases. J Cell Biochem. 2018; 119:1273–84. https://doi.org/10.1002/jcb.26293. [PubMed].
8. Marshall NF, Peng J, Xie Z, Price DH. Control of RNA polymerase II elongation potential by a novel carboxyl-terminal domain kinase. J Biol Chem. 1996; 271:27176–83. https://doi.org/10.1074/jbc.271.43.27176. [PubMed].
9. Fujinaga K, Irwin D, Huang Y, Taube R, Kurosu T, Peterlin BM. Dynamics of human immunodeficiency virus transcription: P-TEFb phosphorylates RD and dissociates negative effectors from the transactivation response element. Mol Cell Biol. 2004; 24:787–95. https://doi.org/10.1128/mcb.24.2.787-795.2004. [PubMed].
10. Kim JB, Sharp PA. Positive transcription elongation factor B phosphorylates hSPT5 and RNA polymerase II carboxyl-terminal domain independently of cyclin-dependent kinase-activating kinase. J Biol Chem. 2001; 276:12317–23. https://doi.org/10.1074/jbc.M010908200. [PubMed].
11. Sansó M, Levin RS, Lipp JJ, Wang VY, Greifenberg AK, Quezada EM, Ali A, Ghosh A, Larochelle S, Rana TM, Geyer M, Tong L, Shokat KM, et al. P-TEFb regulation of transcription termination factor Xrn2 revealed by a chemical genetic screen for Cdk9 substrates. Genes Dev. 2016; 30:117–31. https://doi.org/10.1101/gad.269589.115. [PubMed].
12. Vos SM, Farnung L, Boehning M, Wigge C, Linden A, Urlaub H, Cramer P. Structure of activated transcription complex Pol II–DSIF–PAF–SPT6. Nature. 2018; 560:607–12. https://doi.org/10.1038/s41586-018-0440-4. [PubMed].
13. Gressel S, Schwalb B, Decker TM, Qin W, Leonhardt H, Eick D, Cramer P. CDK9-dependent RNA polymerase II pausing controls transcription initiation. Elife. 2017; 6:e29736. https://doi.org/10.7554/eLife.29736. [PubMed].
14. Bernecky C, Grob P, Ebmeier CC, Nogales E, Taatjes DJ. Molecular Architecture of the Human Mediator–RNA Polymerase II–TFIIF Assembly. PLoS Biol. 2011; 9:e1000603. https://doi.org/10.1371/journal.pbio.1000603. [PubMed].
15. Plaschka C, Larivière L, Wenzeck L, Seizl M, Hemann M, Tegunov D, Petrotchenko EV, Borchers CH, Baumeister W, Herzog F, Villa E, Cramer P. Architecture of the RNA polymerase II–Mediator core initiation complex. Nature. 2015; 518:376–80. https://doi.org/10.1038/nature14229. [PubMed].
16. McNamara RP, Reeder JE, McMillan EA, Bacon CW, McCann JL, D’Orso I. KAP1 Recruitment of the 7SK snRNP Complex to Promoters Enables Transcription Elongation by RNA Polymerase II. Mol Cell. 2016; 61:39–53. https://doi.org/10.1016/j.molcel.2015.11.004. [PubMed].
17. Yoh SM, Cho H, Pickle L, Evans RM, Jones KA. The Spt6 SH2 domain binds Ser2-P RNAPII to direct Iws1-dependent mRNA splicing and export. Genes Dev. 2007; 21:160–74. https://doi.org/10.1101/gad.1503107. [PubMed].
18. Yoh SM, Lucas JS, Jones KA. The Iws1:Spt6:CTD complex controls cotranscriptional mRNA biosynthesis and HYPB/Setd2-mediated histone H3K36 methylation. Genes Dev. 2008; 22:3422–34. https://doi.org/10.1101/gad.1720008. [PubMed].
19. Zhang H, Pandey S, Travers M, Sun H, Morton G, Madzo J, Chung W, Khowsathit J, Perez-Leal O, Barrero CA, Merali C, Okamoto Y, Sato T, et al. Targeting CDK9 Reactivates Epigenetically Silenced Genes in Cancer. Cell. 2018; 175:1244–1258.e26. https://doi.org/10.1016/j.cell.2018.09.051. [PubMed].
20. De Maio A, Yalamanchili HK, Adamski CJ, Gennarino VA, Liu Z, Qin J, Jung SY, Richman R, Orr H, Zoghbi HY. RBM17 Interacts with U2SURP and CHERP to Regulate Expression and Splicing of RNA-Processing Proteins. Cell Rep. 2018; 25:726–736.e7. https://doi.org/10.1016/j.celrep.2018.09.041. [PubMed].
21. Simard MJ, Chabot B. SRp30c is a repressor of 3′ splice site utilization. Mol Cell Biol. 2002; 22:4001–10. https://doi.org/10.1128/mcb.22.12.4001-4010.2002. [PubMed].
22. Howard JM, Sanford JR. The RNAissance family: SR proteins as multifaceted regulators of gene expression. Wiley Interdiscip Rev RNA. 2015; 6:93–110. https://doi.org/10.1002/wrna.1260. [PubMed].
23. Kahles A, Lehmann KV, Toussaint NC, Hüser M, Stark SG, Sachsenberg T, Stegle O, Kohlbacher O, Sander C, Rätsch G; Cancer Genome Atlas Research Network. Comprehensive Analysis of Alternative Splicing Across Tumors from 8,705 Patients. Cancer Cell. 2018; 34:211–224.e6. https://doi.org/10.1016/j.ccell.2018.07.001. [PubMed].
24. Climente-González H, Porta-Pardo E, Godzik A, Eyras E. The Functional Impact of Alternative Splicing in Cancer. Cell Rep. 2017; 20:2215–26. https://doi.org/10.1016/j.celrep.2017.08.012. [PubMed].
25. Carrillo Oesterreich F, Bieberstein N, Neugebauer KM. Pause locally, splice globally. Trends Cell Biol. 2011; 21:328–35. https://doi.org/10.1016/j.tcb.2011.03.002. [PubMed].
26. Yang J, Zhao Y, Kalita M, Li X, Jamaluddin M, Tian B, Edeh CB, Wiktorowicz JE, Kudlicki A, Brasier AR. Systematic Determination of Human Cyclin Dependent Kinase (CDK)-9 Interactome Identifies Novel Functions in RNA Splicing Mediated by the DEAD Box (DDX)-5/17 RNA Helicases. Mol Cell Proteomics. 2015; 14:2701–21. https://doi.org/10.1074/mcp.M115.049221. [PubMed].
27. Herrmann CH, Mancini MA. The Cdk9 and cyclin T subunits of TAK/P-TEFb localize to splicing factor-rich nuclear speckle regions. J Cell Sci. 2001; 114:1491–503. [PubMed].
28. Barboric M, Lenasi T, Chen H, Johansen EB, Guo S, Peterlin BM. 7SK snRNP/P-TEFb couples transcription elongation with alternative splicing and is essential for vertebrate development. Proc Natl Acad Sci U S A. 2009; 106:7798–803. https://doi.org/10.1073/pnas.0903188106. [PubMed].
29. Fong YW, Zhou Q. Stimulatory effect of splicing factors on transcriptional elongation. Nature. 2001; 414:929–33. https://doi.org/10.1038/414929a. [PubMed].
30. Ji X, Zhou Y, Pandit S, Huang J, Li H, Lin CY, Xiao R, Burge CB, Fu XD. SR proteins collaborate with 7SK and promoter-associated nascent RNA to release paused polymerase. Cell. 2013; 153:855–68. https://doi.org/10.1016/j.cell.2013.04.028. [PubMed].
31. Koga M, Hayashi M, Kaida D. Splicing inhibition decreases phosphorylation level of Ser2 in Pol II CTD. Nucleic Acids Res. 2015; 43:8258–67. https://doi.org/10.1093/nar/gkv740. [PubMed].
32. Ma Q, Zhu C, Zhang W, Ta N, Zhang R, Liu L, Feng D, Cheng H, Liu J, Chen Q. Mitochondrial PIP3-binding protein FUNDC2 supports platelet survival via AKT signaling pathway. Cell Death Differ. 2019; 26:321–31. https://doi.org/10.1038/s41418-018-0121-8. [PubMed].
33. de Mateo S, Castillo J, Estanyol JM, Ballescà JL, Oliva R. Proteomic characterization of the human sperm nucleus. Proteomics. 2011; 11:2714–26. https://doi.org/10.1002/pmic.201000799. [PubMed].
34. Beals CR, Clipstone NA, Ho SN, Crabtree GR. Nuclear localization of NF-ATc by a calcineurin-dependent, cyclosporin-sensitive intramolecular interaction. Genes Dev. 1997; 11:824–34. https://doi.org/10.1101/gad.11.7.824. [PubMed].
35. Wu H, Peisley A, Graef IA, Crabtree GR. NFAT signaling and the invention of vertebrates. Trends Cell Biol. 2007; 17:251–60. https://doi.org/10.1016/j.tcb.2007.04.006. [PubMed].
36. Wilson KF, Wu WJ, Cerione RA. Cdc42 Stimulates RNA Splicing via the S6 Kinase and a Novel S6 Kinase Target, the Nuclear Cap-binding Complex. J Biol Chem. 2000; 275:37307–10. https://doi.org/10.1074/jbc.C000482200. [PubMed].
37. Bishop AC, Ubersax JA, Petsch DT, Matheos DP, Gray NS, Blethrow J, Shimizu E, Tsien JZ, Schultz PG, Rose MD, Wood JL, Morgan DO, Shokat KM. A chemical switch for inhibitor-sensitive alleles of any protein kinase. Nature. 2000; 407:395–401. https://doi.org/10.1038/35030148. [PubMed].
38. Bartkowiak B, Yan CM, Soderblom EJ, Greenleaf AL. CDK12 Activity-Dependent Phosphorylation Events in Human Cells. Biomolecules. 2019; 9:634. https://doi.org/10.3390/biom9100634. [PubMed].
39. Chapman RD, Heidemann M, Albert TK, Mailhammer R, Flatley A, Meisterernst M, Kremmer E, Eick D. Transcribing RNA polymerase II is phosphorylated at CTD residue serine-7. Science. 2007; 318:1780–2. https://doi.org/10.1126/science.1145977. [PubMed].
40. Humphrey SJ, Azimifar SB, Mann M. High-throughput phosphoproteomics reveals in vivo insulin signaling dynamics. Nat Biotechnol. 2015; 33:990–5. https://doi.org/10.1038/nbt.3327. [PubMed].
41. Ong SE, Mann M. A practical recipe for stable isotope labeling by amino acids in cell culture (SILAC). Nat Protoc. 2006; 1:2650–60. https://doi.org/10.1038/nprot.2006.427. [PubMed].
42. Crooks GE, Hon G, Chandonia JM, Brenner SE. WebLogo: a sequence logo generator. Genome Res. 2004; 14:1188–90. https://doi.org/10.1101/gr.849004. [PubMed].
43. Huang da W, Sherman BT, Lempicki RA. Systematic and integrative analysis of large gene lists using DAVID bioinformatics resources. Nat Protoc. 2009; 4:44–57. https://doi.org/10.1038/nprot.2008.211. [PubMed].
44. Huang DW, Sherman BT, Lempicki RA. Bioinformatics enrichment tools: paths toward the comprehensive functional analysis of large gene lists. Nucleic Acids Res. 2009; 37:1–13. https://doi.org/10.1093/nar/gkn923. [PubMed].
45. Perez-Riverol Y, Csordas A, Bai J, Bernal-Llinares M, Hewapathirana S, Kundu DJ, Inuganti A, Griss J, Mayer G, Eisenacher M, Pérez E, Uszkoreit J, Pfeuffer J, et al. The PRIDE database and related tools and resources in 2019: improving support for quantification data. Nucleic Acids Res. 2019; 47:D442–50. https://doi.org/10.1093/nar/gky1106. [PubMed].