
Introduction
It is well established that cancer is the result of accumulated genetic changes to tumor suppressor genes or oncogenes, and that these changes lead to uncontrolled cellular proliferation. This feature is important clinically, and many well established chemotherapeutic agents are designed to directly or indirectly inhibit DNA synthesis. Targeting the DNA is often effective, but has major disadvantages of toxicity due to non-specificity and predisposition to develop resistant clones. Cisplatin and carboplatin are two examples, often used in neoadjuvant and adjuvant chemotherapy regimens when treating patients with lung adenocarcinoma (LUAD). These reagents crosslink purine bases in DNA preventing replication and repair and promoting cell death. The choice to use them is made after careful initial assessment that takes into consideration risk factors, radiological appearance, tumor histology, and node involvement. Targeted therapies are now also available for several molecular classes of LUAD including EGFR mutation positive, ALK rearrangement positive, ROS1 rearrangement positive, BRAF V600E mutation positive, NTRK gene fusion positive, as well as anti-PD-L1 therapy [1].
Hypothetically, therapeutic reagents targeting DNA should be most effective for tumors that are highly proliferating and undergoing trans-lesion DNA synthesis. While uncontrolled replication can be initiated by changes involving cell cycle regulation, mitosis, and apoptosis among others, continued activity of genes in cellular proliferation is critical for the neoplastic state. This study focuses on genomic and transcriptional changes to proliferation genes across a LUAD cohort created by The Cancer Genome Atlas (TCGA) [2, 3], previously subtyped by them on the basis of copy number, DNA methylation, and mRNA expression. Selected genes coding for proteins involved in the pre-replication, pre-initiation, and replisome complexes were compared to evaluate the proliferation status of each of the subtypes. Since approximately 14% of the LUAD tumor cohort had Epidermal Growth Factor Receptor (EGFR) activation, and EGFR plays a known role in the replication of embryonic epidermal cells, it was included in the study as a LUAD proliferation factor.
The initial part of this study finds that subtype 2, 3, and 6 cases have highest expression of replication components and subtypes 1, 4, and 5 lowest; subtypes with highest expression have decreased survival. Evidence is presented that POLE and POLQ expression is elevated in subtype 2, and polymerase accessory subunits POLA2, POLD2, and POLE2 in subtypes 2 and 3. Comparing polymerase components across thirty-seven tumor types revealed a common subset with elevated transcriptional pattern typified by POLE2 and POLQ that included EXO1, MCM10, GINS2, CDT1, ORC6L, and BLM. Subtype 1 cases had increased expression of POLI, POLK, and POLL.
The second part of this study unexpectedly found that levels of EGFR expression overall were inversely proportional to the expression levels of multiple other important proliferation factors across the TCGA LUAD cohort. The same inverse relationship was found when examining EGFR expression in colon adenocarcinoma (COAD) and a cohort of cancer cell lines across several tissue types, but not in breast cancer (BRCA) or glioblastoma (GBB). To better understand the molecular process of EGFR activated LUAD, a search was made for genes altered in at least 50% of the activated cases. Twenty-one genes met the criterion, fifteen of which were found on the short arm of chromosome 7 proximal to EGFR. They included YKT6, MCPH1, UBE2D4, TP53, WIPI2, NUDCD3, PBXIP1, KLHL7, MRM2, HERPUD2, RNF216, FBXO42, FAM220A, URGCP, ZNF12, USP42, EXOC3, C7ORF26, VOPP1, ZDHHC4, and CLPTM1L.
Among the group CLPTM1L, PBXIP1, and URGCP like EGFR while showing increased expression over the EGFR cohort, inversely correlated with the expression of multiple key replication proteins over total LUAD. YKT6, KLHL7, FAM220A, and VOPP1 also had increased expression over the EGFR cohort but directly correlated with high expression of multiple proliferation genes. Altered cellular processes occurring with EGFR activation included increased PI3K/AKT/mTOR signaling and autophagy, cytokinesis and apoptosis impairment, exosome production, cytoskeletal changes, and multiple changes to proteins of the plasma membrane.
Results
Differential expression and overall survival
The status of forty genes known to be involved in cellular proliferation was examined for genomic mutations and changes in expression over the LUAD tumor cohort (Figure 1) (Table 1). Alterations are presented in the context of six LUAD subtypes defined by cluster analysis based on copy number, DNA methylation, and mRNA expression (Figure 2A) [4]. Expression values in this image were calculated by cBioPortal [5, 6], which uses the value of the diploid fraction of the LUAD cohort as an estimated normal reference.
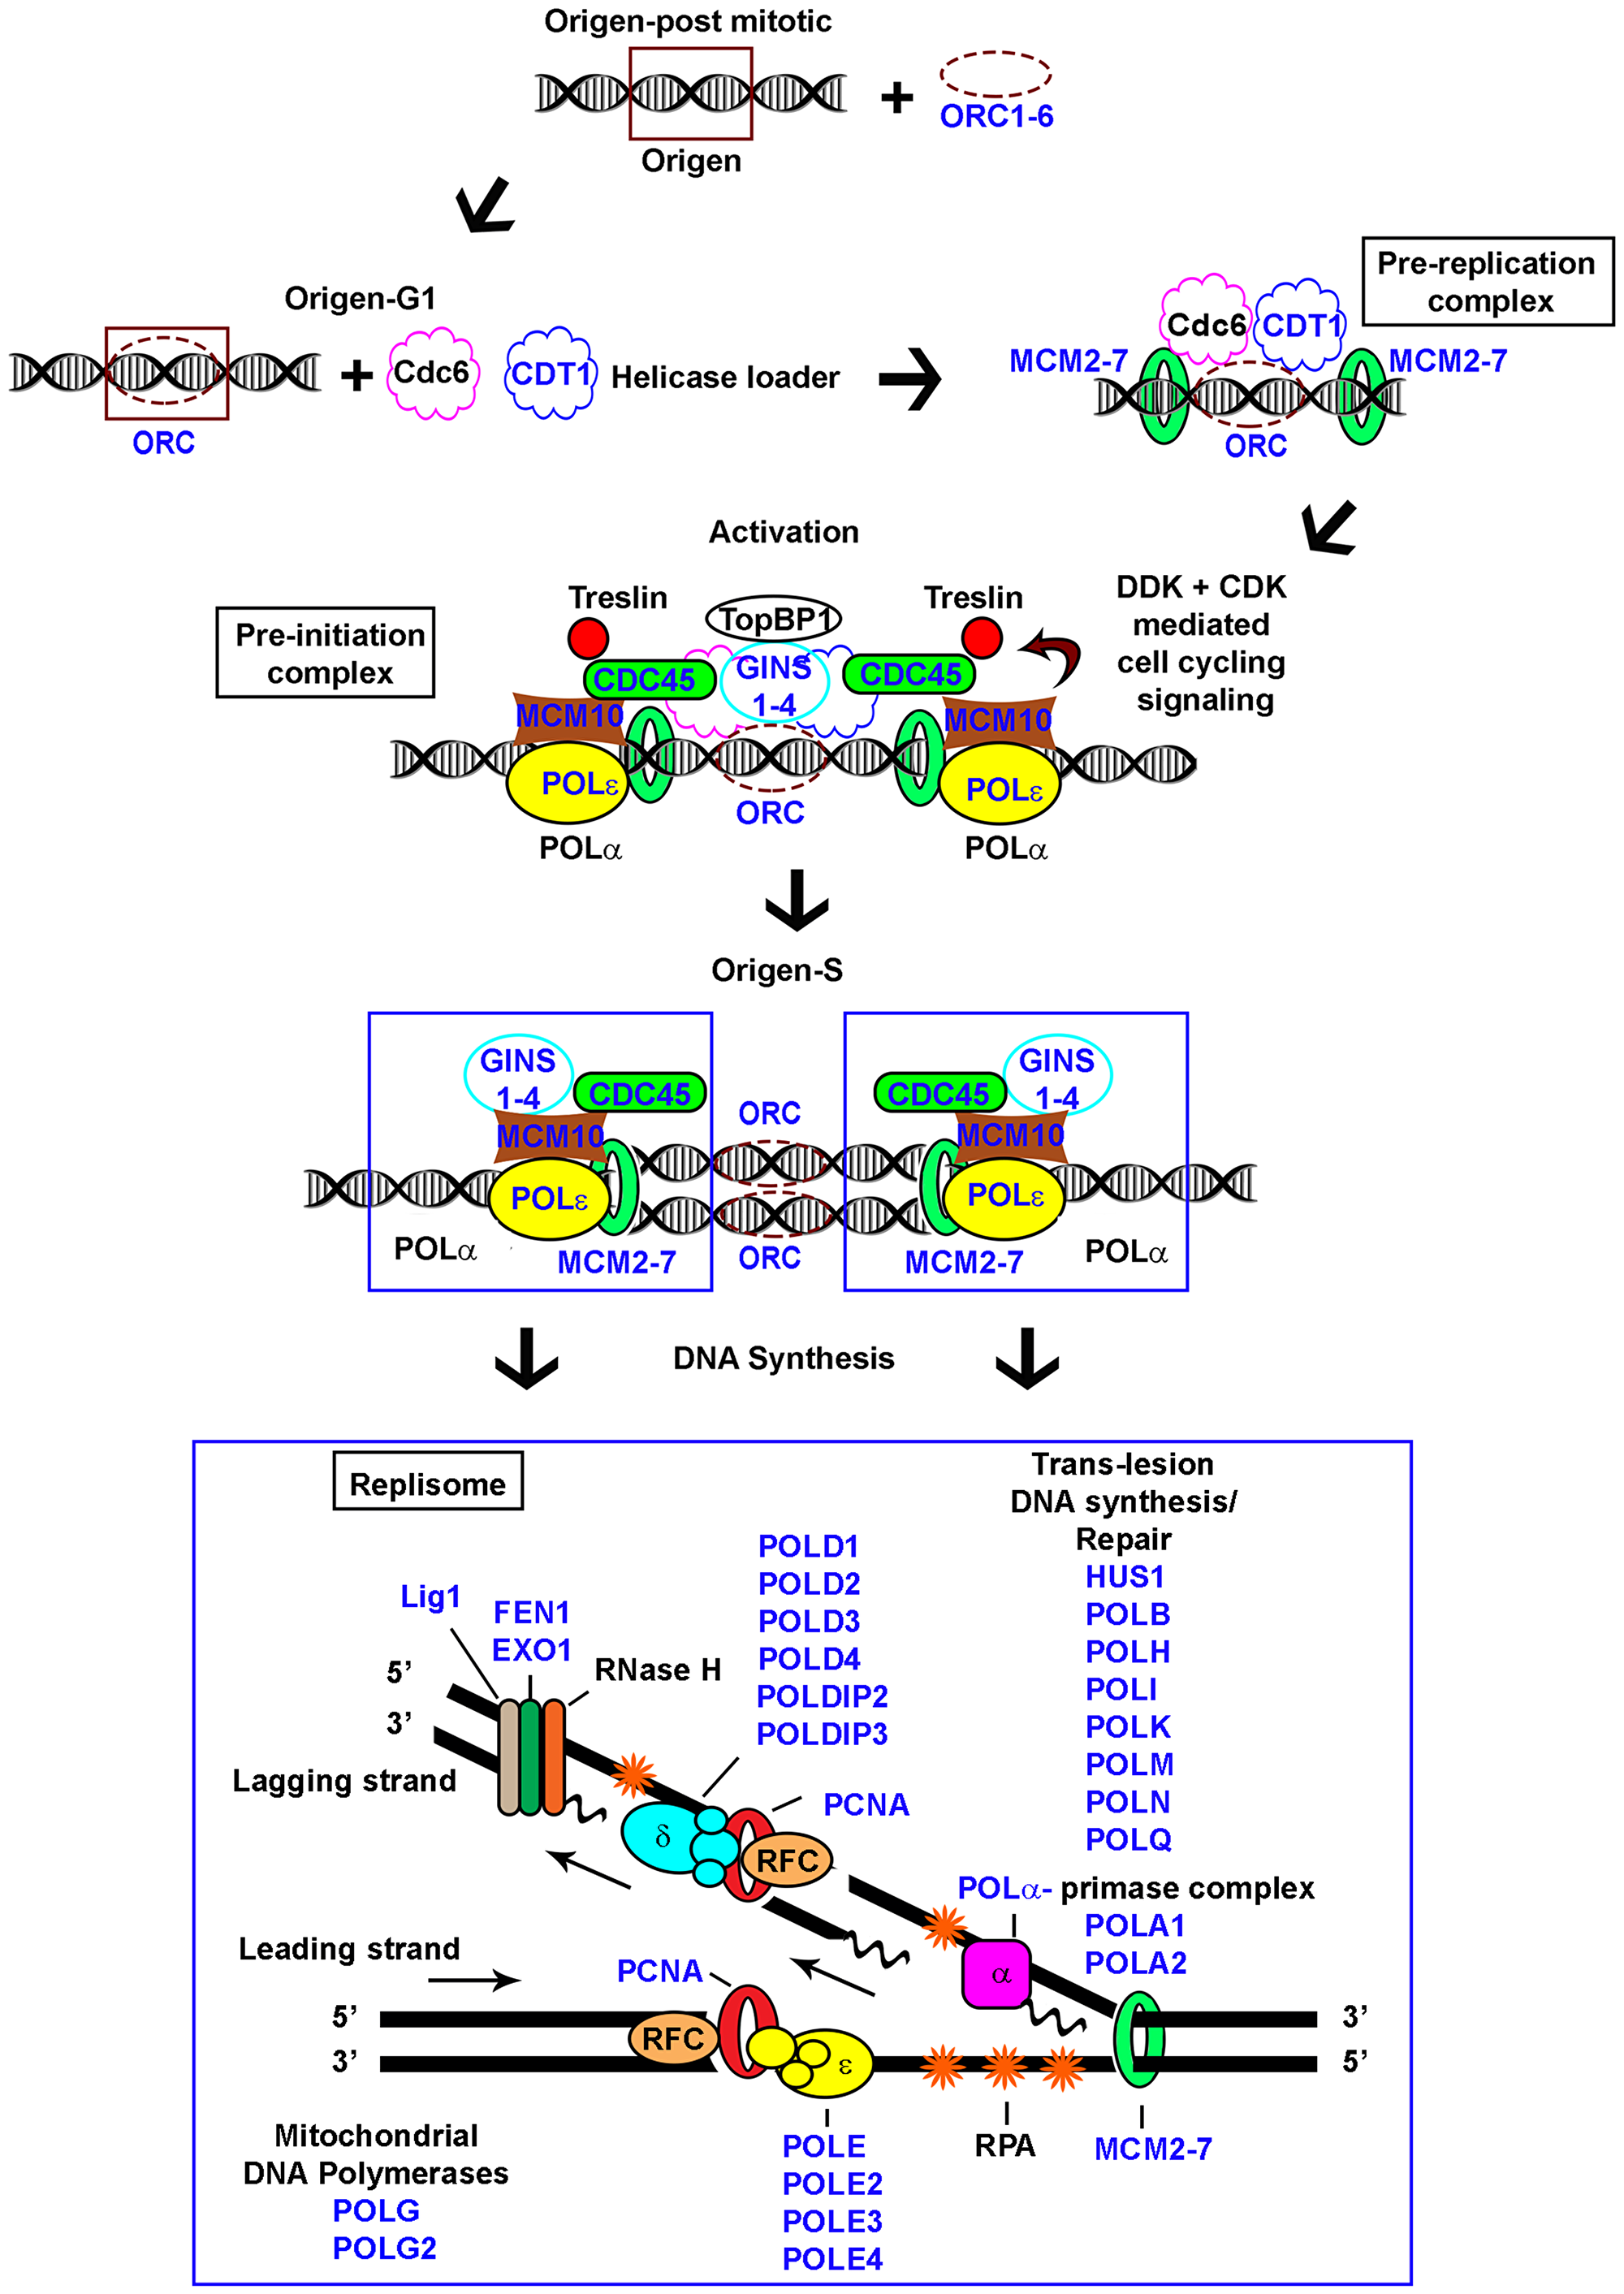
Figure 1: Schematic representation of eukaryotic replication. Pre-replication, pre-initiation, and replisome complexes depicted; genes examined in the study indicated (blue).
Table 1: Selected genes associated with DNA replication
| Gene | Description | Location |
|---|---|---|
| CDC45 | Cell Division Cycle 45 | 22q11.21 |
| EGFR | Epidermal Growth Factor Receptor | 7p11.2 |
| EXO1 | Exonuclease 1 | 1q43 |
| FEN1 | Flap Structure-Specific Endonuclease 1 | 11q12.2 |
| GINS1 | GINS Complex Subunit 1 | 20p11.21 |
| GINS2 | GINS Complex Subunit 2 | 16q24.1 |
| GINS3 | GINS Complex Subunit 3 | 16q21 |
| GINS4 | GINS Complex Subunit 4 | 8p11.21 |
| HUS1 | HUS1 Checkpoint Clamp Component | 7p12.3 |
| LIG1 | DNA Ligase 1 | 19q13.33 |
| MCM2 | Minichromosome Maintenance Complex Component 2 | 3q21.3 |
| MCM3 | Minichromosome Maintenance Complex Component 3 | 6p12.2 |
| MCM4 | Minichromosome Maintenance Complex Component 4 | 8q11.21 |
| MCM5 | Minichromosome Maintenance Complex Component 5 | 22q12.3 |
| MCM6 | Minichromosome Maintenance Complex Component 6 | 2q21.3 |
| MCM7 | Minichromosome Maintenance Complex Component 7 | 7q22.1 |
| MCM10 | Minichromosome Maintenance Replication Initiation Factor | 10p13 |
| PCNA | Proliferating Cell Nuclear Antigen | 20p12.3 |
| POLA1 | DNA Polymerase Alpha 1, Catalytic Subunit | Xp22.11-p21.3 |
| POLA2 | DNA Polymerase Alpha 2, Accessory Subunit | 11q13.1 |
| POLB | DNA Polymerase Beta | 8p11.21 |
| POLD1 | DNA Polymerase Delta 1, Catalytic Subunit | 19q13.33 |
| POLD2 | DNA Polymerase Delta 2, Accessory Subunit | 7p13 |
| POLD3 | DNA Polymerase Delta 3, Accessory Subunit | 11q13.4 |
| POLD4 | DNA Polymerase Delta 4, Accessory Subunit | 11q13.2 |
| POLDIP2 | DNA Polymerase Delta Interacting Protein 2 | 17q11.2 |
| POLDIP3 | DNA Polymerase Delta Interacting Protein 3 | 22q13.2 |
| POLE | DNA Polymerase Epsilon, Catalytic Subunit | 12q24.33 |
| POLE2 | DNA Polymerase Epsilon 2, Accessory Subunit | 14q21.3 |
| POLE3 | DNA Polymerase Epsilon 3, Accessory Subunit | 9q32 |
| POLE4 | DNA Polymerase Epsilon 4, Accessory Subunit | 2p12 |
| POLG | DNA Polymerase Gamma, Catalytic Subunit | 15q26.1 |
| POLG2 | DNA Polymerase Gamma 2, Accessory Subunit | 17q23.3 |
| POLH | DNA Polymerase Eta | 6p21.1 |
| POLI | Poly(ADP-Ribose) Polymerase 1 | 18q21.2 |
| POLK | DNA Polymerase Kappa | 5q13.3 |
| POLL | DNA Polymerase Lambda | 10q24.32 |
| POLM | DNA Polymerase Mu | 7p13 |
| POLN | DNA Polymerase Nu | 4p16.3 |
| POLQ | DNA Polymerase Theta | 3q13.33 |
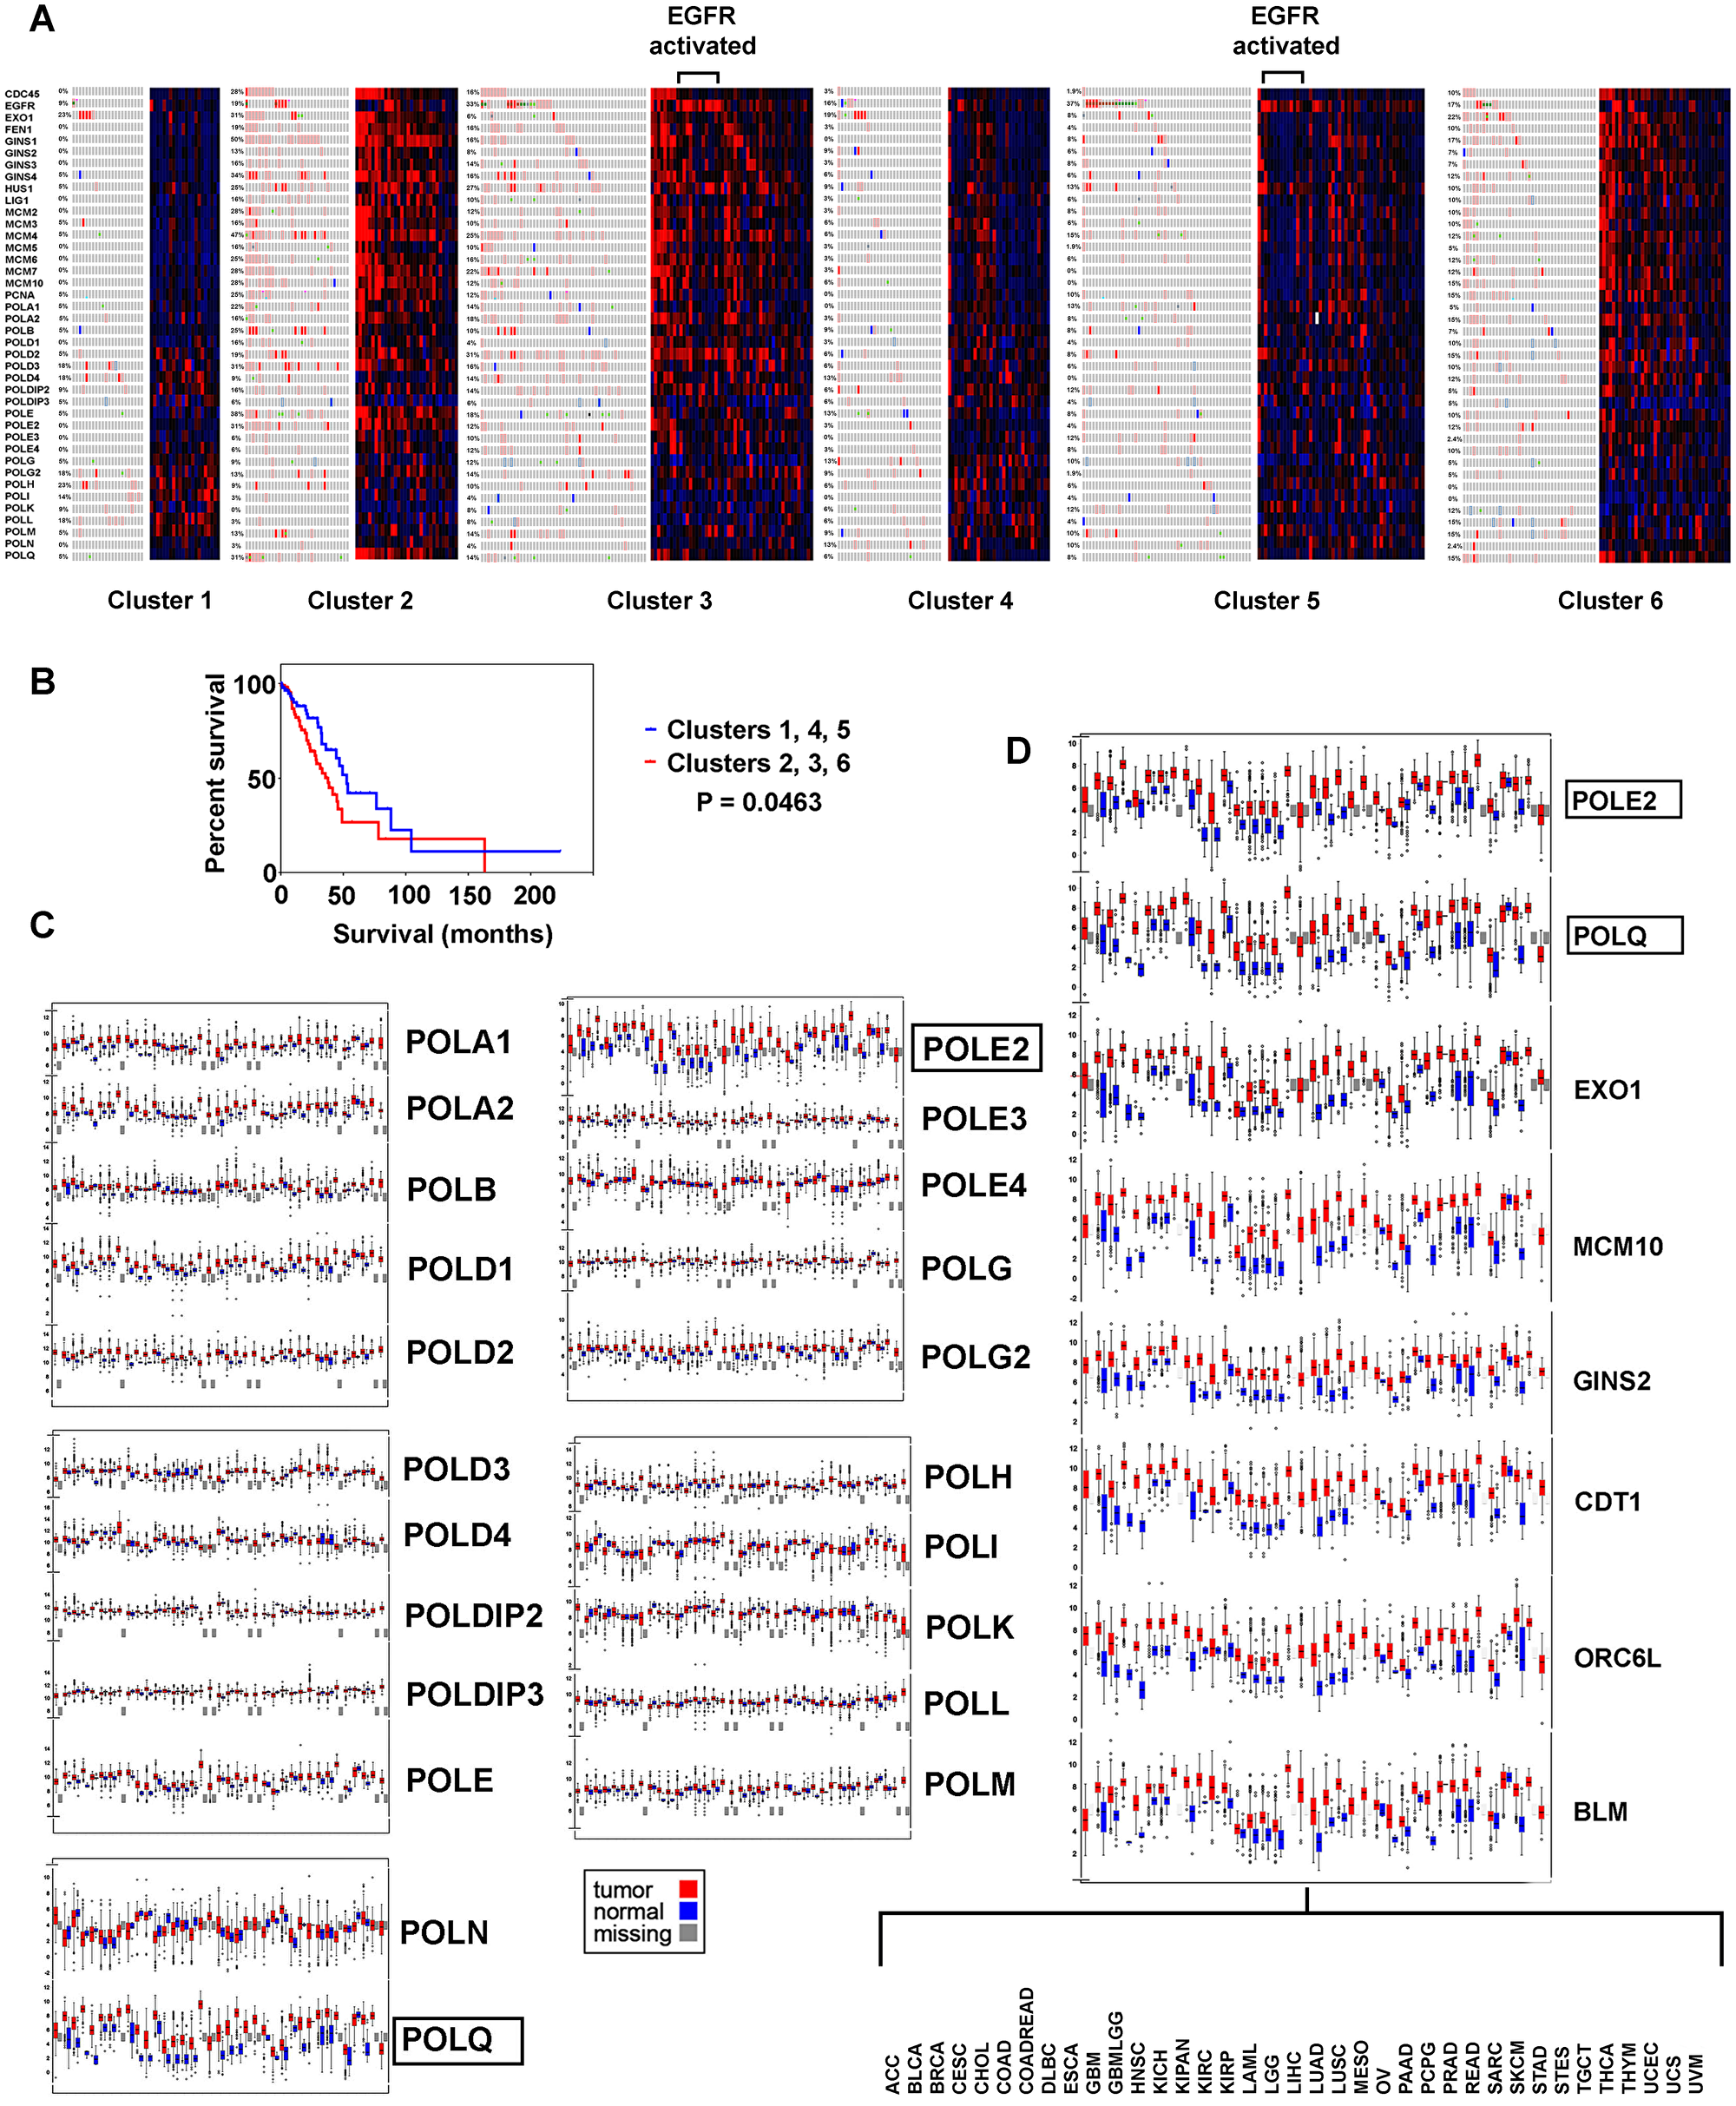
Figure 2: Replication genes examined for genomic and transcriptomic alteration in the context of LUAD subtypes, with survival analysis. (A) Cluster analysis is based on copy number, DNA methylation, and mRNA expression ([2, 3]), tumors with EGFR kinase activation are indicated. (B) Kaplan Meier survival plot, high versus low proliferating clusters. (C) Differential expression of polymerase components in thirty seven tumor types. (D) Replication genes found with common increased expression, thirty seven tumors.
LUAD subtypes with highest differential expression of replication factors (clusters 2, 3, and 6) versus lowest expression (clusters 1, 4, and 5) had decreased survival in Kaplan Meier survival plots (P = 0.0463) (Figure 2B). The most prominent feature between the groups is over expression of pre-replication and pre-initiation complex components and POLQ with relative under expression of POLI, POLK, POLL, and POLM in clusters 2, 3, and 6 implying these clusters have more “licensing”, origin firing and micro-homology end-joining. Subtypes 1, 4, and 5 had increased expression of POLH, POLI, POLK, and POLL, and POLM polymerases involved in trans-lesion DNA synthesis, double stranded break repair, and abasic site repair, suggesting the ability to carry out error prone DNA synthesis.
Bimodal distribution and survival
mRNA levels for the forty genes were also examined for bimodal distribution above and below the LUAD tumor cohort average. Data are presented in the context of functional replication complexes (Tables 2–6). Mini-Chromosome (MCM) helicase proteins contribute to the pre-replication, pre-initiation, and replisome complexes. Components MCM 2, 3, 4, 6, and 7 were expressed above average consistently in subtype 2, differing significantly from subtype 1, 4, 5, and 6 (Table 2). MCM5 expression also was above average in subtype 2, but differed significantly only with subtype 1. The pre-initiation complex components CDC45, GINS1, GINS2, GINS3, GINS4, and MCM10 were found above the tumor average in subtype 2, differing significantly from subtype 1, 4, 5, and 6. Decreased survival was observed in Kaplan Meier survival curves for cases with MCM 2, 4, and 5, CDC45, GINS1, and MCM10 expression above the tumor cohort average (Table 3), in agreement with the general concept that high expression of proliferation genes correlates with decreased survival.
Table 2: Bimodal expression of pre-replication and pre-initiation complex components in LUAD
| Gene | 1 n = 22 Above/Below Average (%/%) | 2 n = 32 | 3 n = 51 | 4 n = 32 | 5 n = 52 | 6 n = 41 | 2 vs 1 | 2 vs 3 | 2 vs 4 | 2 vs 5 | 2 vs 6 |
|---|---|---|---|---|---|---|---|---|---|---|---|
| Pre-Replication Complex | Fisher’s Exact (P value) | ||||||||||
| MCM2 | 4/18 (18/82) | 25/7 (78/22) | 31/20 (61/39) | 13/19 (41/59) | 20/32 (38/62) | 19/22 (46/54) | 0.000 | 0.148 | 0.005 | 0.001 | 0.008 |
| MCM3 | 6/16 (27/73) | 24/8 (75/25) | 26/25 (51/49) | 16/16 (50/50) | 21/31 (40/60) | 15/26 (37/63) | 0.001 | 0.039 | 0.070 | 0.003 | 0.002 |
| MCM4 | 4/18 (18/82) | 27/5 (84/16) | 35/16 (69/31) | 13/19 (41/59) | 17/35 (33/67) | 20/21 (49/51) | 0.000 | 0.127 | 0.001 | 0.000 | 0.003 |
| MCM5 | 4/18 (18/82) | 18/14 (56/44) | 30/21 (59/41) | 15/17 (47/53) | 20/32 (38/62) | 24/17 (59/41) | 0.010 | 0.824 | 0.617 | 0.122 | 1.000 |
| MCM6 | 4/18 (18/82) | 24/8 (75/25) | 37/14 (73/27) | 11/21 (34/66) | 22/30 (42/58) | 23/18 (56/44) | 0.000 | 1.000 | 0.002 | 0.006 | 0.139 |
| MCM7 | 5/17 (23/77) | 25/7 (78/22) | 32/19 (63/37) | 12/20 (38/62) | 16/36 (31/69) | 16/25 (39/61) | 0.000 | 0.155 | 0.002 | 0.000 | 0.001 |
| Pre-Initiation Complex | |||||||||||
| CDC45 | 4/18 (18/82) | 27/5 (84/16) | 35/16 (69/31) | 8/24 (25/75) | 14/38 (27/73) | 28/13 (68/32) | 0.000 | 0.127 | 0.000 | 0.000 | 0.171 |
| GINS1 | 2/20 (9/91) | 28/4 (88/12) | 32/19 (63/37) | 8/24 (25/75) | 22/30 (42/58) | 27/14 (66/34) | 0.000 | 0.022 | 0.000 | 0.000 | 0.054 |
| GINS2 | 5/17 (23/77) | 24/8 (75/25) | 35/16 (69/31) | 10/22 (31/69) | 23/29 (44/56) | 20/21 (49/51) | 0.000 | 0.623 | 0.001 | 0.007 | 0.031 |
| GINS3 | 3/19 (14/86) | 21/11 (66/34) | 28/23 (55/45) | 10/22 (31/69) | 22/30 (42/58) | 22/19 (54/46) | 0.000 | 0.368 | 0.012 | 0.045 | 0.345 |
| GINS4 | 2/20 (9/91) | 28/4 (88/12) | 29/22 (57/43) | 6/26 (19/81) | 15/37 (29/71) | 18/23 (44/56) | 0.000 | 0.672 | 0.000 | 0.000 | 0.000 |
| MCM10 | 3/19 (14/86) | 28/4 (88/12) | 33/18 (65/35) | 8/24 (25/75) | 15/37 (29/71) | 25/16 (61/39) | 0.000 | 0.024 | 0.000 | 0.000 | 0.017 |
Table 3: Bimodal survival for pre-replication and pre-initiation complex components
| Gene | Total Above Average | Total Below Average | Kaplan Meier Worse Survival | Log-rank |
|---|---|---|---|---|
| Pre-Replication Complex | ||||
| MCM2 | 94 | 109 | Above | 0.031 |
| MCM3 | 92 | 111 | NA | 0.215 |
| MCM4 | 99 | 104 | Above | 0.015 |
| MCM5 | 94 | 109 | Above | 0.004 |
| MCM6 | 103 | 100 | NA | 0.070 |
| MCM7 | 89 | 114 | NA | 0.129 |
| Pre-Initiation Complex | ||||
| CDC45 | 96 | 107 | Above | 0.011 |
| GINS1 | 100 | 103 | Above | 0.013 |
| GINS2 | 99 | 104 | NA | 0.207 |
| GINS3 | 90 | 113 | NA | 0.132 |
| GINS4 | 84 | 119 | NA | 0.146 |
| MCM10 | 93 | 110 | Above | 0.039 |
Table 4: Bimodal expression of replisome factors
| Gene | 1 n = 22 Above/Below Average (%/%) | 2 n = 32 | 3 n = 51 | 4 n = 32 | 5 n = 52 | 6 n = 41 | 2 vs 1 | 2 vs 3 | 2 vs 4 | 2 vs 5 | 2 vs 6 |
| Pre-Replication Complex | Fisher’s Exact (P value) | ||||||||||
| PCNA | 6/16 (27/73) | 24/8 (75/25) | 24/27 (47/53) | 10/22 (31/69) | 22/30 (42/58) | 21/20 (51/49) | 0.001 | 0.014 | 0.001 | 0.006 | 0.053 |
| FEN1 | 5/17 (23/77) | 27/5 (84/16) | 31/20 (61/39) | 11/21 (34/66) | 17/35 (33/67) | 21/20 (31/49) | 0.000 | 0.028 | 0.000 | 0.000 | 0.006 |
| EXO1 | 5/17 (23/77) | 26/6 (81/19) | 34/17 (67/33) | 11/21 (34/66) | 17/35 (33/67) | 26/15 (63/37) | 0.000 | 0.209 | 0.029 | 0.000 | 0.121 |
| LIG1 | 7/15 (32/68) | 22/10 (69/31) | 31/20 (61/39) | 16/16 (50/50) | 25/27 (48/52) | 20/21 (49/51) | 0.012 | 0.491 | 0.202 | 0.074 | 0.10 |
| POLA1 | 7/15 (32/68) | 20/12 (63/38) | 27/24 (53/47) | 20/12 (63/38) | 29/23 (56/44) | 19/22 (46/54) | 0.051 | 0.500 | 1.000 | 0.650 | 0.238 |
| POLA2 | 3/19 (14/86) | 23/9 (72/28) | 32/19 (63/37) | 11/21 (34/66) | 15/37 (29/71) | 21/20 (51/49) | 0.000 | 0.478 | 0.005 | 0.000 | 0.094 |
| POLB | 2/20 (9/91) | 17/15 (53/47) | 28/23 (55/45) | 19/13 (59/41) | 19/33 (37/63) | 13/28 (32/68) | 0.001 | 1.000 | 0.801 | 0.175 | 0.093 |
| POLD1 | 6/16 (27/73) | 20/12 (63/37) | 35/16 (69/31) | 17/15 (53/47) | 23/29 (44/56) | 23/18 (56/44) | 0.014 | 0.636 | 0.613 | 0.120 | 0.64 |
| POLD2 | 9/13 (41/59) | 19/13 (59/41) | 40/11 (78/22) | 10/22 (31/69) | 16/36 (31/69) | 19/22 46/54) | 0.268 | 0.083 | 0.044 | 0.013 | 0.347 |
| POLD3 | 10/12 (45/55) | 24/8 (75/25) | 21/30 (41/59) | 17/15 (53/47) | 27/25 (52/48) | 19/22 (46/54) | 0.044 | 0.003 | 0.117 | 0.041 | 0.017 |
| POLD4 | 15/7 (68/32) | 10/22 (31/69) | 29/22 (57/43) | 14/18 (44/56) | 18/34 (35/65) | 23/18 (56/44) | 0.012 | 0.026 | 0.439 | 0.815 | 0.058 |
| POLDIP2 | 15/7 (68/32) | 19/13 (59/41) | 29/22 (57/43) | 15/17 (47/53) | 19/33 (37/63) | 15/26 (37/63) | 0.576 | 1.000 | 0.453 | 0.046 | 0.062 |
| POLDIP3 | 14/8 (64/36) | 17/15 (53/47) | 27/24 (53/47) | 25/7 (78/22) | 33/19 (63/37) | 12/29 (29/71) | 0.577 | 1.000 | 0.064 | 0.257 | 0.054 |
| POLE | 10/12 (45/55) | 28/4 (88/13) | 28/23 (55/45) | 12/20 (38/63) | 25/27 (48/52) | 20/21 (49/51) | 0.002 | 0.002 | 0.000 | 0.000 | 0.001 |
| POLE2 | 4/18 (18/82) | 28/4 (88/13) | 44/7 (86/14) | 9/23 (28/72) | 14/38 (27/73) | 26/15 (63/37) | 0.000 | 1.000 | 0.000 | 0.000 | 0.031 |
| POLE3 | 7/15 (32/68) | 17/15 (53/47) | 29/22 (57/43) | 15/17 (47/53) | 25/27 (48/52) | 20/21 (49/51) | 1.000 | 0.822 | 0.803 | 0.823 | 0.815 |
| POLE4 | 8/14 (36/64) | 19/13 (59/41) | 24/27 (47/53) | 14/18 (44/56) | 18/34 (35/65) | 13/28 (32/68) | 0.166 | 0.367 | 0.317 | 0.041 | 0.032 |
| POLG | 16/6 (73/27) | 21/11 (66/34) | 25/26 (49/51) | 24/8 (75/25) | 27/25 (52/48) | 22/19 (54/46) | 0.767 | 0.176 | 0.585 | 0.261 | 0.345 |
| POLG2 | 10/12 (45/55) | 17/15 (53/47) | 35/16 (69/31) | 16/16 (50/50) | 21/31 (40/60) | 12/29 (29/71) | 0.782 | 0.170 | 1.000 | 0.270 | 0.054 |
| POLH | 12/10 (55/45) | 16/16 (50/50) | 27/24 (53/47) | 20/12 (63/38) | 31/21 (60/40) | 15/26 (37/63) | 0.787 | 0.825 | 0.450 | 0.498 | 0.218 |
| POLI | 19/3 (96/14) | 19/13 (59/41) | 22/29 (43/57) | 18/14 (56/44) | 22/30 (42/58) | 15/26 (37/63) | 0.039 | 0.180 | 1.000 | 0.178 | 0.062 |
| POLK | 14/8 (64/36) | 10/22 (31/69) | 24/27 (47/53) | 19/13 (59/41) | 34/18 (65/35) | 21/20 (51/49) | 0.027 | 0.176 | 0.044 | 0.003 | 0.101 |
| POLL | 19/13 (86/14) | 18/14 (56/44) | 20/31 (39/61) | 21/11 (66/34) | 28/24 (54/46) | 15/26 (37/63) | 0.035 | 0.175 | 0.609 | 1.000 | 0.105 |
| POLM | 16/6 (73/27) | 16/16 (50/50) | 24/27 (47/53) | 16/16 (50/50) | 25/27 (48/52) | 19/22 (46/54) | 0.158 | 0.825 | 1.000 | 1.000 | 0.816 |
| POLN | 5/17 (23/77) | 15/17 (47/53) | 17/34 (33/67) | 9/23 (28/72) | 23/29 (44/56) | 18/23 (44/56) | 0.091 | 0.252 | 0.196 | 0.825 | 0.817 |
| POLQ | 4/18 (18/82) | 23/9 (72/28) | 23/28 (45/55) | 6/26 (19/81) | 14/38 (27/73) | 22/19 (54/46) | 0.000 | 0.023 | 0.000 | 0.000 | 0.148 |
Table 5: Polymerase accessory subunits have high expression in subtypes 2 and 3
| Gene | 1 n = 22 Above/Below Average (%/%) | 2 n = 32 | 3 n = 51 | 4 n = 32 | 5 n = 52 | 6 n = 41 | 3 vs 1 | 3 vs 2 | 3 vs 4 | 3 vs 5 | 3 vs 6 |
|---|---|---|---|---|---|---|---|---|---|---|---|
| Pre-Replication Complex | Fisher’s Exact (P value) | ||||||||||
| POLA2 | 3/19 (14/86) | 23/9 (72/28) | 32/19 (63/37) | 11/21 (34/66) | 15/37 (29/71) | 21/20 (51/49) | 0.000 | 0.478 | 0.014 | 0.000 | 0.000 |
| POLD2 | 9/13 (41/59) | 19/13 (59/41) | 40/11 (78/22) | 10/22 (31/69) | 16/36 (31/69) | 19/22 (46/54) | 0.003 | 0.083 | 0.000 | 0.000 | 0.002 |
| POLE2 | 4/18 (18/82) | 28/4 (88/13) | 44/7 (86/14) | 9/23 (28/72) | 14/38 (27/73) | 26/15 (63/37) | 0.000 | 1.000 | 0.000 | 0.000 | 0.014 |
Table 6: Bimodal survival for replisome factors
| Gene | Total Cases Above Average | Total Cases Below Average | Kaplan Meier Worse Survival | Log-rank (Mantel-Cox) | Gehan-Breslow-Wilcoxon Worse Survival | Gehan-Breslow-Wilcoxon test |
|---|---|---|---|---|---|---|
| Replisome | ||||||
| PCNA | 103 | 92 | NA | 0.156 | Above | 0.028 |
| FEN1 | 90 | 105 | NA | 0.084 | Above | 0.020 |
| EXO1 | 96 | 99 | Above | 0.002 | Above | 0.003 |
| LIG1 | 99 | 96 | NA | 0.156 | Above | 0.028 |
| POLA1 | 100 | 95 | NA | 0.634 | NA | 0.273 |
| POLA2 | 82 | 113 | NA | 0.106 | Above | 0.038 |
| POLB | 81 | 114 | NA | 0.132 | NA | 0.391 |
| POLD1 | 103 | 92 | NA | 0.291 | NA | 0.067 |
| POLD2 | 93 | 102 | Above | 0.005 | Above | 0.002 |
| POLD3 | 99 | 96 | NA | 0.173 | Above | 0.020 |
| POLD4 | 89 | 106 | NA | 0.661 | NA | 0.721 |
| POLDIP2 | 90 | 105 | NA | 0.059 | NA | 0.242 |
| POLDIP3 | 103 | 92 | NA | 0.729 | NA | 0.638 |
| POLE | 97 | 98 | NA | 0.771 | NA | 0.270 |
| POLE2 | 92 | 103 | NA | 0.089 | Above | 0.036 |
| POLE3 | 88 | 107 | NA | 0.608 | NA | 0.250 |
| POLE4 | 76 | 119 | NA | 0.417 | NA | 0.506 |
| POLG | 110 | 85 | NA | 0.306 | NA | 0.512 |
| POLG2 | 92 | 103 | NA | 0.994 | NA | 0.996 |
| POLH | 103 | 92 | NA | 0.051 | NA | 0.285 |
| POLI | 99 | 96 | NA | 0.312 | NA | 0.991 |
| POLK | 103 | 92 | NA | 0.591 | NA | 0.386 |
| POLL | 101 | 94 | NA | 0.083 | NA | 0.428 |
| POLM | 97 | 98 | NA | 0.927 | NA | 0.477 |
| POLN | 73 | 122 | NA | 0.237 | Above | 0.046 |
| POLQ | 72 | 123 | NA | 0.097 | Above | 0.020 |
Replisome complexes duplicate DNA on leading and lagging strands (Figure 1). PCNA is a major component of this complex forming a sliding ring structure that attracts and tethers many other replicative proteins, Flap endonuclease (FEN1) is an integral component of lagging strand synthesis. PCNA and FEN1 expression were significantly above tumor average in subtype 2, as were EXO1 and LIG1 (Table 4). Examination of components comprising polymerases POLA, POLB, POLD, POLE, POLG, POLH, POLI, POLK, POLL, POLM, POLN, and POLQ showed POLE (catalytic subunit) expression elevated significantly in subtype 2 (Table 4); accessory subunits (POLA2, POLD2, and POLE2) were significantly elevated in subtypes 2 and 3, potentially signifying a function other than structural for their respective polymerase complexes in cancer (Table 5). POLQ expression was significantly elevated in subtype 2. Subtype 1 cases had increased expression of POLI, POLK, and POLL relative to subtype 2 (Table 4). Cases with POLD2 and EXO1 expression above the tumor average had decreased survival by Log-rank (Table 6). Applying Gehan-Breslow-Wilcoxon test indicated cases with FEN1, POLD3, POLQ, LIG1, PCNA, POLE2, POLA2, and POLN expression above the tumor average tended towards decreased survival.
Proliferation genes highly transcribed in cancer
A common pattern of increased expression for POLE2 and POLQ in LUAD were found across thirty-seven tumor types [7]. Searching for other proliferation genes resulted in finding EXO1, MCM10, GINS2, CDT1, ORC6L, and BLM had the same pattern indicating they are most likely necessarily highly transcribed in cancer (Figure 2C and 2D).
EGFR expression and proliferation
EGFR activated cases were found in multiple LUAD subtypes, with low differential expression of pre-replication, pre-initiation, and replisome complex factors (Figure 2A). Comparing EGFR and PCNA mRNA heatmaps (exonic level) side by side, suggested an inverse relationship from one subtype to the next (Figure 3A), an impression supported by cBioPortal differential expression data. These findings motivated arranging cases by PCNA mRNA expression (minimum to maximum), and interrogating other gene(s) expression relative to the curve. FEN1, POLD1, POLE2, POLQ, and MCM4, proteins that physically interact with PCNA or function close by, had expression curves in direct correlation to the DNA clamp. EGFR mRNA expression was inversely proportional to all (Figure 3B). PDGFRA (4q12), another cell surface tyrosine kinase receptor, similar to EGFR also had expression inversely correlated to the PCNA curve (data not shown). A Kaplan Meier survival plot comparing all cases with putative EGFR driver mutations to cases without EGFR alteration showed significant decreased survival for patients with putative driver mutations (Figure 3C) (Supplementary Table 1). Cases with EGFR missense mutations that were putative drivers did not cluster at any one point when arranged lowest to highest proliferation markers (Figure 3D) suggesting EGFR activation does not directly lead to increased proliferation in LUAD. This is supported by the fact that the twenty-eight EGFR tyrosine kinase activated cases also localize to the multiple LUAD subtypes predominantly 3, 5, and 6 (Figure 2A). Eight LUAD cases with distant metastasis tended towards higher placement on the PCNA proliferation curve, but not highest (Figure 3E); only one of these cases was also EGFR activated. Altogether, these results seem to support idea that the lethality in LUAD achieved through the EGFR activation pathway, and the lethality in LUAD achieved by increased levels proliferation are different mechanistically.
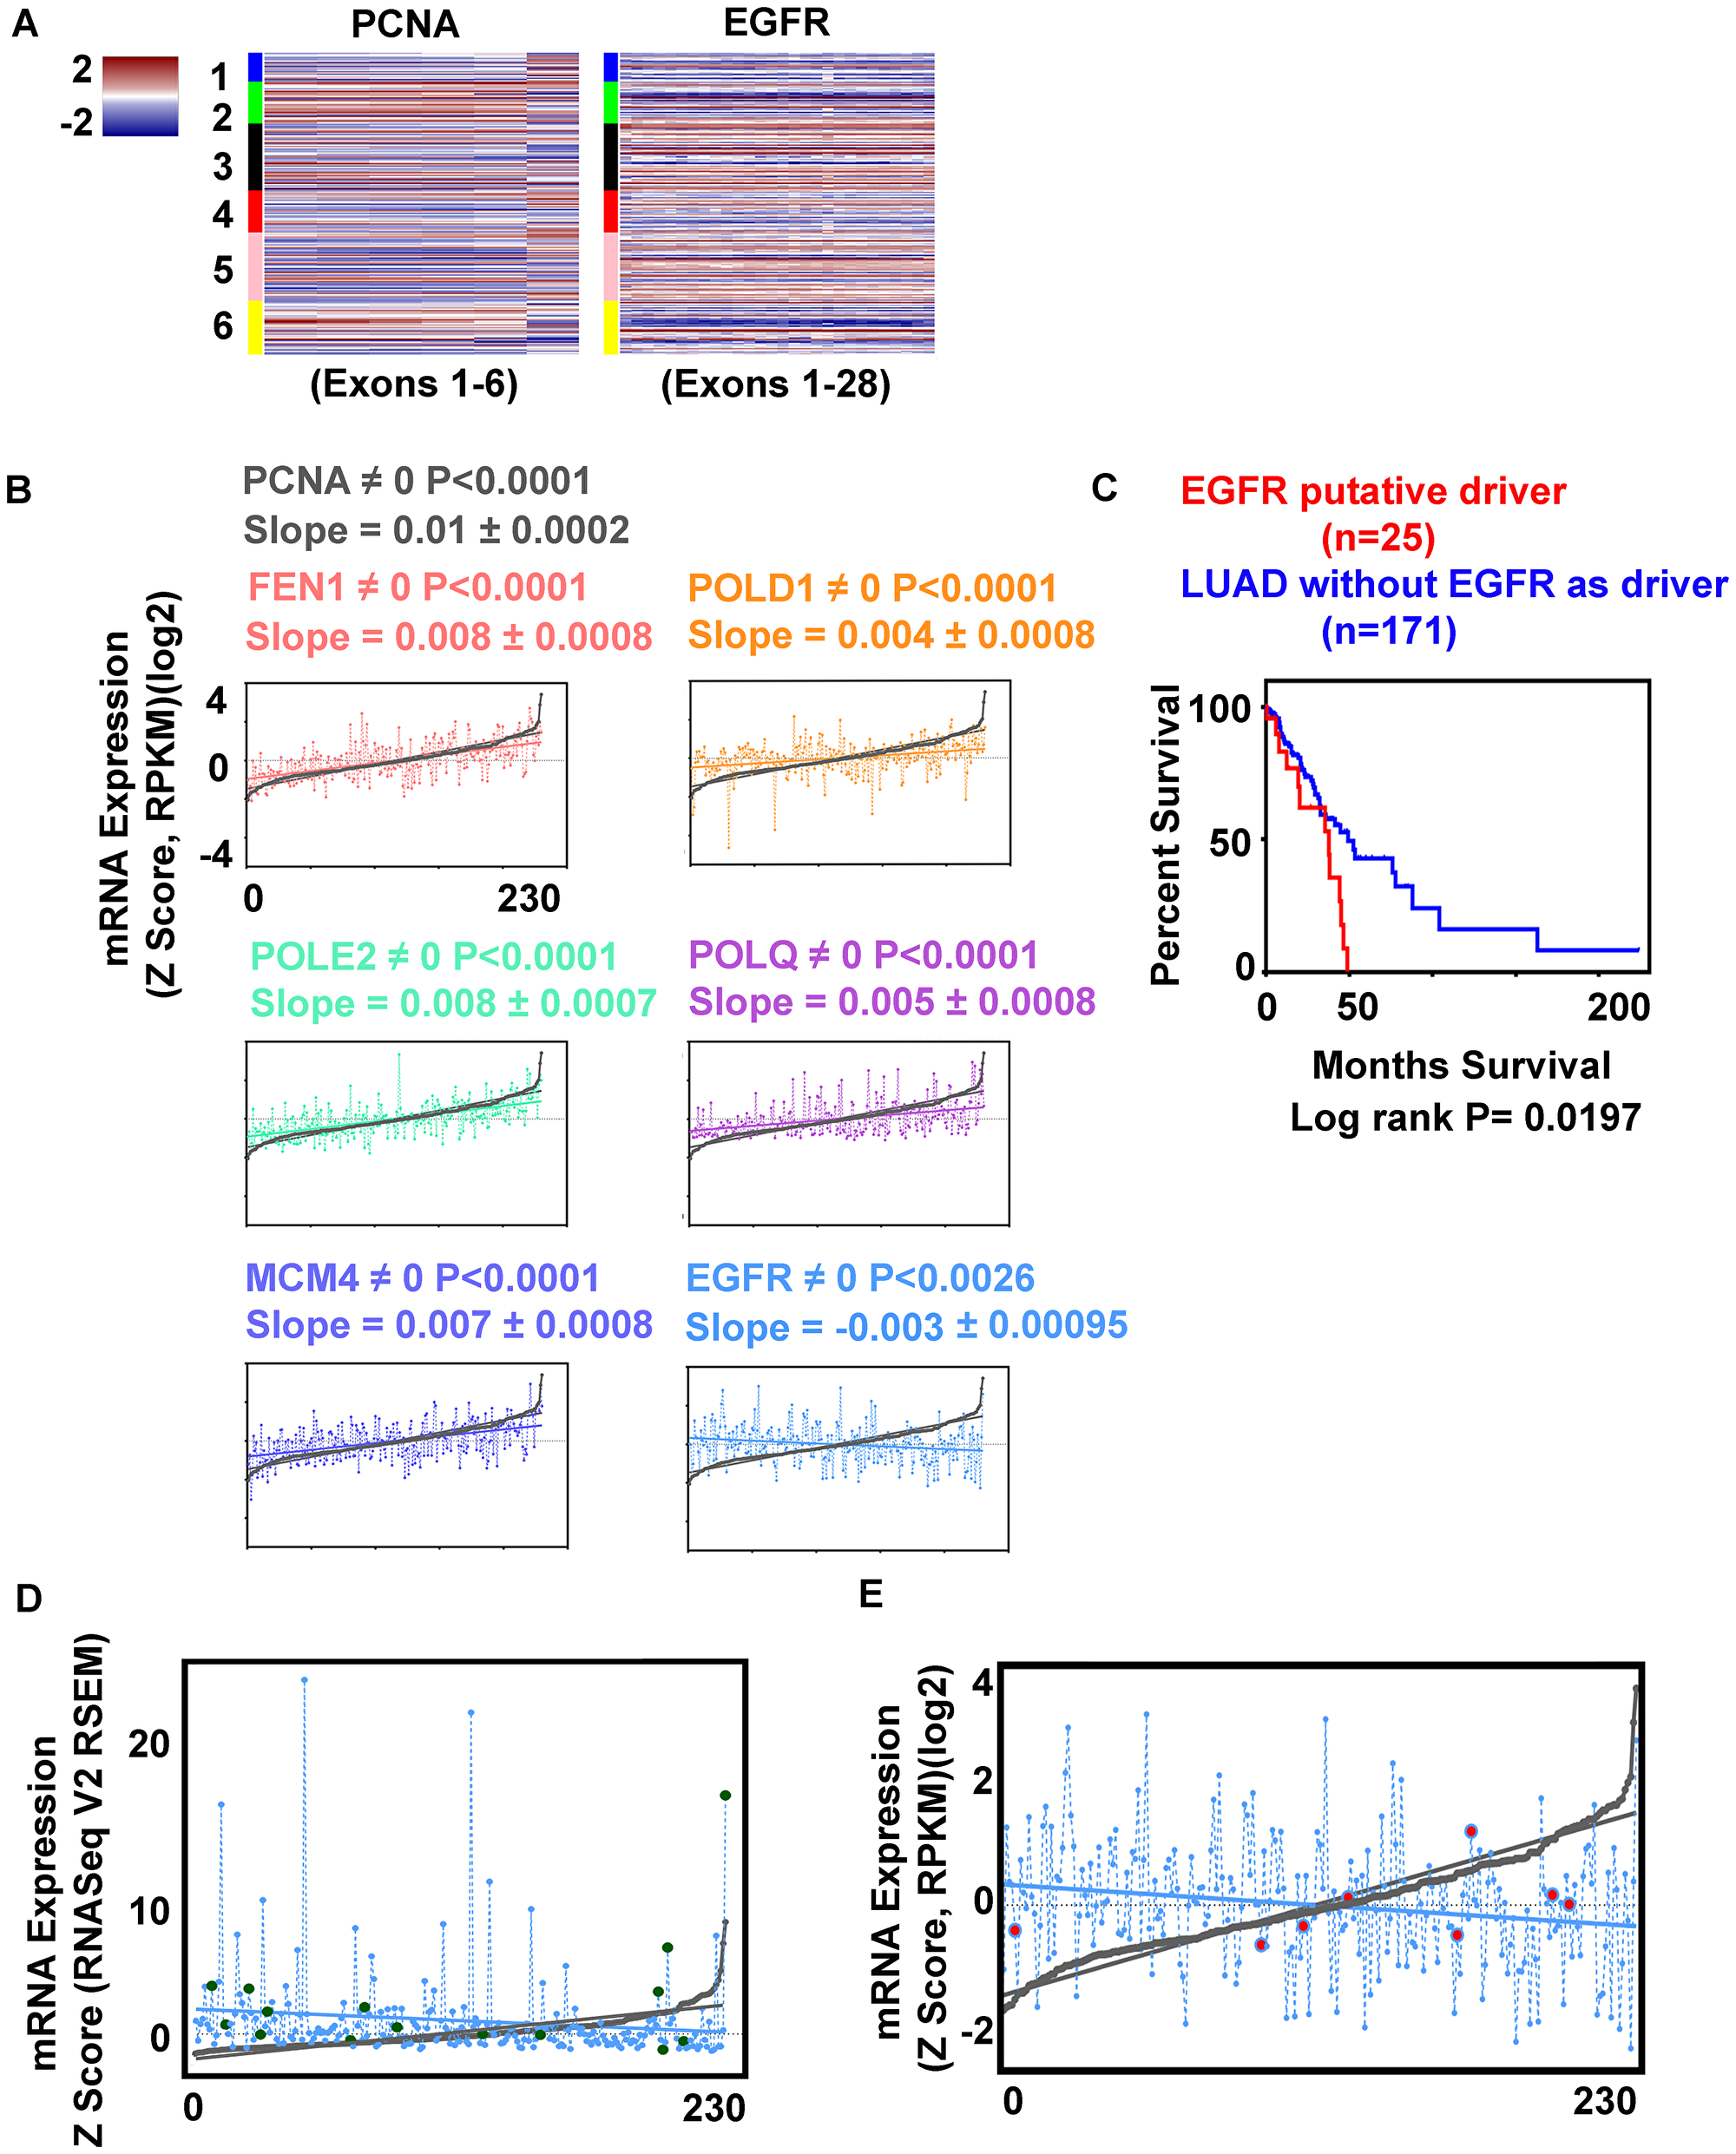
Figure 3: EGFR expression correlates inversely with replication genes expression. (A) Heatmaps comparing PCNA and EGFR mRNA expression for each exon, cases arranged in LUAD clusters (1–6). (B) Regression analysis. Cases arranged by PCNA mRNA minimum to maximum values, and compared to second gene expression; significance by P value. FEN1 (pink), POLD1 (orange), POLE2 (green), POLQ (magenta), MCM4 (purple), EGFR (blue). (C) Kaplan Meier survival plot, significance by Log rank test; LUAD with EGFR activated kinase (red) no activation (blue) (for case identification, see Supplementary Table 1). (D) Differential expression of EGFR (blue) missense mutations (green) (putative drivers, n = 15) compared to PCNA (min-max) curve (grey). (E) Relative expression of EGFR (blue) cases with distant metastasis (red) compared to PCNA curve (grey).
Examining the behavior of EGFR differential expression to proliferation markers in COAD, BRCA, GBB, and the Cancer Cell Line Encyclopedia (from the Broad Institute and Novartis, 877 samples) [8, 9] (Supplementary Table 2) permitted identification of the inverse relationship in COAD and in the cell lines, but not in GBB or BRCA (Figure 4A). GBB had higher EGFR expression levels overall compared to LUAD, COAD, BRCA, and the cell line cohort.
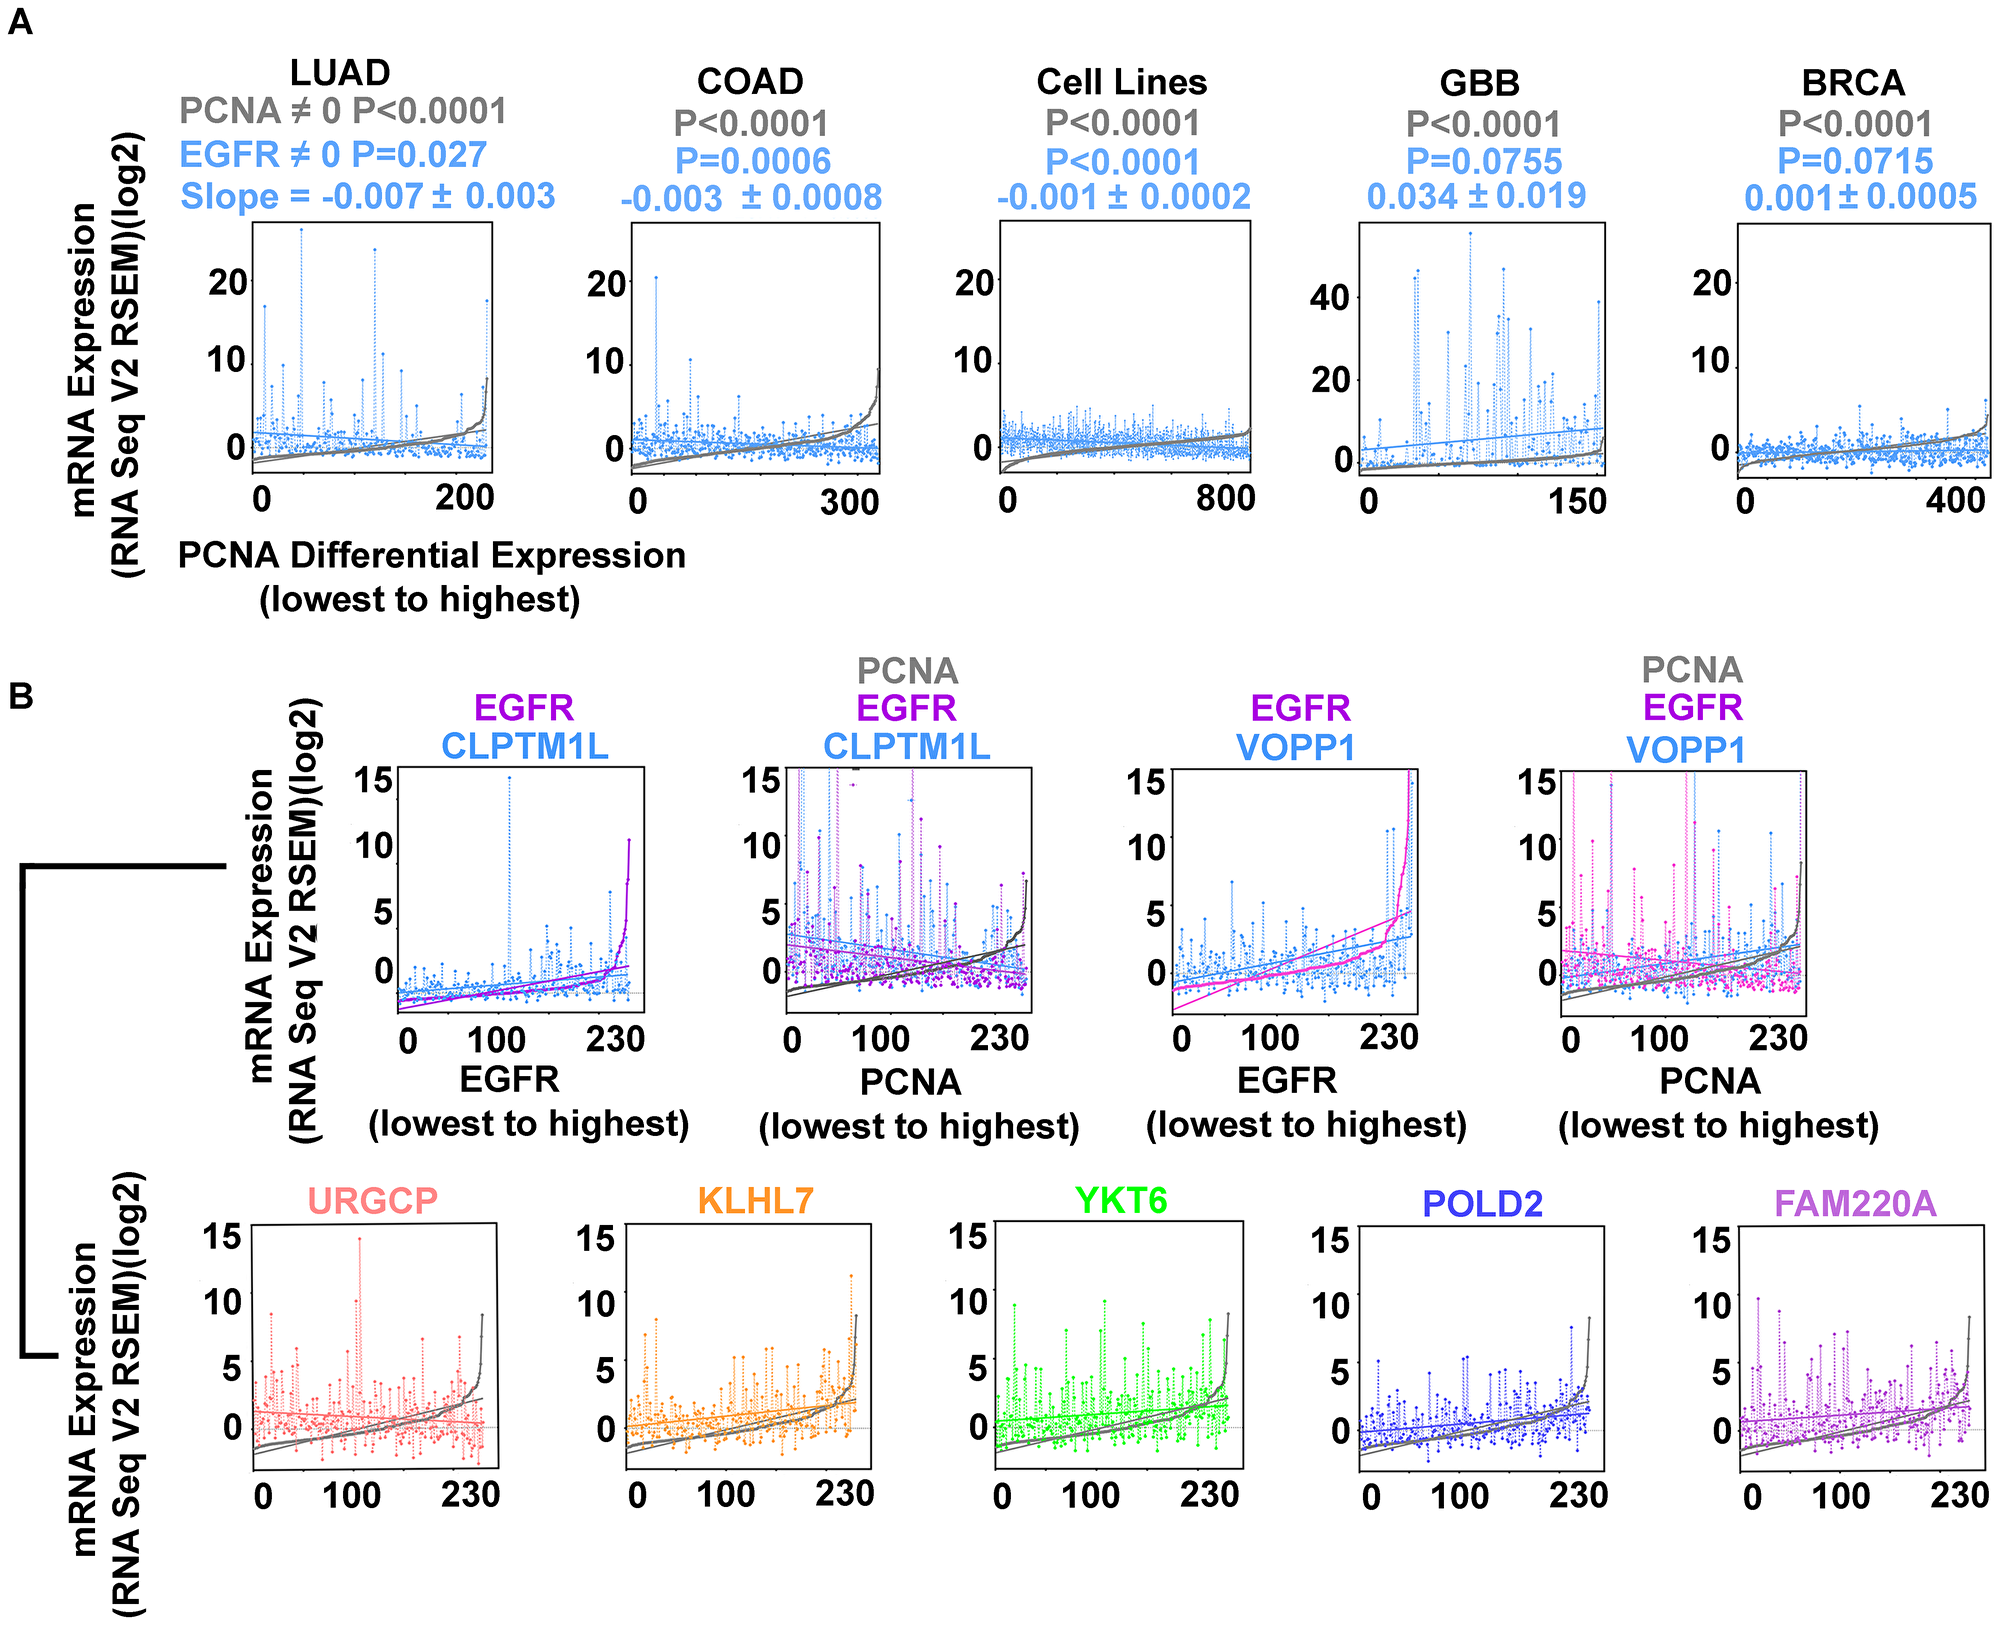
Figure 4: Inverse correlation of EGFR and PCNA expression are found in LUAD, COAD, and cell lines from multiple tumor types (Cancer Cell Line Encyclopedia; (CCLE); n = 877; Supplementary Table 2) but not in glioblastoma (GBB) or breast cancer (BRCA). (A) EGFR (blue) and PCNA (min-max) curve (grey); LUAD, COAD, CCLE cell lines, GBB, and BRCA. (B) EGFR overexpression accompanies secondary gene overexpression that can vary proportionally with proliferation. EGFR (magenta), CLPTM1L (blue) cases arranged by EGFR expression (min-max) illustrating direct proportion; EGFR (magenta) CLPTM1L (blue) and PCNA (grey) cases rearranged by PCNA expression (min-max) illustrating indirect proportion to proliferation. EGFR (magenta), VOPP1 (blue) arranged by EGFR expression (min-max); EGFR (magenta), VOPP1 (blue), and PCNA (grey) cases rearranged by PCNA expression (min-max) illustrating simultaneous VOPP1 direct proportion and EGFR indirect proportion to proliferation. URGCP (pink), KLHL7 (orange), YKT6 (green), POLD2 (purple), FAM220A (magenta), all arranged by PCNA expression (min-max) (grey).
Genes involved in EGFR activated cases
Twenty-one genes with genomic and expression alterations in at least 50% of EGFR tyrosine kinase activated cases were identified (Table 7). They were examined over LUAD subtypes 1-6, and in cases with distant metastases (Figure 5). Clusters 3 and 5 containing most of the EGFR tyrosine kinase activated cases were most similar, metastatic cases were less so. TP53 and MCPH1 both had low differential expression. TP53 had additional frequent genomic mutation (at DNA binding domain, 46.5%) MCPH1 did not (0.9%). MCPH1 expression was altered across the entire LUAD cohort (28%) including cases with increased expression. Mutual exclusivity testing for MCPH1 (low expression) and EGFR revealed they co-occurred significantly (P = 0.004). YKT6, UBE2D4, WIPI2, NUDCD3, PBXIP1, KLHL7, MRM2, HERPUD2, RNF216, FBXO42, FAM220A, URGCP, ZNF12, USP42, EXOC3, C7ORF26, VOPP1, ZDHHC4, and CLPTM1L were more highly expressed. Fifteen of these had cytological locations on the short arm of chromosome 7 (Table 7). The dysregulation of so many other genes proximal to EGFR’s cytological location suggests an epigenetic event affecting transcription as an early alteration in these tumors.
Table 7: Expression alterations in EGFR activated cases and their relationship to proliferation
| Gene | EGFR Cases (%) | Cytogenetic Band | Slope | +/– | P value (Slope ≠ 0) | Slope relative to PCNA |
|---|---|---|---|---|---|---|
| EGFR | 100 | 7p11.2 | –0.0074 | 0.003 | 0.027 | Negative |
| YKT6 | 50 | 7p13 | 0.0050 | 0.002 | 0.010 | Positive |
| MCPH1 | 50 | 8p23.1 | 0.0029 | 0.002 | 0.131 | None |
| UBE2D4 | 57 | 7p13 | 0.0014 | 0.002 | 0.425 | None |
| TP53 | 57 | 17p13.1 | –0.0003 | 0.001 | 0.668 | None |
| WIPI2 | 64 | 7p22.1 | –0.0011 | 0.002 | 0.593 | None |
| NUDCD3 | 64 | 7p13 | –0.0012 | 0.002 | 0.607 | None |
| PBXIP1 | 61 | 1q21.3 | –0.0129 | 0.002 | 0.000 | Negative |
| KLHL7 | 57 | 7p15.3 | 0.0077 | 0.002 | 0.000 | Positive |
| MRM2 | 57 | 7p22.3 | 0.0033 | 0.002 | 0.065 | None |
| HERPUD2 | 57 | 7p14.2 | 0.0019 | 0.002 | 0.326 | None |
| RNF216 | 54 | 7p22.1 | –0.0039 | 0.002 | 0.087 | None |
| FBXO42 | 54 | 1p36.13 | –0.0013 | 0.002 | 0.432 | None |
| FAM220A | 54 | 7p22.1 | 0.0045 | 0.002 | 0.023 | Positive |
| URGCP | 50 | 7p13 | –0.0043 | 0.002 | 0.029 | Negative |
| ZNF12 | 50 | 7p22.1 | –0.0029 | 0.002 | 0.087 | None |
| USP42 | 50 | 7p22.1 | –0.0014 | 0.002 | 0.451 | None |
| EXOC3 | 50 | 5p15.33 | –0.0040 | 0.004 | 0.353 | None |
| C7ORF26 | 50 | 7p22.1 | 0.0003 | 0.002 | 0.883 | None |
| VOPP1 | 50 | 7p11.2 | 0.0108 | 0.004 | 0.009 | Positive |
| ZDHHC4 | 50 | 7p22.1 | 0.0034 | 0.002 | 0.092 | None |
| CLPTM1L | 50 | 5p15.33 | –0.0114 | 0.003 | 0.000 | Negative |
| GLI3 | 39 | 7p14.1 | –0.0018 | 0.003 | 0.501 | None |
| GNA12 | 36 | 7p22.3-p22.2 | –0.0002 | 0.002 | 0.905 | None |
| HUS1 | 29 | 7p12.3 | 0.0012 | 0.001 | 0.381 | None |
| POLD2 | 29 | 7p13 | 0.0061 | 0.001 | 0.000 | Positive |
| POLM | 21 | 7p13 | –0.0007 | 0.001 | 0.610 | None |
| TWIST1 | 14 | 7p21.1 | 0.0021 | 0.001 | 0.052 | None |
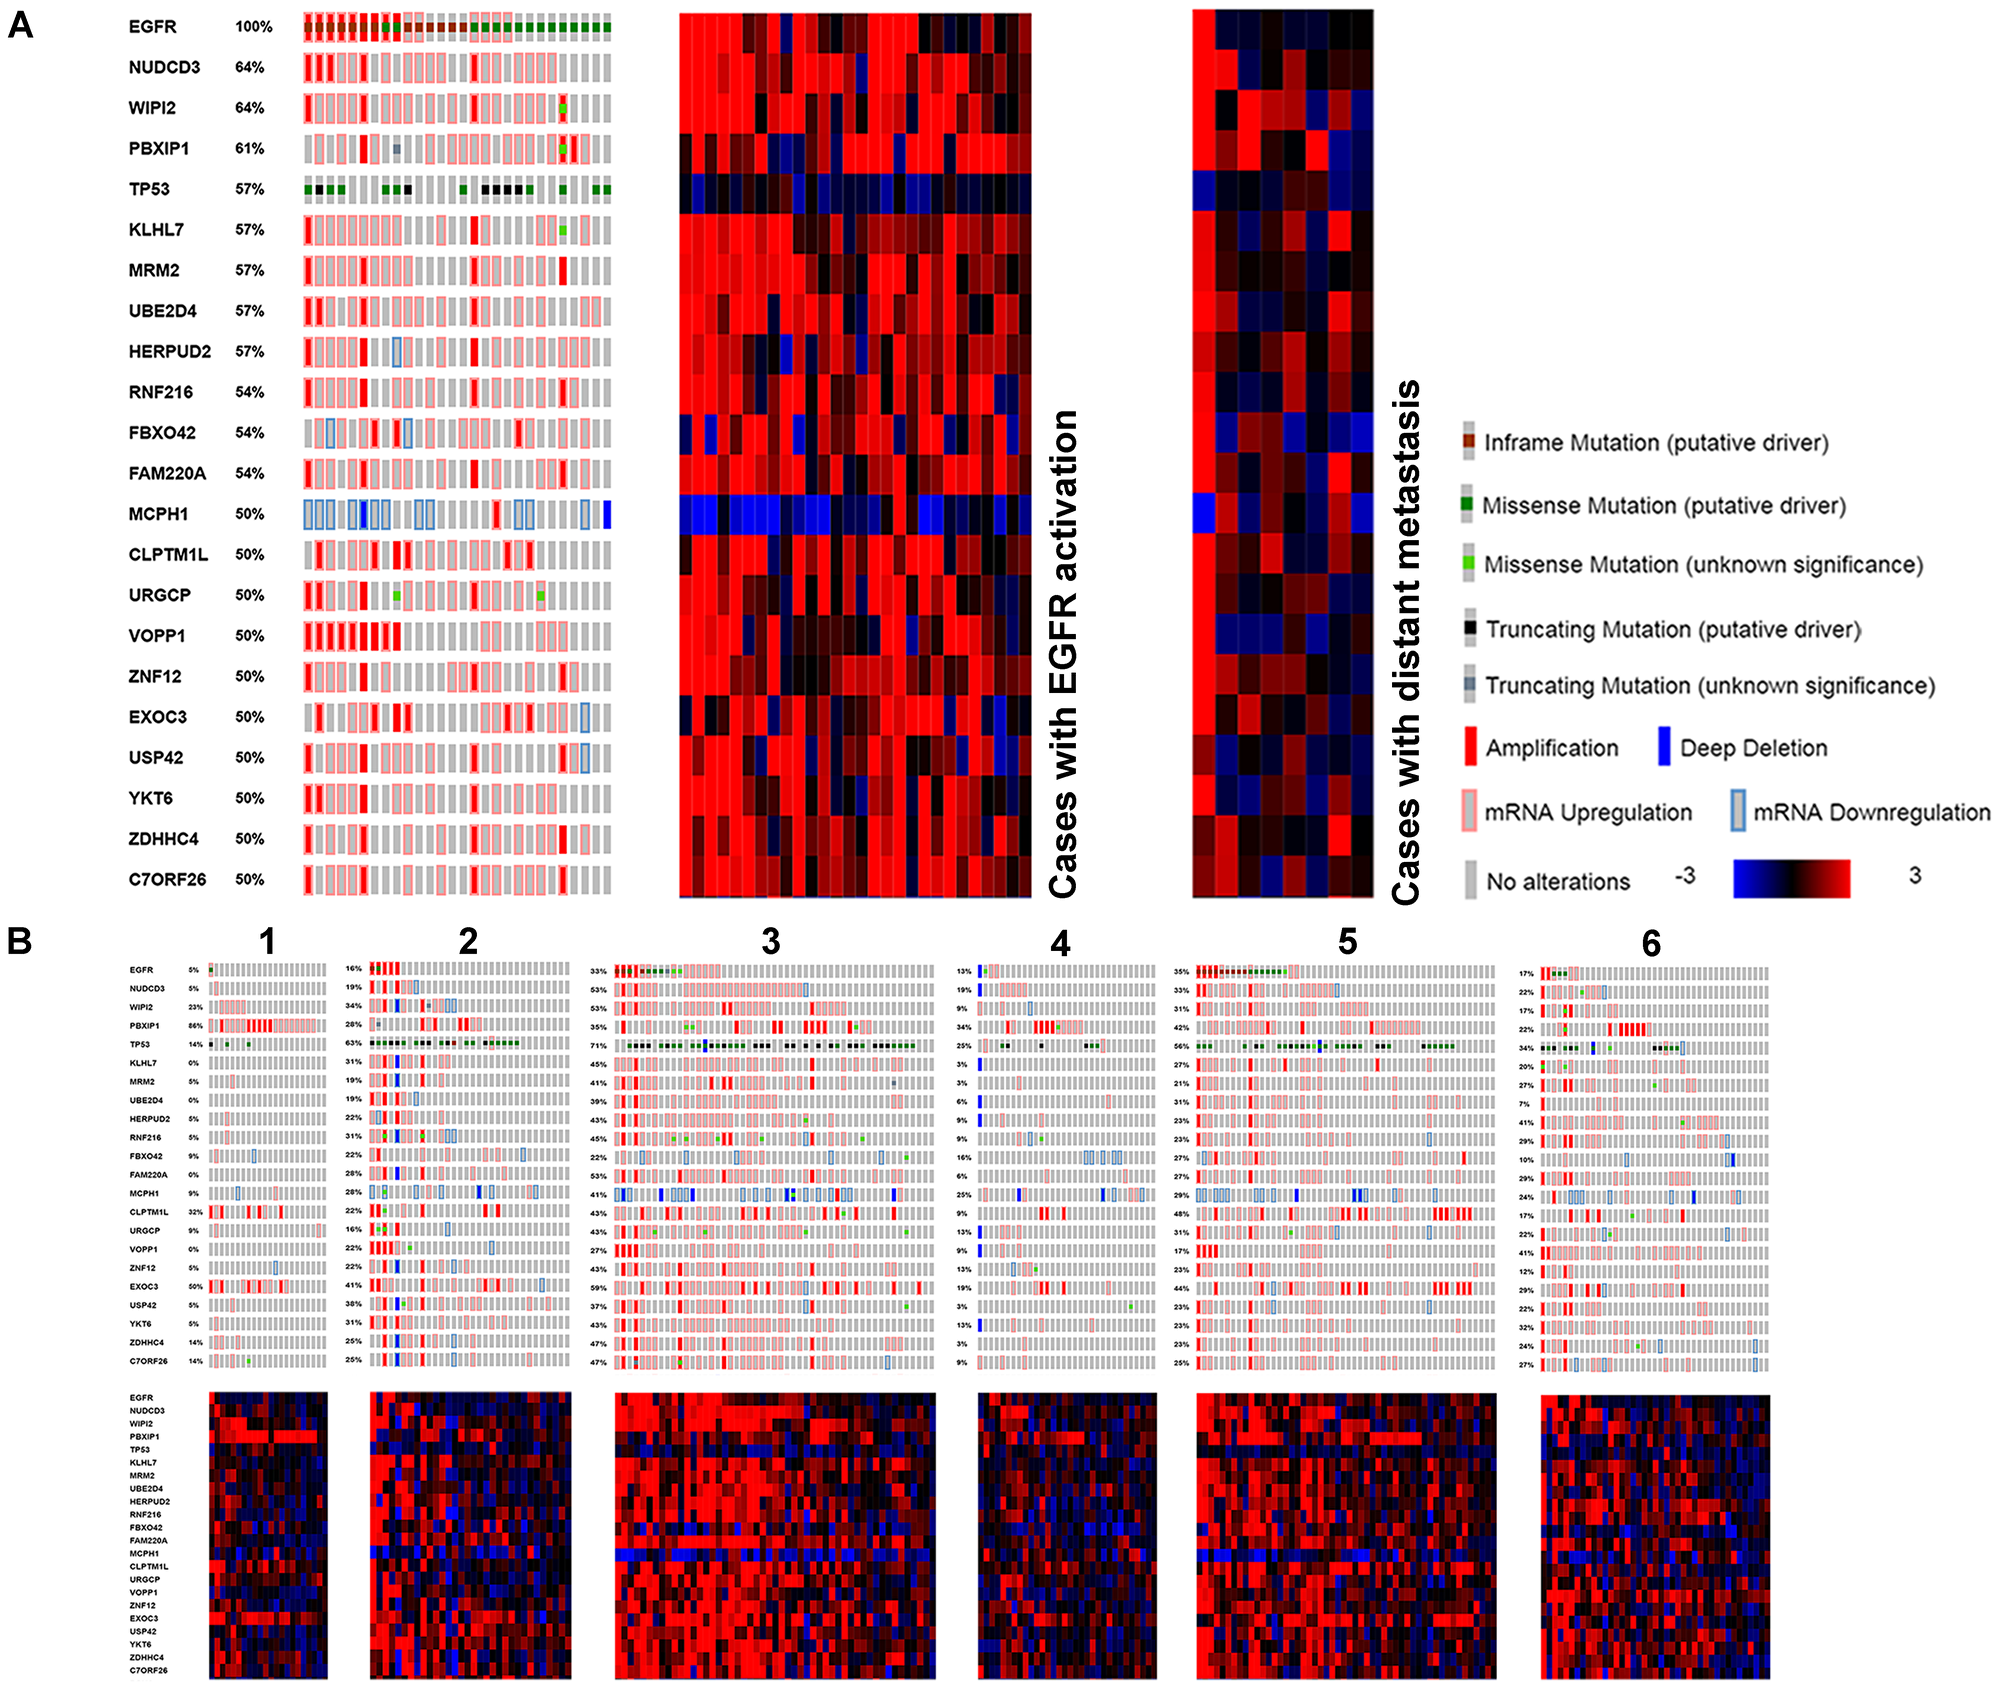
Figure 5: Genes found with genomic and transcriptomic alterations in EGFR activated LUAD, with high frequency. (A) Compared to cases with distant metastasis. (B) Compared to TCGA subtypes.
Genes involved in EGFR activated cases in relation to proliferation
Comparing EGFR relevant gene expression to the PCNA expression curve, URGCP, PBXIP1, and CLPTM1L have inverse relationships to proliferation, while VOPP1, YKT6, KLHL7, and FAM220A are direct (Table 7, Figure 4B). VOPP1 (also known as Vesicular, Overexpressed in cancer, Prosurvival Protein 1 or EGFR-Co-amplified and Overexpressed Protein) expression is shown first in relation to EGFR expression, then to PCNA expression. VOPP1 is overexpressed in the most highly proliferative cases, with lowest EGFR expression, the finding was confirmed in cBioPortal. CLPTM1L, a gene coding for a membrane protein that when over expressed in cisplatin-sensitive cells causes apoptosis, is over expressed in EGFR activated cases that are the least proliferative.
Survival correlations for EGFR relevant genes
Genes implicated in the EGFR subtype were examined for overall survival across the LUAD tumor cohort (n = 230) using the Kaplan-Meier tool in cBioPortal (Figure 6). Cases with alteration in the genome and/or expression levels to TP53, YKT6, UBE2D4, and MCPH1 had decreased survival when compared to cases that did not. Cases with EGFR alteration in addition to each of these genes showed increased significance (Log rank) for YKT6, UBE2D4, and TP53. MCPH1 had decreased significance (Log rank) when in combination with EGFR.
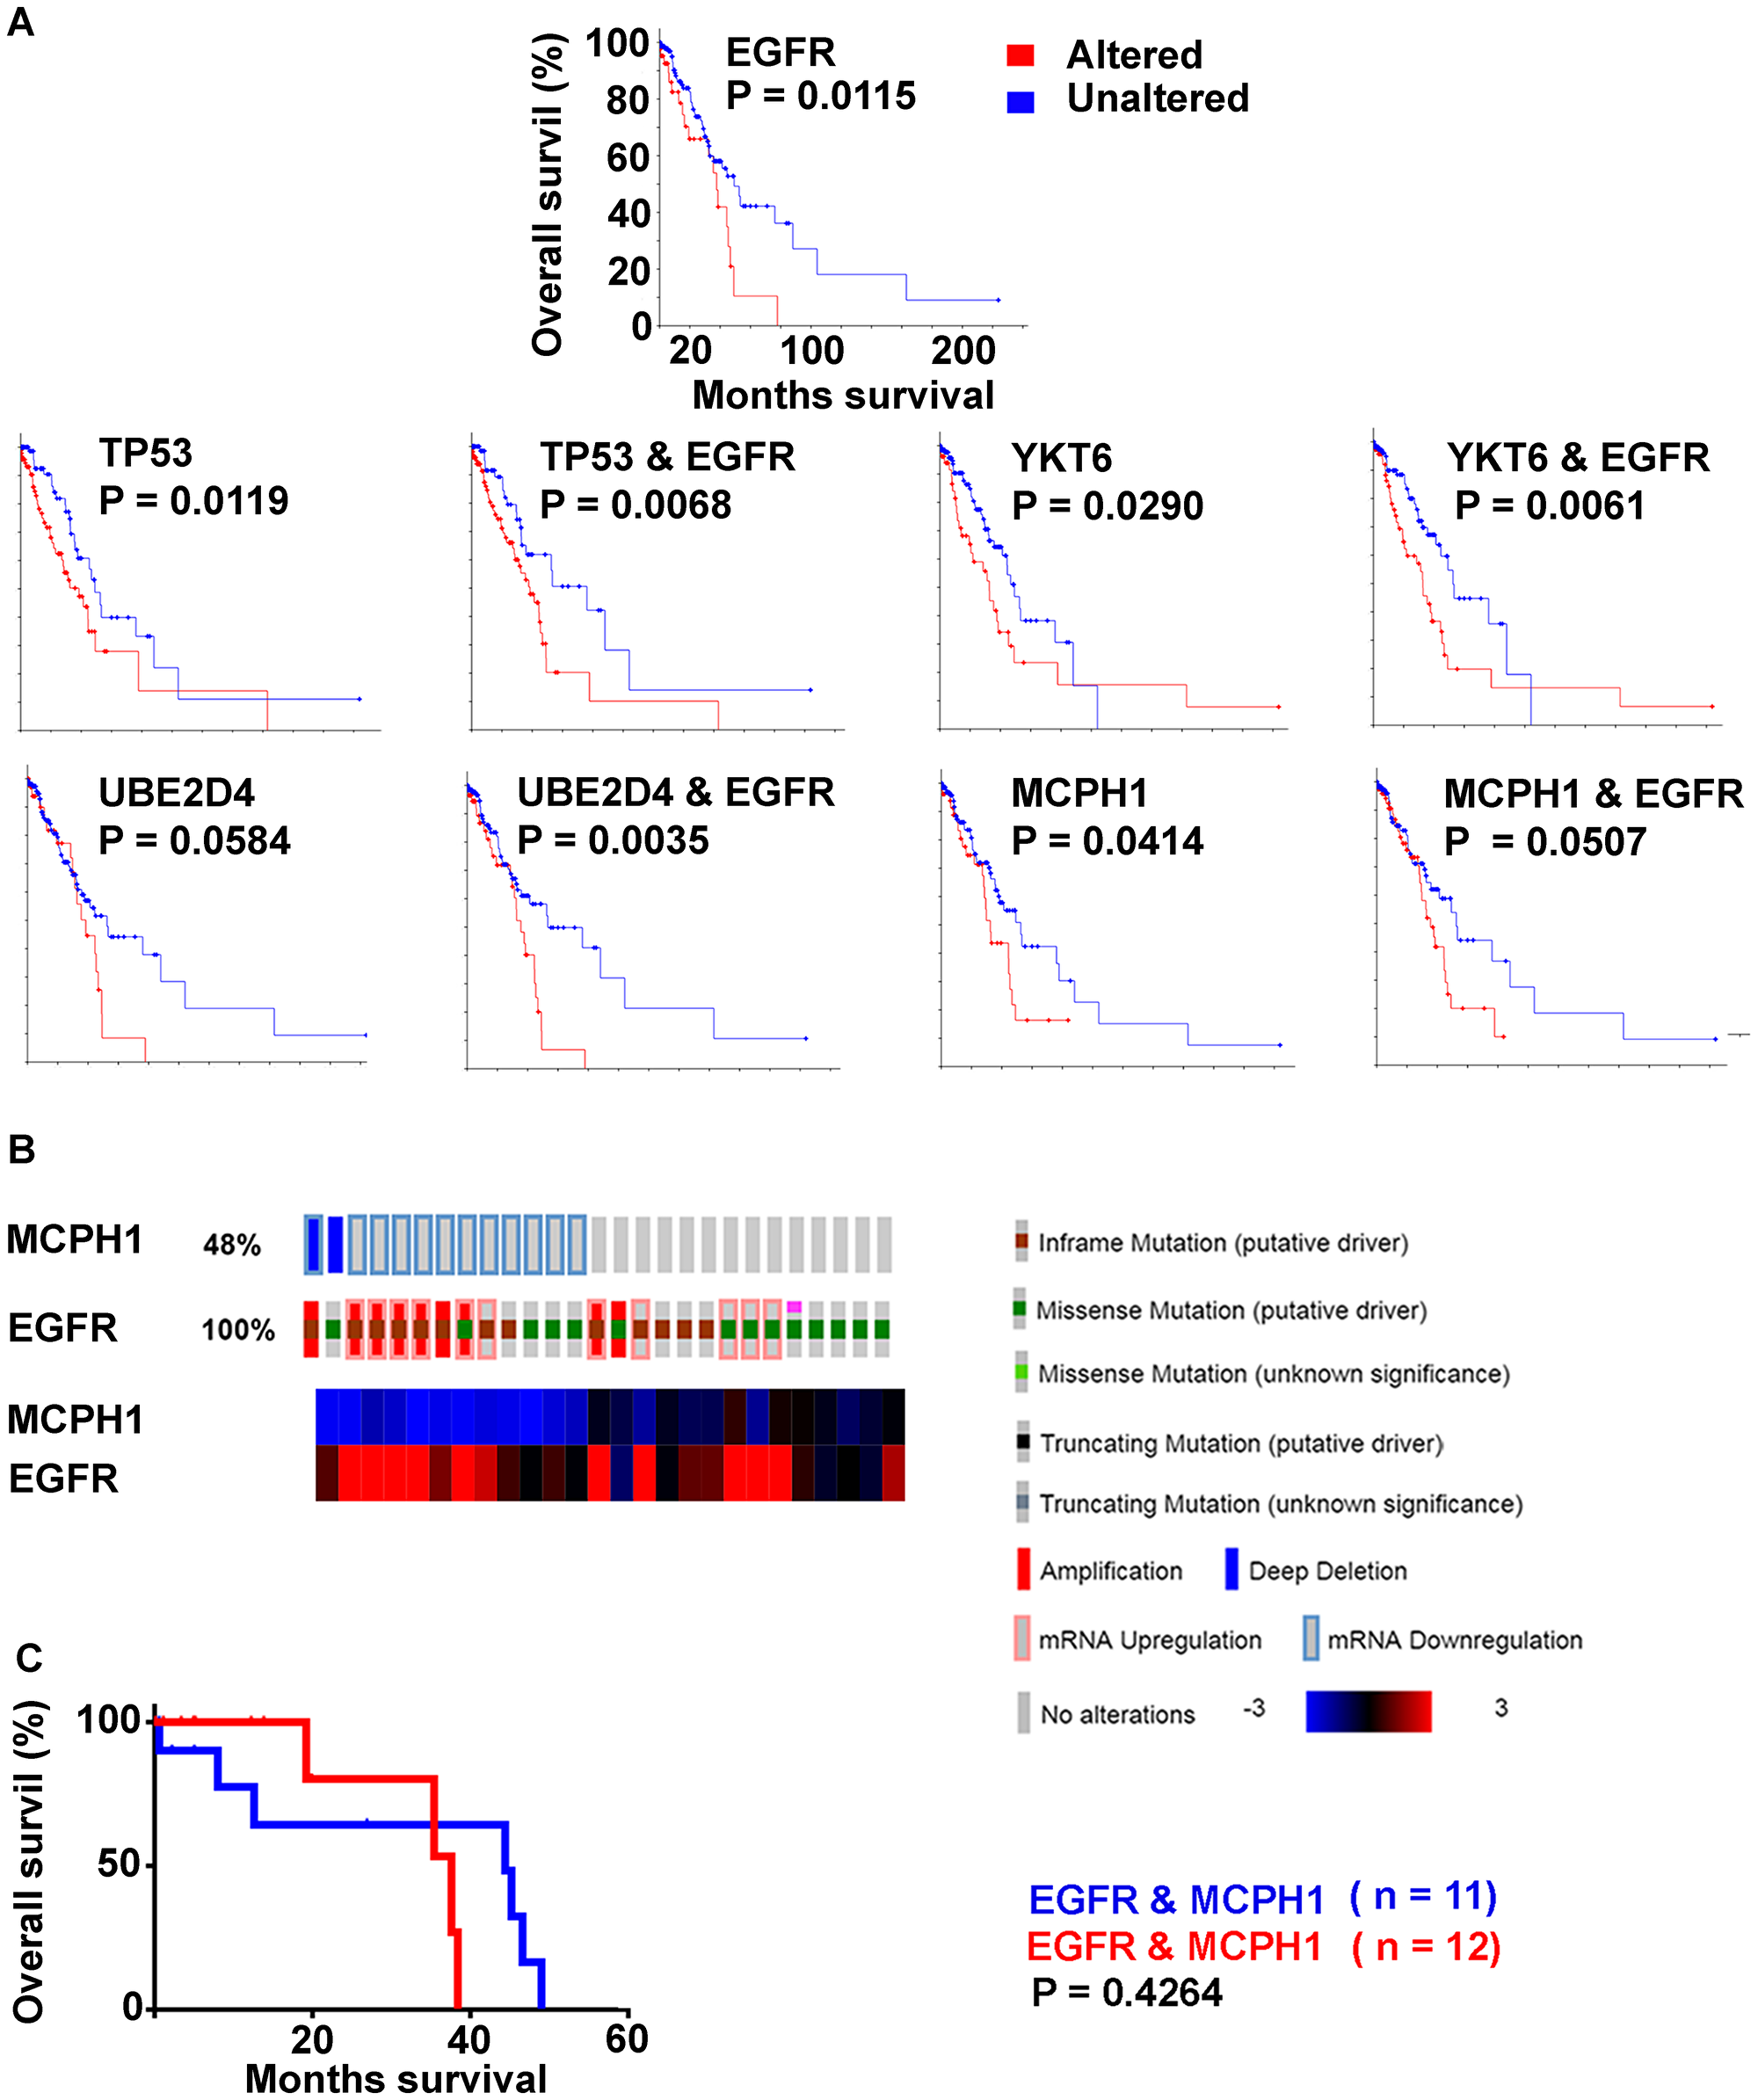
Figure 6: Decreased overall survival (Kaplan Meier survival plots, Log rank; LUAD with survival data, n = 197) by genes with high frequency alterations in EGFR activated cases. (A) EGFR altered (red) unaltered (blue). TP53, YKT6, UBE2D4, MCPH1 with and without EGFR alteration. (B) MCPH1 and EGFR, EGFR activated cases only. (C) Kaplan Meier survival plot; reduced versus normal expression.
A matrix table was set up to identify combinatorial alterations to TP53, YKT6, UBE2D4, and MCPH1 for individual EGFR activated cases (Table 8). Kaplan-Meier survival curves were calculated for each combination over the entire LUAD cohort, and sorted on the basis of Log-rank outcome. MCPH1 under expression correlated with loss of significance between curves for all gene permutations, with decrease in median survival seen in the “unaltered” curve. In EGFR activated cases alone, those with MCPH1 reduced expression (n = 11) were compared with MCPH1 normal expression (n = 12) when survival data was available, the curves were not significantly different from each other (P = 0.4264) (Figure 6).
Table 8: Combinatory alterations to TP53, YKT6, UBE2D4, and MCPH1 in EGFR activated cases and their survival
| TCGA ID (n = 26) | EGFRa | TP53a | YKT6a | UBE2D4a | MCPH1a | (Logrank)b (n = 230) | Median survival altered (mo) | Altered Total/Died | Median survival unaltered (mo) | Unaltered Total/Died |
| TCGA-44-2661-01 | X | O | O | X | O | 0.003 | 35.5 | 61/26 | 53.3 | 142/37 |
| TCGA-67-6217-01 | X | O | X | X | O | 0.004 | 32.7 | 86/37 | 76.2 | 117/26 |
| TCGA-49-4494-01 | X | O | X | X | O | 0.004 | 32.7 | 86/37 | 76.2 | 117/26 |
| TCGA-78-7147-01 | X | X | O | X | O | 0.005 | 37.7 | 119/44 | 76.2 | 84/19 |
| TCGA-05-5423-01 | X | X | O | X | O | 0.005 | 37.7 | 119/44 | 76.2 | 84/19 |
| TCGA-38-4627-01 | X | O | X | O | O | 0.006 | 32.7 | 79/34 | 52.5 | 124/29 |
| TCGA-55-7573-01 | X | X | O | O | O | 0.007 | 38.5 | 113/42 | 76.2 | 90/21 |
| TCGA-05-4382-01 | X | X | O | O | O | 0.007 | 38.5 | 113/42 | 76.2 | 90/21 |
| TCGA-75-6207-01 | X | X | X | X | O | 0.010 | 37.7 | 129/47 | 76.2 | 74/16 |
| TCGA-78-7155-01 | X | X | X | X | O | 0.010 | 37.7 | 129/47 | 76.2 | 74/16 |
| TCGA-50-5944-01 | X | O | O | O | O | 0.012 | 37.7 | 45/19 | 49.2 | 158/44 |
| TCGA-75-7025-01 | X | O | O | O | O | 0.012 | 37.7 | 45/19 | 49.2 | 158/44 |
| TCGA-91-6835-01 | X | O | O | O | O | 0.012 | 37.7 | 45/19 | 49.2 | 158/44 |
| TCGA-38-6178-01 | X | X | X | O | O | 0.015 | 37.7 | 126/46 | 76.2 | 77/17 |
| TCGA-75-6212-01 | X | O | O | X | X | 0.056 | 35.5 | 93/33 | 53.3 | 110/30 |
| TCGA-49-4501-01 | X | O | O | X | X | 0.056 | 35.5 | 93/33 | 53.3 | 110/30 |
| TCGA-67-3772-01 | X | O | O | X | X | 0.056 | 35.5 | 93/33 | 53.3 | 110/30 |
| TCGA-91-6847-01 | X | X | O | O | X | 0.060 | 38.5 | 130/45 | 53.3 | 73/18 |
| TCGA-64-1681-01 | X | X | O | O | X | 0.060 | 38.5 | 130/45 | 53.3 | 73/18 |
| TCGA-49-4490-01 | X | X | X | X | X | 0.137 | 38.5 | 143/48 | 53.3 | 60/15 |
| TCGA-69-7760-01 | X | X | X | X | X | 0.137 | 38.5 | 143/48 | 53.3 | 60/15 |
| TCGA-05-4402-01 | X | X | X | X | X | 0.137 | 38.5 | 143/48 | 53.3 | 60/15 |
| TCGA-50-6673-01 | X | X | X | X | X | 0.137 | 38.5 | 143/48 | 53.3 | 60/15 |
| TCGA-55-6981-01 | X | O | X | X | X | 0.140 | 35.5 | 110/40 | 53.3 | 93/23 |
| TCGA-38-4628-01 | X | O | X | X | X | 0.140 | 35.5 | 110/40 | 53.3 | 93/23 |
| TCGA-55-6980-01 | X | O | X | O | X | 0.141 | 35.5 | 107/39 | 52.5 | 96/24 |
Pathway alteration in EGFR activated LUAD
Overall, EGFR tyrosine kinase activated cases did not have distant metastases prompting examination of markers of epithelial to mesenchyme transition (EMT) (Figure 7). In agreement, appreciable alteration was not found for CDH1, VIM, SNAI1, SNAI2, TWIST1, ZEB1, or ZEB2. EGFR activation did correlate with activation of HUS1, RAD1, and several other components of the 9-1-1 DNA damage response pathway suggesting the major replication complexes were under replication stress. Important representative genes comprising the MAPK/ERK pathway revealed some activation of the pathway. The PI3K/AKT/mTOR pathway, particularly several components of autophagy, had high activation over a high frequency of cases. Examining the SHH pathway independently from other genes, found none of the components altered in 50% or over cases. However, GNA12 (7p22.3-p22.2) expression was upregulated and significantly co-expressed with EGFR (P = 0.001) in 36% of the EGFR activated cases, and Gli3 (7p14.1) expression in 39%.
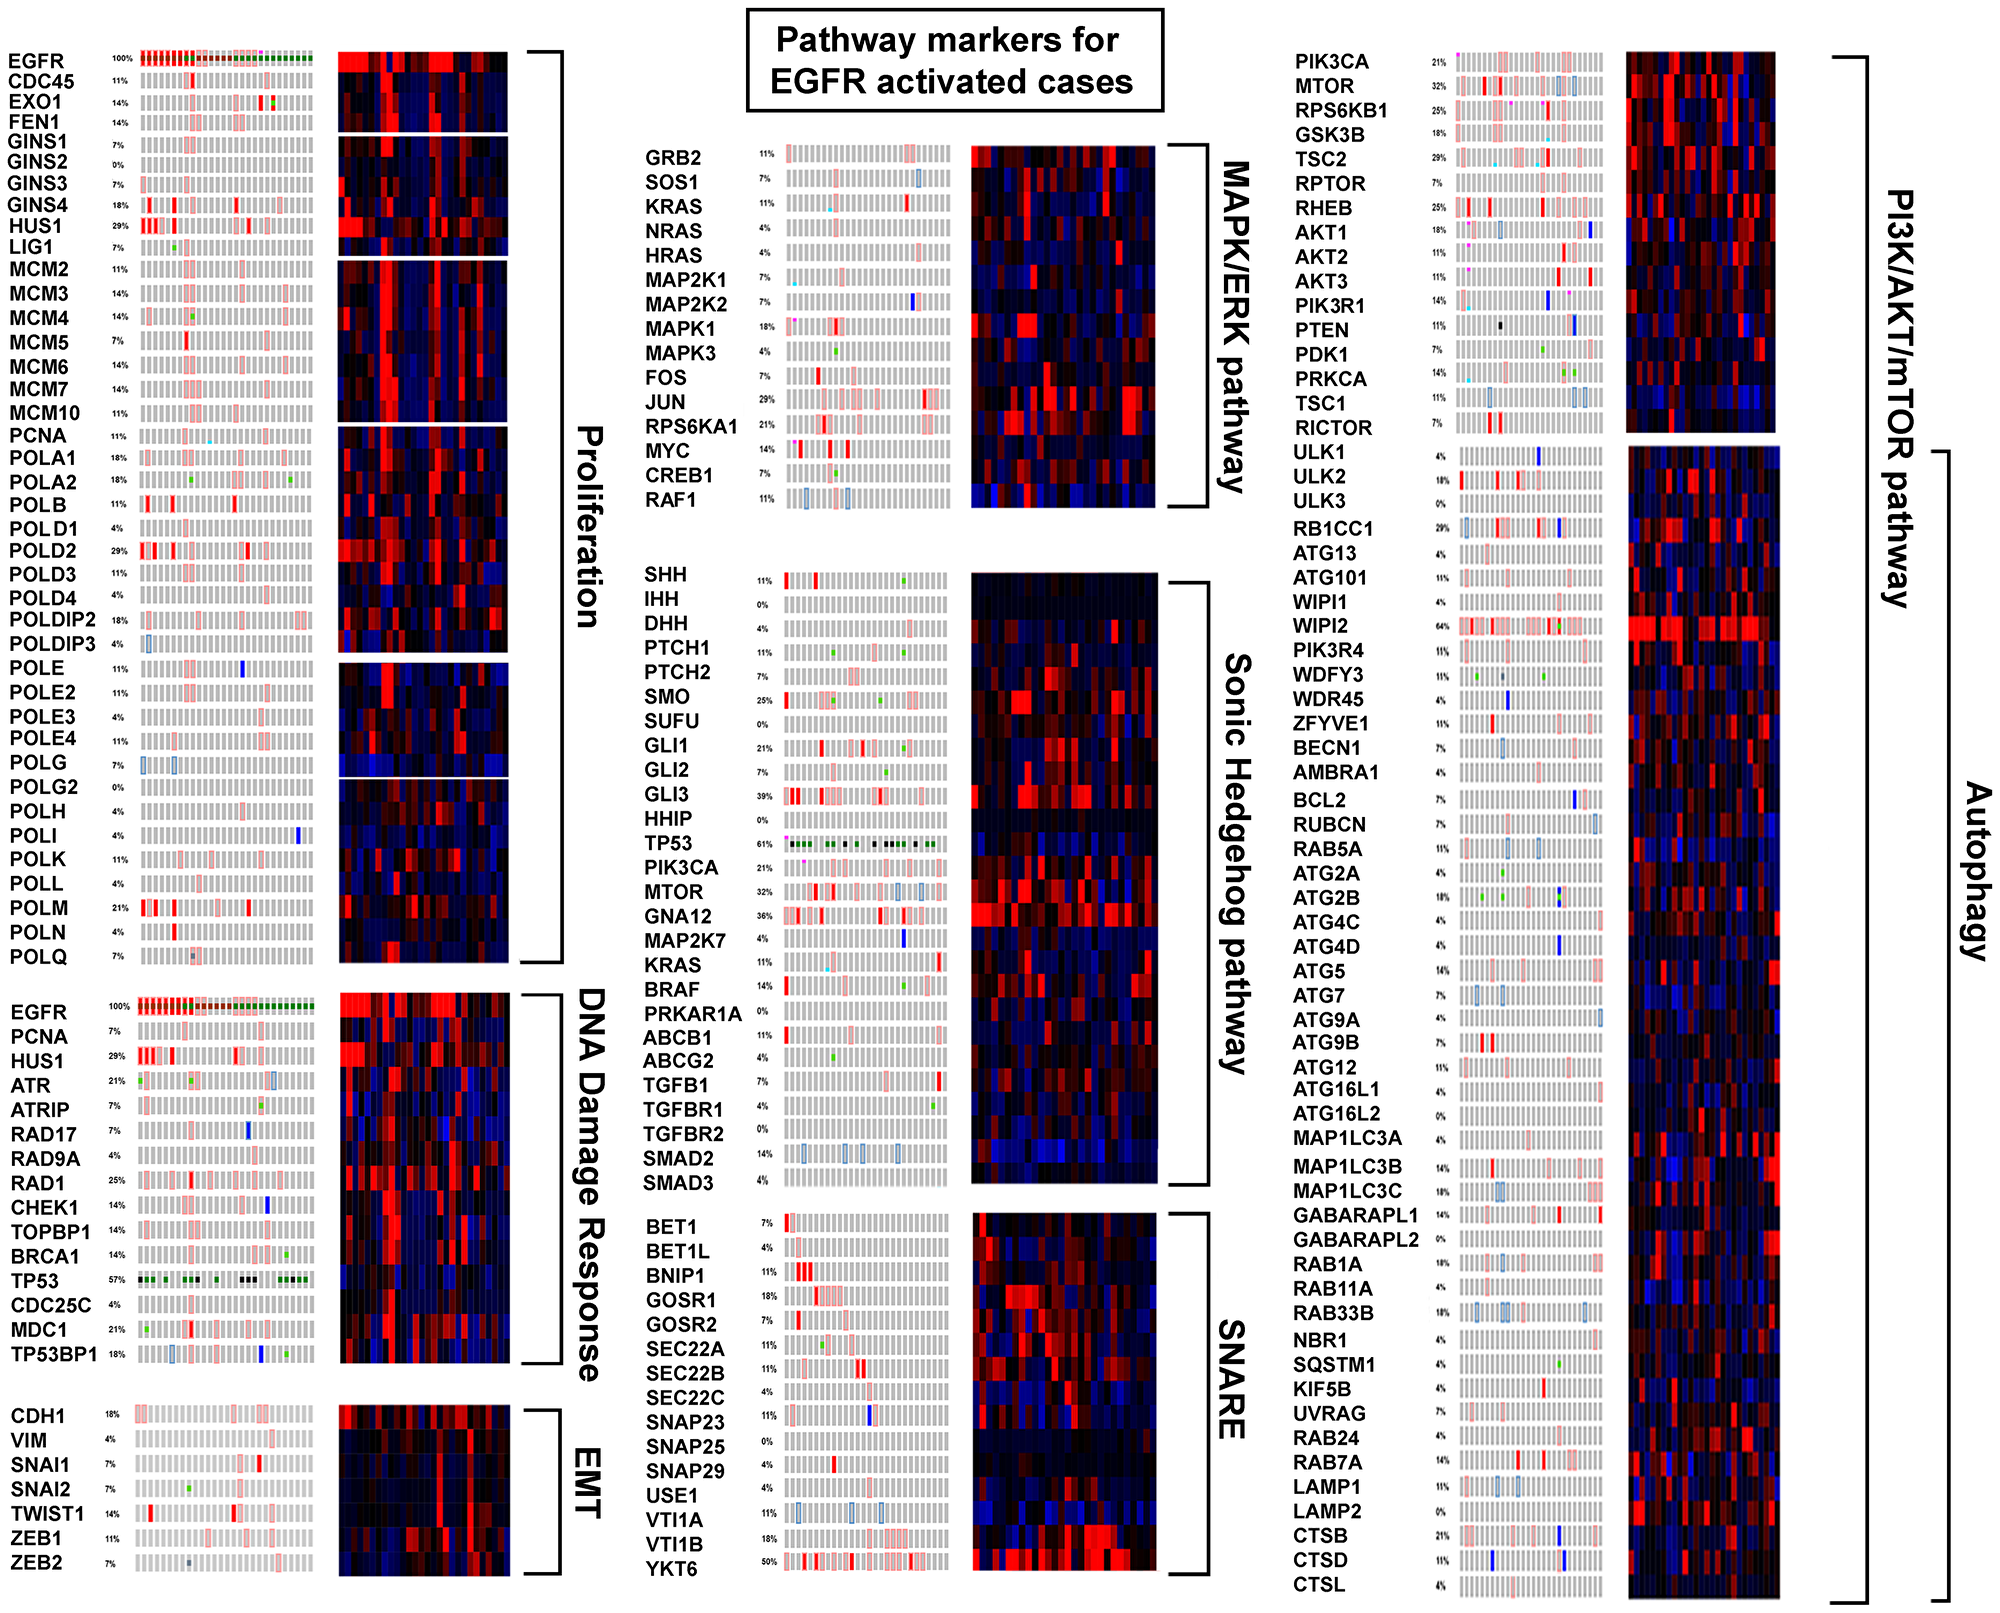
Figure 7: EGFR activated cases compared to pathway markers.
Discussion
This study shows expression of pre-replication and pre-initiation complex and replisome components vary between LUAD subtypes reported by TCGA [2, 3]. Subtypes 2 and 3 tumors have highest expression that potentiates highest proliferation. Subtype 1 tumors have the least of expression, and represent the opposite boundary. While cytotoxicity of cisplatin and carboplatin may be the result of complex cellular processes, it follows that DNA targeting agents would be most effective on highly proliferating tumors. And if so, the development of a proliferation descriptor based on component expression (or absence of expression for some genes) would be advantageous. An estimated measurement of the kinetics of proliferation could be investigated for correlation with responsiveness to DNA targeting reagents, possibly enabling prediction of response prior to use and permitting therapeutic decisions based on a score. Cases from LUAD subtype 1 and some patients with high EGFR expression and tyrosine kinase activating mutations for example, might benefit from less toxic therapies without prior cisplatin/carboplatin treatment. Both metastatic [10] and drug resistant tumor cells [11, 12] undergo a low/non proliferative phase that reactivates after extravasation in the case of metastasis, or clonal outgrowth in drug resistant cells. A standard form of measurement could be of help defining both processes.
EGFR is not a known component of the pre-replication and pre-initiation complexes or the replisome. It is a receptor tyrosine kinase (RTK) in the plasma membrane and functions in the regulation of the ERK/MAPK pathway kinase cascade and IGF-1 mTOR pathway [13]. Activating mutations are often found in the tyrosine kinase domain; RTK inhibitors are effective in LUAD treatment (for a recent review) [14]. That EGFR activation contributes to cancer is implicit from decades of research [15–18]. It is difficult to fathom that this gene’s over expression would not clearly correlate with increased replication processing. In actuality, despite the large body of work that exists, a full understanding of how or if the receptor functions in the proliferation process is lacking. EGFR is known to phosphorylate PCNA stabilizing the chromatin bound form [19], however the functional significance of the modification is not definitively clear. Some evidence exists that mismatch repair (MMR) is inhibited by EGFR phosphorylation of PCNA [20]. In the present study, the low proliferation status of highly expressed EGFR cases suggests PCNA phosphorylation by EGFR may actually play a role in slowing replication complexes. An alteration leading to over transcription of EGFR and surrounding chromosome 7 genes would be a germline or early event in these tumors, and PCNA phosphorylation would hypothetically result in “replication stress”, an early and strong driving force in tumorigenesis, which would then invoke the DNA damage response. Interestingly, transcription and replication start sites often coincide at nucleosome free regions with some transcription factors playing a role in proliferation [21]. The activation/overexpression of EGFR may initiate a transcriptional feedback inhibition mechanism for EGFR and replication genes. This study shows that tumors with missense activating EGFR mutations did not fall any one place on the PCNA proliferation curve, and (with one exception) EGFR activated cases were pre-metastatic. None-the-less, these untreated cases where EGFR activation was determined to be a putative driver had significant decreased survival on Kaplan Meier plots compared to cases that did not, suggesting that over proliferation and metastasis are not driving their lethality. In attempt to create a narrative of EGFR activated tumors, the remainder of this discussion goes into some detail explaining how the receptor was first associated with proliferation and then examines the functions of genes and pathways found altered in EGFR activated cases.
The earliest report pertinent to EGFR was written in 1947 on “urogastrone” known at the time as an inhibitor of gastric secretion, later identified as EGF [22, 23]. Initially, isolated from the submaxillary glands of male mice EGF elicited early eyelid opening and tooth eruption [24]. Embryonal chick epidermal sections incubated with purified EGF and radioactively labeled thymidine had increased nucleotide incorporation and keratinization, establishing EGF’s identity as proliferation factor. Curiously, control embryonal epidermal sections grown without EGF were capable of generating feathers while sections grown in the presence of purified EGF could not. Also, EGF stimulated basal cell production but the columnar orientation of the basal cells was not maintained. EGF did not stimulate the periderm, a structure present in chick embryonic skin made up of squamous cells linked closely together by junctional complexes and sloughed off at hatching [25]. Cohen [24] reported periderm contact with supporting filter led to migration of cells with no proliferation. In retrospect, the loss of columnar orientation observed in this early study is suggestive of an EGF/EGFR relationship to the cytoskeleton, abnormal keratinization hints at Wnt signaling involvement, and the disparity in feather formation and periderm behavior suggests that the EGF/EGFR relationship to proliferation is cell type dependent and complex. Molecular mechanisms of chick feather formation involve sonic hedgehog (Shh) [26] and the pathway is also thought involved in human lung development [27]; canonical activation is not thought to occur generally in LUAD. In this study EGFR activated LUAD had non-canonical Shh pathway activation through increased GNA12 and Gli3 expression (not Shh, Ptch, and Smo). Both of these genes are found on the short arm of Chromosome 7 where fifteen other transcriptionally dysregulated genes were identified suggesting the region is specifically important in EGFR activated lung cancer. Recent reports implicate the region in LUAD [28, 29].
This study found that with exception of TP53 and MCPH1, genes altered in EGFR cases were over expressed, NUDCD3 with highest frequency. NUDCD3 protein localizes to the cytoskeleton and is important in cytokinesis, mitosis, and dynein (cytoskeletal motor protein) stability. Over expression causes defects in cytokinesis that inhibit proliferation and induce the formation of binucleated cells, multipolar spindles, and lagging chromosomes [30]. Low TP53 expression and TP53 mutation was found in these tumors as was overexpression to FBXO42 [31] and UBE2D4 [32]. Both FBXO42 and UBE2D4 facilitate TP53 protein ubiquitination and degradation. TP53 absence would eliminate apoptosis, contribute to cell cycle arrest, alter angiogenesis, affect DNA repair, increase IGF-1/mTOR pathway signaling, and change exosome mediated secretion [33]. This study finds an increase in mTOR signaling in these cases, conjecturally a result of TP53 elimination and non-canonical hedgehog signaling (via GSK3β, also a member of Wnt signaling). PI3K/AKT/mTOR pathway favors tumor growth and cell size over proliferation and regulates autophagy. EGFR activated tumors have been suggested to be oncogene addicted to and dependent on this pathway [34, 35].
Autophagy, the endomembrane degradation process necessary for cellular homeostasis [36], has similarities and connections to apoptosis through BCL-2, an inhibitor of both. High EGFR expressing tumors had low BCL-2 expression in this study (data not shown) enabling increased autophagy in the absence of TP53 mediated apoptosis. Dysregulation of autophagy occurs in cancer, neurodegeneration, and microbial infection. This investigation observed autophagy components WIPI2 and YKT6 over expressed in EGFR activated tumors. WIPI proteins normally form a “propeller” that binds specifically to phosphatidylinositol 3-phosphate (PIP3, upregulated in mTOR/AKT/PI3K signaling) responsible for lipidation [37]. YKT6, a member of the SNARE proteins, is important in vesicular trafficking between the endoplasmic reticulum and the golgi apparatus and in neurotransmitter exocytosis [36]. Proteins involved in autophagy and exosome production, a process related through TP53, paradoxically contribute to tumor suppression in normal cells, and tumor promotion in cancer cells. Tumors with TP53 mutation and EGFR activation have altered exosome cargo currently being examined for biomarker use in liquid biopsies, effect on immune response, and cell-cell intercommunication. The dysregulation of these processes suggest possible involvement in the lethality of the EGFR activated phenotype.
Interestingly, WIPI2 like MCPH1 has a central nervous system phenotype (CNS) phenotype when mutated in humans [38, 39]. MCPH1 also functions in chromosome condensation [40], the DNA damage response, and regulation of CHK1 and BRCA1 [41] localizing to the centrosome in neurons [42]. Null MCPH1 in Drosophila undergo mitotic arrest with spindles that lack chromosomes, a phenotype that can be suppressed by Chk2 mutation [43]. MCPH1 is synonymous to BRIT1 [44], and is another post-transcriptional regulator of TP53 through ubiquitination. It is implicated in cancer as a tumor suppressor [45, 46, 47]. This study also suggests MCPH1 is a tumor suppressor in EGFR activated LUAD, however the lack of increasing significance in Kaplan Meier plots with additional affected genes (including TP53), and the decrease in median survival of the unaltered curves over total LUAD is perplexing (Table 8, Figure 6) possibly suggesting, like NUDCD3, a narrow window of expression is necessary to maintain mitotic capability or that DDR capability is necessary for EGFR activated tumor cells to replicate and survive.
When EGFR activated cases do metastasize, they target the brain at a much higher rate that non-EGFR activated cases. These tumor cells may bear some functional resemblance to the environment they are capable of metastasizing with both tumor and neuron being low proliferating with high EGFR expression and increased membrane trafficking. Some of the membrane trafficking components are known to play a role in neural synaptic transmission. These thoughts raise speculative questions, do unappreciated CNS symptoms exist in pre-metastatic EGFR activated LUAD patients? Could exosomes originating from EGFR activated tumors cross the blood brain barrier and interfere with neural synaptic transmission? Another question that may address EGFR activation lethality, do exosomes affect immune response in the lung?
Materials and Methods
Tumor cohort, cluster and mutational analysis
The tumor cohort used throughout this study was created and examined by TCGA [2, 3]; patient sample information is in Supplementary Table 3. Whole Exome Sequencing was performed on tumor and germline DNA. Cluster analysis based on copy number, DNA methylation, and mRNA expression revealed six subtypes (1-6) [4]. Mutational findings, also based upon data generated by the TCGA Research network, are found in cBio-Portal [6, 5, 48].
Availability of data and materials
The datasets generated and/or analyzed for the current study are available in the Genome Data Commons [49] and Broad Institute [7].
Expression analysis
“Differential expression” is defined as mRNA Z Scores (RNA-Seq by Expectation Maximization (RSEM) (log2)) compared to the expression distribution of each gene tumors that are diploid for the gene. The comparison employs the average expression level of the diploid tumor fraction as an estimated “normal” value, and was calculated by cBioPortal; values for all genes given (Supplementary Table 4).
In some instances, mRNA Z scores (RNA-Seq Reads per Kilobase of Transcript per Million (RPKM) (log2)) were also calculated, relative to the mean expression level of the tumor cohort in its entirety. This comparison facilitates bimodal placement of the gene’s expression level into high and low grouping around the tumor average for examination, it was described in more detail previously [50].
RNA-Seq derived exon expression levels were visualized in heat maps for all genes. The Gene Annotation File (GAF) “TCGA.hg19.June2011.gaf” [49] was used to create an exon-StartStop.txt file for each gene tested which in turn was used to parse the “UVM.rnaseqv2__illuminahiseq_rnaseqv2__unc_edu__Level_3__exon_quantification__data.da ta.txt” file [7] to create an “exonRPKM.txt” file used for standard Z score generation. Both files, exonStartStop.txt and exonsRPKM.txt, were run through a verification step to confirm that the appropriate gene, TCGA barcodes, and RNA-Seq data were selected prior to their use. Exon start-stop sites from the exonStartStop.txt file were examined in Integrative Genome Viewer (IGV) [51, 52] using RNA-Seq data from the same case to confirm the authenticity of the exon. Z scores were calculated for each exon of each gene by mean-centering with the average alteration level the log2 transformed RPKM values and dividing by the standard deviation, visualizing high (red), no change/no expression (white), and low (blue) and arranging data by LUAD cluster assignments (1–6) in heat maps.
The “Firebrowse” tool in Firehose [7] was used to examine differential expression levels of a specific gene across thirty-seven tumor types.
Clinical data and survival analysis
The TCGA LUAD cohort was made up of two hundred-thirty matched tumor and normal samples from patients that did not have previous treatment. Appropriate informed consent was obtained. All major histologic types of lung adenocarcinoma were represented: 5% lepidic, 33% acinar, 9% papillary, 14% micropapillary, 25% solid, 4% invasive mucinous, 0.4% colloid and 8% unclassifiable adenocarcinoma. A full description of the pathological and histological assessment can be found in the Supplementary Materials of the TCGA report [2] (see also Supplementary Table 3). Kaplan Meier survival plots were constructed for “overall survival” and created either using the cBioPortal survival tool, or by using GraphPad Prism 6.0 software where indicated. In all cases the Log-rank (Mantel-Cox) and Hazard Ratio tests were used to determine significance. In some instances the Gehan-Breslow-Wilcoxon test which gives weight to deaths at early time points of the survival curve was also observed.
Replication component expression as reference curve
To examine subtle relationships between gene expression and replication over the LUAD cohort, Proliferating Cell Nuclear Antigen (PCNA) and other components of the replisome were arranged from minimum and maximum expression and used as a reference curve. Test gene Z scores were arranged according to the reference gene case order using GraphPad Prism 6.0 software; data was obtained from cBioPortal unless otherwise indicated. The rationale for using PCNA in this manner stems from its integral role as a clamp in the replication process, to which many other proliferation factors bind [53]. It is used in this study as a replication marker.
Identification of altered genes in EGFR activated cases
A list for “total genes” was generated [54] (approximately 22,165). Protein coding genes were screened for mutations, copy number alterations, mRNA expression (RNA Seq V2 RSEM), and protein expression (RPPA) in cBioPortal. Genes with alterations in at least 50% or more EGFR activated cases were identified. This gave extensive but not exhaustive results, RNA genes were not available for observation.
Abbreviations
EGFR: Epidermal Growth Factor Receptor; TCGA: The Cancer Genome Atlas; LUAD: Lung Adenocarcinoma; CCLE: Cancer Cell Line Encyclopedia; COAD: Colon Adenocarcinoma; BRCA: Breast Cancer; GBB: Glioblastoma; MCM: Mini-Chromosome; EMT: Epithelial to Mesenchyme transition; SHH: Sonic Hedgehog; RTK: Receptor tyrosine kinase; MMR: Mismatch Repair; EGF: Epidermal Growth Factor; RSEM: RNA-Seq by Expectation Maximization; PCNA: Proliferating Cell Nuclear Antigen; KEGG: Kyoto Encyclopedia of Genes and Genomes.
ACKNOWLEDGMENTS
The author wishes to express appreciation to Dr. Raju Kucherlapati for reading the manuscript and providing comments and advice, and gratitude for support given by members of Research Computing at Harvard Medical School. Also to thank both Dr. Matthew Meyerson and Dr. Ramaswamy Govindan, co-chairs of the TCGA LUAD analysis working group, for permitting the author to listen to current weekly conferences.
Ethics statement
The project protocol for the Harvard Genome Characterization Center (HGCC) was approved by the Brigham and Women’s Hospital Institutional Review Board. Access to TCGA controlled-access data was given by The Cancer Genome Atlas (TCGA) Data Access Committee. Participants agreed to participate and give informed consent. Human Subjects Protection, Data Access Policies, and HIPAA Privacy Rule compliance were developed by the NCI and NHGRI to protect their privacy. This study is compliant with the TCGA “exclusivity period” for publication.
CONFLICTS OF INTEREST
The author declares there are no conflicting interests in relation to the work described, nor are there personal financial interests in organizations that will gain or lose by its publication.
FUNDING
The study was supported by a grant from the National Institutes of Health to Raju Kucherlapati for the Harvard Genome Characterization Center No.5U24CA144025.
References
1. National Comprehensive Cancer Network. 2019. https://www.nccn.org/professionals/physician_gls/pdf/nscl_blocks.pdf.
2. Cancer Genome Atlas Research Network. Comprehensive molecular profiling of lung adenocarcinoma. Nature. 2014; 511:543–50. https://doi.org/10.1038/nature13385. [PubMed].
3. Cancer Genome Atlas Research Network. Author Correction: comprehensive molecular profiling of lung adenocarcinoma. Nature. 2018; 559:E12. https://doi.org/10.1038/s41586-018-0228-6. [PubMed].
4. Mo Q, Wang S, Seshan VE, Olshen AB, Schultz N, Sander C, Powers RS, Ladanyi M, Shen R. Pattern discovery and cancer gene identification in integrated cancer genomic data. Proc Natl Acad Sci U S A. 2013; 110:4245–50. https://doi.org/10.1073/pnas.1208949110. [PubMed].
5. Gao J, Aksoy BA, Dogrusoz U, Dresdner G, Gross B, Sumer SO, Sun Y, Jacobsen A, Sinha R, Larsson E, Cerami E, Sander C, Schultz N. Integrative analysis of complex cancer genomics and clinical profiles using the cBioPortal. Sci Signal. 2013; 6:pl1. https://doi.org/10.1126/scisignal.2004088. [PubMed].
6. cBioPortal. 2013. http://www.cbioportal.org/index.do.
7. Broad Institute. 2016. http://gdac.broadinstitute.org/.
8. Barretina J, Caponigro G, Stransky N, Venkatesan K, Margolin AA, Kim S, Wilson CJ, Lehár J, Kryukov GV, Sonkin D, Reddy A, Liu M, Murray L, et al. The Cancer Cell Line Encyclopedia enables predictive modelling of anticancer drug sensitivity. Nature. 2012; 483:603–07. https://doi.org/10.1038/nature11003. [PubMed].
9. Barretina J, Caponigro G, Stransky N, Venkatesan K, Margolin AA, Kim S, Wilson CJ, Lehár J, Kryukov GV, Sonkin D, Reddy A, Liu M, Murray L, et al. Addendum: the Cancer Cell Line Encyclopedia enables predictive modelling of anticancer drug sensitivity. Nature. 2019; 565:E5–6. https://doi.org/10.1038/s41586-018-0722-x. [PubMed].
10. Franzetti GA, Laud-Duval K, van der Ent W, Brisac A, Irondelle M, Aubert S, Dirksen U, Bouvier C, de Pinieux G, Snaar-Jagalska E, Chavrier P, Delattre O. Cell-to-cell heterogeneity of EWSR1-FLI1 activity determines proliferation/migration choices in Ewing sarcoma cells. Oncogene. 2017; 36:3505–14. https://doi.org/10.1038/onc.2016.498. [PubMed].
11. Moore N, Houghton J, Lyle S. Slow-cycling therapy-resistant cancer cells. Stem Cells Dev. 2012; 21:1822–30. https://doi.org/10.1089/scd.2011.0477. [PubMed].
12. Jung Y, Lippard SJ. Direct cellular responses to platinum-induced DNA damage. Chem Rev. 2007; 107:1387–407. https://doi.org/10.1021/cr068207j. [PubMed].
13. Engelman JA. The role of phosphoinositide 3-kinase pathway inhibitors in the treatment of lung cancer. Clin Cancer Res. 2007; 13:s4637–40. https://doi.org/10.1158/1078-0432.CCR-07-0653. [PubMed].
14. Franek J, Cappelleri JC, Larkin-Kaiser KA, Wilner KD, Sandin R. Systematic review and network meta-analysis of first-line therapy for advanced EGFR-positive non-small-cell lung cancer. Future Oncol. 2019; 15:2857–71. https://doi.org/10.2217/fon-2019-0270. [PubMed].
15. Sato JD, Kawamoto T, Le AD, Mendelsohn J, Polikoff J, Sato GH. Biological effects in vitro of monoclonal antibodies to human epidermal growth factor receptors. Mol Biol Med. 1983; 1:511–29. [PubMed].
16. Kawamoto T, Sato JD, Le A, Polikoff J, Sato GH, Mendelsohn J. Growth stimulation of A431 cells by epidermal growth factor: identification of high-affinity receptors for epidermal growth factor by an anti-receptor monoclonal antibody. Proc Natl Acad Sci U S A. 1983; 80:1337–41. https://doi.org/10.1073/pnas.80.5.1337. [PubMed].
17. Planck M, Edlund K, Botling J, Micke P, Isaksson S, Staaf J. Genomic and transcriptional alterations in lung adenocarcinoma in relation to EGFR and KRAS mutation status. PLoS One. 2013; 8:e78614. https://doi.org/10.1371/journal.pone.0078614. [PubMed].
18. Planck M, Isaksson S, Veerla S, Staaf J. Identification of transcriptional subgroups in EGFR-mutated and EGFR/KRAS wild-type lung adenocarcinoma reveals gene signatures associated with patient outcome. Clin Cancer Res. 2013; 19:5116–26. https://doi.org/10.1158/1078-0432.CCR-13-0928. [PubMed].
19. Wang SC, Nakajima Y, Yu YL, Xia W, Chen CT, Yang CC, McIntush EW, Li LY, Hawke DH, Kobayashi R, Hung MC. Tyrosine phosphorylation controls PCNA function through protein stability. Nat Cell Biol. 2006; 8:1359–68. https://doi.org/10.1038/ncb1501. [PubMed].
20. Ortega J, Li JY, Lee S, Tong D, Gu L, Li GM. Phosphorylation of PCNA by EGFR inhibits mismatch repair and promotes misincorporation during DNA synthesis. Proc Natl Acad Sci U S A. 2015; 112:5667–72. https://doi.org/10.1073/pnas.1417711112. [PubMed].
21. Haas MW, Ramanujam P, Chandrasekharappa SC, Subramanian KN. Sequence requirements for activation of replication by the SV40 transcriptional promoter or enhancer elements. Virology. 1991; 180:41–48. https://doi.org/10.1016/0042-6822(91)90007-X. [PubMed].
22. Kaulbersz J, Patterson TL, Sandweiss DJ, Saltzstein HC. Alterations in urogastrone excretion produced by extirpation of various endocrine glands. Am J Physiol. 1947; 150:373–80. https://doi.org/10.1152/ajplegacy.1947.150.3.373. [PubMed].
23. Gregory H, Preston BM. The primary structure of human urogastrone. Int J Pept Protein Res. 1977; 9:107–18. https://doi.org/10.1111/j.1399-3011.1977.tb03470.x. [PubMed].
24. Cohen S. The stimulation of epidermal proliferation by a specific protein (EGF). Dev Biol. 1965; 12:394–407. https://doi.org/10.1016/0012-1606(65)90005-9. [PubMed].
25. Wessells NK. An analysis of chick epidermal differentiation in situ and in vitro in chemically defined media. Dev Biol. 1961; 3:355–89. https://doi.org/10.1016/0012-1606(61)90052-5. [PubMed].
26. Nohno T, Kawakami Y, Ohuchi H, Fujiwara A, Yoshioka H, Noji S. Involvement of the Sonic hedgehog gene in chick feather formation. Biochem Biophys Res Commun. 1995; 206:33–39. https://doi.org/10.1006/bbrc.1995.1005. [PubMed].
27. Giroux-Leprieur E, Costantini A, Ding VW, He B. Hedgehog Signaling in Lung Cancer: From Oncogenesis to Cancer Treatment Resistance. Int J Mol Sci. 2018; 19. https://doi.org/10.3390/ijms19092835. [PubMed].
28. Tsiambas E, Mastronikolis NS, Lefas AY, Georgiannos SN, Ragos V, Fotiades PP, Tsoukalas N, Kavantzas N, Karameris A, Peschos D, Patsouris E, Syrigos K. Chromosome 7 Multiplication in EGFR-positive Lung Carcinomas Based on Tissue Microarray Analysis. In Vivo. 2017; 31:641–48. https://doi.org/10.21873/invivo.11106. [PubMed].
29. Kang JU. Characterization of amplification patterns and target genes on the short arm of chromosome 7 in early-stage lung adenocarcinoma. Mol Med Rep. 2013; 8:1373–78. https://doi.org/10.3892/mmr.2013.1686. [PubMed].
30. Cai Y, Yang Y, Shen M, Zhou T. Inhibition of cytokinesis by overexpression of NudCL that is localized to the centrosome and midbody. Cell Res. 2009; 19:1305–08. https://doi.org/10.1038/cr.2009.118. [PubMed].
31. Sun L, Shi L, Li W, Yu W, Liang J, Zhang H, Yang X, Wang Y, Li R, Yao X, Yi X, Shang Y. JFK, a Kelch domain-containing F-box protein, links the SCF complex to p53 regulation. Proc Natl Acad Sci U S A. 2009; 106:10195–200. https://doi.org/10.1073/pnas.0901864106. [PubMed].
32. Lee JY, Tokumoto M, Fujiwara Y, Hasegawa T, Seko Y, Shimada A, Satoh M. Accumulation of p53 via down-regulation of UBE2D family genes is a critical pathway for cadmium-induced renal toxicity. Sci Rep. 2016; 6:21968. https://doi.org/10.1038/srep21968. [PubMed].
33. Yu X, Harris SL, Levine AJ. The regulation of exosome secretion: a novel function of the p53 protein. Cancer Res. 2006; 66:4795–801. https://doi.org/10.1158/0008-5472.CAN-05-4579. [PubMed].
34. Sharma SV, Bell DW, Settleman J, Haber DA. Epidermal growth factor receptor mutations in lung cancer. Nat Rev Cancer. 2007; 7:169–81. https://doi.org/10.1038/nrc2088. [PubMed].
35. Engelman JA, Cantley LC. A sweet new role for EGFR in cancer. Cancer Cell. 2008; 13:375–76. https://doi.org/10.1016/j.ccr.2008.04.008. [PubMed].
36. Kyoto Encyclopedia of Genes and Genomes. 2019. https://www.genome.jp/kegg/pathway.html.
37. Thost AK, Dönnes P, Kohlbacher O, Proikas-Cezanne T. Fluorescence-based imaging of autophagy progression by human WIPI protein detection. Methods. 2015; 75:69–78. https://doi.org/10.1016/j.ymeth.2014.11.011. [PubMed].
38. Jelani M, Dooley HC, Gubas A, Mohamoud HS, Khan MT, Ali Z, Kang C, Rahim F, Jan A, Vadgama N, Khan MI, Al-Aama JY, Khan A, et al. A mutation in the major autophagy gene, WIPI2, associated with global developmental abnormalities. Brain. 2019; 142:1242–54. https://doi.org/10.1093/brain/awz075. [PubMed].
39. Ghafouri-Fard S, Fardaei M, Gholami M, Miryounesi M. A case report: autosomal recessive microcephaly caused by a novel mutation in MCPH1 gene. Gene. 2015; 571:149–50. https://doi.org/10.1016/j.gene.2015.07.058. [PubMed].
40. Trimborn M, Bell SM, Felix C, Rashid Y, Jafri H, Griffiths PD, Neumann LM, Krebs A, Reis A, Sperling K, Neitzel H, Jackson AP. Mutations in microcephalin cause aberrant regulation of chromosome condensation. Am J Hum Genet. 2004; 75:261–66. https://doi.org/10.1086/422855. [PubMed].
41. Xu X, Lee J, Stern DF. Microcephalin is a DNA damage response protein involved in regulation of CHK1 and BRCA1. J Biol Chem. 2004; 279:34091–94. https://doi.org/10.1074/jbc.C400139200. [PubMed].
42. Zhong X, Pfeifer GP, Xu X. Microcephalin encodes a centrosomal protein. Cell Cycle. 2006; 5:457–58. https://doi.org/10.4161/cc.5.4.2481. [PubMed].
43. Rickmyre JL, Dasgupta S, Ooi DL, Keel J, Lee E, Kirschner MW, Waddell S, Lee LA. The Drosophila homolog of MCPH1, a human microcephaly gene, is required for genomic stability in the early embryo. J Cell Sci. 2007; 120:3565–77. https://doi.org/10.1242/jcs.016626. [PubMed].
44. Lin SY, Rai R, Li K, Xu ZX, Elledge SJ. BRIT1/MCPH1 is a DNA damage responsive protein that regulates the Brca1-Chk1 pathway, implicating checkpoint dysfunction in microcephaly. Proc Natl Acad Sci U S A. 2005; 102:15105–09. https://doi.org/10.1073/pnas.0507722102. [PubMed].
45. Zhang B, Wang E, Dai H, Hu R, Liang Y, Li K, Wang G, Peng G, Lin SY. BRIT1 regulates p53 stability and functions as a tumor suppressor in breast cancer. Carcinogenesis. 2013; 34:2271–80. https://doi.org/10.1093/carcin/bgt190. [PubMed].
46. Zhou L, Bai Y, Li Y, Liu X, Tan T, Meng S, He W, Wu X, Dong Z. Overexpression of MCPH1 inhibits uncontrolled cell growth by promoting cell apoptosis and arresting the cell cycle in S and G2/M phase in lung cancer cells. Oncol Lett. 2016; 11:365–72. https://doi.org/10.3892/ol.2015.3857. [PubMed].
47. Wu X, Liu W, Liu X, Ai Q, Yu J. Overexpression of MCPH1 inhibits the migration and invasion of lung cancer cells. Onco Targets Ther. 2018; 11:3111–17. https://doi.org/10.2147/OTT.S156102. [PubMed].
48. Cerami E, Gao J, Dogrusoz U, Gross BE, Sumer SO, Aksoy BA, Jacobsen A, Byrne CJ, Heuer ML, Larsson E, Antipin Y, Reva B, Goldberg AP, et al. The cBio cancer genomics portal: an open platform for exploring multidimensional cancer genomics data. Cancer Discov. 2012; 2:401–04. https://doi.org/10.1158/2159-8290.CD-12-0095. [PubMed].
49. Genome data commons. 2018. https://portal.gdc.cancer.gov/.
50. Kucherlapati M. Examining transcriptional changes to DNA replication and repair factors over uveal melanoma subtypes. BMC Cancer. 2018; 18:818. https://doi.org/10.1186/s12885-018-4705-y. [PubMed].
51. Thorvaldsdóttir H, Robinson JT, Mesirov JP. Integrative Genomics Viewer (IGV): high-performance genomics data visualization and exploration. Brief Bioinform. 2013; 14:178–92. https://doi.org/10.1093/bib/bbs017. [PubMed].
52. Robinson JT, Thorvaldsdóttir H, Winckler W, Guttman M, Lander ES, Getz G, Mesirov JP. Integrative genomics viewer. Nat Biotechnol. 2011; 29:24–26. https://doi.org/10.1038/nbt.1754. [PubMed].
53. Moldovan GL, Pfander B, Jentsch S. PCNA, the maestro of the replication fork. Cell. 2007; 129:665–79. https://doi.org/10.1016/j.cell.2007.05.003. [PubMed].
54. Weizmann Institute of Science. 2019. https://www.genecards.org/.
55. Metacore. 2019. https://portal.genego.com/.