
Introduction
Prostate cancer affects approximately 1 out of 7 men throughout their life time, with an estimated 174,650 new cases and 31,620 deaths in US in 2019 [1]. Although prostate cancer patients exhibit enormous heterogeneity in terms of disease progression [2], and African American (AA) patients suffer higher incidence and mortality rates than Caucasian American (CA) patients [3], we have limited knowledge of the genes that may contribute to this disparity [4]. The paradigm of prostate cancer diagnosis has, for more than two decades, relied on screening for serum prostate-specific antigen (PSA) and digital rectal examination (DRE) followed by biopsy and confirmatory pathologic analysis [5–7]. Elevated PSA levels can arise from inflammation and enlargement of the prostate, leading to a false positive result [8, 9]. Concerns over overdiagnosis and overtreatment due to the lack of specificity of PSA testing has led changes in the recommendations by US Preventive Services Task Force on PSA screening [10, 11]. Then again, although most localized prostate cancer remain indolent, some tumors continue to progress locally and develop distant metastasis over time [12]. Therefore, there is an urgent need for more specific biomarkers that can detect and distinguish aggressive from indolent disease, and better stratify high-risk cancer early.
Clinical parameters such as Gleason score, tumor stage, margin status, PSA level, extracapsular extension, positive surgical margins, seminal vesicle invasion, and lymph node involvement have been combined to predict prostate cancer outcome with limited success [13]. Attempts to further enhance the predictive power of clinical parameters using tumor-derived gene expression markers have has greatly improved the detection, prognosis, and risk evaluation of prostate cancer [14–19]. For individuals suspected of prostate cancer, several prognostic assays based on mRNA detection of cellular genes using needle-biopsies or radical prostatectomy specimen, such as Prolaris, Oncotype DX® prostate, and Decipher are used to predict poor prostate cancer outcomes and help inform patients on whether repeat biopsies for further evaluation are advisable [14–16, 20, 21]. Despite the progress made in identifying candidate biomarkers, their use in clinical settings have been limited due to the lack of validation through multi-institutional studies and prohibitive cost of these new technologies. Therefore, there remains an urgent need for cost-effective prognostic markers that can predict aggressive disease at an early stage and stratify patients for appropriate treatment options.
We used whole-mounted prostate tissue specimens from a cohort of patients who were treated with radical prostatectomy (RP) and were followed-up for up to ten years. At the time of surgery, these patients had prostate tumors with low grade and stage that revealed no signs of future disease progression but had either progressed to biochemical recurrence (BCR) or showed no sign of progression (non-BCR) during the follow-up period. We hypothesized that prognostic biomarkers for identifying patients that may progress to BCR are present even at the early stage prostate cancer and they could be identified from gene expression profiles of prostatectomy specimens from such a patient cohort. We set out to detect genes differentially expressed in prostate tumor and normal tissue specimens from BCR and non-BCR prostate cancer patients, and through their association with BCR status, to identify genes associated with favorable or adverse pathologic features. RNA expression of the tissues specimen was detected without amplification using the high throughput quantitative profiling NanoString platform [22, 23].
Results
RNA isolation and quality control
We isolated RNA from whole-mounted prostate FFPE tissue specimens of a cohort of patients who were treated with radical prostatectomy (Table 1). To ensure the integrity of the purified RNA, we optimized the methods for manual microdissection (Supplementary Figure 1) and RNA isolation (Supplementary Figure 2). RNA samples extracted using our optimized methods for both cell isolation and RNA purification were found to have average RIN of 2.3 (2.0 – 2.6 range). RNA fragments of ≥100 nucleotides, and ≥300 nucleotides represented 86%, and 28% of isolated RNA, respectively (Supplementary Table 1). We used 500 ng of input RNA instead of the recommended input of at least 100 ng of intact total RNA to offset the high level of fragmentation and to achieve the acceptable NanoString readout.
Table 1: Clinical characteristics of patients
| Characteristics | Prostatectomy discovery cohort (n = 63) | ||
|---|---|---|---|
| BCR (n = 21) | Non-BCR (n = 42) | p value | |
| Time from RP to BCR1 (median), months | 19.4 (2.5–98.6) | ||
| Time from RP to last PSA follow-up, months | 97.4 (58.1–166.8) | ||
| Range of surgery year | 1998–2008 | 1997–2007 | |
| Age | |||
| Median (IQR) | 58.3 (45–70) | 56.4 (40–75) | 0.26 |
| < 50 | 3 (14%) | 11 (26%) | |
| 50–60 | 10 (48%) | 17 (41%) | |
| 60–70 | 7 (33%) | 11 (26%) | |
| > 70 | 1 (5%) | 3 (7%) | |
| Race | |||
| American Caucasian | 14 (67%) | 27 (64%) | |
| American African | 6 (28%) | 13 (31%) | |
| Hispanic/Other | 1 (5%) | 2 (5%) | |
| Clinical tumor stage | |||
| T1 | 12 (57%) | 24 (57%) | |
| T2 | 7 (33%) | 17 (40%) | |
| Unknown | 2 (10%) | 1 (3%) | |
| Pre-surgery PSA | |||
| Median (IQR) | 4.7 (1.8–13.6) | 4.7 (0.7–14.2) | 0.74 |
| BMI | |||
| Median (IQR) | 27 (19–34) | 26 (16–33) | 0.11 |
| Prostate weight | |||
| Median (IQR) | 39.5 (23.4–48.4) | 36.6 (22.3–63.7) | 0.46 |
| Signs of further progression | |||
| positive margins | Negative | Negative | |
| Extra-capsular extension | Negative | Negative | |
| Seminal vesicle invasion | Negative | Negative | |
| Pathology GS | |||
| ≤ 6 (3+3) | 12 (57%) | 30 (71%) | |
| 7 (3+4) | 9 (43%) | 12 (29%) | |
| Pathology tumor stage | |||
| T2 | 21 (100%) | 40 (95%) | |
| T3A | 0 (0%) | 2 (5%) | |
Differentially expressed genes in prostatectomy specimens from BCR and non-BCR cases
To identify the genes that are differentially expressed in prostate tumors from patients that progressed to biochemical recurrence and those who did not, we analyzed RNA from all cases using a customized 151-probe CodeSet (Table 2). A total of 135 probe sets of this CodeSet target transcripts from 121 oncogenes, tumor suppressors, and gene fusion variants associated with prostate cancer and cancer in general. These genes were selected based on their association with cancer, specifically prostate cancer, according to the following criteria, supported by at least two publications: (1) have significant differential gene expression in prostate tumor versus normal comparison based on microarray gene expression profiling (data accessible at NCBI GEO database, accession GSE32448 [24]), including ERG [25, 26], ERG8 [27, 28], ANXA2 [29, 30], MYO6 [31, 32] and MAOA [32, 33]; (2) are regulated by androgen, such as AMACR [25, 34, 35], PSGR [36, 37], PCGEM1 [38, 39], [40, 41], and NKX3.1 [42, 43]; (3) are associated with prognosis of prostate cancer, such as AR [44, 45], EZH2 [46, 47], C-MYC [48, 49], PTEN [50, 51], and NCOA2 [52, 53]; (4) are associated with the ETS family of transcription factors detected in GSE32448 [54, 55]; (5) are commonly rearranged in prostate cancer [26, 56, 57]; (6) are involved in prostate cancer cell invasion, such as SPINK1 [58, 59], TFF3 [60, 61], MMP2 and MMP9 [62, 63]; (7) or are associated with multiple malignancies involving PDGF [64], RAS [65], VEGF [66], EGFR [67], TP53 [65, 68], Interleukin [52], and JAK/STAT signaling pathways [69, 70]. An additional 16 probe sets target five genes that distinguish prostate epithelial from stromal cells [71–74], and 11 house-keeping genes with minimal tumor-normal differential expression identified through gene expression profiling [24] were included as controls.
Table 2: NanoString CodeSet of 151 probes for prognostic discovery
| Prostate cancer prognosis associated genes | Prostate cancer up-regulated | Prostate cancer down-regulated | Prostate cancer gene fusions | Cancer gene subset | Prostate cancer stroma or epithelial genes |
|---|---|---|---|---|---|
| AKT1 | AMACR | AMD1 | (ACSL3)3-(ETV1)6 | AKT2 | ALCAM |
| ANXA2 | BICD1 | EVA1 | (C15orf21)2-(ETV1)6 | BRAF | KRT18 |
| AR | CACNA1D | GSTP1 | (CANT1)1-(ETV4)5 | CAV1 | KRT5 |
| AURKA | CLDN8 | HOXB13 | (DDX5)2-ETV4)5 | EGFR | POSTN |
| CAMK2N1 | CRISP3 | KLK2 | (FLJ35294)-(ETV1)5 | FAS | VIM |
| CCND1 | EPC1 | KLK3 (PSA) | (HERPUD1)1-E4 | GATA1 | Housekeeping genes |
| CHD1 | EPC2 | LTF | (HNRPA2B1)1-(ETV1)2 | HDAC1 | ACTB |
| C-MYC | ERG (Pan) | MSMB | (KLK2)1-(ETV4)4 | HIF1A | B2M |
| COL1A1 | ERG1,2,3 | NEFH | (NDRG1)1-E4 | HRAS | CLTC |
| COL3A1 | ERG8 | NKX3.1 | (SLC45A3)1-(ETV5)8 | KRAS | GAPDH |
| CXCR4 | ETV1 | ODC1 | (SLC45A3)1-E4 | MMP2 | GUSB |
| EZH2 | ETV4 | ACPP (PAP) | T1-(ETV4)2 | MMP9 | HPRT1 |
| FZD4 | ETV5 | PMEPA1 | T1-E2 | NOTCH1 | PGK1 |
| HSP27 | GGT1 | KLK4 (KLK-L1/Prostase) | T1-E3 | NRAS | RPL13A |
| JAG1 | HOXC6 | PSCA | T1-E4 | NUMA1 | RPL27 |
| KLF4 | HPGD | STAG1 | T1-E5 | PDGFR | RPS13 |
| MAOA | MYO6 | TMPRSS2 | T2-E2 | PIK3CA | TUBB |
| MUC1 | NPY | T2-E4 | RAF1 | ||
| MYCN | PCA3 | T2-E5 | STAT1 | ||
| NCOA2 | PCGEM1 | T3-(ETV5)2 | STAT3 | ||
| OCT4 | PLA2G7 | T3-E4 | TP53 | ||
| PARP1 | PSGR | T4-E4 | VEGFA | ||
| PTENP1 | PSGR2 | T4-E5 | VEGFR | ||
| PTEN | FOLH1(PSMA) | T5-E4 | VEGFR1 | ||
| SMAD4 | SPARC | T5-E5 | WNT1 | ||
| SOX2 | TMEFF2 | AGTRAP - BRAF | |||
| SPINK1 | TWIST1 | SLC45A3 - BRAF | |||
| SPP1 | ETS genes | ||||
| SPRY1 | ESE3 | ||||
| SPRY2 | ETS1 | ||||
| STAG2 | ETS2 | ||||
| TFF3 | FLI1 | ||||
| TOP2A | SPDEF (PDEF) | ||||
| ZEB1 | |||||
| 34 | 27 | 17 | 32 | 25 | 16 |
We analyzed both the transcript count in tumor specimens only as well as the ratio of transcript count in tumor compared to normal epithelium. To avoid potential false positives, we used the Storey-Tibshirani method [75] to correct for multiple hypothesis testing. The false discovery rate or q-values obtained were used to set the cut-off for selection of markers to avoid the inclusion of false positives or type I errors. By setting the cut-off q-value at 0.075 and 0.085 for the evaluation of tumor only, and tumor vs. normal, respectively, we determined that genes with q-values below these set values were indeed differentially expressed. Genes that are differentially expressed are shown in Figure 1 and listed together their p-values, q-values, and expected false positve (FP) values in Table 3. Using this criterion, we identified eight genes, detected by eleven probe sets, that have significantly lower expression in tumors from BCR patients compared to non-BCR patients. In addition to ERG, which was detected by ERG8, ERG1/ERG2/ERG3, Pan-ERG, and T2-ERG-exon4-fusion probe sets, GGT1, HDAC1, KLK2, MYO6 PLA2G7, BICD1, and CACNAID were found to have lower expression in tumors of patients that developed BCR. Using the similar criterion, analysis of the ratio of gene expression in tumor compared to normal epithelium identified three genes with significantly different expression profiles between BCR and non-BCR cases (Figure 1B). Specifically, ERG isoforms (detected by Pan-ERG, ERG8, ERG1/ERG2/ERG3, T2-ERG-exon 4 fusion probe sets), TP53 and HDAC1 were found to have a lower tumor vs. normal ratio in cases that progressed to BCR.
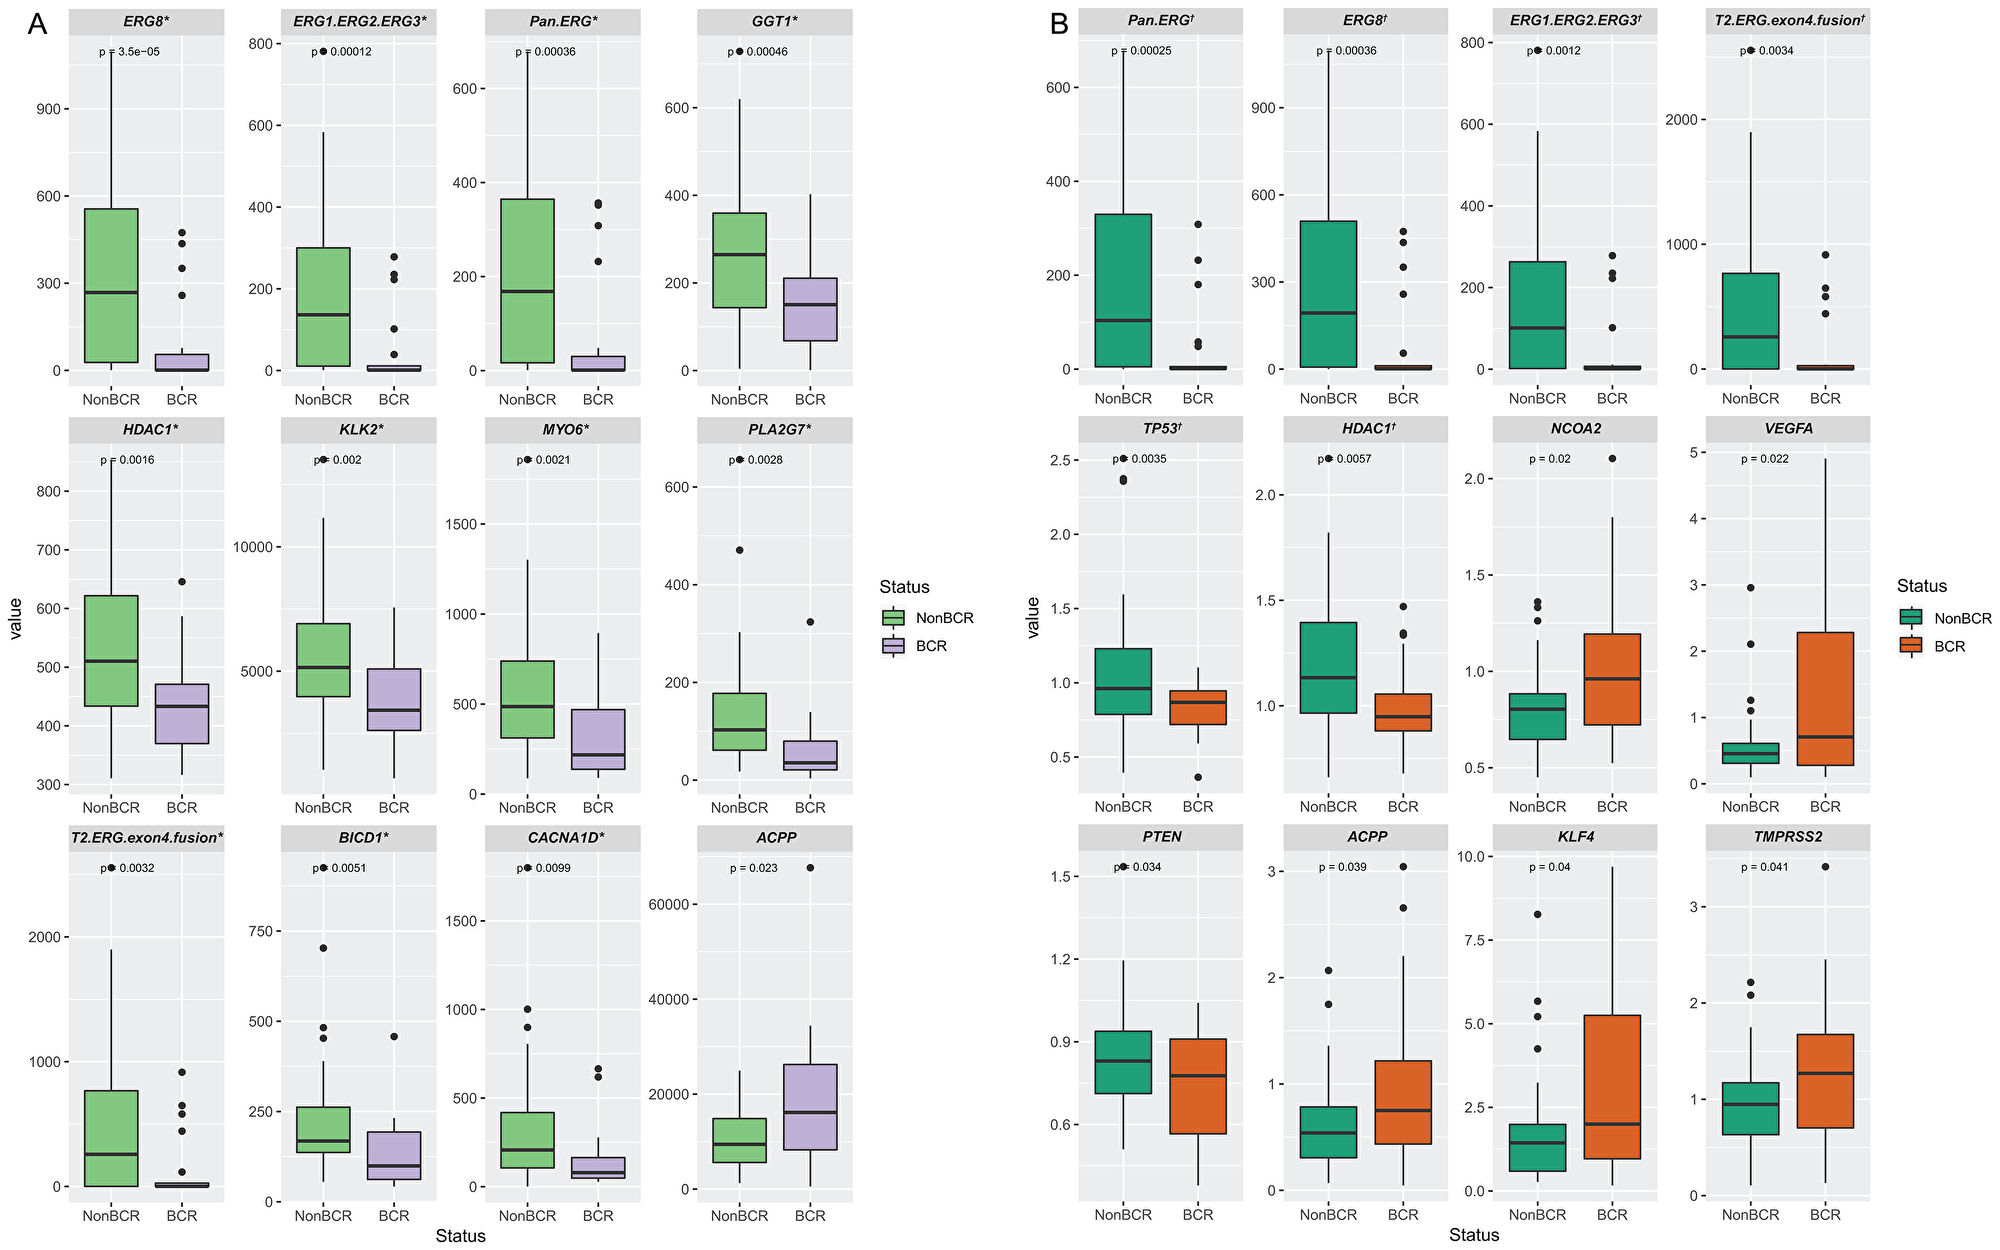
Figure 1: Differentially expressed genes in prostate tissue specimens from patients with BCR or non-BCR detected by NanoString probe sets. Genes that are differentially expressed based on the detection of transcripts in prostate tumors (A), and on the ratio of transcripts in tumor vs. normal tissues (B). The p-value is indicated for each gene. Genes with q-value below the cut-off of value of 0.075 and 0.085 for tumor only, and tumor vs. normal analyses are denoted by * and †, respectively, as tabulated in Table 3.
Table 3: Differentially expressed genes in prostate tissue specimens of patients with or without progression to BCR based on expression in tumor only and ratio of expression in tumor vs. normal
| Tumor only | Tumor vs Normal | |||||||||
| Probe | p value | q-value | Expected FP | BCR vs Non-BCR | Probe | p value | q-value | Expected FP | BCR vs Non-BCR | |
| 1 | ERG8 | 3.50E-05 | 0.00287 | 0.003 | ↓ | Pan.ERG | 0.00025 | 0.01594 | 0.016 | ↓ |
| 2 | ERG1.ERG2.ERG3 | 0.00012 | 0.00505 | 0.010 | ↓ | ERG8 | 0.00036 | 0.01594 | 0.032 | ↓ |
| 3 | Pan.ERG | 0.00036 | 0.00951 | 0.029 | ↓ | ERG1.ERG2.ERG3 | 0.00124 | 0.03686 | 0.111 | ↓ |
| 4 | GGT1 | 0.00046 | 0.00951 | 0.038 | ↓ | T2. ERG.exon4.fusion | 0.00342 | 0.06245 | 0.250 | ↓ |
| 5 | HDAC1 | 0.00158 | 0.02542 | 0.127 | ↓ | TP53 | 0.00349 | 0.06245 | 0.312 | ↓ |
| 6 | KLK2 | 0.00197 | 0.02542 | 0.153 | ↓ | HDAC1 | 0.00575 | 0.08562 | 0.514 | ↓ |
| 7 | MYO6 | 0.00214 | 0.02542 | 0.178 | ↓ | NCOA2 | 0.01971 | 0.24723 | 1.731 | ↑ |
| 8 | PLA2G7 | 0.00283 | 0.02941 | 0.235 | ↓ | VEGFA | 0.02213 | 0.24723 | 1.978 | ↑ |
| 9 | T2.ERG.exon4.fusion | 0.00319 | 0.02947 | 0.265 | ↓ | PTEN | 0.03389 | 0.30341 | 2.731 | ↓ |
| 10 | BICD1 | 0.00509 | 0.04225 | 0.422 | ↓ | ACPP | 0.03911 | 0.30341 | 3.034 | ↑ |
| 11 | CACNA1D | 0.00993 | 0.07502 | 0.825 | ↓ | KLF4 | 0.04010 | 0.30341 | 3.337 | ↑ |
| 12 | ACPP | 0.02298 | 0.15908 | 1.909 | ↑ | TMPRSS2 | 0.04074 | 0.30341 | 3.641 | ↑ |
| 13 | FAS | 0.03467 | 0.22155 | 2.880 | ↓ | FAS | 0.04674 | 0.32132 | 4.177 | ↓ |
| 14 | T2.ERG.exon2.fusion | 0.03828 | 0.22718 | 3.180 | ↓ | HSP27 | 0.06458 | 0.39413 | 5.518 | ↑ |
| 15 | C.MYC | 0.06511 | 0.34971 | 5.246 | ↓ | T2.ERG.exon2.fusion | 0.06616 | 0.39413 | 5.912 | ↓ |
Sensitivity and specificity of ERG probe sets for the detection of BCR
To ascertain that the probe sets demonstrate accurately the correlation between gene expression and BCR, the cut-off values were chosen as follows. First, the probe must be significantly different between non-BCR and BCR patients (p < 0.05). Second, the probe must show a q-value that exclude the likelihood of being a false positive event after adjusting for multiple-hypothesis testing. We then determine the sensitivity and specificity for predicting BCR for each probe set over its range of transcript count and set a cut-off value that prioritize specificity over sensitivity (see Supplementary Figure 3). By setting a cut-off value for detection of transcript counts for each probe set, we convert the continuous numeric transcript counts are into binary values of positive or negative detection. These categorical values allowed us to determine the sensitivity and specificity of not only for individual probe sets, but also for a selected panel of probe sets for predicting BCR. “Sensitivity” or true positive rate measures the proportion of actual positives that are correctly identified as positive, while “specificity” or true negative rate measures the proportion of actual negatives that are correctly identified as negative [76]. Specifically, as illustrated in Figure 2A, by setting the cut-off value of < 20 ERG transcript counts as ERG negative [ERG (-)] to predict a positive outcome for BCR, the sensitivity for BCR of this test is the percentage of cases with BCR that were correctly identified using this criterion as having BCR (15/21 or 71%). By setting the cut-off values of <20 and ≥20 transcript counts to represent ERG negative and ERG positive cases for the probe sets that target ERG splice variants or fusion variants, the results showed a strong sensitivity and specificity of these probe sets for predicting BCR. Individually, the Pan-ERG, ERG1/ERG2/ERG3, and ERG8 probe sets showed 71%, 76% and 71% sensitivity, respectively, and 74% specificity in predicting BCR (Figure 2B). When used together, these three ERG probe sets showed 81% sensitivity and 74% specificity in predicting BCR. The ERG probe sets displayed high concordance of over 95% with one another in their prediction of BCR (Figure 2C).
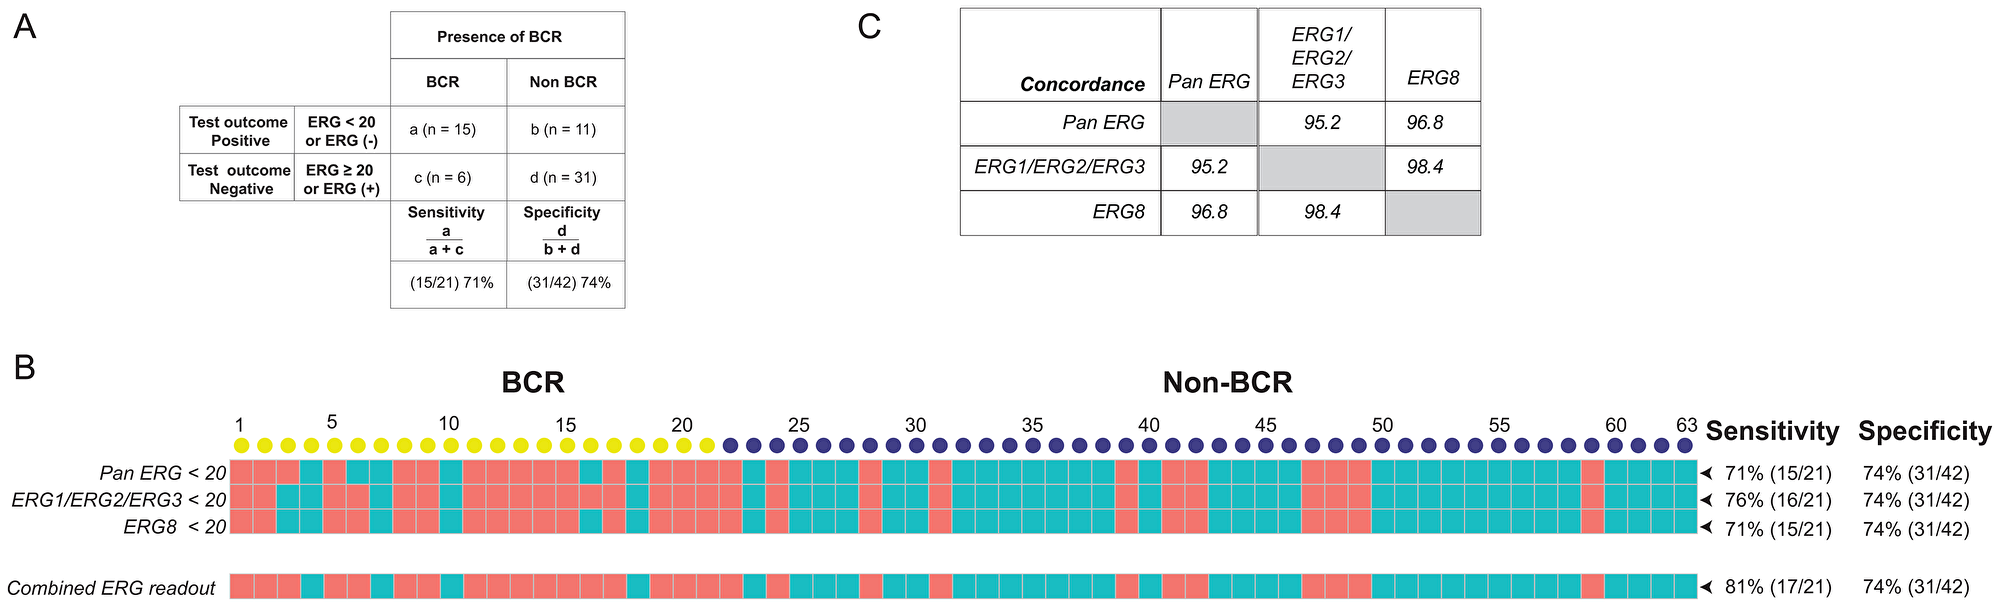
Figure 2: Sensitivity and specificity of ERG specific probe sets and the concordance for predicting BCR. (A) Definitions of "sensitivity" and "specificity" are illustrated using transcript counts detected by the Pan ERG probe set. (B) ERG status as detected by NanoString probe sets. Transcript counts of <20 were scored as ERG negative (represented by salmon colored squares), otherwise as ERG positive (represented by teal colored squares). Each column represents an RP specimen: yellow circles represent cases with BCR; blue circles, non-BCR. (C) Concordance of ERG status between NanoString probe sets targeting ERG variants.
Concordance of ERG detection by multiple platforms
Grouping of the detection of ERG transcripts into positive and negative categorical values also allowed us to compare the sensitivity of detection of ERG mRNA and protein expression using multiple technology platforms. Quantitative RT-PCR (qRT-PCR) amplification of mRNA from the same cohort (n = 63) detected 15 ERG negative cases among 21 BCR cases, predicting BCR with a sensitivity of 71%, similar to the NanoString Pan-ERG probe set. The assay detected 20 ERG positive cases out of 35 evaluable non-BCR cases at a specificity of 57%. When NanoString and by qRT-PCR were used together, the sensitivity and specificity for predicting BCR are 86% and 57%, respectively, achieving a of concordance 67% (Figure 3A). In addition to qRT-PCR, we further compared the detection of ERG transcript by NanoString Pan-ERG probe set to the detection of ERG protein expression by IHC assay, an assay routinely used in clinical diagnosis. Although both IHC and NanoString predicted BCR with a sensitivity of 71%, IHC predicted BCR with a specificity of 67%. When used together, the assays achieved a sensitivity of 76%, and a specificity of 69%, reaching a concordance of 94% (Figure 3B). When the NanoString Pan-ERG, qRT-PCR and IHC assays were used in combination, we were able to detect BCR with a sensitivity of 86%, albeit at a reduced specificity of 50%. The concordance among these three platforms for the detection of ERG is 62% (Figure 3C).
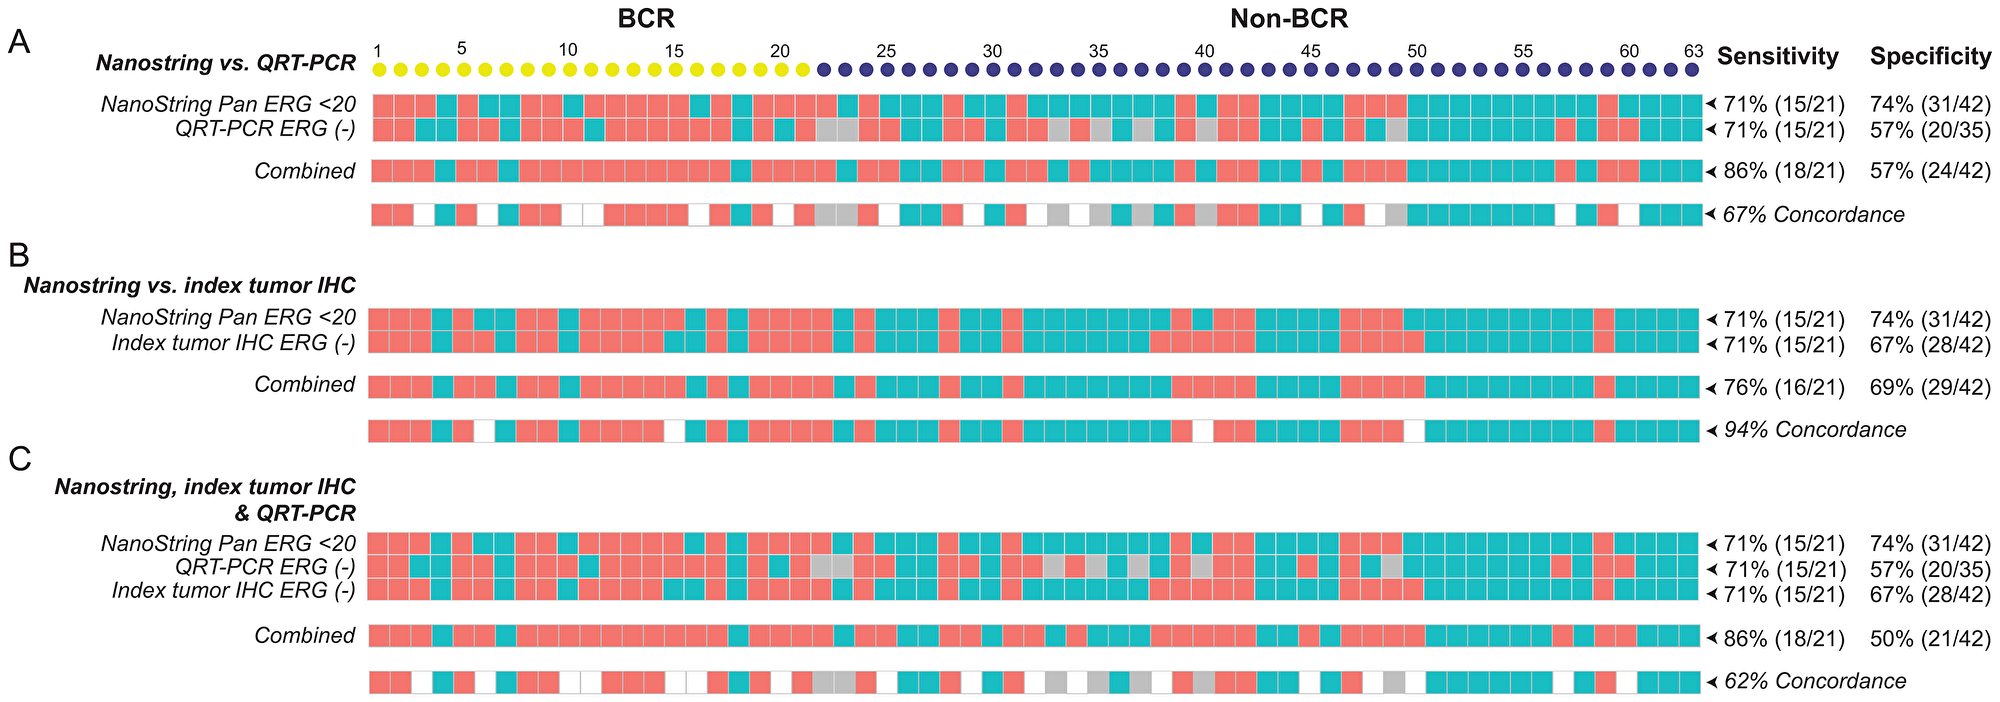
Figure 3: The sensitivity, specificity, and concordance for detecting BCR using NanoString, qRT-PCR, and IHC. The sensitivity and specificity, as well as concordance, for detecting BCR scored by using the NanoString Pan-ERG probe set was compared to that scored by qRT-PCR (A), and to ERG protein expression of the index tumor, assayed by IHC (B), and to results from both qRT-PCR and IHC assays (C). In NanoString, cases were scored as ERG negative when transcript count were < 20. In qRT-PCR, Cases with a threshold cycle of 45 or greater for ERG (Ct ERG ≥ 45) were scored as ERG negative and those with a threshold cycle of 38 or greater for GAPDH (Ct GAPDH ≥ 38) or had undetectable signals for GAPDH were considered as unevaluable (NA). Cases with. ERG negative is represented by salmon colored squares; ERG positive, teal colored squares; and values that are unavailable, grey colored squares.
Selection of a gene panel for the prediction of BCR
Using our customized NanoString CodeSet, we identified several genes that showed significant differential expression in prostate tumors between non-BCR and BCR cases (p < 0.05). As described earlier, the likelihood that these probe sets represent false positive events were excluded by adjusting for multiple-hypothesis testing. The sensitivity and specificity of the probe sets were then determined over the range of their transcript count and a cut-off value that prioritizes specificity over sensitivity is selected for each probe (Supplementary Figure 3). Using this procedure, we were able to establish a panel from individual probe sets that include Pan-ERG, HDAC1, KLK2, MYO6, GGT1, PLA2G7, CACNAID, and BICD1 in which the sensitivity of predicting BCR is improved by the addition of each probe set, without subtracting its overall specificity. This combined panel was able to predict BCR with a remarkable sensitivity of 90% and specificity of 71% (Figure 4). Taken together, the analysis of RNA transcripts from FFPE specimens by NanoString identified biomarkers that are differentially expressed during disease progression and therefore, may be useful as prognostic markers of prostate cancer progression.
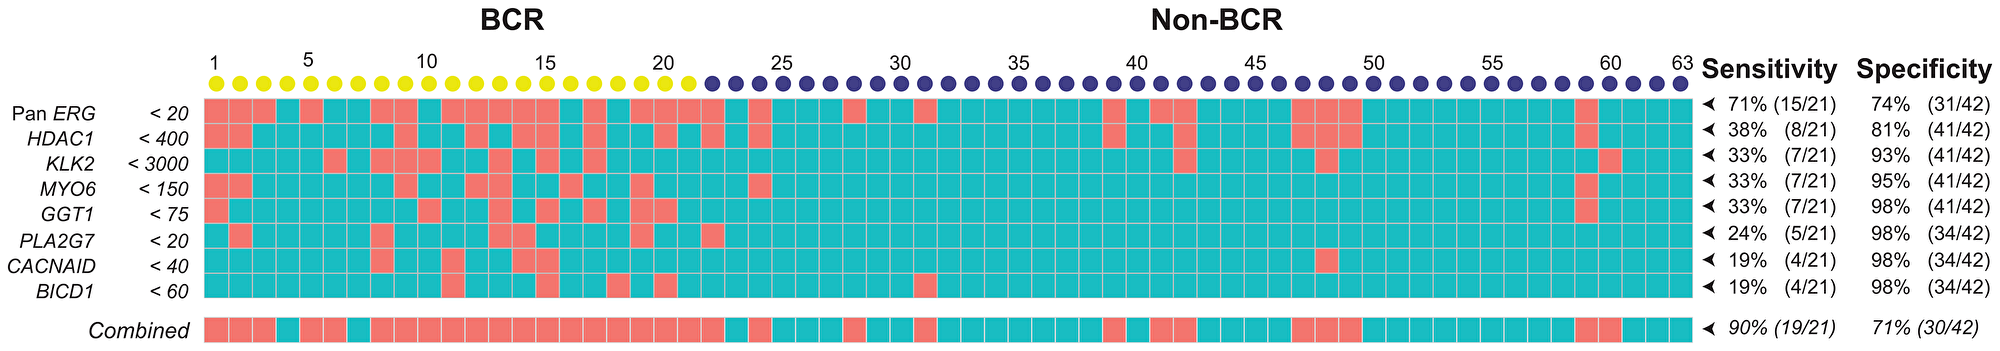
Figure 4: A gene panel for the prediction of BCR was selected based on significant differential expression in prostate tumors of non-BCR and BCR cases. The sensitivity and specificity of a NanoString gene panel consisting of Pan-ERG, HDAC1, KLK2, MYO6, GGT1, PLA2G7, CACNA1D, and BICD1 for BCR; Salmon and teal colored boxes indicate positive and negative scores for each gene, respectively, established based on the cutoff for NanoString transcript counts. Each column represents an RP specimen: yellow circles represent cases with BCR; blue circles, non-BCR.
DISCUSSION
Biomarkers that differentiate aggressive from indolent prostate cancer could be detected at the level of DNA, RNA (mRNA, miRNA and lncRNA), protein, lipid or metabolite [27, 32, 53, 77, 78]. In this study, we combined the enrichment of homogeneous cancer cells through microdissection and the analysis of RNA without amplification to identify differentially regulated genes in prostate tumors of non-BCR and BCR patients that could be used as prognostic biomarkers for progression to BCR. This is achieved by using a unique CodeSet of probes selected to target cancer, and prostate cancer associated genes or gene fusions on the NanoString nCounter platform. This technology, which can analyze up to 800 genes with digital precision [79], has been used to study gene expression in prostate cancer [23, 80, 81], and other malignancies [82–84].
A significant finding from our study is that the expression level of ERG, its variants and TMPRSS2-ERG fusion, serve as an independent predictor of BCR in patients with no pathological or clinical signs of progression at surgery. Despite variations in expression of ERG detected depending on the probe-set used, likely due to the differential level of splice variants present in tumor tissues, [27, 28], we observed a high concordance of over 95% among the ERG probe sets used. This is likely because aberrant ERG expression is dependent on the presence of an TMPRSS2-ERG fusion event. The detection of ERG expression in prostate tumors of non-BCR and BCR cases by NanoString assay was also corroborated by mRNA and protein expression analyses, using qRT-PCR and IHC, respectively. Evidently, the agreement for detecting ERG expression was higher between NanoString and IHC assays (94%) than between NanoString and qRT-PCR (67%). The agreement for detecting ERG expression using all three assays is 62%. These results highlight the limitation of a single biomarker, or platform to detect an event with certainty.
Although both qRT-PCR and NanoString assays detect mRNA the expression, detection of ERG transcript by qRT-PCR predicted BCR at a lower specificity (57% vs. 74%). This is likely due to differences in both the quantity of mRNA and the methods used for detecting mRNA expression between these assays: NanoString uses 500 ng of unamplified mRNA and measures transcripts that were bound to probe sets present in excess, while qRT-PCR PCR measures the amplified products from cDNA that were reverse transcribed from 10 ng of mRNA. Furthermore, the smaller amount of input mRNA in qRT-PCR assay may have contributed to the unevaluable cases in qRT-PCR. The lower specificity of IHC for predicting BCR compared to NanoString assay (67% vs. 74%) may arise from RNA splicing or gene fusion events in which the target epitope required for antibody detection in IHC were elided, even though proteins are better preserved compared to RNA in FFPE tissue specimens.
Our results showed that the sensitivity for predicting BCR could be improved when the assays of different modality were used together. Individually, the NanoString, qRT-PCR and IHC assay each predicted BCR with a sensitivity of 71%. When used in pairs, NanoString and qRT-PCR improved the sensitivity for BCR prediction to 86%, while NanoString and IHC assay predicted BCR with 76% sensitivity. Yet, the combined use of all three assays did not improve the sensitivity further, which suggests likely contribution of additional gene alterations to the development of BCR.
Recently, three studies evaluated the prognostic value of selected biomarkers for association with biochemical recurrence as an indicator for prostate cancer progression. Grosset and colleagues examined two tissue microarrays, representing test and validation cohorts, for the association of nuclear NF-kB p65 with BCR, development of bone metastasis and prostate cancer-specific death [85]. They showed, by multivariate analysis, that p65 nuclear localization was an independent predictor for BCR using continuous (Hazard ratio [HR] 1.03; 95% Confidence interval [CI] 1.02–1.04]; p < 0.001) and dichotomized (HR 1.60; 95% CI 1.32–1.94; p < 0.001) p65 expression data in the validation cohort. In another study, Li and colleagues examined the association between expression of Programmed Cell Death Protein 1 (PD1) and (Programmed Cell Death 1 Ligand 1) PD-L1 proteins with BCR in prostate cancer patients following adjuvant hormonal therapy (AHT) [86]. They reported that overexpression of PDL1 in high risk prostate cancer is significantly correlated with a shorter median time to BCR (p = 0.004) after AHT. Univariate analysis identified PDL1-high-expression (p < 0.001), and PDL1-high/PD1-negative expression (p < 0.001) to be significant risk factors of shorter progression time to BCR in localized disease. PDL1-high-expression was also an independent predictor of time to BCR in multivariate analysis (HR: 3.901; 95% CI: 1.287–11.824; p = 0.016). In a third study, Haddad et al. [87] compared the significance of either STAT5 nuclear localization or STAT5 locus amplification, or both, for predicting BCR after RP. The authors showed that positive status for both events was an independent predictor for shorter disease-free survival, by univariate analysis (p < 0.0001), and for BCR, by multivariate analysis (HR = 2.34; p = 0.014) after RP.
Several distinct features in our study set it apart from these three studies. Most importantly, the cohort of prostate cancer patients used in this study is ideal for identification of prognostic markers because they had low-risk disease (Gleason score 3+4 or lower) with no signs of future progression at the time of prostatectomy, were followed for many years after surgery and were classified as progressors versus non-progressors based on biochemical recurrence. In addition, the availability of whole mount prostatectomy specimens allowed us to isolate mRNA from tumor and normal cells of each specimen and compare their gene expression. Furthermore, while the racial or ethnic status of the patient cohort were not defined in these recently published studies, our study is based on a diverse patient cohort, consisting of approximately 70% CA and 30% AA patients. Moreover, in evaluating the predictive value of detecting ERG for BCR, our study we not only used the NanoString platform, but we compared it to IHC and qRT-PCR, whereas only IHC [85, 86] or IHC and FISH [87] were used in the other studies. Lastly, we evaluated a total of 121 genes or gene alteration events for association with progression to BCR while the other studies examined the association of either a single biomarker [85], or two interacting proteins [86], or protein expression and copy number amplification associated with a single gene [87].
Our finding on ERG and its variants as an independent predictor of BCR in this study is supported by earlier studies from our group and others [88, 89]. Our earlier study had confirmed that ERG expression is more frequent in prostate tumors of CA men in contrast to AA men (49.3% vs. 23.2%) and showed that ERG-negative status in index tumor predicted prostate cancer progression for CA patients by comparing ERG expression in whole-mounted prostate sections from a cohort of 930 patients (336 AA and 594 CA men, [88]. Other studies reported that TMPRSS2-ERG fusion or ERG expression are either correlated with progression [90–92] or had no correlation with progression [93–97], after radical prostatectomy. A likely source of this discrepancy is the sampling of prostate tissue specimen examined. Unlike the whole-mounted sections used in this study, which enabled us to assess the multifocal nature of the disease, the other studies examined sections of tissue cores on tissue microarrays [92, 93, 95, 96], biopsies (e.g. trans-rectal ultrasound-guided prostate biopsies) [97] or surgically removed frozen tumors [94], in which tumors with ERG expression or fusion events are likely to be absent or underrepresented. Furthermore, intra-tumor differences in ERG alterations may lead to expression of ERG variants, which could be further exacerbated by inter-tumor heterogeneity [98, 99]. Although fusion of the AR regulated TMPRSS2 promoter to ETS related gene (ERG) that results in ERG overexpression [25, 26] is a common event in CA prostate cancer patients (50–70%), it is less frequent among AA and other ethnic groups [100–103]. In these populations, the detection of ERG may no longer be significant as prognostic biomarker for progression to BCR. This emphasizes the need for additional biomarkers that can identify prostate cancer patients with an aggressive disease across populations of diverse ancestries. The detection of ERG expression is, however, especially useful to identify subgroups of patients in which another gene alteration becomes particularly prognostic. For example, in a subgroup of patients with castrate resistant prostate cancer, tumors with ERG-rearrangement but no detectable ERG protein expression may indicate a non-functional AR pathway, suggesting that these patients may not benefit from therapy directed against the AR pathway [104]. Likewise, in subsets of prostate cancer patients with ERG fusion negative, increased expression of PHH3 and Ki-67 [105] or PTEN deletion [106], are associated with increased risk of lethal progression.
Interestingly, evaluation of genes expression ratio between tumor vs. normal tissues of non-BCR and BCR prostate cancer patients identified significantly lower tumor vs. normal ratios for ERG variants and TMPRSS2-ERG fusion transcripts, as well as for TP53, HDAC1, and PTEN in BCR cases. In contrast, NCOA2, VEGFA, ACPP, KLF4, and TMPRSS2 had significantly higher tumor vs. normal ratio in BCR cases. After controlling for false discovery rates, we conclude that only HDAC1 and TP53 have tumor vs. normal ratio between non-BCR and BCR patients that were true positives. Since there were more high confidence genes that were differentially expressed in the tumors between non-BCR and BCR patients, we focused on these genes in our evaluation for a multigene panel.
In addition to the discovery that ERG was the strongest predictor for BCR, we detected seven additional genes, GGT1, HDAC1, KLK2, MYO6, PLA2G7, BICD1, and CACNAID, which were differentially expressed between non-BCR and BCR prostate cancers and could independently predict BCR in patients without early clinical or pathological signs of progression at surgery. Due to the diverse pathologic features of prostate cancer that range from indolent to metastatic disease, multi-biomarker panels are proven to be more useful for predicting progression than using a single biomarker [14–16, 107]. We evaluated the predictive power of a multi-gene panel for BCR by incorporating the differentially expressed genes that we identified. Together this panel was able to predict BCR with a sensitivity of 90% and specificity of 71%. Further evaluation of these markers using the NanoString assay would benefit from using a larger patient cohort. The assay could be further improved with re-designed CodeSet with probe sets for novel targets, including those that identify tumor heterogeneity, immune response, or actionable gene alterations.
Materials and Methods
Study design and study subjects
In this retrospective cohort study specimens were collected from RP patients who provided written consent under protocols (#393738, #GT90CM/385525 and #908925) approved by the Institutional Review Boards of the Walter Reed National Military Medical Center (WRNMMC) and the Uniformed Services University of the Health Sciences (USUHS). Specifically, subjects with no BCR were required to have at least 60 months of follow-up (median = 97.4 months); and subjects with BCR, to be event-free for at least 12 months. A BCR event was defined as the detection of at least two consecutive values of serum PSA ≥ 0.2 ng/ml, at ≥8 weeks after RP. Patients who developed BCR were matched to those with no evidence of BCR on both pathologic stage and grade. Patients whose PSA values at diagnosis was ≥20 ng/mL were excluded from both the BCR and non-BCR groups. The clinical characteristics of the patients are shown in Table 1. Of the prostate cancer patients, 21 were classified as individuals with disease progression based on BCR and 42 patients were classified as non-BCR. All cases had a low-grade disease (Gleason pattern 3+3 or 3+4) with no signs of future progression (no positive margins, no extracapsular-extension [ECE] and no seminal vesicle invasion [SVI]). There is no significant difference in other potential prostate cancer recurrence factors such as age, race, pre-surgery PSA level and prostate weight between BCR and non-BCR patients.
Biospecimen processing and exclusions
Centralized pathology review was conducted by a single genitourinary pathologist at the Joint Pathology Center (formerly the Armed Forces Institute of Pathology) on specimens prepared using a standard whole-mounting technique [99]. Briefly, each prostate was formalin fixed, paraffin embedded, and sectioned at 2.0 µm intervals before mounting whole sections on slides. Each patient specimen was analyzed for Gleason score, perineural involvement, pathologic stage, tumor location, ECE, SVI, tumor volume, and surgical margin status, including the presence of benign glands at the margin. Patients whose pathology review revealed any of the following were excluded from the study: Gleason 8 to10, pT stage 3b to 4, positive surgical margins, nodal involvement, ECE or SVI.
Improved membrane-frame slide based manual tissue microdissection
Laser capture microdissection (LCM) is routinely used to obtain cells from FFPE tissue sections [108]. To obtain the quantity of RNA sufficient for NanoString analysis, we improved on existing manual microdissection techniques [99] by incorporating a membrane-frame slide to create a “slide-sandwich” (Supplementary Figure 1A). The presence of epithelial cells in histologically defined, matched normal and tumor tissues were first verified by hematoxylin and eosin (H&E) staining. Prior to microdissection, consecutive sections of 7 µm thickness were cut from FFPE tissue blocks in an RNase free environment and mounted onto the “well” side of an RNase AWAY treated poly-ethylene napthalate (PEN) membrane frame slide (ASEE, Cat#DFS-T3-LMD-S-50). After drying, the slides were deparaffinized, stained with Paradise PLUS (developed by Arcturus for staining FFPE tissues), before proceeding with manual microdissection. To avoid introducing potential contamination, the corresponding H&E “guide-slide” is placed onto the “well” side of the membrane-frame dissecting slide. Markings from H&E slide is then transferred to a clean glass slide, which was then placed below the membrane slide to provide support and to guide the dissection. Stromal cells within the targeted area were first removed under 4x objective. Target cells were then excised with a surgical blade by cutting along the periphery enclosing the region of interest and transferred to a new tube (Supplementary Figure 1B).
RNA isolation and assessment
Total RNA of both tumor and corresponding normal epithelial cells was extracted from micro-dissected FFPE samples using the RNeasy FFPE kit (Qiagen). RNA was separated on the Agilent 2100 Bioanalyzer. RNA quality, as reflected by the RNA Integrity Number (RIN), was evaluated by smear analysis, which assessed the proportion of RNA ≥100 and ≥300 nucleotides (nt) using the Agilent 2100 Expert Software (Supplementary Table 1). Optimization of our RNA isolation steps revealed that RNA quality was better preserved, less fragmented, and gave higher yield when isolated from sections that are freshly recut from archived FFPE blocks, in comparison to RNA that were stored for a week at -80°C following isolation (Supplementary Figure 2A). RNA quality was better preserved by shorter Proteinase K digestion at 56°C of 30 minutes (Supplementary Figure 2B). In a pilot study that compared the yield of RNA isolated from LCM, optimized manual microdissection, and scraping methods were found to have comparable yields (Supplementary Figure 2C).
NanoString CodeSet design
To identify gene expression associated with prostate cancer outcome, we designed NanoString CodeSet panel consisting of 151 probe sets. The panel was designed to detect 135 target transcripts, which were compiled from 34 genes implicated in or associated with prostate cancer progression, 27 prostate cancer specific gene fusions, 25 cancer associated genes, five genes encoding the ETS-family of transcription factors and genes over-expressed (27) or under-expressed (17) in prostate cancer compared to matched benign epithelium. In addition, five prostate stroma or epithelium specific genes were selected as control and 11 housekeeping genes were included for biological normalization (Table 2). Probe sets of 100 bp in length for each gene, which consisted of one capture probe linked to biotin and one reporter probe attached to a color-coded molecular tag, were designed and synthesized at NanoString Technologies (Supplementary Table 2).
NanoString nCounter analysis
To minimize system derived inter-batch differences, each sample from a BCR patient was assayed together with samples from two non-BCR cases. Hybridization and NanoString nCounter analysis were performed according to the manufacturer’s protocol [82, 109]. Briefly, hybridizations were carried out at 65°C for 20 hours after mixing 5 μL of sample with 10 μL NanoString nCounter reporter probe, 10 μL hybridization buffer and 5 μL capture probe. Hybridization products were then applied to the nCounter Preparation Station for automated removal of excess probe and immobilization of probe-transcript complexes on a streptavidin-coated cartridge. Counts of specific barcodes for individual probe sets were collected using the nCounter Digital Analyzer, and analyzed using the nSolver Analysis Software (Version 2.1.1), available at https://www.nanostring.com/products/analysis-software/nsolver. All 126 samples, (63 tumors and 63 matched benign epithelium), passed quality control metrics for control spike linearity (R2 > 0.95) and sensitivity (control spike detection at 0.5 fM). Raw data were normalized against the geometric mean of spiked-in exogenous positive controls to correct the difference resulting from assay efficiency (hybridization, purification, and binding), against the geometric mean of 11 housekeeping genes, which cover a range of constitutive expression levels, to account for variation in the samples, and against spiked-in negative controls to remove hybridization background. All signals below mean background plus two standard deviations were considered as hybridization background and subtracted from the raw data.
Quantitative RT-PCR (qRT-PCR)
cDNA was reverse transcribed from 10 ng of FFPE derived RNA using gene specific primer pool (GSP) of custom designed reverse primers using Omniscript RT Kit (Qiagen Inc., Germantown, MD) Reverse transcription reactions were performed at 37°C for 60 min followed by 93°C for 5 min, and then held at 10°C. cDNA was preamplified with gene specific primers for ERG and Glyceraldehyde 3-phosphate dehydrogenase (GAPDH) for eight cycles using the TaqMan® PreAmp Master Mix (Applied Biosystems, CA). Preamplification products were diluted 1:5 and mRNA analysis was performed by TaqMan based qRT-PCR on Stratagene Mx3005P (Agilent Technology, Santa Clara, CA). The forward and reverse primers, and the TaqMan probe for ERG are 5′-CAGTATATCCTGAAGCTACGCA AAGA-3′, 5′-GGTCCAGGCTGATCTCCT-3′, and 6FAM-5′-ACTAGGCCAGATTTACCA-3′-TAMRA, respectively. The forward and reverse primers, and the TaqMan probe for GAPDH, which was used as internal control are 5′-GAGCCACATCGCCTCAGACACC-3′, 5′-AGAGTTAAAAGCAGCCCTG GTGAC-3′, and [JOE]-ACGACCAAATCCGTTGACTC-TAMRA, respectively. The PCR cycle conditions included an incubation at 55°C for 2 min, a denaturation at 95°C for 10 min, and 50 cycles of 95°C for 30 sec, 56°C for 1 min, and 72°C for 1 min. mRNA expression was analyzed according to relative quantification method, as ΔCt (difference in threshold cycle) = Ct GAPDH – Ct ERG. Fold difference between GAPDH control and ERG was calculated as 2ΔCT = 2^(ΔCt GAPDH − ΔCt ERG) (Supplementary Table 3). Cases with threshold cycle of 38 or greater for GAPDH (Ct GAPDH ≥ 38) or had undetectable signals for GAPDH were considered unevaluable (NA). Cases with threshold cycle of 45 or greater for ERG (Ct ERG ≥ 45) were scored as ERG negative.
Immunohistochemistry assay for ERG
Evaluation of the ERG oncoprotein expression in prostate tissues was performed as previously described [110]. Following deparaffinization, 4 μm sections were dehydrated and blocked in 0.6% hydrogen peroxide in methanol for 20 min. Sections were processed for antigen retrieval in EDTA (pH 9.0) for 30 min in a microwave, followed by 30 min of cooling in EDTA buffer. Sections were then blocked in 1% horse serum for 40 min and incubated with the mouse ERG-MAb (9FY) monoclonal antibody (Biocare Medical Inc., Pacheco, CA) at a dilution of 1:1280 for 60 min at room temperature. Sections were incubated with the biotinylated horse anti-mouse antibody at a dilution of 1:200 for 30 min followed by treatment with the ABC Kit for 30 min, and color was developed by VIP treatment for 5 min using reagents from Vector Laboratories (Burlingame, CA) before they were counterstained by hematoxylin. ERG expression was reported as positive or negative within the specimen. Positive ERG staining of endothelial cells in specimens served as built-in control for the assay.
Statistical analysis
Normalized raw data were applied for further statistical analysis. NanoString data were analyzed by using the Significance Analysis of Microarray (SAM) tools. Statistical analyses were performed using SAS version 9.3 (SAS Institute, Cary, NC). All p values were compared using two-sided statistical tests (summary alpha = 0.05). P values for differential expression were used to correct for multiple hypothesis testing using the Storey–Tibshirani method [75] and to identify probe sets that detected statistically significant difference in mRNA expression between Non-BCR and BCR. False discovery rate or q-values were computed using the q value Bioconductor package [111] in R programming language. In the analyses for differentially expression between Non-BCR and BCR cases in tumor specimens alone, probe sets with q-values less than at 0.075 were considered significant. Meanwhile, in the analyses for differential tumor vs. normal ratios between Non-BCR and BCR cases, probe sets with q-values less than at 0.085 were considered significant. R 3.6 software [112] was used to present the differential transcript counts as boxplots using the ggplot2 [113] and ggpubr [114] packages.
Conclusions
An unmet challenge in prostate cancer is the identification of biomarkers for early detection of aggressive disease. Effective biomarkers with high specificity will provide early treatment options for high risk patients. Using BCR as the endpoint, we analyzed RNA from RP specimens of prostate cancer patients with low Gleason score and show no signs of progression at surgery by using the NanoString platform. ERG mRNA expression level, evaluated by NanoString, qRT-PCR, and IHC, was identified as an independent predictor of prostate cancer progression. In addition, seven other genes, GGT1, HDAC1, KLK2, MYO6, PLA2G7, BICD1, and CACNAID, were found to be differentially expressed in prostate tumors of non-BCR and BCR patients. The tumor vs. normal ratios of ERG, TP53 and HDAC1 expression in prostate tumors of non-BCR and BCR patients were also found to be significant. Our study, together with publications from other laboratories, highlight the potential of using FFPE tissue as a source for the analysis of prognostic biomarkers for prostate cancer.
Abbreviations
BCR: Biochemical recurrence; DRE: digital rectal exam; ECE: extracapsular-extension; FFPE: Formalin-fixed-paraffin embedded; H&E: Hematoxylin and eosin; LCM: laser-capture-micro-dissection; MAb: monoclonal antibody; PEN: poly-ethylene napthalate; RIN: RNA Integrity Number; RP: radical prostatectomy; RT-PCR: real-time polymerase chain reaction; SAM: Significance Analysis of Microarray; SVI: seminal vesicle invasion.
CONFLICTS OF INTEREST
S.S, A.D., and ST., are inventors of the ERG monoclonal antibody (9FY) that is licensed to Biocare Medical by The Henry M. Jackson Foundation for the Advancement of Military Medicine. The other authors declare no competing interests.
FUNDING
This study was supported by the Center for Prostate Disease Research, Uniformed Services University Grant HU0001-10-2-0002 to I. L. R., the NCI/EDRN Inter-Agency Agreement ACN12011-001-0 to S.S. and the National Cancer Institute RO1CA162383 to S.S.
Disclaimer
The contents of this publication are the sole responsibility of the author(s) and do not necessarily reflect the views, opinions or policies of the Henry M. Jackson Foundation for the Advancement of Military Medicine, Inc., the Uniformed Services University of the Health Sciences (USUHS), the Departments of the Army, the Department of Defense (DoD), or any other agency of the U.S. Government. The mention of trade names, specific commercial products, scientific instrumentation, or organizations is considered an integral part of the scientific endeavor and does not constitute endorsement or implied endorsement on the part of the author, DoD, or any component agency.
References
1. Siegel RL, Miller KD, Jemal A. Cancer statistics, 2019. CA Cancer J Clin. 2019; 69:7–34. https://doi.org/10.3322/caac.21551. [PubMed].
2. Fraser M, Berlin A, Bristow RG, van der Kwast T. Genomic, pathological, and clinical heterogeneity as drivers of personalized medicine in prostate cancer. Urol Oncol. 2015; 33:85–94. https://doi.org/10.1016/j.urolonc.2013.10.020. [PubMed].
3. DeSantis CE, Miller KD, Goding Sauer A, Jemal A, Siegel RL. Cancer statistics for African Americans, 2019. CA Cancer J Clin. 2019; 69:211–233. https://doi.org/10.3322/caac.21555. [PubMed].
4. Hendriks RJ, van Oort IM, Schalken JA. Blood-based and urinary prostate cancer biomarkers: a review and comparison of novel biomarkers for detection and treatment decisions. Prostate Cancer Prostatic Dis. 2017; 20:12–19. https://doi.org/10.1038/pcan.2016.59. [PubMed].
5. McGrath S, Christidis D, Perera M, Hong SK, Manning T, Vela I, Lawrentschuk N. Prostate cancer biomarkers: Are we hitting the mark? Prostate Int. 2016; 4:130–135. https://doi.org/10.1016/j.prnil.2016.07.002. [PubMed].
6. Robinson JG, Hodges EA, Davison J. Prostate-specific antigen screening: a critical review of current research and guidelines. J Am Assoc Nurse Pract. 2014; 26:574–581. https://doi.org/10.1002/2327-6924.12094. [PubMed].
7. Stark JR, Mucci L, Rothman KJ, Adami HO. Screening for prostate cancer remains controversial. BMJ. 2009; 339:b3601. https://doi.org/10.1136/bmj.b3601. [PubMed].
8. Miller AB. New data on prostate-cancer mortality after PSA screening. N Engl J Med. 2012; 366:1047–1048. https://doi.org/10.1056/nejme1200185. [PubMed].
9. Schroder FH, Hugosson J, Roobol MJ, Tammela TL, Ciatto S, Nelen V, Kwiatkowski M, Lujan M, Lilja H, Zappa M, Denis LJ, Recker F, Berenguer A, et al. Screening and prostate-cancer mortality in a randomized European study. N Engl J Med. 2009; 360:1320–1328. https://doi.org/10.1056/nejmoa0810084. [PubMed].
10. Moyer VA. Screening for prostate cancer: U.S. Preventive Services Task Force recommendation statement. Ann Intern Med. 2012; 157:120–134. https://doi.org/10.7326/0003-4819-157-2-201207170-00459. [PubMed].
11. Bibbins-Domingo K, Grossman DC, Curry SJ. The US Preventive Services Task Force 2017 Draft Recommendation Statement on Screening for Prostate Cancer: An Invitation to Review and Comment. JAMA. 2017; 317:1949–1950. https://doi.org/10.1001/jama.2017.4413. [PubMed].
12. Popiolek M, Rider JR, Andren O, Andersson SO, Holmberg L, Adami HO, Johansson JE. Natural history of early, localized prostate cancer: a final report from three decades of follow-up. Eur Urol. 2013; 63:428–435. https://doi.org/10.1016/j.eururo.2012.10.002. [PubMed].
13. Stephenson AJ, Scardino PT, Eastham JA, Bianco FJ Jr, Dotan ZA, DiBlasio CJ, Reuther A, Klein EA, Kattan MW. Postoperative nomogram predicting the 10-year probability of prostate cancer recurrence after radical prostatectomy. J Clin Oncol. 2005; 23:7005–7012. https://doi.org/10.1200/JCO.2005.01.867. [PubMed].
14. Cuzick J, Swanson GP, Fisher G, Brothman AR, Berney DM, Reid JE, Mesher D, Speights VO, Stankiewicz E, Foster CS, Moller H, Scardino P, Warren JD, et al. Prognostic value of an RNA expression signature derived from cell cycle proliferation genes in patients with prostate cancer: a retrospective study. Lancet Oncol. 2011; 12:245–255. https://doi.org/10.1016/S1470-2045(10)70295-3. [PubMed].
15. Klein EA, Cooperberg MR, Magi-Galluzzi C, Simko JP, Falzarano SM, Maddala T, Chan JM, Li J, Cowan JE, Tsiatis AC, Cherbavaz DB, Pelham RJ, Tenggara-Hunter I, et al. A 17-gene assay to predict prostate cancer aggressiveness in the context of Gleason grade heterogeneity, tumor multifocality, and biopsy undersampling. Eur Urol. 2014; 66:550–560. https://doi.org/10.1016/j.eururo.2014.05.004. [PubMed].
16. Erho N, Crisan A, Vergara IA, Mitra AP, Ghadessi M, Buerki C, Bergstralh EJ, Kollmeyer T, Fink S, Haddad Z, Zimmermann B, Sierocinski T, Ballman KV, et al. Discovery and validation of a prostate cancer genomic classifier that predicts early metastasis following radical prostatectomy. PLoS One. 2013; 8:e66855. https://doi.org/10.1371/journal.pone.0066855. [PubMed].
17. Alford AV, Brito JM, Yadav KK, Yadav SS, Tewari AK, Renzulli J. The Use of Biomarkers in Prostate Cancer Screening and Treatment. Rev Urol. 2017; 19:221–234. [PubMed].
18. Cucchiara V, Cooperberg MR, Dall’Era M, Lin DW, Montorsi F, Schalken JA, Evans CP. Genomic Markers in Prostate Cancer Decision Making. Eur Urol. 2018; 73:572–582. https://doi.org/10.1016/j.eururo.2017.10.036. [PubMed].
19. Kohaar I, Petrovics G, Srivastava S. A Rich Array of Prostate Cancer Molecular Biomarkers: Opportunities and Challenges. Int J Mol Sci. 2019; 20. https://doi.org/10.3390/ijms20081813. [PubMed].
20. Moschini M, Spahn M, Mattei A, Cheville J, Karnes RJ. Incorporation of tissue-based genomic biomarkers into localized prostate cancer clinics. BMC Med. 2016; 14:67. https://doi.org/10.1186/s12916-016-0613-7. [PubMed].
21. Cullen J, Rosner IL, Brand TC, Zhang N, Tsiatis AC, Moncur J, Ali A, Chen Y, Knezevic D, Maddala T, Lawrence HJ, Febbo PG, Srivastava S, et al. A Biopsy-based 17-gene Genomic Prostate Score Predicts Recurrence After Radical Prostatectomy and Adverse Surgical Pathology in a Racially Diverse Population of Men with Clinically Low- and Intermediate-risk Prostate Cancer. Eur Urol. 2015; 68:123–131. https://doi.org/10.1016/j.eururo.2014.11.030. [PubMed].
22. Geiss GK, Bumgarner RE, Birditt B, Dahl T, Dowidar N, Dunaway DL, Fell HP, Ferree S, George RD, Grogan T, James JJ, Maysuria M, Mitton JD, et al. Direct multiplexed measurement of gene expression with color-coded probe pairs. Nat Biotechnol. 2008; 26:317–325. https://doi.org/10.1038/nbt1385. [PubMed].
23. Quek SI, Ho ME, Loprieno MA, Ellis WJ, Elliott N, Liu AY. A multiplex assay to measure RNA transcripts of prostate cancer in urine. PLoS One. 2012; 7:e45656. https://doi.org/10.1371/journal.pone.0045656. [PubMed].
24. Derosa CA, Furusato B, Shaheduzzaman S, Srikantan V, Wang Z, Chen Y, Seifert M, Ravindranath L, Young D, Nau M, Dobi A, Werner T, McLeod DG, et al. Elevated osteonectin/SPARC expression in primary prostate cancer predicts metastatic progression. Prostate Cancer Prostatic Dis. 2012; 15:150–156. https://doi.org/10.1038/pcan.2011.61. [PubMed].
25. Petrovics G, Liu A, Shaheduzzaman S, Furusato B, Sun C, Chen Y, Nau M, Ravindranath L, Dobi A, Srikantan V, Sesterhenn IA, McLeod DG, Vahey M, et al. Frequent overexpression of ETS-related gene-1 (ERG1) in prostate cancer transcriptome. Oncogene. 2005; 24:3847–3852. https://doi.org/10.1038/sj.onc.1208518. [PubMed].
26. Tomlins SA, Rhodes DR, Perner S, Dhanasekaran SM, Mehra R, Sun XW, Varambally S, Cao X, Tchinda J, Kuefer R, Lee C, Montie JE, Shah RB, et al. Recurrent fusion of TMPRSS2 and ETS transcription factor genes in prostate cancer. Science. 2005; 310:644–648. https://doi.org/10.1126/science.1117679. [PubMed].
27. Hu Y, Dobi A, Sreenath T, Cook C, Tadase AY, Ravindranath L, Cullen J, Furusato B, Chen Y, Thangapazham RL, Mohamed A, Sun C, Sesterhenn IA, et al. Delineation of TMPRSS2-ERG splice variants in prostate cancer. Clin Cancer Res. 2008; 14:4719–4725. https://doi.org/10.1158/1078-0432.CCR-08-0531. [PubMed].
28. Rastogi A, Tan SH, Mohamed AA, Chen Y, Hu Y, Petrovics G, Sreenath T, Kagan J, Srivastava S, McLeod DG, Sesterhenn IA, Dobi A, Srinivasan A. Functional antagonism of TMPRSS2-ERG splice variants in prostate cancer. Genes Cancer. 2014; 5:273–284. https://doi.org/10.18632/genesandcancer.25. [PubMed].
29. Griner NB, Young D, Chaudhary P, Mohamed AA, Huang W, Chen Y, Sreenath T, Dobi A, Petrovics G, Vishwanatha JK, Sesterhenn IA, Srivastava S, Tan SH. ERG oncoprotein inhibits ANXA2 expression and function in prostate cancer. Mol Cancer Res. 2015; 13:368–379. https://doi.org/10.1158/1541-7786.MCR-14-0275-T. [PubMed].
30. Yee DS, Narula N, Ramzy I, Boker J, Ahlering TE, Skarecky DW, Ornstein DK. Reduced annexin II protein expression in high-grade prostatic intraepithelial neoplasia and prostate cancer. Arch Pathol Lab Med. 2007; 131:902–908. [PubMed].
31. Demichelis F, Setlur SR, Beroukhim R, Perner S, Korbel JO, Lafargue CJ, Pflueger D, Pina C, Hofer MD, Sboner A, Svensson MA, Rickman DS, Urban A, et al. Distinct genomic aberrations associated with ERG rearranged prostate cancer. Genes Chromosomes Cancer. 2009; 48:366–380. https://doi.org/10.1002/gcc.20647. [PubMed].
32. Tan SH, Furusato B, Fang X, He F, Mohamed AA, Griner NB, Sood K, Saxena S, Katta S, Young D, Chen Y, Sreenath T, Petrovics G, et al. Evaluation of ERG responsive proteome in prostate cancer. Prostate. 2014; 74:70–89. https://doi.org/10.1002/pros.22731. [PubMed].
33. Wu JB, Shao C, Li X, Li Q, Hu P, Shi C, Li Y, Chen YT, Yin F, Liao CP, Stiles BL, Zhau HE, Shih JC, et al. Monoamine oxidase A mediates prostate tumorigenesis and cancer metastasis. J Clin Invest. 2014; 124:2891–2908. https://doi.org/10.1172/jci70982. [PubMed].
34. Evans AJ. Alpha-methylacyl CoA racemase (P504S): overview and potential uses in diagnostic pathology as applied to prostate needle biopsies. J Clin Pathol. 2003; 56:892–897. https://doi.org/10.1136/jcp.56.12.892. [PubMed].
35. Zha S, Ferdinandusse S, Denis S, Wanders RJ, Ewing CM, Luo J, De Marzo AM, Isaacs WB. Alpha-methylacyl-CoA racemase as an androgen-independent growth modifier in prostate cancer. Cancer Res. 2003; 63:7365–7376. [PubMed].
36. Wang J, Weng J, Cai Y, Penland R, Liu M, Ittmann M. The prostate-specific G-protein coupled receptors PSGR, PSGR2 are prostate cancer biomarkers that are complementary to alpha-methylacyl-CoA racemase. Prostate. 2006; 66:847–857. https://doi.org/10.1002/pros.20389. [PubMed].
37. Xu LL, Stackhouse BG, Florence K, Zhang W, Shanmugam N, Sesterhenn IA, Zou Z, Srikantan V, Augustus M, Roschke V, Carter K, McLeod DG, Moul JW, et al. PSGR, a novel prostate-specific gene with homology to a G protein-coupled receptor, is overexpressed in prostate cancer. Cancer Res. 2000; 60:6568–6572. [PubMed].
38. Petrovics G, Zhang W, Makarem M, Street JP, Connelly R, Sun L, Sesterhenn IA, Srikantan V, Moul JW, Srivastava S. Elevated expression of PCGEM1, a prostate-specific gene with cell growth-promoting function, is associated with high-risk prostate cancer patients. Oncogene. 2004; 23:605–611. https://doi.org/10.1038/sj.onc.1207069. [PubMed].
39. Hirsch GE, Parisi MM, Martins LA, Andrade CM, Barbe-Tuana FM, Guma FT. γ-Oryzanol reduces caveolin-1 and PCGEM1 expression, markers of aggressiveness in prostate cancer cell lines. Prostate. 2015; 75:783–797. https://doi.org/10.1002/pros.22960. [PubMed].
40. Li H, Xu LL, Masuda K, Raymundo E, McLeod DG, Dobi A, Srivastava S. A feedback loop between the androgen receptor and a NEDD4-binding protein, PMEPA1, in prostate cancer cells. J Biol Chem. 2008; 283:28988–28995. https://doi.org/10.1074/jbc.M710528200. [PubMed].
41. Xu LL, Shi Y, Petrovics G, Sun C, Makarem M, Zhang W, Sesterhenn IA, McLeod DG, Sun L, Moul JW, Srivastava S. PMEPA1, an androgen-regulated NEDD4-binding protein, exhibits cell growth inhibitory function and decreased expression during prostate cancer progression. Cancer Res. 2003; 63:4299–4304. [PubMed].
42. Bowen C, Bubendorf L, Voeller HJ, Slack R, Willi N, Sauter G, Gasser TC, Koivisto P, Lack EE, Kononen J, Kallioniemi OP, Gelmann EP. Loss of NKX3.1 expression in human prostate cancers correlates with tumor progression. Cancer Res. 2000; 60:6111–6115. [PubMed].
43. Thangapazham R, Saenz F, Katta S, Mohamed AA, Tan SH, Petrovics G, Srivastava S, Dobi A. Loss of the NKX3.1 tumorsuppressor promotes the TMPRSS2-ERG fusion gene expression in prostate cancer. BMC Cancer. 2014; 14:16. https://doi.org/10.1186/1471-2407-14-16. [PubMed].
44. Walsh PC. High level of androgen receptor is associated with aggressive clinicopathologic features and decreased biochemical recurrence-free survival in prostate. Cancer patients treated with radical prostatectomy. J Urol. 2005; 173:1967–1968. https://doi.org/10.1016/s0022-5347(05)60189-9. [PubMed].
45. Diallo JS, Aldejmah A, Mouhim AF, Fahmy MA, Koumakpayi IH, Sircar K, Begin LR, Mes-Masson AM, Saad F. Co-assessment of cytoplasmic and nuclear androgen receptor location in prostate specimens: potential implications for prostate cancer development and prognosis. BJU Int. 2008; 101:1302–1309. https://doi.org/10.1111/j.1464-410X.2008.07514.x. [PubMed].
46. Bachmann IM, Halvorsen OJ, Collett K, Stefansson IM, Straume O, Haukaas SA, Salvesen HB, Otte AP, Akslen LA. EZH2 expression is associated with high proliferation rate and aggressive tumor subgroups in cutaneous melanoma and cancers of the endometrium, prostate, and breast. J Clin Oncol. 2006; 24:268–273. https://doi.org/10.1200/JCO.2005.01.5180. [PubMed].
47. Varambally S, Dhanasekaran SM, Zhou M, Barrette TR, Kumar-Sinha C, Sanda MG, Ghosh D, Pienta KJ, Sewalt RG, Otte AP, Rubin MA, Chinnaiyan AM. The polycomb group protein EZH2 is involved in progression of prostate cancer. Nature. 2002; 419:624–629. https://doi.org/10.1038/nature01075. [PubMed].
48. Hawksworth D, Ravindranath L, Chen Y, Furusato B, Sesterhenn IA, McLeod DG, Srivastava S, Petrovics G. Overexpression of C-MYC oncogene in prostate cancer predicts biochemical recurrence. Prostate Cancer Prostatic Dis. 2010; 13:311–315. https://doi.org/10.1038/pcan.2010.31. [PubMed].
49. Wang J, Kobayashi T, Floc’h N, Kinkade CW, Aytes A, Dankort D, Lefebvre C, Mitrofanova A, Cardiff RD, McMahon M, Califano A, Shen MM, Abate-Shen C. B-Raf activation cooperates with PTEN loss to drive c-Myc expression in advanced prostate cancer. Cancer Res. 2012; 72:4765–4776. https://doi.org/10.1158/0008-5472.CAN-12-0820. [PubMed].
50. Whang YE, Wu X, Suzuki H, Reiter RE, Tran C, Vessella RL, Said JW, Isaacs WB, Sawyers CL. Inactivation of the tumor suppressor PTEN/MMAC1 in advanced human prostate cancer through loss of expression. Proc Natl Acad Sci U S A. 1998; 95:5246–5250. https://doi.org/10.1073/pnas.95.9.5246. [PubMed].
51. Wang SI, Parsons R, Ittmann M. Homozygous deletion of the PTEN tumor suppressor gene in a subset of prostate adenocarcinomas. Clin Cancer Res. 1998; 4:811–815. [PubMed].
52. Culig Z, Comuzzi B, Steiner H, Bartsch G, Hobisch A. Expression and function of androgen receptor coactivators in prostate cancer. J Steroid Biochem Mol Biol. 2004; 92:265–271. https://doi.org/10.1016/j.jsbmb.2004.10.003. [PubMed].
53. Taylor BS, Schultz N, Hieronymus H, Gopalan A, Xiao Y, Carver BS, Arora VK, Kaushik P, Cerami E, Reva B, Antipin Y, Mitsiades N, Landers T, et al. Integrative genomic profiling of human prostate cancer. Cancer Cell. 2010; 18:11–22. https://doi.org/10.1016/j.ccr.2010.05.026. [PubMed].
54. Kunderfranco P, Mello-Grand M, Cangemi R, Pellini S, Mensah A, Albertini V, Malek A, Chiorino G, Catapano CV, Carbone GM. ETS transcription factors control transcription of EZH2 and epigenetic silencing of the tumor suppressor gene Nkx3.1 in prostate cancer. PLoS One. 2010; 5:e10547. https://doi.org/10.1371/journal.pone.0010547. [PubMed].
55. Turner DP, Watson DK. ETS transcription factors: oncogenes and tumor suppressor genes as therapeutic targets for prostate cancer. Expert Rev Anticancer Ther. 2008; 8:33–42. https://doi.org/10.1586/14737140.8.1.33. [PubMed].
56. Kumar-Sinha C, Tomlins SA, Chinnaiyan AM. Recurrent gene fusions in prostate cancer. Nat Rev Cancer. 2008; 8:497–511. https://doi.org/10.1038/nrc2402. [PubMed].
57. Rubin MA, Maher CA, Chinnaiyan AM. Common gene rearrangements in prostate cancer. J Clin Oncol. 2011; 29:3659–3668. https://doi.org/10.1200/JCO.2011.35.1916. [PubMed].
58. Ateeq B, Tomlins SA, Laxman B, Asangani IA, Cao Q, Cao X, Li Y, Wang X, Feng FY, Pienta KJ, Varambally S, Chinnaiyan AM. Therapeutic targeting of SPINK1-positive prostate cancer. Sci Transl Med. 2011; 3:72ra17. https://doi.org/10.1126/scitranslmed.3001498. [PubMed].
59. Leinonen KA, Tolonen TT, Bracken H, Stenman UH, Tammela TL, Saramaki OR, Visakorpi T. Association of SPINK1 expression and TMPRSS2:ERG fusion with prognosis in endocrine-treated prostate cancer. Clin Cancer Res. 2010; 16:2845–2851. https://doi.org/10.1158/1078-0432.CCR-09-2505. [PubMed].
60. Garraway IP, Seligson D, Said J, Horvath S, Reiter RE. Trefoil factor 3 is overexpressed in human prostate cancer. Prostate. 2004; 61:209–214. https://doi.org/10.1002/pros.20096. [PubMed].
61. Vestergaard EM, Nexo E, Torring N, Borre M, Orntoft TF, Sorensen KD. Promoter hypomethylation and upregulation of trefoil factors in prostate cancer. Int J Cancer. 2010; 127:1857–1865. https://doi.org/10.1002/ijc.25209. [PubMed].
62. Pratap J, Javed A, Languino LR, van Wijnen AJ, Stein JL, Stein GS, Lian JB. The Runx2 osteogenic transcription factor regulates matrix metalloproteinase 9 in bone metastatic cancer cells and controls cell invasion. Mol Cell Biol. 2005; 25:8581–8591. https://doi.org/10.1128/MCB.25.19.8581-8591.2005. [PubMed].
63. Xiao LJ, Lin P, Lin F, Liu X, Qin W, Zou HF, Guo L, Liu W, Wang SJ, Yu XG. ADAM17 targets MMP-2 and MMP-9 via EGFR-MEK-ERK pathway activation to promote prostate cancer cell invasion. Int J Oncol. 2012; 40:1714–1724. https://doi.org/10.3892/ijo.2011.1320. [PubMed].
64. Ustach CV, Huang W, Conley-LaComb MK, Lin CY, Che M, Abrams J, Kim HR. A novel signaling axis of matriptase/PDGF-D/ss-PDGFR in human prostate cancer. Cancer Res. 2010; 70:9631–9640. https://doi.org/10.1158/0008-5472.CAN-10-0511. [PubMed].
65. Bettendorf O, Schmidt H, Staebler A, Grobholz R, Heinecke A, Boecker W, Hertle L, Semjonow A. Chromosomal imbalances, loss of heterozygosity, and immunohistochemical expression of TP53, RB1, and PTEN in intraductal cancer, intraepithelial neoplasia, and invasive adenocarcinoma of the prostate. Genes Chromosomes Cancer. 2008; 47:565–572. https://doi.org/10.1002/gcc.20560. [PubMed].
66. Park MS, Ravi V, Araujo DM. Inhibiting the VEGF-VEGFR pathway in angiosarcoma, epithelioid hemangioendothelioma, and hemangiopericytoma/solitary fibrous tumor. Curr Opin Oncol. 2010; 22:351–355. https://doi.org/10.1097/CCO.0b013e32833aaad4. [PubMed].
67. Hakariya T, Shida Y, Sakai H, Kanetake H, Igawa T. EGFR signaling pathway negatively regulates PSA expression and secretion via the PI3K-Akt pathway in LNCaP prostate cancer cells. Biochem Biophys Res Commun. 2006; 342:92–100. https://doi.org/10.1016/j.bbrc.2006.01.106. [PubMed].
68. Liu W, Xie CC, Thomas CY, Kim ST, Lindberg J, Egevad L, Wang Z, Zhang Z, Sun J, Koty PP, Kader AK, Cramer SD, Bova GS, et al. Genetic markers associated with early cancer-specific mortality following prostatectomy. Cancer. 2013; 119:2405–2412. https://doi.org/10.1002/cncr.27954. [PubMed].
69. Gu L, Dagvadorj A, Lutz J, Leiby B, Bonuccelli G, Lisanti MP, Addya S, Fortina P, Dasgupta A, Hyslop T, Bubendorf L, Nevalainen MT. Transcription factor Stat3 stimulates metastatic behavior of human prostate cancer cells in vivo, whereas Stat5b has a preferential role in the promotion of prostate cancer cell viability and tumor growth. Am J Pathol. 2010; 176:1959–1972. https://doi.org/10.2353/ajpath.2010.090653. [PubMed].
70. Tam L, McGlynn LM, Traynor P, Mukherjee R, Bartlett JM, Edwards J. Expression levels of the JAK/STAT pathway in the transition from hormone-sensitive to hormone-refractory prostate cancer. Br J Cancer. 2007; 97:378–383. https://doi.org/10.1038/sj.bjc.6603871. [PubMed].
71. Sherwood ER, Berg LA, Mitchell NJ, McNeal JE, Kozlowski JM, Lee C. Differential cytokeratin expression in normal, hyperplastic and malignant epithelial cells from human prostate. J Urol. 1990; 143:167–171. https://doi.org/10.1016/s0022-5347(17)39903-2. [PubMed].
72. Tsunoda T, Furusato B, Takashima Y, Ravulapalli S, Dobi A, Srivastava S, McLeod DG, Sesterhenn IA, Ornstein DK, Shirasawa S. The increased expression of periostin during early stages of prostate cancer and advanced stages of cancer stroma. Prostate. 2009; 69:1398–1403. https://doi.org/10.1002/pros.20988. [PubMed].
73. Kristiansen G, Pilarsky C, Wissmann C, Stephan C, Weissbach L, Loy V, Loening S, Dietel M, Rosenthal A. ALCAM/CD166 is up-regulated in low-grade prostate cancer and progressively lost in high-grade lesions. Prostate. 2003; 54:34–43. https://doi.org/10.1002/pros.10161. [PubMed].
74. Heatley M, Maxwell P, Whiteside C, Toner P. Vimentin and cytokeratin expression in nodular hyperplasia and carcinoma of the prostate. J Clin Pathol. 1995; 48:1031–1034. https://doi.org/10.1136/jcp.48.11.1031. [PubMed].
75. Storey JD, Tibshirani R. Statistical significance for genomewide studies. Proc Natl Acad Sci U S A. 2003; 100:9440–9445. https://doi.org/10.1073/pnas.1530509100. [PubMed].
76. Trevethan R. Sensitivity, Specificity, and Predictive Values: Foundations, Pliabilities, and Pitfalls in Research and Practice. Front Public Health. 2017; 5:307. https://doi.org/10.3389/fpubh.2017.00307. [PubMed].
77. Derezinski P, Klupczynska A, Sawicki W, Palka JA, Kokot ZJ. Amino Acid Profiles of Serum and Urine in Search for Prostate Cancer Biomarkers: a Pilot Study. Int J Med Sci. 2017; 14:1–12. https://doi.org/10.7150/ijms.15783. [PubMed].
78. Kelly RS, Vander Heiden MG, Giovannucci E, Mucci LA. Metabolomic Biomarkers of Prostate Cancer: Prediction, Diagnosis, Progression, Prognosis, and Recurrence. Cancer Epidemiol Biomarkers Prev. 2016; 25:887–906. https://doi.org/10.1158/1055-9965.EPI-15-1223. [PubMed].
79. Veldman-Jones MH, Brant R, Rooney C, Geh C, Emery H, Harbron CG, Wappett M, Sharpe A, Dymond M, Barrett JC, Harrington EA, Marshall G. Evaluating Robustness and Sensitivity of the NanoString Technologies nCounter Platform to Enable Multiplexed Gene Expression Analysis of Clinical Samples. Cancer Res. 2015; 75:2587–2593. https://doi.org/10.1158/0008-5472.CAN-15-0262. [PubMed].
80. Bell EH, Kirste S, Fleming JL, Stegmaier P, Drendel V, Mo X, Ling S, Fabian D, Manring I, Jilg CA, Schultze-Seemann W, McNulty M, Zynger DL, et al. A novel miRNA-based predictive model for biochemical failure following post-prostatectomy salvage radiation therapy. PLoS One. 2015; 10:e0118745. https://doi.org/10.1371/journal.pone.0118745. [PubMed].
81. Takahashi S, Shiraishi T, Miles N, Trock BJ, Kulkarni P, Getzenberg RH. Nanowire analysis of cancer-testis antigens as biomarkers of aggressive prostate cancer. Urology. 2015; 85:704.e1–7. https://doi.org/10.1016/j.urology.2014.12.004. [PubMed].
82. Chitikova Z, Pusztaszeri M, Makhlouf AM, Berczy M, Delucinge-Vivier C, Triponez F, Meyer P, Philippe J, Dibner C. Identification of new biomarkers for human papillary thyroid carcinoma employing NanoString analysis. Oncotarget. 2015; 6:10978–10993. https://doi.org/10.18632/oncotarget.3452. [PubMed].
83. Stricker TP, Morales La Madrid A, Chlenski A, Guerrero L, Salwen HR, Gosiengfiao Y, Perlman EJ, Furman W, Bahrami A, Shohet JM, Zage PE, Hicks MJ, Shimada H, et al. Validation of a prognostic multi-gene signature in high-risk neuroblastoma using the high throughput digital NanoString nCounter system. Mol Oncol. 2014; 8:669–678. https://doi.org/10.1016/j.molonc.2014.01.010. [PubMed].
84. Walter RF, Werner R, Vollbrecht C, Hager T, Flom E, Christoph DC, Schmeller J, Schmid KW, Wohlschlaeger J, Mairinger FD. ACTB, CDKN1B, GAPDH, GRB2, RHOA, SDCBP Were Identified as Reference Genes in Neuroendocrine Lung Cancer via the nCounter Technology. PLoS One. 2016; 11:e0165181. https://doi.org/10.1371/journal.pone.0165181. [PubMed].
85. Grosset AA, Ouellet V, Caron C, Fragoso G, Barres V, Delvoye N, Latour M, Aprikian A, Bergeron A, Chevalier S, Fazli L, Fleshner N, Gleave M, et al. Validation of the prognostic value of NF-kappaB p65 in prostate cancer: A retrospective study using a large multi-institutional cohort of the Canadian Prostate Cancer Biomarker Network. PLoS Med. 2019; 16:e1002847. https://doi.org/10.1371/journal.pmed.1002847. [PubMed].
86. Li H, Wang Z, Zhang Y, Sun G, Ding B, Yan L, Liu H, Guan W, Hu Z, Wang S, Cheng F, Xu H, Zhang X, et al. The Immune Checkpoint Regulator PDL1 is an Independent Prognostic Biomarker for Biochemical Recurrence in Prostate Cancer Patients Following Adjuvant Hormonal Therapy. J Cancer. 2019; 10:3102–3111. https://doi.org/10.7150/jca.30384. [PubMed].
87. Haddad BR, Erickson A, Udhane V, LaViolette PS, Rone JD, Kallajoki MA, See WA, Rannikko A, Mirtti T, Nevalainen MT. Positive STAT5 protein and locus amplification status predicts recurrence after radical prostatectomy to assist clinical precision management of prostate cancer. Cancer Epidemiol Biomarkers Prev. 2019; 28:1642–1651. https://doi.org/10.1158/1055-9965.EPI-18-1358. [PubMed].
88. Cullen J, Young D, Chen Y, Degon M, Farrell J, Sedarsky J, Baptiste W, Rosen P, Tolstikov V, Kiebish M, Kagan J, Srivastava S, Kuo HC, et al. Predicting Prostate Cancer Progression as a Function of ETS-related Gene Status, Race, and Obesity in a Longitudinal Patient Cohort. Eur Urol Focus. 2018; 4:818–824. https://doi.org/10.1016/j.euf.2017.02.016. [PubMed].
89. Kim SH, Joung JY, Lee GK, Hong EK, Kang KM, Yu A, Nam BH, Chung J, Seo HK, Park WS, Lee KH. Overexpression of ERG, Wild-Type PTEN Are Associated with Favorable Clinical Prognosis and Low Biochemical Recurrence in Prostate Cancer. PLoS One. 2015; 10:e0122498. https://doi.org/10.1371/journal.pone.0122498. [PubMed].
90. Demichelis F, Fall K, Perner S, Andren O, Schmidt F, Setlur SR, Hoshida Y, Mosquera JM, Pawitan Y, Lee C, Adami HO, Mucci LA, Kantoff PW, et al. TMPRSS2:ERG gene fusion associated with lethal prostate cancer in a watchful waiting cohort. Oncogene. 2007; 26:4596–4599. https://doi.org/10.1038/sj.onc.1210237. [PubMed].
91. Nam RK, Sugar L, Wang Z, Yang W, Kitching R, Klotz LH, Venkateswaran V, Narod SA, Seth A. Expression of TMPRSS2:ERG gene fusion in prostate cancer cells is an important prognostic factor for cancer progression. Cancer Biol Ther. 2007; 6:40–45. https://doi.org/10.4161/cbt.6.1.3489. [PubMed].
92. Attard G, Clark J, Ambroisine L, Fisher G, Kovacs G, Flohr P, Berney D, Foster CS, Fletcher A, Gerald WL, Moller H, Reuter V, De Bono JS, et al. Duplication of the fusion of TMPRSS2 to ERG sequences identifies fatal human prostate cancer. Oncogene. 2008; 27:253–263. https://doi.org/10.1038/sj.onc.1210640. [PubMed].
93. Minner S, Enodien M, Sirma H, Luebke AM, Krohn A, Mayer PS, Simon R, Tennstedt P, Muller J, Scholz L, Brase JC, Liu AY, Schluter H, et al. ERG status is unrelated to PSA recurrence in radically operated prostate cancer in the absence of antihormonal therapy. Clin Cancer Res. 2011; 17:5878–5888. https://doi.org/10.1158/1078-0432.CCR-11-1251. [PubMed].
94. Schaefer G, Mosquera JM, Ramoner R, Park K, Romanel A, Steiner E, Horninger W, Bektic J, Ladurner-Rennau M, Rubin MA, Demichelis F, Klocker H. Distinct ERG rearrangement prevalence in prostate cancer: higher frequency in young age and in low PSA prostate cancer. Prostate Cancer Prostatic Dis. 2013; 16:132–138. https://doi.org/10.1038/pcan.2013.4. [PubMed].
95. Hoogland AM, Jenster G, van Weerden WM, Trapman J, van der Kwast T, Roobol MJ, Schroder FH, Wildhagen MF, van Leenders GJ. ERG immunohistochemistry is not predictive for PSA recurrence, local recurrence or overall survival after radical prostatectomy for prostate cancer. Mod Pathol. 2012; 25:471–479. https://doi.org/10.1038/modpathol.2011.176. [PubMed].
96. Pettersson A, Graff RE, Bauer SR, Pitt MJ, Lis RT, Stack EC, Martin NE, Kunz L, Penney KL, Ligon AH, Suppan C, Flavin R, Sesso HD, et al. The TMPRSS2:ERG rearrangement, ERG expression, and prostate cancer outcomes: a cohort study and meta-analysis. Cancer Epidemiol Biomarkers Prev. 2012; 21:1497–1509. https://doi.org/10.1158/1055-9965.EPI-12-0042. [PubMed].
97. Raymundo EM, Diwa MH, Lapitan MC, Plaza AB, Sevilleja JE, Srivastava S, Sesterhenn IA. Increased association of the ERG oncoprotein expression in advanced stages of prostate cancer in Filipinos. Prostate. 2014; 74:1079–1085. https://doi.org/10.1002/pros.22791. [PubMed].
98. Yadav SS, Stockert JA, Hackert V, Yadav KK, Tewari AK. Intratumor heterogeneity in prostate cancer. Urol Oncol. 2018; 36:349–360. https://doi.org/10.1016/j.urolonc.2018.05.008. [PubMed].
99. Furusato B, Gao CL, Ravindranath L, Chen Y, Cullen J, McLeod DG, Dobi A, Srivastava S, Petrovics G, Sesterhenn IA. Mapping of TMPRSS2-ERG fusions in the context of multi-focal prostate cancer. Mod Pathol. 2008; 21:67–75. https://doi.org/10.1038/modpathol.3800981. [PubMed].
100. Kelly GM, Kong YH, Dobi A, Srivastava S, Sesterhenn IA, Pathmanathan R, Tan HM, Tan SH, Cheong SC. ERG oncoprotein expression in prostate carcinoma patients of different ethnicities. Mol Clin Oncol. 2015; 3:23–30. https://doi.org/10.3892/mco.2014.418. [PubMed].
101. Park K, Tomlins SA, Mudaliar KM, Chiu YL, Esgueva R, Mehra R, Suleman K, Varambally S, Brenner JC, MacDonald T, Srivastava A, Tewari AK, Sathyanarayana U, et al. Antibody-based detection of ERG rearrangement-positive prostate cancer. Neoplasia. 2010; 12:590–598. https://doi.org/10.1593/neo.10726. [PubMed].
102. Rawal S, Young D, Williams M, Colombo M, Krishnappa R, Petrovics G, McLeod DG, Srivastava S, Sesterhenn IA. Low Frequency of the ERG Oncogene Alterations in Prostate Cancer Patients from India. J Cancer. 2013; 4:468–472. https://doi.org/10.7150/jca.6568. [PubMed].
103. Rosen P, Pfister D, Young D, Petrovics G, Chen Y, Cullen J, Bohm D, Perner S, Dobi A, McLeod DG, Sesterhenn IA, Srivastava S. Differences in frequency of ERG oncoprotein expression between index tumors of Caucasian and African American patients with prostate cancer. Urology. 2012; 80:749–753. https://doi.org/10.1016/j.urology.2012.07.001. [PubMed].
104. Gsponer JR, Braun M, Scheble VJ, Zellweger T, Bachmann A, Perner S, Vlajnic T, Srivastava M, Tan SH, Dobi A, Sesterhenn IA, Srivastava S, Bubendorf L, et al. ERG rearrangement and protein expression in the progression to castration-resistant prostate cancer. Prostate Cancer Prostatic Dis. 2014; 17:126–131. https://doi.org/10.1038/pcan.2013.62. [PubMed].
105. Goltz D, Montani M, Braun M, Perner S, Wernert N, Jung K, Dietel M, Stephan C, Kristiansen G. Prognostic relevance of proliferation markers (Ki-67, PHH3) within the cross-relation of ERG translocation and androgen receptor expression in prostate cancer. Pathology. 2015; 47:629–636. https://doi.org/10.1097/PAT.0000000000000320. [PubMed].
106. Ahearn TU, Pettersson A, Ebot EM, Gerke T, Graff RE, Morais CL, Hicks JL, Wilson KM, Rider JR, Sesso HD, Fiorentino M, Flavin R, Finn S, et al. A Prospective Investigation of PTEN Loss and ERG Expression in Lethal Prostate Cancer. J Natl Cancer Inst. 2015; 108. https://doi.org/10.1093/jnci/djv346. [PubMed].
107. Mikolajczyk SD, Song Y, Wong JR, Matson RS, Rittenhouse HG. Are multiple markers the future of prostate cancer diagnostics? Clin Biochem. 2004; 37:519–528. https://doi.org/10.1016/j.clinbiochem.2004.05.016. [PubMed].
108. Kojima K, April C, Canasto-Chibuque C, Chen X, Deshmukh M, Venkatesh A, Tan PS, Kobayashi M, Kumada H, Fan JB, Hoshida Y. Transcriptome profiling of archived sectioned formalin-fixed paraffin-embedded (AS-FFPE) tissue for disease classification. PLoS One. 2014; 9:e86961. https://doi.org/10.1371/journal.pone.0086961. [PubMed].
109. Kim ST, Do IG, Lee J, Sohn I, Kim KM, Kang WK. The NanoString-based multigene assay as a novel platform to screen EGFR, HER2, and MET in patients with advanced gastric cancer. Clin Transl Oncol. 2015; 17:462–468. https://doi.org/10.1007/s12094-014-1258-7. [PubMed].
110. Furusato B, Tan SH, Young D, Dobi A, Sun C, Mohamed AA, Thangapazham R, Chen Y, McMaster G, Sreenath T, Petrovics G, McLeod DG, Srivastava S, et al. ERG oncoprotein expression in prostate cancer: clonal progression of ERG-positive tumor cells and potential for ERG-based stratification. Prostate Cancer Prostatic Dis. 2010; 13:228–237. https://doi.org/10.1038/pcan.2010.23. [PubMed].
111. Storey JD, Bass AJ, Dabney A, Robinson D. qvalue: Q-value estimation for false discovery rate control. 2019. https://www.bioconductor.org/packages/release/bioc/html/qvalue.html.
112. R Core Team. R: A language and environment for statistical computing. (Vienna, Austria: R Foundation for Statistical Computing,). 2013. https://www.r-project.org/index.html.
113. Wickham H. ggplot2: Elegant Graphics for Data Analysis. (New York: Springer-Verlag). 2016. https://www.springer.com/gp/book/9780387981413.
114. Kassambara A. ggpubr: “ggplot2” based publication ready plots. R package version 01. 2018. https://rpkgs.datanovia.com/ggpubr/index.html.