
Introduction
Gastric cancer (GC) is the fifth most frequently diagnosed cancer worldwide [1]. Despite advances in the understanding of molecular mechanisms involved in gastric carcinogenesis [2], the early detection and prognostic outcomes of this disease, which will eventually define therapeutic success, still depend on histopathological methods. In the absence of specific symptoms suggestive of early-stage GC, and a lack of effective diagnostic imaging methods, most patients are diagnosed at advanced tumor stages, wherein, despite surgical resection, chemotherapy treatments are of only palliative nature [3]. Only 20–25% of patients with advanced GC survive 5 years after diagnosis [4], making GC one of the leading causes of cancer-related deaths worldwide (783,000 deaths estimated in 2018) [1].
Some recent studies have identified typical molecular alterations, such as MYC gene (8q24) amplification, as drivers of genetic profiles characterizing advanced stages of gastric tumors, with poor prognostic features [5–7]. MYC protein influences approximately 15% of the genes in the human genome through its interaction with enhancer box sequences (E-box), and via the recruitment of histone acetyltransferases. Deregulation of MYC gene expression promotes genomic instability, and high levels of MYC protein have been shown to create a mutagenic environment by increasing the levels of reactive oxygen species [8].
Cell lines play an important role in the study of molecular patterns associated with carcinogenesis and metastasis. A cancer cell line, designated as AGP01, was established by our research group from ascitic fluid cells of a patient with metastatic gastric adenocarcinoma. AGP01 cells are characterized by clonal chromosomal abnormalities, such as trisomy 8, resulting in the amplification of MYC gene [9]. Given the important role of MYC in GC prognosis, analysis of MYC-regulated genes may provide valuable biomarkers for GC risk stratification, which can help in the treatment choice. Therefore, the objective of this study was to evaluate the prognostic and predictive values of genes upregulated by MYC overexpression, selected from high-throughput RNA sequencing (RNA-seq) data, in a metastatic gastric adenocarcinoma cell line (AGP01), before and after siRNA-mediated MYC-silencing.
Results
MYC silencing in AGP01 cell line and RNA-seq
A total of 11 and 13 million RNA-seq reads generated respectively from MYC-silenced and non-silenced AGP01 cells, revealed 2,483 differentially expressed genes (DEGs), of which 917 were upregulated, and 1,566 were downregulated due to MYC silencing. The downregulated DEGs represented the genes, whose overexpression was influenced, directly or indirectly, by the high levels of MYC in AGP01 cell line. Since MYC amplification is a common phenomenon in patients with GC, it is reasonable to infer that those genes may also be overexpressed in the tumor tissues of patients. Thus, we randomly selected 3 genes from 150 most downregulated DEGs (Supplementary Table 1) to assess their prognostic and predictive value in GC clinical samples. The selected genes were as follows: CIAPIN1 (cytokine induced apoptosis inhibitor 1), MTA2 (metastasis associated 1 family member 2), and UXT (ubiquitously expressed prefoldin like chaperone) (Figure 1).
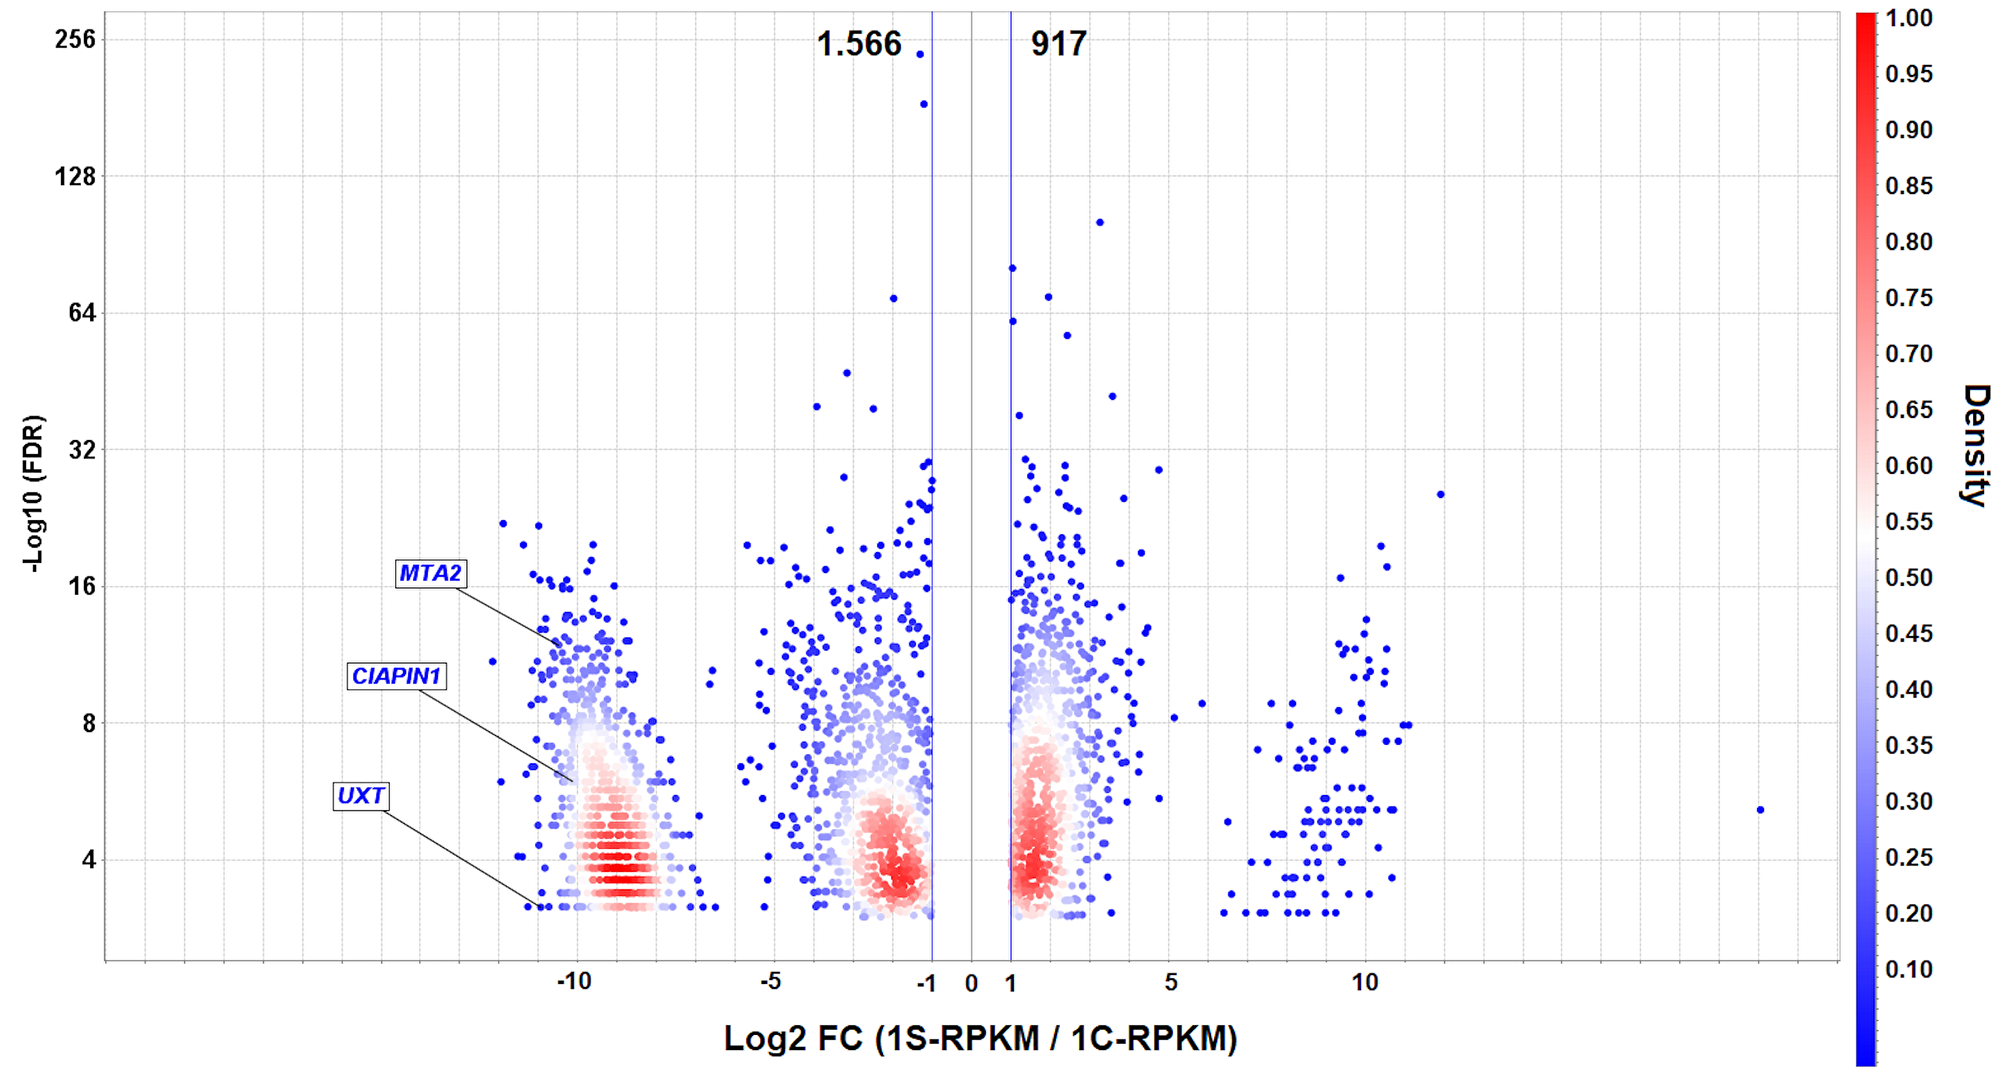
Figure 1: Volcano plot of differentially expressed genes (DEGs) in AGP01 cell line upon MYC silencing. A direct comparison between MYC-silenced and non-silenced cells is shown. -Log10 (FDR) ≤ 0.05 (Y-axis) and the cut-off point |Log2(FC)| ≥ 1 (X-axis) indicate the downregulated (left side) and upregulated (right side) DEGs. The UXT, CIAPIN1, and MTA2 genes are highlighted as the significantly downregulated genes. The density is calculated to visualize the gene overlap. RPKM: Reads per kilo base per million mapped reads.
Clinicopathological features and CIAPIN1, MTA2, and UXT expression
The relative mRNA expressions of CIAPIN1, MTA2, and UXT genes in the tumor tissues of patients with various clinicopathological features are shown in Table 1. The expression of all the 3 genes was significantly higher in the following scenarios (compared with paired normal gastric tissues): serosal invasion-positive (T3/T4) (CIAPIN1, 1.888 ± 0.547; MTA2, 2.034 ± 0.375; UXT, 1.784 ± 0.656, ****P < 0.0001), positive lymph node metastasis (N1) (CIAPIN1, 1.875 ± 0.592; MTA2, 1.871 ± 0.462; UXT, 1.656 ± 0.552, ****P < 0.0001), and positive distant metastasis (M1) (CIAPIN1: 2.292 ± 0.452; MTA2, 2.016 ± 0.462; UXT, 2.010 ± 0.482, ****P < 0.0001). MTA2 expression was higher in patients aged ≥61 years (1.880 ± 0.433, *P = 0.024), and in patients with intestinal GC (1.898 ± 0.451, **P = 0.005). We also observed an excessively high expression of all the three selected genes in M1 patients as compared to that in patients without metastasis (M0) (an increase of 70.5% for CIAPIN1, 25% for MTA2, and 67.8% for UXT; ****P < 0.0001), and the data was corroborated by protein expression analysis (Figure 2).
Table 1: Relationship between UXT, MTA2, and CIAPIN1 mRNA expression and clinicopathological features
| Variables | n, 213 (%) | UXT expression* | MTA2 expression* | CIAPIN1 expression* | ||||||
|---|---|---|---|---|---|---|---|---|---|---|
| Mean ± SD | F value | P value | Mean ± SD | F value | P value | Mean ± SD | F value | P value | ||
| Gender | ||||||||||
| Male | 133 (62.4%) | 1.566 ± 0.559 | 1.185 | 0.277 | 1.811 ± 0.450 | 0.002 | 0.957 | 1.788 ± 0.592 | 0.542 | 0.462 |
| Female | 80 (37.6%) | 1.651 ± 0.528 | 1.814 ± 0.509 | 1.850 ± 0.592 | ||||||
| Age (years) | ||||||||||
| ≥61 | 113 (53.1%) | 1.600 ± 0.524 | 0.004 | 0.946 | 1.880 ± 0.433 | 5.135 | 0.024* | 1.858 ± 0.618 | 1.496 | 0.222 |
| <61 | 100 (46.9%) | 1.595 ± 0.576 | 1.735 ± 0.503 | 1.759 ± 0.558 | ||||||
| Tumor location | ||||||||||
| Cardia | 64 (30.0%) | 1.615 ± 0.547 | 0.087 | 0.767 | 1.789 ± 0.497 | 0.216 | 0.642 | 1.840 ± 0.624 | 0.209 | 0.647 |
| Non-cardia | 149 (70.0%) | 1.591 ± 0.550 | 1.822 ± 0.462 | 1.799 ± 0.578 | ||||||
| Histological type | ||||||||||
| Diffuse | 103 (48.4%) | 1.634 ± 0.601 | 0.846 | 0.358 | 1.720 ± 0.479 | 7.714 | 0.005** | 1.800 ± 0.606 | 0.066 | 0.796 |
| Intestinal | 110 (51.6%) | 1.565 ± 0.493 | 1.898 ± 0.451 | 1.821 ± 0.580 | ||||||
| Serosal invasion (T) | ||||||||||
| T1/T2 | 68 (31.9%) | 1.511 ± 0.467 | 12.037 | <0.0001**** | 1.338 ± 0.262 | 190.215 | <0.0001**** | 1.647 ± 0.650 | 7.975 | <0.0001**** |
| T3/T4 | 145 (68.1%) | 1.784 ± 0.656 | 2.034 ± 0.375 | 1.888 ± 0.547 | ||||||
| Lymph node metastasis (N) | ||||||||||
| Negative | 23 (10.8%) | 1.123 ± 0.112 | 21.238 | <0.0001**** | 1.326 ± 0.187 | 31.180 | <0.0001**** | 1.282 ± 0.179 | 22.780 | <0.0001**** |
| Positive | 190 (89.2%) | 1.656 ± 0.552 | 1.871 ± 0.462 | 1.875 ± 0.592 | ||||||
| Distant metastasis (M) | ||||||||||
| M0 | 108 (50.7%) | 1.198 ± 0.203 | 258.523 | <0.0001**** | 1.613 ± 0.392 | 47.119 | <0.0001**** | 1.344 ± 0.216 | 383.538 | <0.0001**** |
| M1 | 105 (49.3%) | 2.010 ± 0.482 | 2.016 ± 0.462 | 2.292 ± 0.452 | ||||||
| TNM stage | ||||||||||
| I + II | 42 (19.7%) | 1.266 ± 0,210 | 21.026 | <0.0001**** | 1.306 ± 0.220 | 83.330 | <0.0001**** | 1.266 ± 0.220 | 55.912 | <0.0001**** |
| III + IV | 171 (80.3%) | 1.680 ± 0.574 | 1.936 ± 0.433 | 1.945 ± 0.577 | ||||||
| H. pylori infection | ||||||||||
| Negative | 23(10.8%) | 1.639 ± 0.623 | 0.140 | 0.708 | 1.790 ± 0.487 | 0.0576 | 0.810 | 1.710 ± 0.526 | 0.752 | 0.386 |
| Positive | 190 (89.2%) | 1.593 ± 0.540 | 1.815 ± 0.471 | 1.824 ± 0.599 | ||||||
| CagAa | ||||||||||
| Negative | 73 (34.3%) | 1.611 ± 0.555 | 0.058 | 0.809 | 1.749 ± 0.477 | 1.972 | 0.161 | 1.714 ± 0.478 | 3.016 | 0.083 |
| Positive | 140 (65.7%) | 1.591 ± 0.546 | 1.845 ± 0.468 | 1.862 ± 0.638 | ||||||
| EBV infection | ||||||||||
| Negative | 178 (83.6%) | 1.583 ± 0.559 | 0.835 | 0.361 | 1.808 ± 0.474 | 0.069 | 0.793 | 1.786 ± 0594 | 1.934 | 0.165 |
| Positive | 35 (16.4%) | 1.676 ± 0.486 | 1.831 ± 0.469 | 1.938 ± 0.567 | ||||||
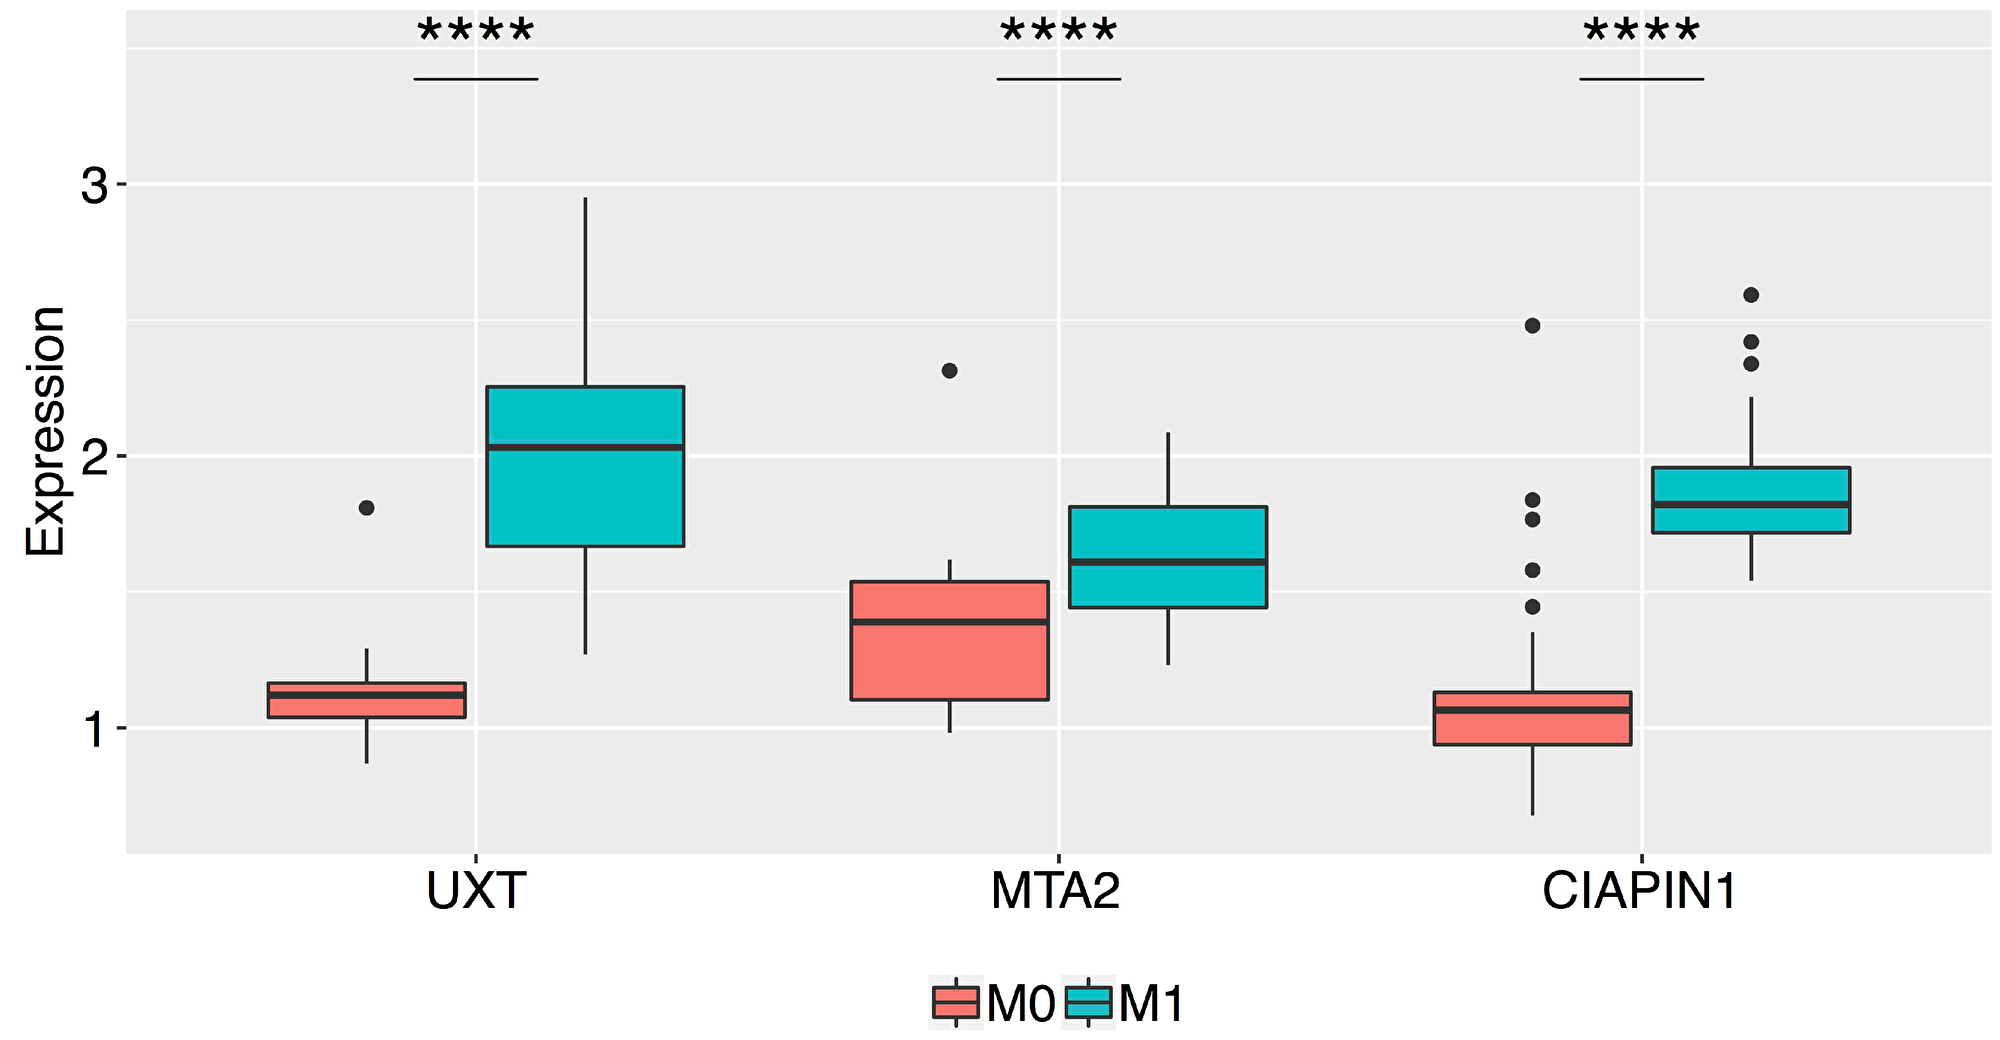
Figure 2: Box plots of the normalized relative expression of the UXT, MTA2, and CIAPIN1 proteins in the gastric tumor tissue of patients without metastasis (M0) and with metastasis (M1) (****P < 0.0001). The boxes are drawn from the 75th percentile to the 25th percentile. The horizontal line inside the box represents median values. The vertical lines above and below the box delineate the maximum and minimum values, and the dots indicate outliers.
In order to evaluate CIAPIN1, MTA2, and UXT genes for their potential role in predicting distant metastasis in patients with early-stage GC, we compared their mRNA and protein expression profiles in M0 and M1 patients, including only patients with non-invasive GC (T1/T2) and lymph node negative patients (N0) (n = 68). In this study, no patient was at both N0 and M1 at the same time. Thus, only patients with T1/T2 primary tumor could be effectively compared. The results are summarized in Figure 3. The mRNA and protein levels of MTA2 were significantly different (*P < 0.05) between early-stage GC tissues of M0 and M1 patients; however, these differences were more prominent for UXT and CIAPIN1 genes (**** P < 0.0001). Thus, only UXT and CIAPIN1 genes were considered for further analysis.
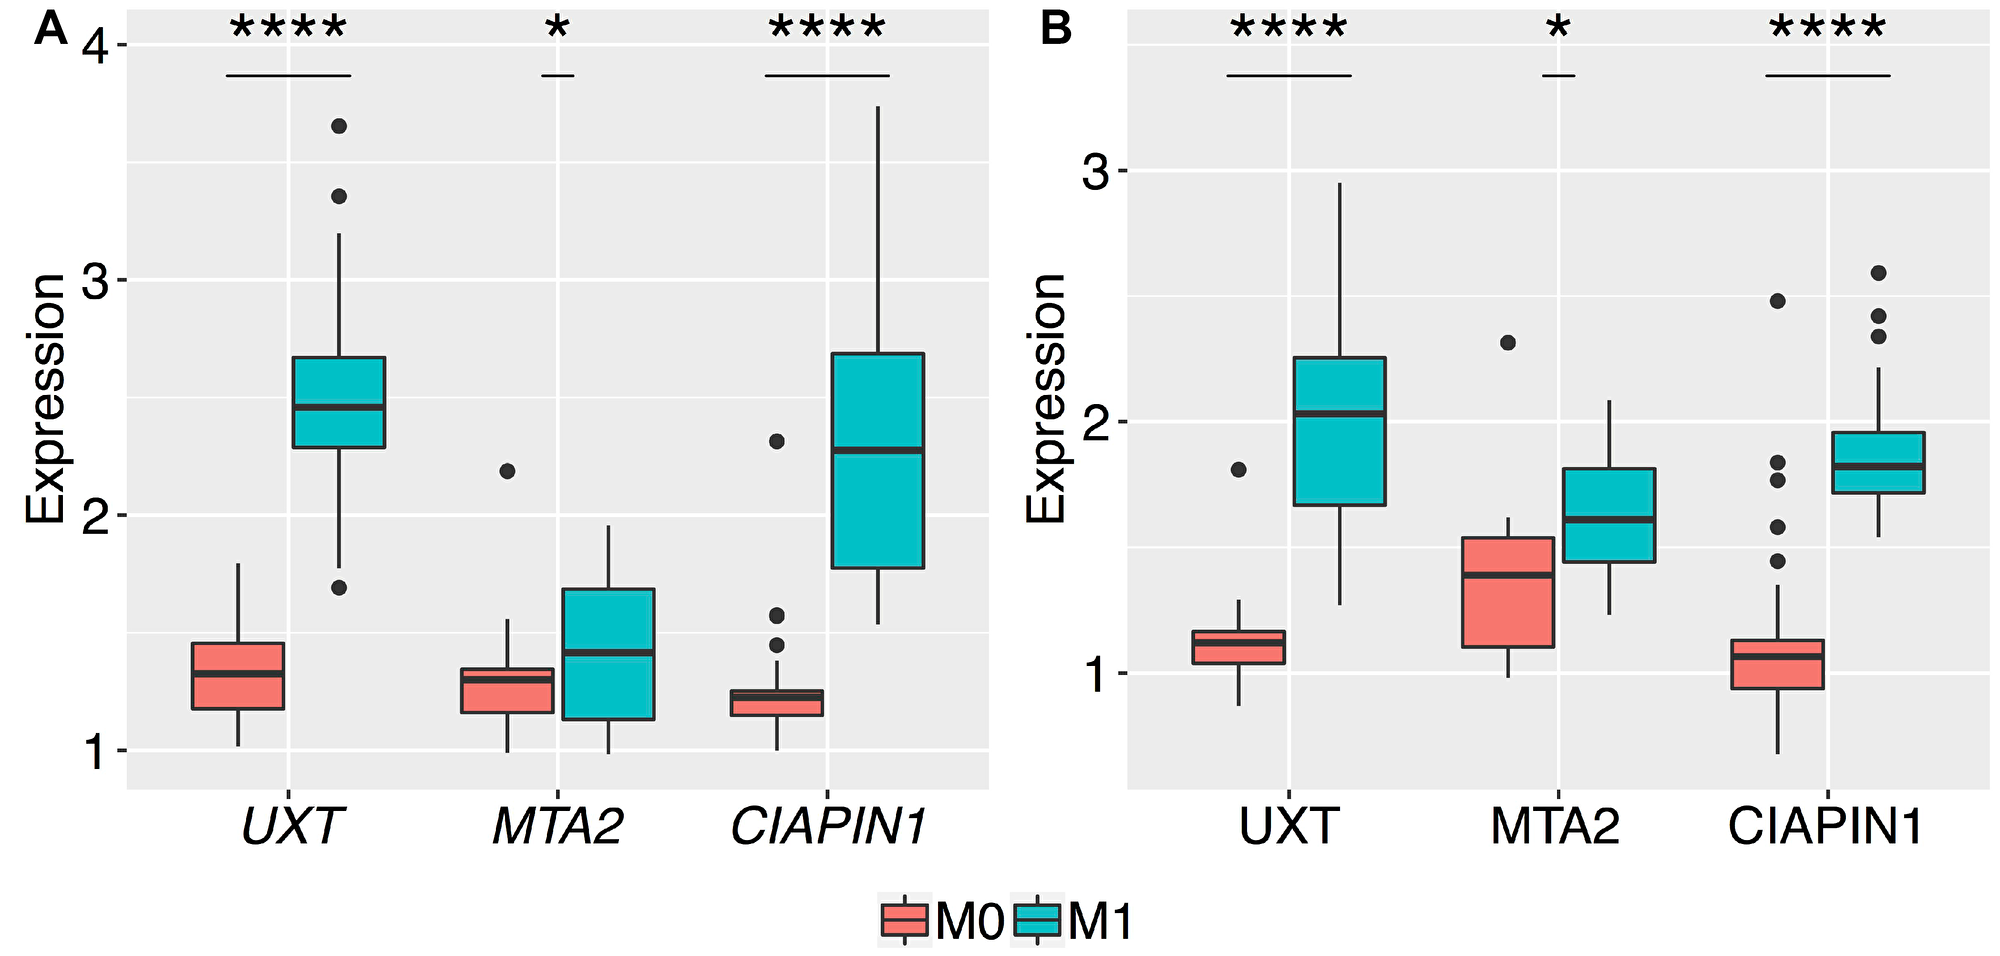
Figure 3: Box plots of the normalized relative expression of UXT, MTA2, and CIAPIN1 genes in the gastric tumor tissues of patients without metastasis (M0) and with metastasis (M1). The expression levels of the 3 genes were validated by qRT-PCR and western blot in 68 patients, presented with no serosal invasion (T1 and T2). A highly significant increase in the expression of (A) mRNA, and (B) proteins of UXT and CIAPIN1 genes between M0 and M1 stages (****P < 0.0001). The t-test produced a higher P-value for differences in the mean expression of mRNA and protein of MTA2 as compared to those of other genes (*P = 0.03 and *P = 0.01, respectively). The boxes are drawn from the 75th percentile to the 25th percentile. The horizontal line inside the box represents the median. Vertical lines above and below the box delineate the maximum and minimum values, and the dots show the outliers.
Consistent with the qRT-PCR and western blot results, the immunoreactivity of the anti-UXT and anti-CIAPIN1 antibodies showed statistically significant differences between gastric tissue samples from M0 and M1 patients (Figure 4).
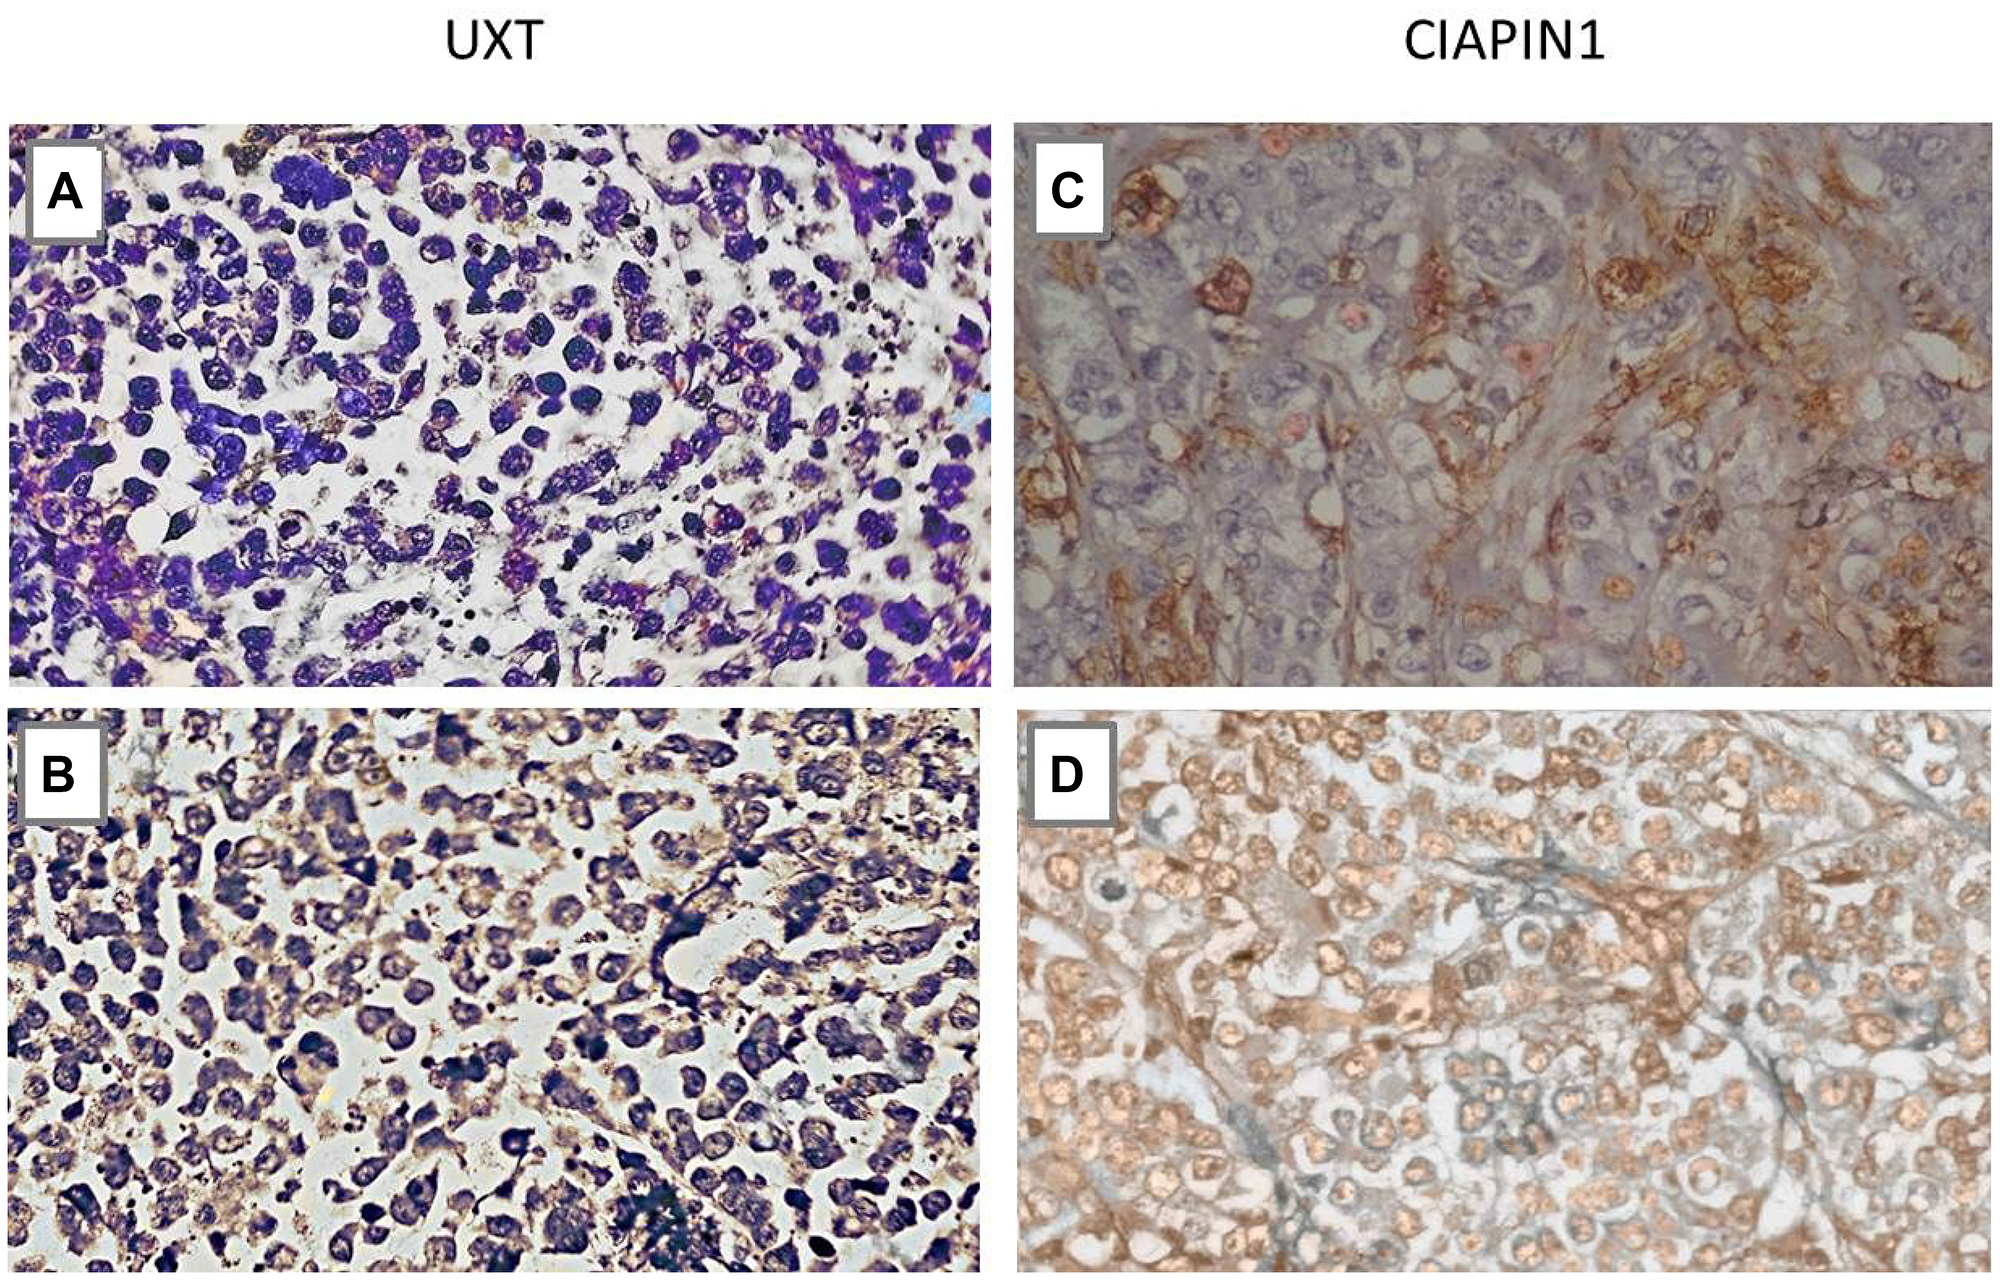
Figure 4: Immunohistochemistry analysis of the UXT and CIAPIN1 proteins in primary gastric tumor tissues of patients without metastasis (M0) and with metastasis (M1). (A) Negative sample for UXT (M0), (B) Cytoplasmic expression of UXT (M1), (C) Negative sample for CIAPIN1 (M0), (D) Nuclear expression of CIAPIN1 (M1). More than 10% of cells were stained positively (*P < 0.05) (×400 magnification).
Survival analysis
We used survival analysis to evaluate the contribution of high expression of UXT and CIAPIN1 in the overall survival of 213 patients studied. Initially, we used ROC curve analysis to classify the patients into high and low expression groups (Figure 5). The cut-off was chosen as the highest AUC point (for UXT: AUC = 0.966; sensitivity = 92.3%, specificity = 90.7%, and for CIAPIN1: AUC = 0.973; sensitivity = 93.3%, specificity = 96.2%). From this data, cut-off values were fixed as 1.5 for UXT and 1.7 for CIAPIN1. Kaplan–Meier analysis demonstrated a decrease in the probability of survival in the group of patients with high expression of UXT or CIAPIN1 (considering individual effects as well as combined effects). In the first year post-diagnosis, there was a highly significant decrease in the overall survival of patients with an increased expression of UXT and/or CIAPIN1 (****P < 0.0001) (Figure 6).
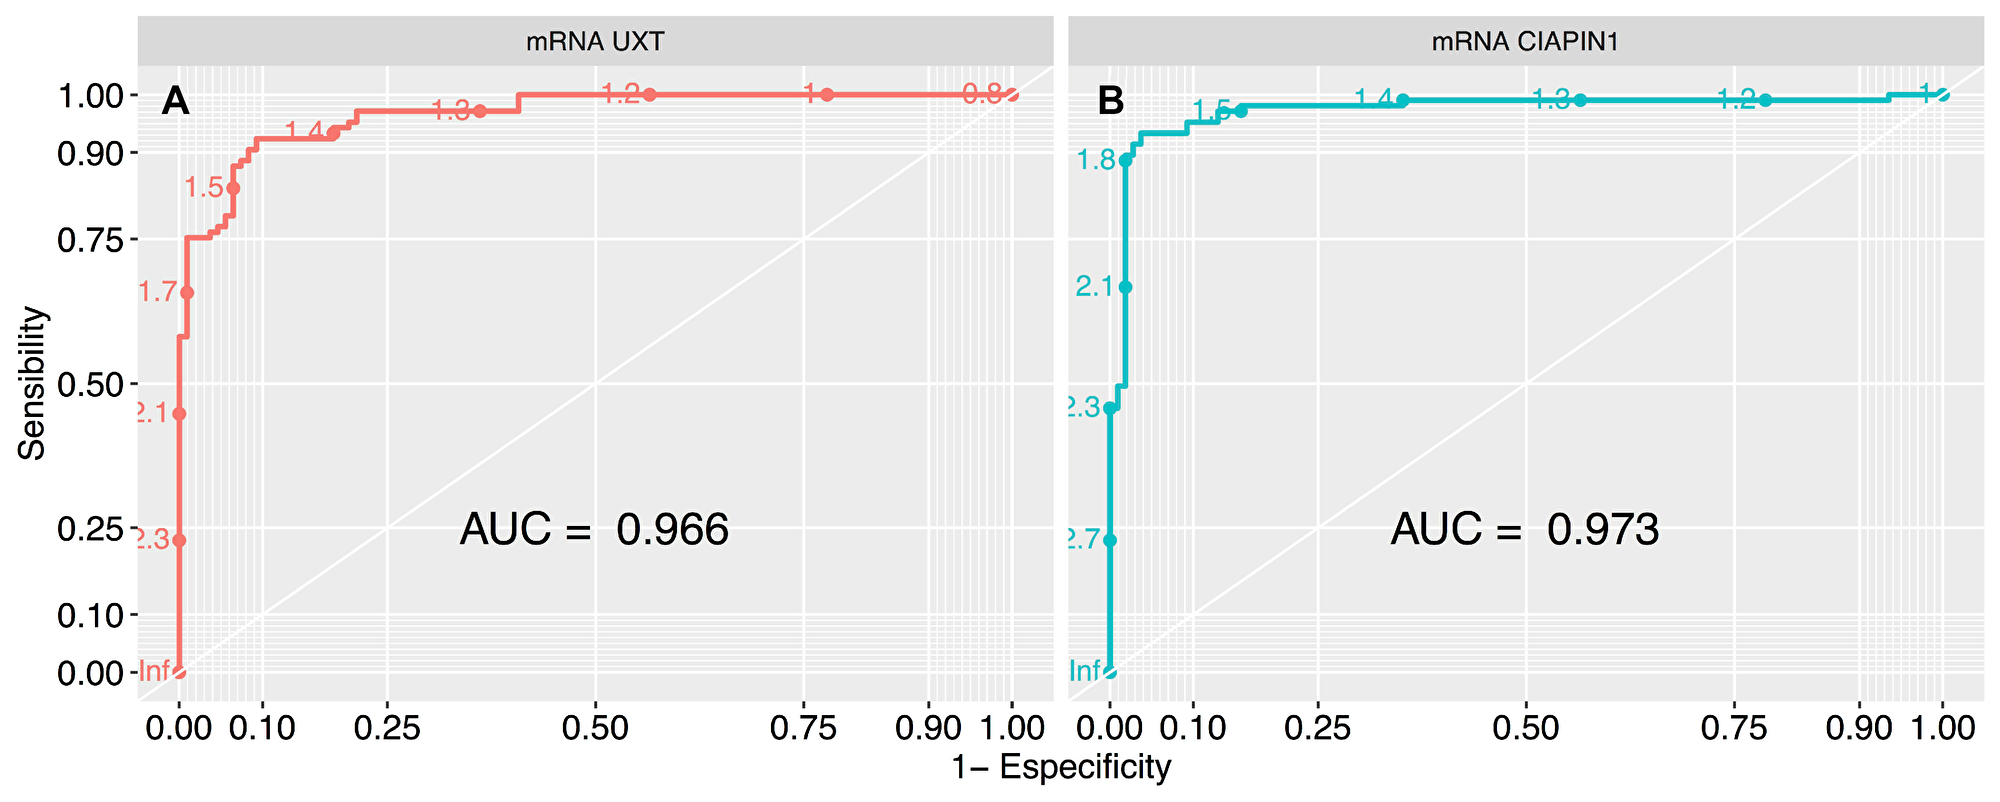
Figure 5: ROC curve analysis to define the cut-off values of UXT and CIAPIN1 gene expression, segregating the high and low expression groups. The largest total area under the curve (AUC) is 0.966 for (A) UXT gene (that represents normalized expression cut-off of 1.5), and 0.973 for (B) CIAPIN1 gene (cut-off of 1.7). ROC, receiver-operating characteristic.
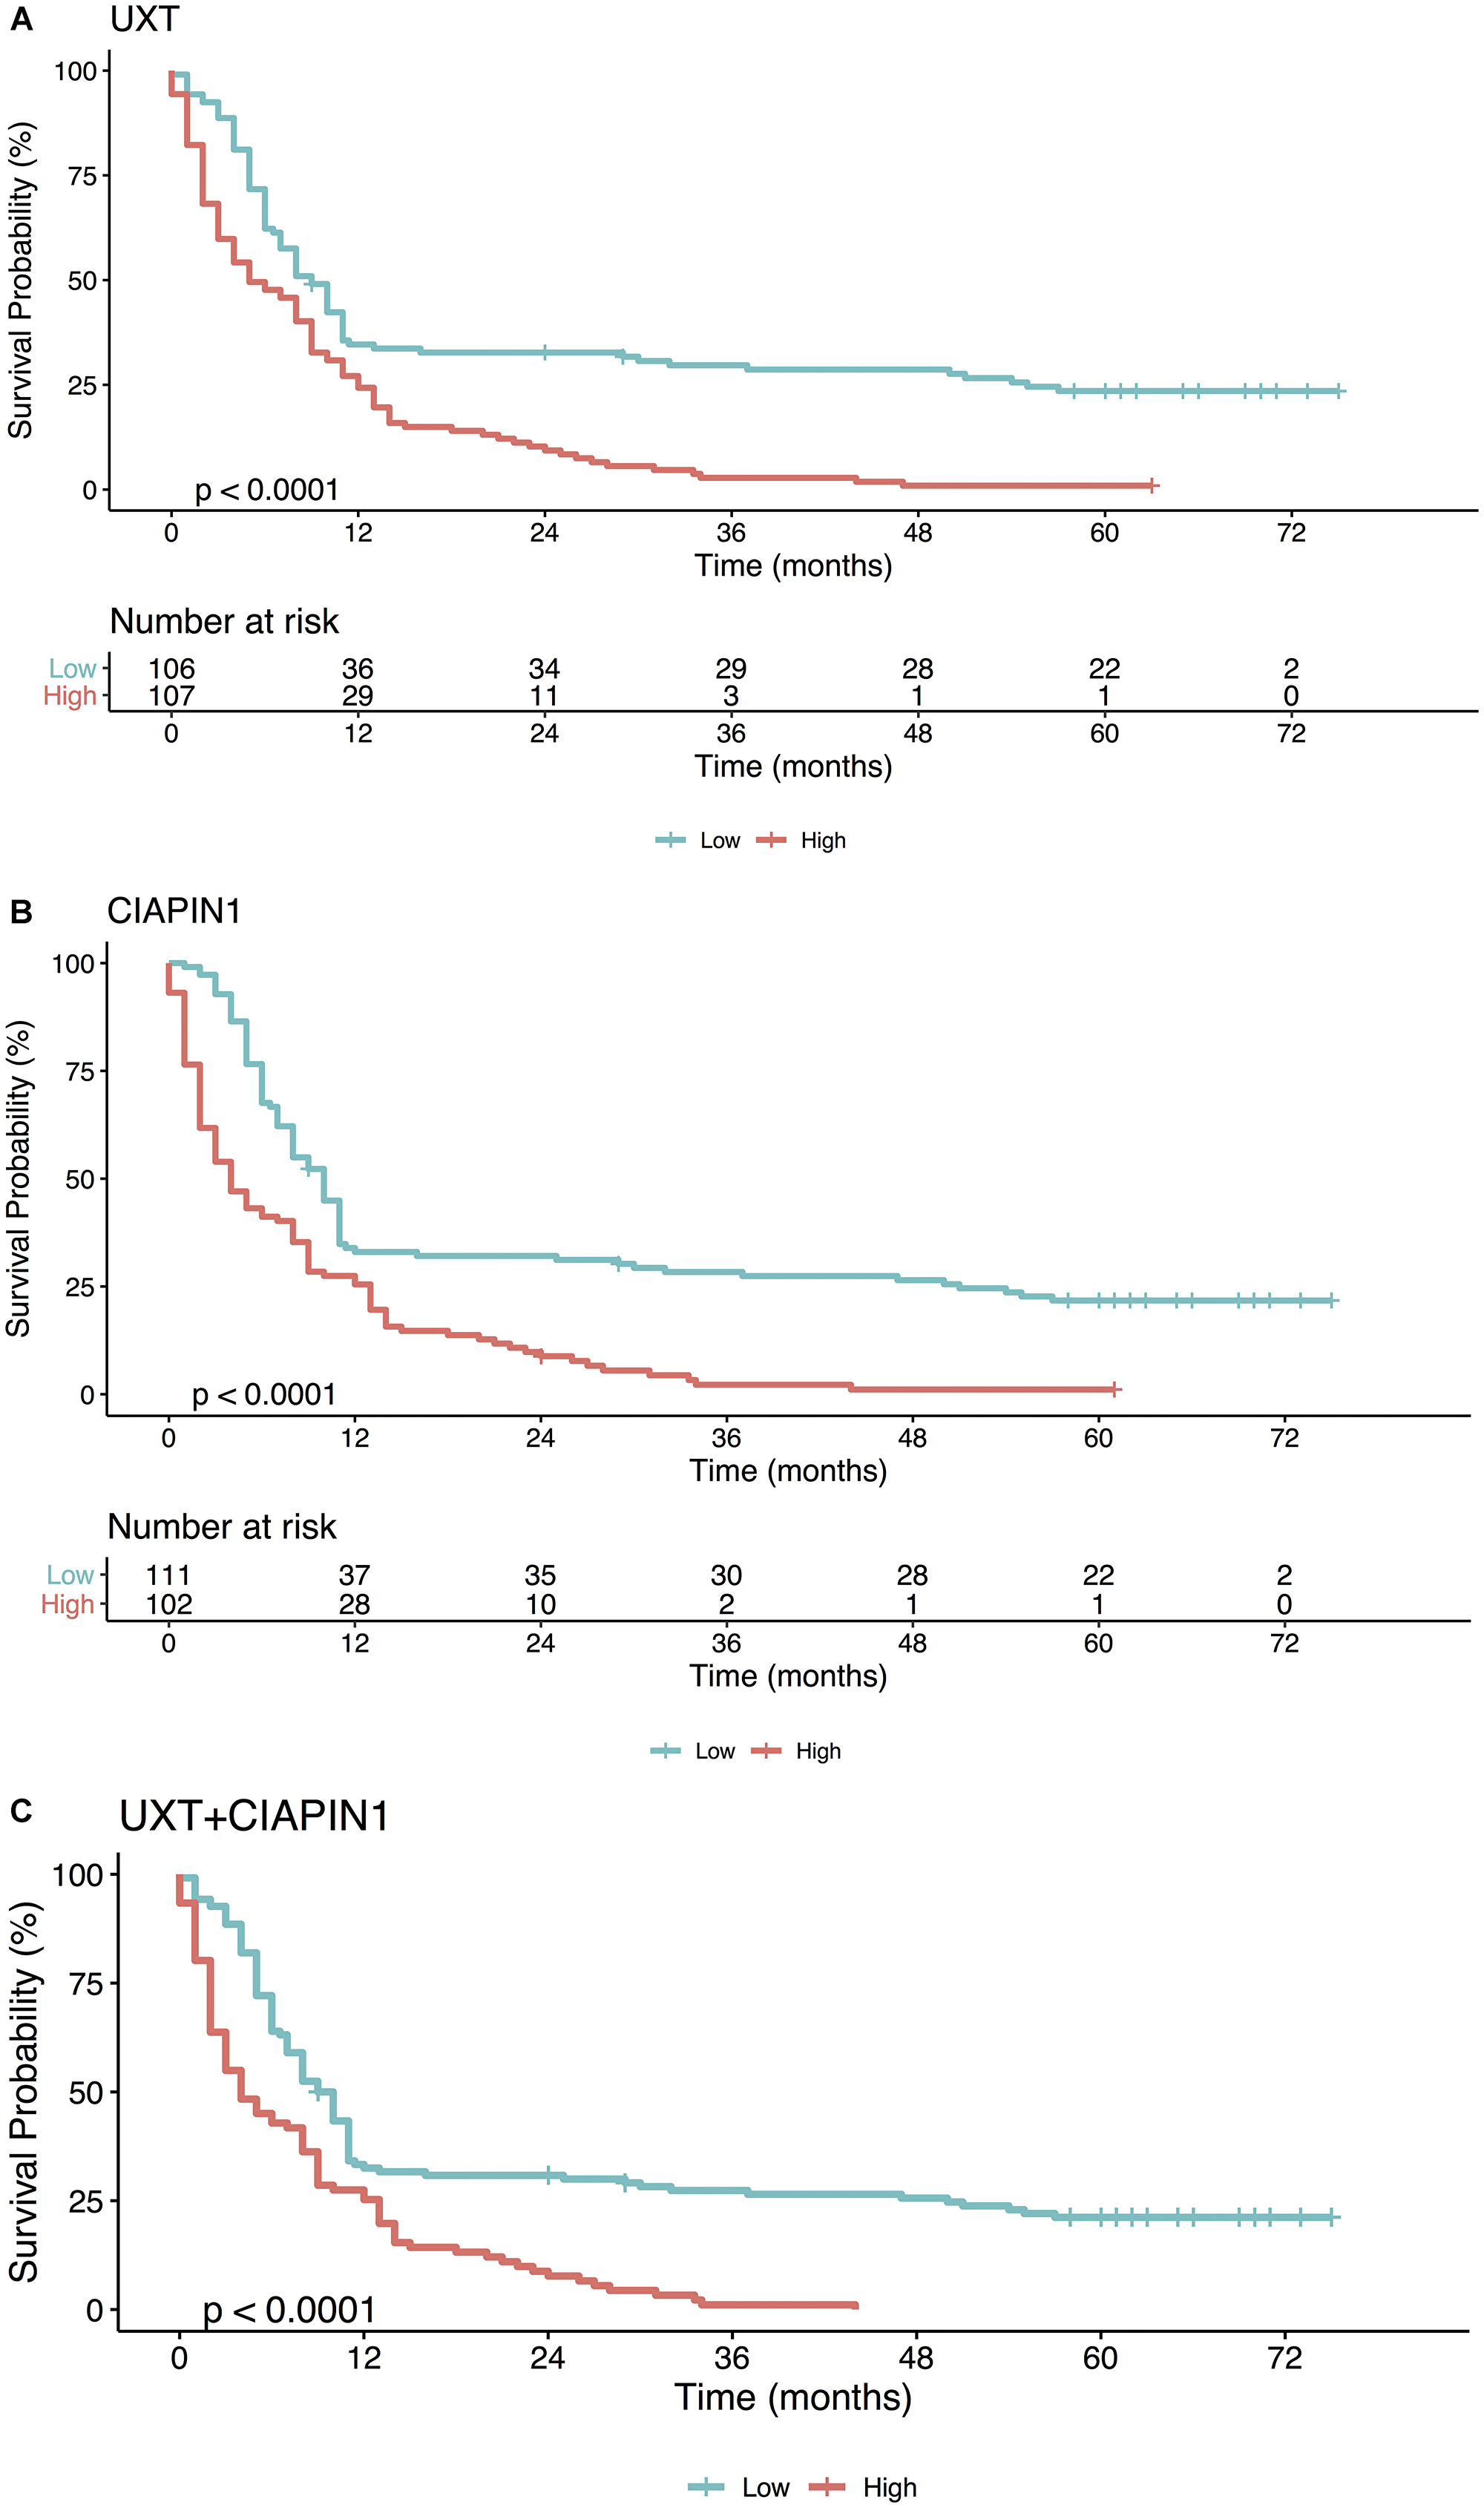
Figure 6: Kaplan–Meier analysis of the overall survival (in months) of patients with gastric cancer as a function of (A) UXT, (B) CIAPIN1, and (C) gene UXT + CIAPIN1 expression. High expression (gene expression ≥1.5 for UXT and ≥1.7 for CIAPIN1; red line), as opposed to low expression (gene expression <1.5 for UXT and <1.7 for CIAPIN1; blue line), is strongly associated with a lower probability of survival (****P < 0.0001).
DISCUSSION
A variety of distinct molecular mechanisms may converge in gastric carcinogenesis that is collectively attributed to a combination of environmental factors, and generalized and specific genetic and epigenetic alterations [2]. MYC amplification/overexpression is a recurring molecular event in gastric tumor tissues, and is often associated with an advanced tumor stage, lymph node metastasis, and low survival rates [5–7, 10–12]. The MYC proto-oncogene coordinates a plethora of cell functions, from cell growth to apoptosis and metabolism. Its deregulation is associated with the global reprogramming of gene expression that promotes cancer initiation, survival, growth, and metastasis; thus considered as a driver event in GC [8, 13]. However, the functional role of MYC in regulating the global expression of genes that participate in critical molecular pathways governing the GC progression is still not well understood [14].
Clinical outcomes of patients with GC depend on the metastatic potential of the tumor. Thus, several studies have focused on detecting prognostic biomarkers capable of predicting metastasis and identifying high-risk patients for guiding treatment decisions [15–17]. In this study, we obtained a whole transcriptome profile of a metastatic GC cell line upon MYC silencing, and on comparing with the non-silenced control, we identified at least 150 genes upregulated by MYC that can be explored for GC prognosis. We selected 3 genes for further validation in clinical tumor samples of 213 GC patients. Our qRT-PCR and western blot results revealed a robust increase (****P < 0.0001) in CIAPIN1, MTA2, and UXT gene expression in GC tissues of patients that were positive for serosal invasion, lymph node metastasis, and distant metastases, when compared with paired normal gastric tissues. These results suggested that the expression of selected genes had a strong association with advanced-stage GC and, consequently, worse prognosis. We also demonstrated that UXT and CIAPIN1 overexpression was detectable in early-stages of gastric primary tumors, thus enabling the evaluation of possible metastatic progression. However, high expression of MTA2 seemed to be an event occurring later in the GC evolution.
MTA2 is a member of the metastatic tumor-associated family of transcriptional regulators, and plays a central role in cytoskeletal organization and motility pathways, which are essential processes in the metastatic cascade [18]. As observed in this study, Zhou et al. also showed that MTA2 expression was closely related to the depth of tumor invasion, lymph nodes metastasis, and TNM staging in patients with GC [19]. In their study, MTA2 knockdown impaired invasion and metastasis of GC cells. However, another study demonstrated that MTA2 overexpression enhanced colony formation and tumor growth of GC cells, but was not important in cancer cell migration and metastasis [20]. Such data may suggest that MTA2 is essential for metastasis maintenance and expansion rather than for its initiation. In our study, MTA2 overexpression was significantly more pronounced in tumor tissues of patients ≥ 61 years of age, and in those with intestinal GC, a histologic type associated with better prognosis as compared to diffuse GC [3]. These findings led us to believe that MTA2 expression has low specificity as a biomarker of tumor progression and prognosis of GC.
In contrast, this study supported the CIAPIN1 and UXT gene expression analysis as an important strategy to evaluate the probability of occurrence of distant metastases in patients with early-stage GC. Consistently, our Kaplan–Meier survival analysis demonstrated that the survival time of patients with GC with high expression of CIAPIN1 and UXT (individual or combined) was shorter than those with low expression, during the first year after the diagnosis (****P < 0.0001). This result reinforces the prognosis value of these genes for GC, with high sensitivity (92.3% for UXT and 93.3% for CIAPIN1), and specificity (90.7% for UXT and 96.2% for CIAPIN1) in the ROC curve.
CIAPIN1 is a ubiquitously expressed protein in differentiated and metabolically active tissues, and exhibits antiapoptotic activity. In a murine cell line, CIAPIN1 was shown to be a downstream effector of the receptor tyrosine kinase belonging to Ras signaling pathway [21]. The role of CIAPIN1 in cancer progression and metastasis is not yet defined. Consistent with our results, higher CIAPIN1 mRNA expression was associated with poor overall survival in patients with metastatic ovarian serous carcinoma [22]. However, decreased expression of CIAPIN1 correlated with poor prognosis in patients with other types of cancers, such as colorectal cancer and esophageal squamous cell carcinoma [21–23].
In the SGC7901 and MKN45 GC cell lines, it was shown that reduction in CIAPIN1 expression promoted tumor growth, suggesting that CIAPIN1 may act as a suppressor of GC cell proliferation [24]. However, both cell lines, although established from metastatic gastric adenocarcinoma [25, 26], do not harbor MYC gene amplification [27], which is in contrast to the AGP01 cell line used in the present study. In another study carried out in GC cells, CIAPIN1 silencing inhibited cell proliferation and angiogenesis [28], suggesting that this gene is important for initiation of tumor vascularization. MYC plays a central role in the recruitment of angiogenic proteins, especially in rapidly proliferating tumor tissues, with high levels of hypoxia [29]. Therefore, a possible explanation for the results obtained in the present study is that CIAPIN1 may be recruited by MYC to maintain the angiogenesis required for tumor progression. A recent study has shown that CIAPIN1 is involved in the inhibition of hypoxia-induced apoptosis, in cardiomyocytes [30]. CIAPIN1 overexpression has also been shown to confer resistance to cancer treatment, therefore predicting a worse patient prognosis and survival [31–33].
UXT is a co-chaperone molecule that assists in the proper folding of proteins, and prevention of cell protein aggregation. It is characterized as a centrosomal protein, and abnormality in its function may cause defects in chromosome separation that may result in cell malignant transformation [34]. Although UXT is highly expressed in several types of human cancers [34, 35], the exact mechanism of its contribution to tumorigenesis and cancer progression is still not understood, and seems to be tissue specific [36]. An important aspect is that UXT can interact physically and functionally with transcription factors, and can act as tumor suppressor or oncogene [36, 37].
Detailed studies of UXT in GC are very scarce. Our report suggested that UXT is a MYC-regulated gene that is highly expressed in GC tissues in early or advanced stages of tumor progression. Consistently, a study suggested UXT as one of the MYC-regulated genes, which were highly predictive of poor prognosis in diverse MYC-associated malignancies of epithelial, hematopoietic, or neuroectodermal origin [38].
GC is a highly heterogeneous disease, and classification systems are useful in identifying tumor subtypes with different behavioral patterns (such as aggressiveness, chemotherapy sensitivity, and prognosis) to personalize treatment. Classically recognized systems are based primarily on histopathological and clinical differences. More recently, molecular classification criteria have emerged as an alternative capable of better translating the clinical heterogeneity of GC. The Cancer Genome Atlas (TCGA) project, for example, identified the following four molecular subtypes of GC based on clinical findings and genomic changes: chromosomal instability (CIN), microsatellite instability-high (MSI), genomically stable (GS), and Epstein-Barr virus (EBV) [39]. Our study did not gather enough details to assign molecular subtypes to the tumors of GC patients. More comprehensive studies, similar to the one conducted by Cristescu et al. [40], may reveal whether the gene expression patterns of CIAPIN1 and UXT (as well as the other genes listed in the Supplementary Table 1) may serve as effective biomarkers of one or more molecular subtypes.
In conclusion, our results suggest that the expression analysis of CIAPIN1 and UXT may predict metastasis and poor prognosis in patients with GC. Furthermore, this study revealed a large panel of genes, whose overexpression is directly or indirectly associated with MYC amplification. These genes can be further explored as strong candidates for biomarkers of GC prognosis and even for the early diagnosis.
Materials and Methods
MYC-silencing in AGP01 cells
This study was initially conducted to silence MYC gene expression in a metastatic GC cell line (AGP01) overexpressing this gene, as previously described [41]. Briefly, a total of 1 × 10⁵ cells were seeded into 12-well cell culture plates, and MYC silencing was done by transfecting AGP01 cells with 3 different small interfering RNAs (Silencer Select siRNAs: s9129, s9130, and s9131; Thermo Fisher Scientific, USA). In parallel, AGP01 cells designated “non-silenced AGP01 cells” were transfected with nontargeting siRNAs to serve as a negative control. Silencer® siRNA Starter kit (Ambion, USA) was used for all siRNA experiments. Relative MYC mRNA levels were measured by real-time quantitative PCR (qRT-PCR assay ID: Hs00153408_m1; Thermo Fisher Scientific), and MYC protein levels were quantitated by western blot. As previously demonstrated, when the AGP01 cell line was treated with siRNA, MYC mRNA and protein expression were reduced more than 70% compared to non-silenced cells. Cell invasion and migration assays, as well as MTT assay indicated that the cells remained viable after transfection [41]. All experiments were performed in triplicate.
RNA/protein extraction and cDNA synthesis
The extraction of total RNA and proteins from AGP01 cell line, with or without siRNA-mediated silencing of MYC gene was performed using the AllPrep DNA/RNA/Protein Mini kit (Qiagen, USA), according to the manufacturer’s instructions. Qualitative and quantitative analysis of RNA and proteins was performed using NanoDrop 2000c spectrophotometer (Thermo Fisher Scientific). RNA integrity was determined by the RNA integrity number (RIN), using Bioanalyzer 2100 platform (Agilent Technologies, USA) [42]. Total RNA was reverse transcribed to cDNA with High Capacity cDNA Reverse Transcription Kit (Applied Biosystems, USA), according to the manufacturer’s instructions.
RNA-seq
AGP01 cell line transcriptome obtained before and after MYC silencing are available in the Gene Expression Omnibus (GEO) database (access codes GSM2147866 and GSM2147867, respectively). RNA-seq was performed using Ion Proton™ platform (Thermo Fisher Scientific). Detailed methods have been described previously [43]. Crude readings were subjected to quality control check, after which the clean readings were aligned to human genome reference sequences (Hg19/GRCh37). The aligned reads were mapped and quantified using TMAP (Torrent Mapping Alignment Program), which supports different alignment algorithms [44–46]. The selection of DEGs was done using bioinformatics and statistical tools, including levels of gene expression and deep analysis. Among the 150 most downregulated genes in the MYC-silenced samples, 3 randomly selected genes (CIAPIN1, MTA2, and UXT) were evaluated by qRT-PCR, western blot, and immunohistochemistry of tumor tissue samples from patients with GC.
Patients
To validate the prognostic relevance and predictive effects of the selected DEGs, clinicopathological data and tumor samples were obtained from 213 patients with GC admitted at João de Barros Barreto University Hospital (HUJBB) in Belém, state of Pará, Brazil, between January 2004 and May 2018. Clinical data and tissue samples (including paired non-neoplastic tissues) of patients treated without preoperative chemotherapy were obtained along with informed consent, with approval from the Ethics Committee of the HUJBB. Tissues were frozen in liquid nitrogen, and stored at –80° C prior to RNA and protein isolation. All tumor samples were histologically diagnosed as gastric adenocarcinoma, and were categorized according to the gender and age variables, tumor location, H. pylori infection (by rapid urease test, urea breath test, histological examination, and CagA virulence factor evaluation by PCR), Epstein-Barr virus infection (by in situ hybridization test), Lauren’s histological classification [47], tumor length (T), lymph node metastasis (N), presence of distant metastasis (T), and staging, according to the TNM system of the American Joint Council on Cancer (AJCC) [48].
The extraction of total RNA, total proteins, and cDNA synthesis was performed same as the methodology described for AGP01 cell line, and RNA integrity was evaluated by GelRed-stained (Biotium, USA) agarose gel electrophoresis.
qRT-PCR
The qRT-PCR assay was performed using 96-well optical plates at following conditions: 95° C for 10 min, followed by 40 cycles of 95° C for 15 sec, and 60° C for 1 min, in a StepOnePlus Real-Time PCR System (Applied Biosystems), according to the TaqMan Gene Expression Master Mix (Applied Biosystems) protocol. The threshold cycle (CT) values were determined as per default instrument settings. Relative quantification of gene expression was performed according to Livak and Schmittgen method [49], using ACTB as reference gene (4333762F; Thermo Fisher Scientific). A corresponding non-neoplastic control sample was used as a calibrator for each tumor sample. Data are expressed as mean ± standard deviation (SD) of fold change in gene expression level in the gastric tumors normalized to the ACTB gene and relative to levels in the adjacent non-neoplastic control sample.
Western blot
Western blot analysis was performed as described previously by Tu et al. [50]. Briefly, primary cancer samples were processed, applied on SDS-polyacrylamide gel, and subjected to electrophoresis. Next, individual proteins in the electrophoresis gel were transferred to a polyvinylidene fluoride membrane and labeled with antibodies specific for the selected DEGs proteins. Immunocomplexes were detected by the chemiluminescence method using the ECL Advance Western blotting kit (GE Healthcare Lifesciences).
Immunohistochemistry
The immunoreactivity of the proteins encoded by selected genes was assessed by immunohistochemistry (anti-CIAPIN1 #PA529259, and anti-UXT #PA518852; Thermo Fisher Scientific) on paraffin-embedded tissue sections. The streptavidin/biotin-peroxidase method described by Hsu et al. was adopted [51], using the modifications suggested by Calcagno et al. [10]. The normality parameter was defined using normal (non-tumoral) gastric tissue samples fixed in formamide and included in paraffin, obtained from the routine material. Immunoreactivity detected in more than 10% of the histological section cells was considered as positive expression.
Statistical analysis
The methods and parameters used to identify DEGs from MYC silenced and non-silenced AGP01 cells have been previously described [43]. Results of qRT-PCR and western blot were analyzed in QuantStudio Flex Real-Time PCR Software (version 1.2.2, Thermo Fisher Scientific). The unpaired Student’s t-test was selected to evaluate the statistically significant differences.
ANOVA followed by Tukey’s test were used to evaluate the association of selected gene expression pattern with clinicopathological variables. Gene expression levels were divided into ‘high’ and ‘low’ using the receiver maximum likelihood (ROC) and area under the ROC curve (AUC). The highest AUC identified the best cut-off expression level that was considered for the Kaplan–Meier analysis. Patients who did not have the event (death) were censored on the last follow-up date or after 6 years and 3 months. The Kaplan–Meier log-rank test was used to estimate the probability of survival for the groups below or above the cut-off for each selected gene. In the statistical analysis (GraphPad Prism 6.0 and R 3.0.2), values of * P< 0.05, **P < 0.01, ***P < 0.001, and ****P < 0.0001 were considered statistically significant.
Abbreviations
GC: gastric cancer; RNA-seq: RNA sequencing; siRNA: small interfering RNA; DEGs: differentially expressed genes; qRT-PCR: real-time quantitative PCR; ROC: receiver maximum likelihood; AUC: area under the ROC curve; MTT: 3-(4, 5-dimethylthiazol-2-yl)-2, 5 diphenyl tetrazolium bromide; ID: identification; GEO: Gene Expression Omnibus; TMAP: Torrent Mapping Alignment Program; HUJBB: João de Barros Barreto University Hospital; ANOVA: analysis of variance; FDR: false discovery rate.
ACKNOWLEDGMENTS AND FUNDING
The authors gratefully acknowledge the financial support from National Counsel of Technological and Scientific Development Científico e Tecnológico – CNPq; grants #402283/2013-9 (RRB) and 449880/2014-1 (GRP), and from municipal government of Parnaíba city, state of Piauí, n° 01/2014 – MacDoubles Fernandes do Nascimento in support of Science, Technology and Innovation (FKY and GRP), as well as PROPESP/UFPA for payment of the publication fee.
CONFLICTS OF INTEREST
The authors declare that they have no conflicts of interest
References
1. Bray F, Ferlay J, Soerjomataram I, Siegel RL, Torre LA, Jemal A. Global cancer statistics 2018: GLOBOCAN estimates of incidence and mortality worldwide for 36 cancers in 185 countries. CA Cancer J Clin. 2018; 68:394–424. https://doi.org/10.3322/caac.21492. [PubMed].
2. Verma R, Sharma P. Next generation sequencing-based emerging trends in molecular biology of gastric cancer. Am J Cancer Res. 2018; 8:207–225. [PubMed].
3. Van Cutsem E, Sagaert X, Topal B, Haustermans K, Prenen H. Gastric cancer. Lancet. 2016; 388:2654–2664. https://doi.org/10.1016/S0140-6736(16)30354-3.
4. Lazăr DC, Avram MF, Romoşan I, Cornianu M, Tăban S, Goldiş A. Prognostic significance of tumor immune microenvironment and immunotherapy: Novel insights and future perspectives in gastric cancer. World J Gastroenterol. 2018; 24:3583–3616. https://doi.org/10.3748/wjg.v24.i32.3583. [PubMed].
5. Stahl P, Seeschaaf C, Lebok P, Kutup A, Bockhorn M, Izbicki JR, Bokemeyer C, Simon R, Sauter G, Marx AH. Heterogeneity of amplification of HER2, EGFR, CCND1 and MYC in gastric cancer. BMC Gastroenterol. 2015; 15:7. https://doi.org/10.1186/s12876-015-0231-4. [PubMed].
6. Wang X, Liu Y, Shao D, Qian Z, Dong Z, Sun Y, Xing X, Cheng X, Du H, Hu Y, Li Y, Li L, Dong B, et al. Recurrent amplification of MYC and TNFRSF11B in 8q24 is associated with poor survival in patients with gastric cancer. Gastric Cancer. 2016; 19:116–127. https://doi.org/10.1007/s10120-015-0467-2. [PubMed].
7. de Souza CR, Leal MF, Calcagno DQ, Costa Sozinho EK, Borges BN, Montenegro RC, Dos Santos AK, Dos Santos SE, Ribeiro HF, Assumpção PP, de Arruda Cardoso Smith M, Burbano RR. MYC deregulation in gastric cancer and its clinicopathological implications. PLoS One. 2013; 8:e64420. https://doi.org/10.1371/journal.pone.0064420. [PubMed].
8. Dang CV. MYC on the path to cancer. Cell. 2012; 149:22–35. https://doi.org/10.1016/j.cell.2012.03.003. [PubMed].
9. Leal MF, Martins do Nascimento JL, da Silva CE, Vita Lamarão MF, Calcagno DQ, Khayat AS, Assumpção PP, Cabral IR, de Arruda Cardoso Smith M, Burbano RR. Establishment and conventional cytogenetic characterization of three gastric cancer cell lines. Cancer Genet Cytogenet. 2009; 195:85–91. https://doi.org/10.1016/j.cancergencyto.2009.04.020. [PubMed].
10. Calcagno DQ, Leal MF, Seabra AD, Khayat AS, Chen ES, Demachki S, Assumpção PP, Faria MH, Rabenhorst SH, Ferreira MV, de Arruda Cardoso Smith M, Burbano RR. Interrelationship between chromosome 8 aneuploidy, C-MYC amplification and increased expression in individuals from northern Brazil with gastric adenocarcinoma. World J Gastroenterol. 2006; 12:6207–6211. https://doi.org/10.3748/wjg.v12.i38.6207. [PubMed].
11. Choi JS, Seo J, Jung EJ, Kim EJ, Lee GK, Kim WH. c -MYC amplification in mucinous gastric carcinoma: a possible genetic alteration leading to deeply invasive tumors. Anticancer Res. 2012; 32:5031–5037. [PubMed].
12. Lou L, Wang Y, Cui J, Yan X, Xue L, Li Y. Differential expression of Pim-3, c-Myc, and p-p27 proteins in adenocarcinomas of the gastric cardia and distal stomach. Tumour Biol. 2014; 35:5029–5036. https://doi.org/10.1007/s13277-014-1664-z. [PubMed].
13. Wang K, Yuen ST, Xu J, Lee SP, Yan HH, Shi ST, Siu HC, Deng S, Chu KM, Law S, Chan KH, Chan AS, Tsui WY, et al. Whole-genome sequencing and comprehensive molecular profiling identify new driver mutations in gastric cancer. Nat Genet. 2014; 46:573–582. https://doi.org/10.1038/ng.2983. [PubMed].
14. Yoshida GJ. Emerging roles of Myc in stem cell biology and novel tumor therapies. J Exp Clin Cancer Res. 2018; 37:173. https://doi.org/10.1186/s13046-018-0835-y. [PubMed].
15. Chen Q, Ge X, Zhang Y, Xia H, Yuan D, Tang Q, Chen L, Pang X, Leng W, Bi F. Plasma miR-122 and miR-192 as potential novel biomarkers for the early detection of distant metastasis of gastric cancer. Oncol Rep. 2014; 31:1863–1870. https://doi.org/10.3892/or.2014.3004. [PubMed].
16. Xia H, Chen Q, Chen Y, Ge X, Leng W, Tang Q, Ren M, Chen L, Yuan D, Zhang Y, Liu M, Gong Q, Bi F. The lncRNA MALAT1 is a novel biomarker for gastric cancer metastasis. Oncotarget. 2016; 7:56209–56218. https://doi.org/10.18632/oncotarget.10941. [PubMed].
17. Lin MT, Song HJ, Ding XY. Long non-coding RNAs involved in metastasis of gastric cancer. World J Gastroenterol. 2018; 24:3724–3737. https://doi.org/10.3748/wjg.v24.i33.3724. [PubMed].
18. Covington KR, Fuqua SA. Role of MTA2 in human cancer. Cancer Metastasis Rev. 2014; 33:921–928. https://doi.org/10.1007/s10555-014-9518-0. [PubMed].
19. Zhou C, Ji J, Cai Q, Shi M, Chen X, Yu Y, Liu B, Zhu Z, Zhang J. MTA2 promotes gastric cancer cells invasion and is transcriptionally regulated by Sp1. Mol Cancer. 2013; 12:102. https://doi.org/10.1186/1476-4598-12-102. [PubMed].
20. Zhou C, Ji J, Cai Q, Shi M, Chen X, Yu Y, Zhu Z, Zhang J. MTA2 enhances colony formation and tumor growth of gastric cancer cells through IL-11. BMC Cancer. 2015; 15:343. https://doi.org/10.1186/s12885-015-1366-y. [PubMed].
21. Zheng X, Zhao Y, Wang X, Li Y, Wang R, Jiang Y, Gong T, Li M, Sun L, Hong L, Li X, Liang J, Luo G, et al. Decreased expression of CIAPIN1 is correlated with poor prognosis in patients with esophageal squamous cell carcinoma. Dig Dis Sci. 2010; 55:3408–3414. https://doi.org/10.1007/s10620-010-1212-7. [PubMed].
22. Nymoen DA, Holth A, Hetland Falkenthal TE, Tropé CG, Davidson B. CIAPIN1 and ABCA13 are markers of poor survival in metastatic ovarian serous carcinoma. Mol Cancer. 2015; 14:44. https://doi.org/10.1186/s12943-015-0317-1. [PubMed].
23. Shi H, Zhou Y, Liu H, Chen C, Li S, Li N, Li X, Zhang X, Zhang H, Wang W, Zhao Q. Expression of CIAPIN1 in human colorectal cancer and its correlation with prognosis. BMC Cancer. 2010; 10:477. https://doi.org/10.1186/1471-2407-10-477. [PubMed].
24. Li X, Hao Z, Fan R, Zou X, Jin H, Pan Y, He L, Du R, Gao L, Liu D, Fan D. CIAPIN1 inhibits gastric cancer cell proliferation and cell cycle progression by downregulating CyclinD1 and upregulating P27. Cancer Biol Ther. 2007; 6:1539–1545. https://doi.org/10.4161/cbt.6.10.4684. [PubMed].
25. Nakasato F, Sakamoto H, Mori M, Hayashi K, Shimosato Y, Nishi M, Takao S, Nakatani K, Terada M, Sugimura T. Amplification of the c-myc oncogene in human stomach cancers. Gan. 1984; 75:737–42. [PubMed].
26. Long-Bao W, Bo-Wen Q, Yan-Xing X. Establishment of human gastric cancer cell line (SGC-7901) intraperitoneally transplantable in nude mice. Recent Advances in Management of Digestive Cancers. 1993; 416–418. https://doi.org/10.1007/978-4-431-68252-3_114.
27. Wang F, Zhang D, Mao J, Ke XX, Zhang R, Yin C, Gao N, Cui H. Morusin inhibits cell proliferation and tumor growth by down-regulating c-Myc in human gastric cancer. Oncotarget. 2017; 8:57187–57200. https://doi.org/10.18632/oncotarget.19231. [PubMed].
28. Yan K, He LJ, Cheng W, Ji ZZ, Zhao BX, Hui XL, Cao SS, Chen B, He L, Liang SH, Miao Y. Inhibiting gastric cancer-associated angiogenesis by CIAPIN1 siRNA. Cancer Biol Ther. 2009; 8:1058–1063. https://doi.org/10.4161/cbt.8.11.8795. [PubMed].
29. Baudino TA, McKay C, Pendeville-Samain H, Nilsson JA, Maclean KH, White EL, Davis AC, Ihle JN, Cleveland JL. c-Myc is essential for vasculogenesis and angiogenesis during development and tumor progression. Genes Dev. 2002; 16:2530–2543. https://doi.org/10.1101/gad.1024602. [PubMed].
30. Zhang Y, Fang J, Ma H. Inhibition of miR-182-5p protects cardiomyocytes from hypoxia-induced apoptosis by targeting CIAPIN1. Biochem Cell Biol. 2018; 96:646–654. https://doi.org/10.1139/bcb-2017-0224. [PubMed].
31. Hao Z, Li X, Qiao T, Du R, Zhang G, Fan D. Subcellular localization of CIAPIN1. J Histochem Cytochem. 2006; 54:1437–1444. https://doi.org/10.1369/jhc.6A6960.2006. [PubMed].
32. Zhao Y, You H, Liu F, An H, Shi Y, Yu Q, Fan D. Differentially expressed gene profiles between multidrug resistant gastric adenocarcinoma cells and their parental cells. Cancer Lett. 2002; 185:211–218. https://doi.org/10.1016/S0304-3835(02)00264-1. [PubMed].
33. Wang J, Xu H, Wang Q, Zhang H, Lin Y, Zhang H, Li Q, Pang T. CIAPIN1 targets Na+/H+ exchanger 1 to mediate MDA-MB-231 cells’ metastasis through regulation of MMPs via ERK1/2 signaling pathway. Exp Cell Res. 2015; 333:60–72. https://doi.org/10.1016/j.yexcr.2015.02.012. [PubMed].
34. Zhao H, Wang Q, Zhang H, Liu Q, Du X, Richter M, Greene MI. UXT is a novel centrosomal protein essential for cell viability. Mol Biol Cell. 2005; 16:5857–5865. https://doi.org/10.1091/mbc.e05-08-0705. [PubMed].
35. Schroer A, Schneider S, Ropers H, Nothwang H. Cloning and characterization of UXT, a novel gene in human Xp11, which is widely and abundantly expressed in tumor tissue. Genomics. 1999; 56:340–343. https://doi.org/10.1006/geno.1998.5712. [PubMed].
36. Wang Y, Schafler ED, Thomas PA, Ha S, David G, Adney E, Garabedian MJ, Lee P, Logan SK. Prostate-specific loss of UXT promotes cancer progression. Oncotarget. 2019; 10:707–716. https://doi.org/10.18632/oncotarget.26573. [PubMed].
37. Qi M, Ganapathy S, Zeng W, Zhang J, Little JB, Yuan ZM. UXT, a novel MDMX-binding protein, promotes glycolysis by mitigating p53-mediated restriction of NF-κB activity. Oncotarget. 2015; 6:17584–17593. https://doi.org/10.18632/oncotarget.3770. [PubMed].
38. Jung M, Russell AJ, Liu B, George J, Liu PY, Liu T, DeFazio A, Bowtell DD, Oberthuer A, London WB, Fletcher JI, Haber M, Norris MD, Henderson MJ. A Myc activity signature predicts poor clinical outcomes in myc-associated cancers. Cancer Res. 2017; 77:971–981. https://doi.org/10.1158/0008-5472.CAN-15-2906. [PubMed].
39. Cancer Genome Atlas Research Network. Comprehensive molecular characterization of gastric adenocarcinoma. Nature. 2014; 513:202–209. https://doi.org/10.1038/nature13480. [PubMed].
40. Cristescu R, Lee J, Nebozhyn M, Kim KM, Ting JC, Wong SS, Liu J, Yue YG, Wang J, Yu K, Ye XS, Do IG, Liu S, et al. Molecular analysis of gastric cancer identifies subtypes associated with distinct clinical outcomes. Nat Med. 2015; 21:449–456. https://doi.org/10.1038/nm.3850. [PubMed].
41. Leal MF, Ribeiro HF, Rey JA, Pinto GR, Smith MC, Moreira-Nunes CA, Assumpção PP, Lamarão LM, Calcagno DQ, Montenegro RC, Burbano RR. YWHAE silencing induces cell proliferation, invasion and migration through the up-regulation of CDC25B and MYC in gastric cancer cells: new insights about YWHAE role in the tumor development and metastasis process. Oncotarget. 2016; 7:85393–85410. https://doi.org/10.18632/oncotarget.13381. [PubMed].
42. Fleige S, Walf V, Huch S, Prgomet C, Sehm J, Pfaffl MW. Comparison of relative mRNA quantification models and the impact of RNA integrity in quantitative real-time RT-PCR. Biotechnol Lett. 2006; 28:1601–1613. https://doi.org/10.1007/s10529-006-9127-2. [PubMed].
43. Maués JH, Ribeiro HF, Pinto GR, Lopes LO, Lamarão LM, Pessoa CM, Moreira-Nunes CF, de Carvalho RM, Assumpção PP, Rey JA, Burbano RM. Gastric cancer cell lines have different MYC-regulated expression patterns but share a common core of altered genes. Can J Gastroenterol Hepatol. 2018; 2018:1–14. https://doi.org/10.1155/2018/5804376. [PubMed].
44. Ning Z, Cox AJ, Mullikin JC. SSAHA: a fast search method for large DNA databases. Genome Res. 2001; 11:1725–1729. https://doi.org/10.1101/gr.194201. [PubMed].
45. Li H, Durbin R. Fast and accurate short read alignment with Burrows-Wheeler transform. Bioinformatics. 2009; 25:1754–1760. https://doi.org/10.1093/bioinformatics/btp324. [PubMed].
46. Li H, Durbin R. Fast and accurate long-read alignment with Burrows–Wheeler transform. Bioinformatics. 2010; 26:589–595. https://doi.org/10.1093/bioinformatics/btp698. [PubMed].
47. Lauren P. The two histological main types of gastric carcinoma: diffuse and so-called intestinal-type carcinoma. An attempt at a histo-clinical classification. Acta Pathol Microbiol Scand. 1965; 64:31–49. https://doi.org/10.1111/apm.1965.64.1.31. [PubMed].
48. Amin MB, Greene FL, Edge SB, Compton CC, Gershenwald JE, Brookland RK, Meyer L, Gress DM, Byrd DR, Winchester DP. The Eighth Edition AJCC Cancer Staging Manual: Continuing to build a bridge from a population-based to a more "personalized" approach to cancer staging. CA Cancer J Clin. 2017; 67:93–99. https://doi.org/10.3322/caac.21388. [PubMed].
49. Livak KJ, Schmittgen TD. Analysis of relative gene expression data using real-time quantitative PCR and the 2ΔΔCT method. Methods. 2001; 25:402–408. https://doi.org/10.1006/meth.2001.1262. [PubMed].
50. Tu WB, Helander S, Pilstål R, Hickman KA, Lourenco C, Jurisica I, Raught B, Wallner B, Sunnerhagen M, Penn LZ. Myc and its interactors take shape. Biochem Biophys Res Commun. 2015; 1849:469–483. https://doi.org/10.1016/j.bbagrm.2014.06.002. [PubMed].
51. Hsu SM, Raine L, Fanger H. A comparative study of the peroxidase-antiperoxidase method and an avidin-biotin complex method for studying polypeptide hormones with radioimmunoassay antibodies. Am J Clin Pathol. 1981; 75:734–738. https://doi.org/10.1093/ajcp/75.5.734. [PubMed].