

Introduction
Ovarian cancer has a 5-year mortality rate of 44.6% and is the second most common gynecologic malignancy in the United States and the deadliest of gynecologic cancers [1, 2]. The majority of these tumors, up to 95%, can be classified as epithelial ovarian cancers (EOC), which are further subdivided into four major histologic subtypes as serous, mucinous, endometrioid, and clear cell ovarian tumors, with serous tumors being the most common histologic subtype [3–5]. Currently, the standard of care for the treatment of most EOC is a combination of taxane and platinum chemotherapy, with only modest improvement in outcomes over the last decade. In order to further improve outcomes, new treatment modalities for these cancers are needed.
Pin1 (protein interacting with NIMA [never in mitosis A]-1) is a conserved peptidyl-prolyl isomerase (PPIase) that catalyzes the cis/trans isomerization of peptide bonds at phosphorylated serine or threonine preceding proline. Proline uniquely has this ability to take on either a cis or trans conformation due to its 5-membered ring, which impacts the function of proline-directed kinases and phosphatases. Pin1 is the only PPIase that specifically recognizes these pSer/pThr-Pro motifs and efficiently catalyzes isomerization at these sites, which is an otherwise slow conversion process further impeded by phosphorylation [6]. These conformational changes then impact catalytic activity, phosphorylation status, protein-protein interactions, subcellular localizations, and stability of substrate proteins. Pin1 has been shown to be involved in the regulation of many cell-cycle regulatory functions including passage through the DNA replication checkpoint [7], centrosome duplication and mitotic progression [8]. In response to DNA damage, p53 is phosphorylated on Ser/Thr-Pro motifs, which facilitates interaction between Pin1 and p53 for the control in cell cycle arrest or apoptosis [9]. Furthermore, Pin1 is responsible for the stability of Nanog, a stem cell transcription factor, and is necessary for the self-renewal of pluripotent embryonic stem cells [10].
It has been shown that Pin1 is important for breast development [11] and is normally expressed in several gynecologic tissues including the fallopian tube and the ovary [12]. However, Pin1 expression is significantly elevated in neoplasia in the reproductive tract [12–14], breast [11, 15], and prostate [16]. In cancer, Pin1 has been shown to activate multiple oncogenes and deactivate multiple growth inhibitors and tumor suppressors, respectively [6, 17–19]. Pin1 function is essential for the tumorigenesis caused by oncogenes Neu and Ras [15, 17]. It can cooperate with mutant p53 for tumor aggressiveness [20] and also expand the cancer stem cell traits in breast cancer [21]. In contrast, ablation of Pin1 function in cancer cells abrogated the cancer cell growth and propagation [17, 22]. Mechanistically, the most important function of Pin1 in cancer growth is the promotion of cell cycle progression. Although this can be attributed by increased transcriptional activity of c-Jun, beta-catenin and NF-κB towards the cyclin D1 promoter and hence overexpression of cyclin D1 [15, 18, 23], the downstream regulator underlying Pin1 function in cell cycle regulation remains largely unknown. In this study, we sought to evaluate the expression and oncogenic function of Pin1 in ovarian cancer, and employ multidisciplinary platforms to investigate its downstream modulator of cell cycle regulation in ovarian cancer cells and the effects of Pin1 inhibitor on different ovarian cancer cell types.
Results
Concurrent elevated expression of Pin1 and Cyclin D1 in tumor samples
The expression of Pin1 and its downstream effector cyclin D1 [15] was determined by immunohistochemistry on a panel of normal ovarian tissue (n = 5), benign tumors (n = 5), borderline tumors (n = 12), and invasive ovarian tumor (n = 44) samples (Supplementary Figure 1). ANOVA analysis with post hoc Tukey’s multiple comparisons has shown significant increase of Pin1 expression in both borderline and invasive tumors versus healthy and benign samples (P = 0.001) as well as among tumor grades, with grade 1 tumors revealing significantly reduced Pin1 expression (P = 0.026) (Table 1). No differences in Pin1 expression were seen among tumors of different histologic subtype or tumor stage (P = 0.068 and 0.078, respectively). Analysis of expression of Pin1 and cyclin D1 showed that overexpression of Pin1 was correlated with cyclin D1 expression (r = 0.684, P = 0.001) (Supplementary Figure 2).
Table 1: Clinical characteristics of Pin1 expression in ovarian specimens
| Characteristics | No. of cases | Mean of scores | P-value |
|---|---|---|---|
| Diagnostic category | |||
| Healthy | 5 | 0.70 | 0.001 |
| Benign | 5 | 1.90 | |
| Borderline | 12 | 6.17 | |
| Invasive | 44 | 5.46 | |
| Histology of cancer | |||
| Serous | 20 | 5.51 | 0.068 |
| Mucinous | 7 | 3.64 | |
| Endometrioid | 10 | 5.10 | |
| Clear Cell | 7 | 6.22 | |
| Tumor differentiation | |||
| Borderline | 12 | 6.05 | 0.026 |
| Grade 1 | 12 | 4.04 | |
| Grade 2 | 10 | 6.25 | |
| Grade 3 | 22 | 6.02 | |
| Stage | |||
| I | 17 | 4.88 | 0.078 |
| II | 14 | 5.11 | |
| III | 23 | 6.50 | |
| IV | 2 | 5.00 | |
Ovarian epithelial cell lines with stable changes in Pin1 expression showed significant changes in cell proliferation and cell cycle distribution
In order to evaluate the functions of Pin1 in ovarian epithelial cells, several cell lines with stable changes in Pin1 expression were established. An immortalized normal human ovarian surface epithelial (HOSE) cell line with ectopic expression of Pin1 was established by introducing an expression plasmid encoding an enhanced green fluorescent protein-tagged wild-type Pin1 (HOSE-Pin1 KI). In addition, two ovarian cancer cell lines, the high-grade serous SKOV3 and mucinous MCAS cancer cell lines harboring short-hairpin RNA to knockdown Pin1 expression, SKOV3-Pin1KD and MCAS-Pin1KD, respectively, were established using Mission™ lentiviral transduction particles. Western blot analysis showed the expected overexpression of eGFP-Pin1 in the HOSE-Pin1 KI cell line, as well as knockdown of Pin1 expression in the Pin1 KD cancer cell lines, when compared with their respective controls (Figure 1A). Cell growth assessment of the resulting cell lines revealed that HOSE Pin-1 KI cells showed significantly increased growth rate compared to HOSE control cell line. Conversely, MCAS-Pin1 KD and SKOV3-Pin1 KD cell lines showed significantly reduced growth rate when compared with control cell lines (Supplementary Figure 3). However, comparison of the cancer cell migration using a real-time xCELLigence system did not reveal any changes in migration rate of the Pin1 knockdown cells (Supplementary Figure 4), suggesting that the changes mediated by Pin1 were primarily in growth regulation.
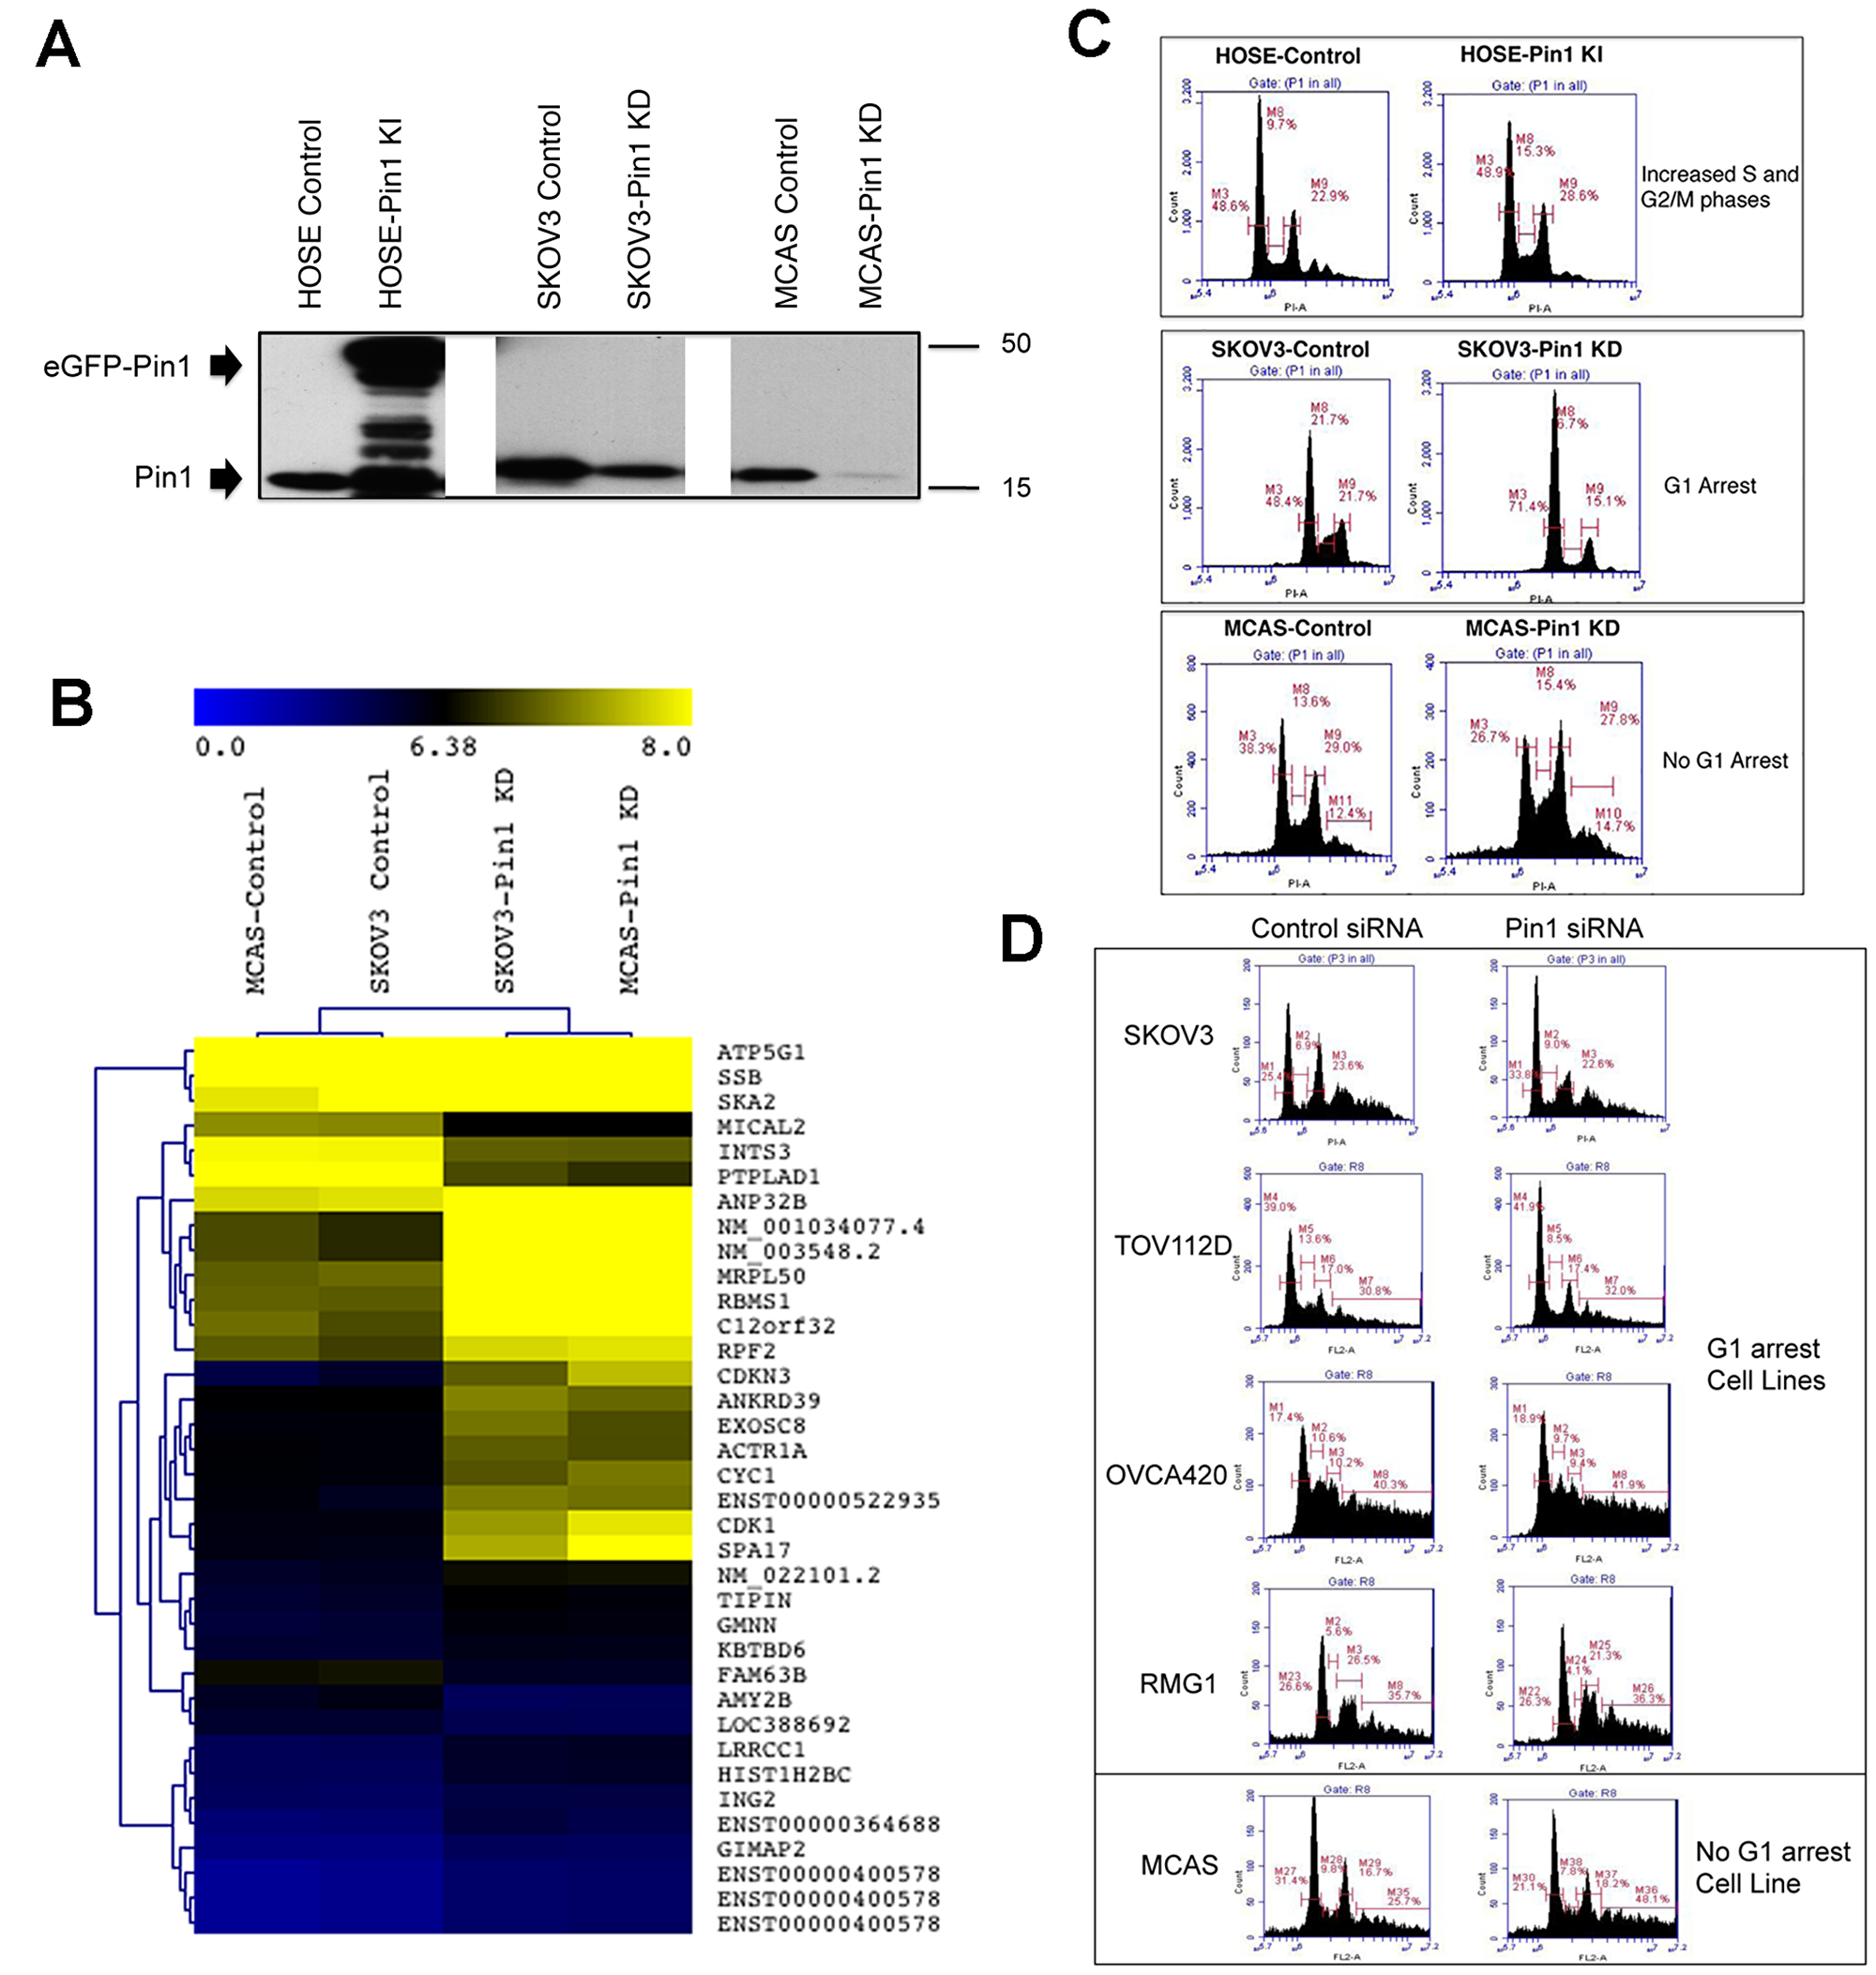
Figure 1: Cell cycle aberration in ovarian epithelial cells with changes of Pin1 expression. (A) Western blot analysis to show Pin1 expression pattern of the Knock-In and Knock-Down cell lines and their respective controls. The enhanced green fluorescent protein-Pin1 (eGFP-Pin1) fusion protein and wild-type Pin1 protein were marked by arrowheads. (B) Heat map to show the significant differentially expressed genes between control and Pin1-KD cancer cell lines. (C) Flow cytometry graphs of cell lines with changes of Pin1 expression and the respective controls. (D) Flow cytometry graphs of cell lines transfected with Pin1 siRNA or control siRNA.
In order to identify the major molecular pathways disrupted in the cancer cells with Pin1 knockdown, gene expression profiling was performed. Clustering analysis of the microarray gene expression profiling data revealed significant changes in gene expression in both SKOV3 and MCAS knockdown cell lines compared with the respective controls (Figure 1B). Pathway enrichment analysis of the differentially expressed genes revealed the most significant functional changes were involved in various cell cycle progression and checkpoint controls (Supplementary Table 1).
To investigate how Pin1 function affected cell growth, cells with changes of Pin1 and the control cells were stained with propidium iodide and analyzed by flow cytometry (Figure 1C). As expected, HOSE cell line with ectopic expression of Pin1 showed increased S and G2/M phases. However, the SKOV3 and MCAS Pin1 knockdown cells did not show the same cell cycle distribution. In SKOV3-Pin1 KD cells, there was a significant cell cycle arrest at G1 (71.4% versus 48.4% in control cells). In contrast, MCAS-Pin1 KD cells showed a minor decrease in G1 and G2/M phases (Figure 1C). To further investigate the differing phenotypes of Pin1 knockdown in cancer cells, we sought to employ small interfering RNA (siRNA) to transiently knockdown Pin1 expression in a number of cancer cell lines and performed flow cytometry of the resulting cells to determine the cell cycle distribution. Although the magnitude of cell cycle changes was not as high as in stable cell lines, most of the tested cell lines showed G1 arrest. MCAS cells still showed a decrease in G1 phase (Figure 1D).
A screen of phospho-protein tyrosine kinases identified SRC phosphorylation in response to cellular Pin1 level and cell cycle progression in HOSE and serous cancer cell lines, but not in mucinous ovarian cancer cell lines
Since gene expression profiling was not sensitive enough to pinpoint the differences between SKOV3 and MCAS Pin1 knockdown cancer cells in cell cycle dysregulation, we had to rely upon another profiling method to identify the determining factor for a G1 arrest phenotype after Pin1 knockdown. As most of the transformation phenotypes including accelerating cell growth arise through aberrant activation of oncogenic pathways and recent whole genome sequencing has identified that protein kinases are the largest family of cancer genes with frequent activation mutations in human cancers [24–26], we therefore employed a Luminex bead-based multiplex platform [27] to screen the phosphorylation status of a panel of protein tyrosine kinases in the HOSE-Pin1 KI and SKOV3-Pin1 KD cell lines relative to their respective controls. The Luminex immunosandwich assay used a variety of specific antibodies to capture different phospho-tyrosine kinases in the cell lysates. The results of this screen showed that there was an increase in SRC phosphorylation in HOSE-Pin1 KI cells revealed by two phospho-SRC antibodies; while the binding to the phospho-SRC anibodies and to one phospho-EGFR antibody was slightly decreased in the SKOV3-Pin1 KD cells (Figure 2A). Use of the antibody specific to phosphorylated Tyr416 (pTyr416) of SRC in Western blot analysis of cell lysates confirmed that this tyrosine residue was significantly phosphorylated in HOSE-Pin1 KI cells relative to HOSE control cells (Figure 2B), implicating increased SRC activity in the KI cells. On the contrary, the same tyrosine residue of SRC was significantly dephosphorylated in SKOV3-Pin1 KD cells relative to SKOV3 control cells (Figure 2B), implicating reduced SRC activity in the Pin1 KD cancer cells. In addition, use of the antibody specific to phospho-tyrosine 845 of EGFR protein in the Western blot analysis showed that there was no detectable EGFR phosphorylation in both HOSE KI and control cell lines, whereas there was a reduction in the EGFR phosphorylation in SKOV3-Pin1 KD cells relative to control cells, which was consistent with the Luminex assay results. To our surprise, the pTyr416 result of MCAS-Pin1 KD cells was opposite to that of the SKOV3 counterpart, in which the phosphorylation of Tyr416 was increased in the MCAS knockdown cell line, similar to the HOSE-Pin1 KI cells (Figure 2B). There was also no EGFR phosphorylation at Tyr845 in the MCAS cell lines, even though EGFR was expressed.
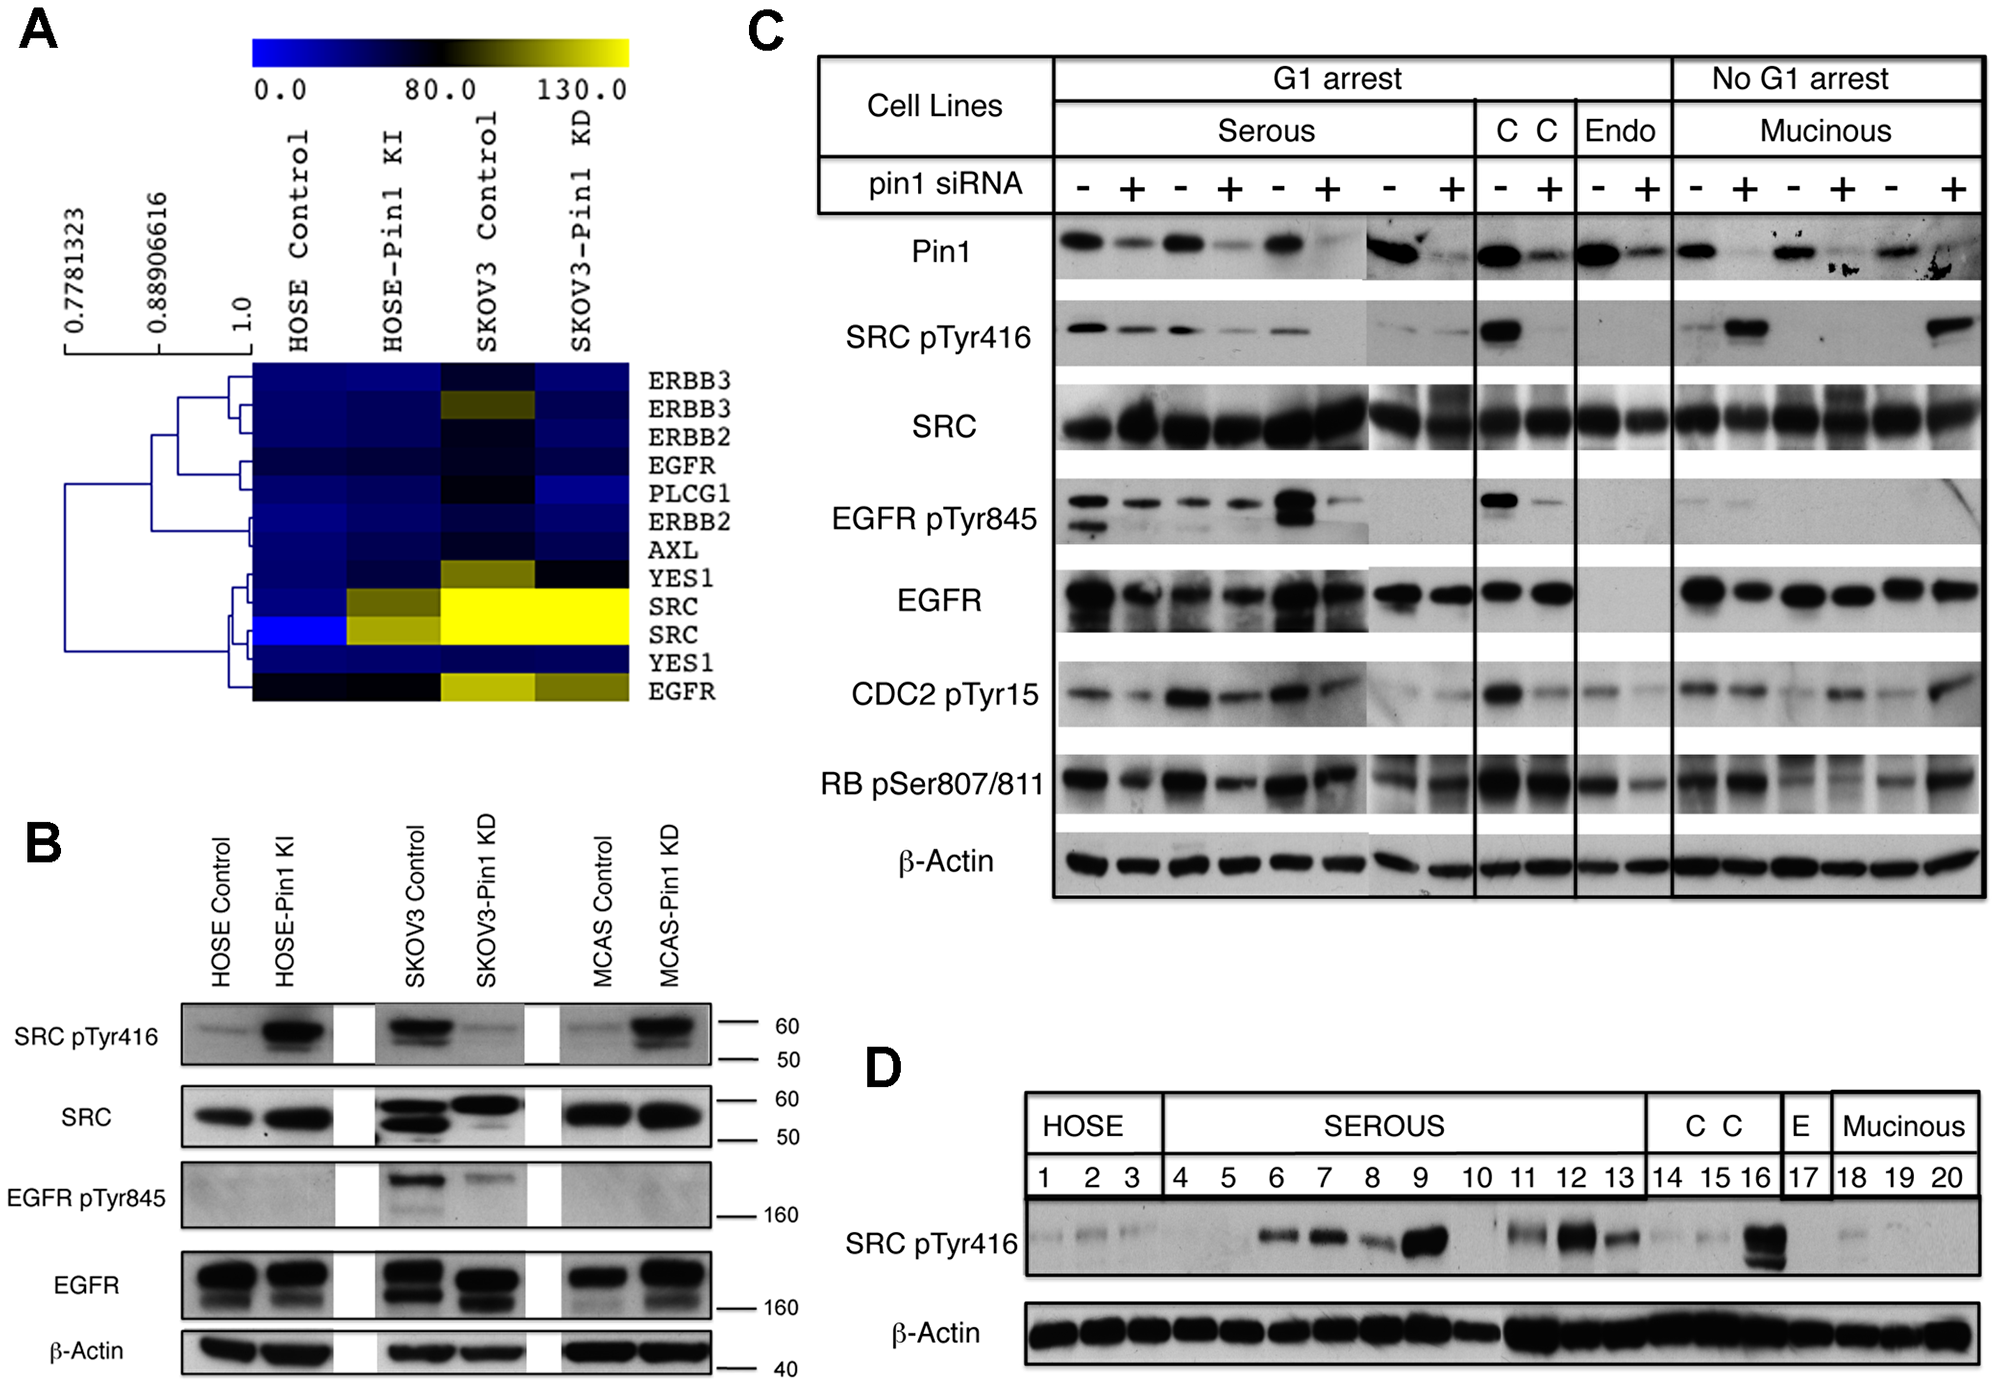
Figure 2: Changes of Pin1 expression affect the phosphorylation status of SRC, EGFR and cell cycle regulators in ovarian epithelial cells. (A) Heat map to show the significant phospho-tyrosine kinases revealed by the Luminex screen. (B) Western blot analysis of ovarian cell lysates to confirm the SRC and EGFR phosphorylation status in the ovarian cell lines. β–actin was used as loading control. (C) Western blot analysis of ovarian cancer cell lines after transfection with control (-) or Pin1 (+) siRNAs. The serous cancer cell lines used were: SKOV3 (lanes 1 and 2); OVCA432 (lanes 3 and 4); OVCA429 (lanes 5 and 6); and OVCA420 (lanes 7 and 8). The clear cell (CC) ovarian cancer cell line used was RMG1 (lanes 9 and 10). The endometrioid (Endo) ovarian cancer cell line used was TOV112D (lanes 11 and 12). The three mucinous ovarian cancer cell lines used were: RMUGS (lanes 13 and 14); RMUGL (lanes 15 and 16); and MCAS (lanes 17 and 18). (D) Western blot analysis to reveal the SRC pTyr416 status of the ovarian epithelial cell lines. Lane 1: IOSE80PC; lane 2: IOSE80; lane 3: HOSE 1-15; lane 4: OVCA3; lane 5: OVCA420; lane 6: OVCA432; lane 7: OVCA433; lane 8: SKOV3-IP; lane 9: Hey-8; lane 10: OVCA680; lane 11: DOV13; lane 12: SKOV3; lane 13: OVCA429; lane 14: OVCA810; lane 15: TOV21G; lane 16: RMG1; lane 17: TOV112D; lane 18: RMUGS; lane 19: RMUGL; and lane 20: MCAS. β–actin was used as loading control.
To further pursue how Pin1 knockdown affected the status of SRC pTyr416 in association with cell cycle in other cancer cell lines, we employed Pin1 siRNA transfection to suppress Pin1 expression and probed the SRC phosphorylation at Tyr416 by Western blot analysis. The collective results of these cell lines categorized according to G1 arrest or not and tumor subtypes in Figure 2C showed that within the group of cancer cell lines that were G1 arrest after Pin1 knockdown, three out of four serous cancer cell lines and the clear cell cancer cell line showed reduced SRC phosphoryaltion at Tyr416. Two of the four serous cancer cell lines and the clear cell cancer cell line also showed reduced EGFR phosphorylation at Tyr845. For the mucinous cancer cell lines that did not show G1 arrest after Pin1 knockdown, two out of three cell lines showed increase of SRC phosphoryaltion at Tyr416. There was no EGFR phosphorylation in the mucinous cancer cell lines regardless of whether they were treated with Pin1 siRNA or not. For the single endometrioid cancer cell line in our panel, although it showed G1 arrest after Pin1 knockdown, there was no SRC phosphorylation, and this cell line also showed loss of EGFR expression.
We further investigated the status of two phosphoproteins that were the major controllers for cell cycle progression to determine whether their status corresponded to the G1 arrest status of the cancer cell lines after Pin1 knockdown. Activation of CDC2 is the universal event controlling the onset of mitosis, which is regulated by inhibitory phosphorylation at Tyr15 [28, 29]. Of the six G1 arrest cancer cell lines, five had reduced level of CDC2 phosphorylation at Tyr15 after Pin1 kncokdown, indicating that migration through G2/M phase was promoted in these cell lines. On the other hand, two of the three mucinous cell lines showed increased CDC2 phosphorylation, suggesting that they likely were arrested in G2/M phase [28, 29]. For the G1 phase restriction control of cell cycle, the retinoblastoma tumor suppressor protein RB is the major G1 phase controller and its inactivation via phosphorylaton at Ser807/811 will allow cell cycle progression [30, 31]. Four of the G1 arrest cell lines showed reduced RB protein phosphorylation after Pin1 knockdown, suggesting that active RB protein might be responsible for the G1 arrest. On the other hand, two of the three mucinous cancer cell lines showed increased RB phosphorylation, supporting the notion that inactivation of RB protein in these cell lines allowed the cell cycle to progress through G1 phase.
As the results of cell cycle regulatory proteins in Figure 2C suggested that the activity of these proteins corresponded mostly to the pTyr416 status of SRC, a Western blot analysis was performed to evaluate the SRC pTyr416 status for all the cancer cell lines according to histologic subtypes (Figure 2D). SRC was highly phosphorylated in many cancer cell lines, in particular the serous subtype, whereas all of the three mucinous ovarian cancer cell lines showed much lower SRC phosphorylation.
Since p53 mutation status can have an impact on Pin1 in regulating cell cycle and tumor aggressiveness [9, 20], we searched Cancer Cell Line Encyclopedia (CCLE) portal at Broad Institute (https://portals.broadinstitute.org/ccle) and a publication by Anglesio et al. [32] for p53 mutation status of the ovarian cancer cell lines. SKOV3 has a deleterious p53 frame-shift mutation, and five cancer cell lines (OVCA3, OVCA420, DOV13, TOV112D, and RMUGS) have missense mutations. While the hotspot missense mutations of OVCA420 and TOV112D are predicted to have deleterious protein structures [33], we do not have any information for the missense mutations of the other three cancer cell lines. There is also a report suggesting that Pin1 has p53-indpendent function [34]. Hence, we currently do not know if p53 plays a role in the observed differences between mucinous and other ovarian cancer cell types.
Knockdown of SRC expression phenocopied Pin1 knockdown in cell cycle regulation
Characterization of cancer cell lines with Pin1 knockdown in Figure 2 showed opposite SRC phosphorylation pattern and cell cyle phenotypes between serous and mucinous cancer cell lines. We next asked whether SRC was the downstream mediator of the Pin1 function in cell cycle regulation and therefore performed a SRC siRNA knockdown experiment with wild-type SKOV3 and MCAS cells to determine if SRC knockdown per se mimicked the cell cycle phenotypes of Pin1 knockdown in these two cell lines. Western blot analysis showed that the knockdown efficiency of the two siRNAs was not very high, only siRNA1 showed modest SRC knockdown in the transfected SKVO3 cancer cells (Figure 3A). Nevertheless, transfection of SRC siRNA1 into wild-type SKOV3 cells resulted in an increase of cancer cells in G1 phase, whereas the transfection in wild-type MCAS cells resulted in a decrease of G1 phase (Figure 3B). Hence SRC inhibition phenocopied Pin1 knockdown in causing G1 arrest in serous cancer cells but not in mucinous cancer cells.
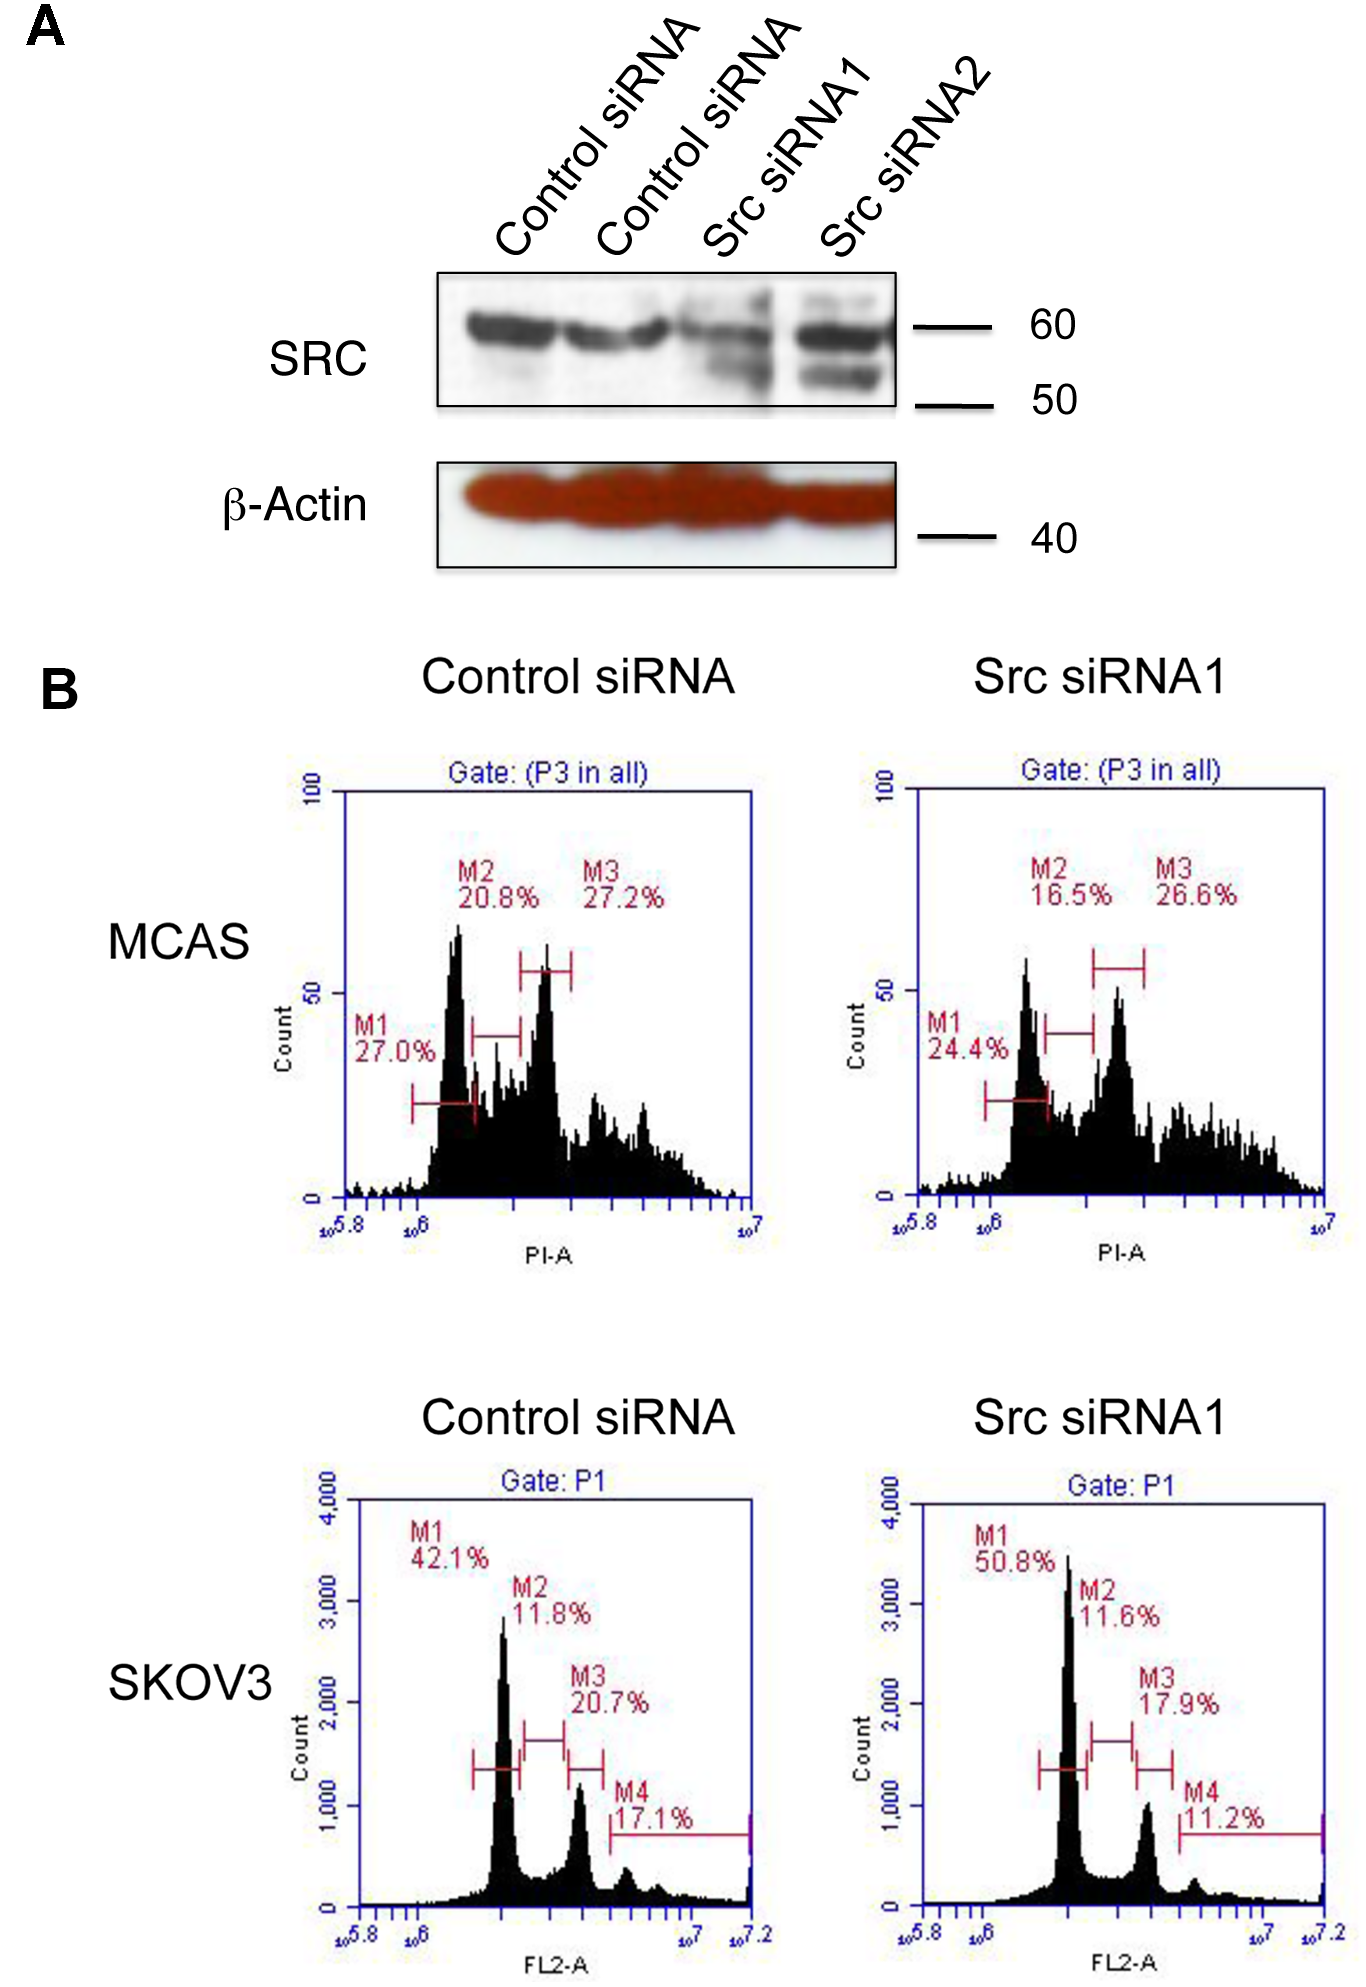
Figure 3: SRC knockdown phenocopied Pin1 knockdown phenotype in cell cycle regulation. (A) Western blot analysis to show SRC expression of wild-type SKOV3 cells after siRNA transfection. β–actin was used as loading control. (B) Flow cytometry graphs to show the cell cycle distribution of wild-type MCAS and SKOV3 cells after SRC siRNA transfection.
Type-specific sensitivity of ovarian cancer cell lines to Pin1 and SRC inhibitors
As a starter to test whether the cellular status of Pin1 and SRC affects the sensitivity of cancer cell lines to respective inhibtors, we compared the sensitivity of Pin1 knockdown cancer cell lines and control cell lines to SRC inhibitor Dasatinib. MCAS-Pin1 KD cell lines showed increased sensitivity to Dasatinib compared to MCAS control line (Figure 4A), whereas SKOV3-Pin1 KD cell lines did not show consistent differences (Figure 4B). As cancer cells from different tumor types responded to Pin1 knockdown differently, we further evaluated if they also differed in response to Pin1 inhibitor Juglone. The three mucinous cancer cell lines showed IC50 values that ranged between 2.4-fold (MCAS) and five-fold (RMGUL) higher than the average of the values of serous and clear cell cancer cell lines (Figure 4C). However, with an addition of 2 μM of Dasatinib, which would result in less than 10% cell kill as a single treatment to the mucinous cancer cell lines, provided significant synergistic cell death together with Juglone (Figure 4D). In contrast, the serous ovarian cancer cell lines did not show significant additional cell death with the same combinational drug treatment (Figure 4E).
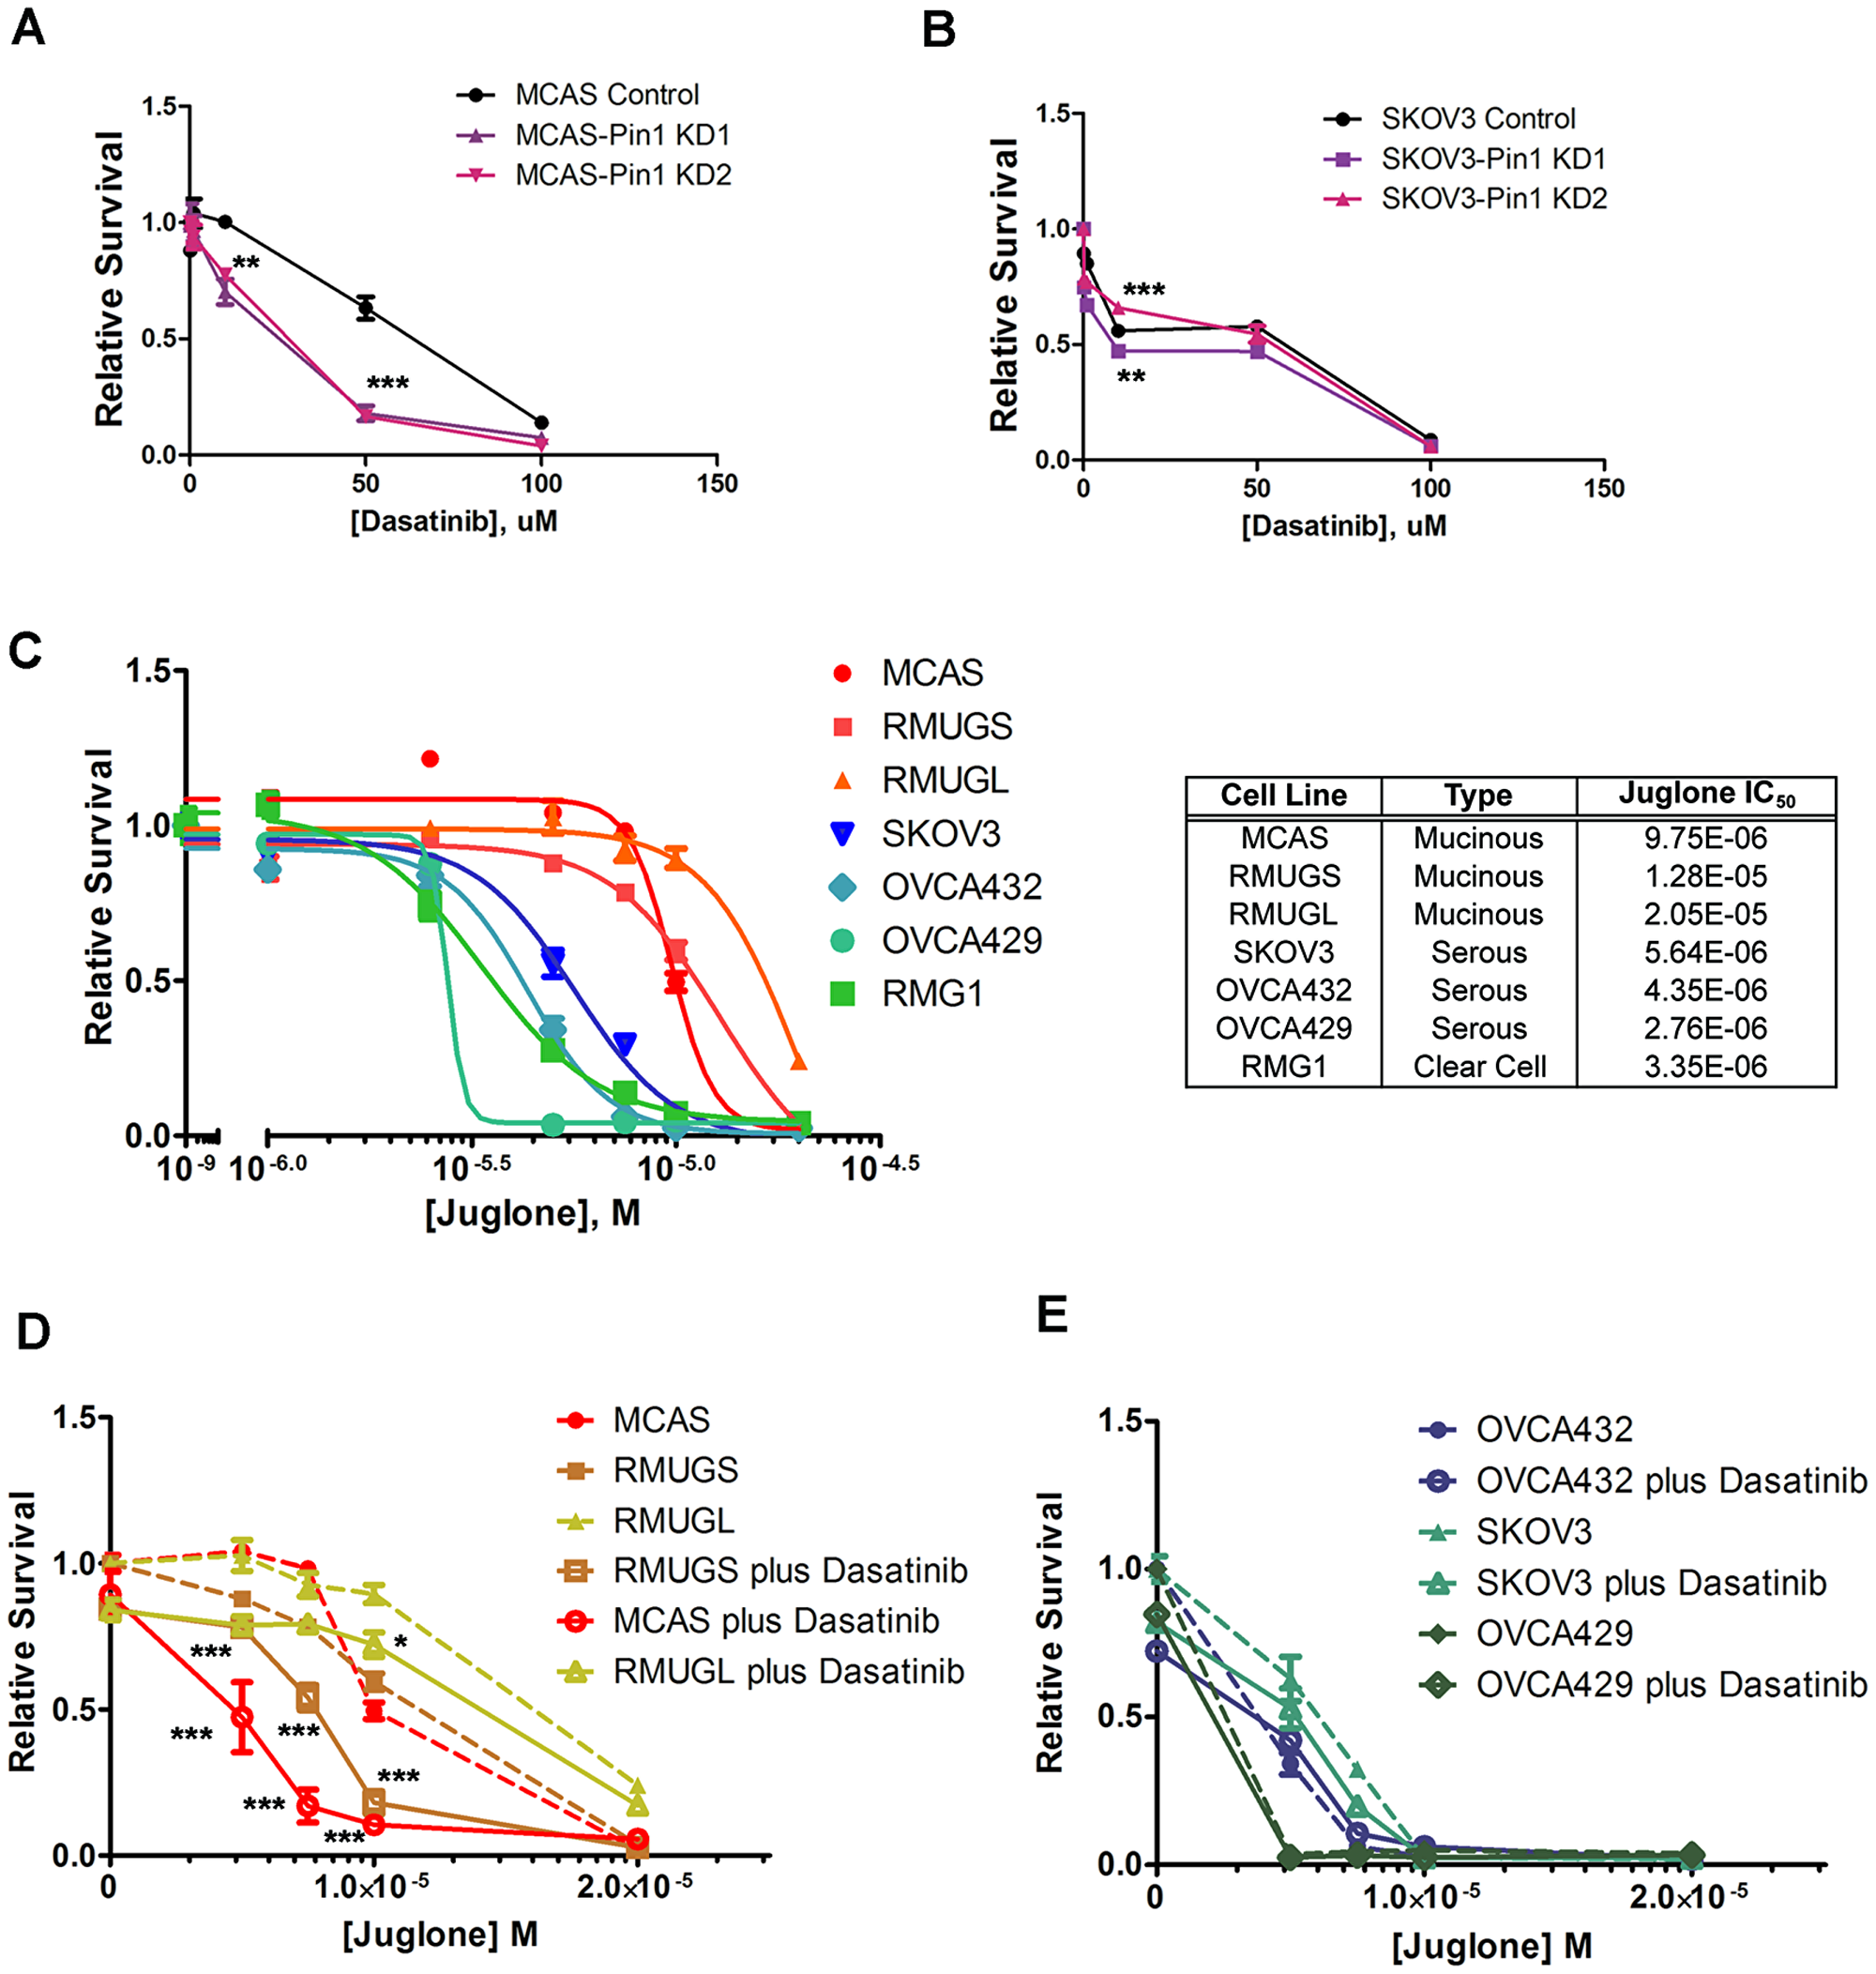
Figure 4: Tumor type-specific response of ovarian cancer cell lines to Pin1 and SRC inhibitors. Relative survival curves of (A) MCAS and (B) SKOV3 control cell lines and Pin1 knockdown cell lines to SRC inhibitor Dasatinib. (C) Relative survival curves and deduced IC50 values of wild-type ovarian cancer cell lines to Pin1 inhibitor Juglone. The mucinous ovarian cancer cell lines are shown in red-orange colors, whereas the serous and RMG1 cancer cell lines are shown in blue-green colors. Relative survival curves of (D) mucinous ovarian cancer cell lines and (E) serous ovarian cancer cell lines to Juglone in the presence (solid lines) or absence (broken lines) of 2 μM of Dasatinib. For all the graphs, cell survival is relative to that of the cancer cells without the indicated drug treatment. Significance levels: ***P < 0.001; **P < 0.01; *P < 0.05.
DISCUSSION
Pin1 is a conserved prolyl isomerase that catalyzes cis-trans isomerization of peptide bonds at phosphorylated serine or threonine preceding proline, whose isomerization is slowed down by phosphorylation [6]. Because of its unique function, Pin1 is involved in many different intracellular activities. As such, we sought to investigate the functional role of Pin1 and its impact on ovarian carcinogenesis and potential as a possible therapeutic target. The expression of Pin1 has been shown to be significantly elevated in neoplasia in reproductive tract [12–14], breast [11, 15], and prostate [16], our immunohistochemical staining for Pin1further supports this in ovarian cancer, particularly in invasive and high-grade tumor samples (Table 1). The expression of Pin1 in the invasive ovarian tumor samples was also highly correlated with cyclin D1 expression, consistent with the finding that elevated Pin1 function led to increased transcriptional activity of c-Jun, beta-catenin and NF-κB towards the cyclin D1 promoter and hence overexpression of cyclin D1 [15, 18, 23].
Pin1 is known for the regulation of cell cycle [7, 8]. As expected, ectopic expression of Pin1 accelerated cell growth in normal HOSE cells and knockdown of Pin1expression slowed the growth of cancer cells, suggesting that over-expression of Pin1 in ovarian cancer contributed to aberrant cell growth without any influence on cancer cell migration (Supplementary Figures 3 and 4). The result of gene expression profiling also supported the phenotypes of the KD cancer cells, in which the majority of differentially expressed genes were involved in cell-cycle progression and checkpoint mechanisms regulating cell growth. Flow cytometric analysis of the HOSE-Pin1 KI and SKOV3-Pin1 KD cell lines also showed concordant results, with HOSE cell line with ectopic expression of Pin1 showing increased S and G2/M phases, whereas knockdown of Pin1 expression in SKOV3 cancer cells showed G1 arrest (Figure 1C).
Luminex phospho-tyrosine kinase screening of the HOSE and SKOV3 cell lines revealed significant variations of SRC phosphorylation in response to Pin1 expression status, and the use of a SRC pTyr416 antibody in Western blot analysis of the cell lysates derived from the KI and KD cell lines, as well as in the Pin1 siRNA knockdown experiment also confirmed this novel relationship between Pin1 and SRC in cell cyle regulation (Figure 2). Hence, elevated expression of Pin1 in most of the normal and cancer cells led to SRC phosphorylation at Tyr416, which likely mediated cell cycle progression function downstream of Pin1. On the contrary, knockdown of Pin1 function led to dephosphorylation of SRC at Tyr416 and G1 arrest. Further investigation of the status of the cell cycle regulatory proteins such as CDC2 that is responsible for G2/M progression [28, 29], and pRB in G1 phase restriction [30, 31] was consistent with the cell cycle phenotypes demonstrated by the majority of cell lines after Pin1 knockdown. Mamidipudi et al. have reported that overexpression of RACK1 receptor in cells induced a partial G1 arrest by suppressing SRC activity at the G1 checkpoint [35]. There are also reports showing that iron depletion resulted in SRC inhibition and cell cycle arrest in G1 phase in neuroblastoma cells [36], and the use of pharmacologic inhibitor of SRC arrested cells in G1 phase [37]. Hence, SRC activity might be a universal focal point for signaling pathways to regualte G1 phase for most of the cell types. Indeed, partial knockdown of SRC expression in wild-type SKOV3 cancer cells in our SRC siRNA transfection experiment phenocopied Pin1 function in G1 arrest (Figure 3), further confirming that Pin1 acts through SRC in cell cycle regulation. This novel finding may have significant clinical value, as SRC-targeting therapies such as dasatanib [38, 39] may have better profile to treat ovarian cancer patients with Pin1-overexpression.
It is unlikely that SRC is a direct target of Pin1. However, Pin1 controls a plethora of proliferation regulating pathways including pRB/CDK/Cyclin D1, p53, WNT, NF-κB, and PI3K/AKT and growth factor pathways, which might have interactions with SRC. For example, EGFR dephosphorylation was also observed in SKOV3 and some other ovarian cancer cell lines with Pin1 knockdown (Figure 2). There have been reports implicating the cross-talk between SRC and EGFR, in which SRC mediated phosphorylation of EGFR at Tyr845 [40, 41]. However, overt EGFR phosphorylation in response to Pin1 status was not observed in normal HOSE cells and mucinous ovarian cancer cells and hence the contribution of EGFR in Pin1-mediated cell cycle regulation may not be as significant as SRC. More studies are warranted to study the link between Pin1 function and SRC activity.
It is intriguing that the effects of Pin1 knockdown on SRC phosphorylation and cell cycle phenotype in mucinous ovarian cancer cell lines were opposite to most of the other cancer cell lines. We are aware that there are controversies about the tumor types some of the cancer cell lines represent. For example, studies to compare the genomic and expression profiles of cancer cell lines with clinical samples have suggested that SKOV3 is not a serous cancer cell line (neither is it a mucinous cancer cell line) [32, 42]; and OVCA429 developed tumor with clear cell morphology when it was growing as xenografts in nude mice [43]. However, these controversies did not affect the three mucinous cancer cell lines and the observed differences between mucinous cancer cells and cancer cells from other tumor types. Mucinous ovarian cancer cell lines also showed lower sensitivity to Pin1 inhibitor Juglone compared with other cancer cell types and required Dasatinib to promote cell death (Figure 4). The clinical characteristics of mucinous ovarian carcinomas are distinct from other ovarian tumor subtypes. While treatment of SRC inhibitor dasatinib arrested other cell types in G1 phase [37], it was reported that treatment of dasatinib did not affect cell-cycle distribution in mucinous ovarian cancer cells [44]. In a study to examine the response of tyrosine kinases including SRC in different ovarian cancer cell lines to platelet-activating factor induction, the mucinous ovarian cancer cell lines also showed very subdued response when compared with ovarian cancer cell lines of other histologic subtypes [45]. One possible explanation for this subtype-specific difference might be the frequent dysregulation of the Ras pathway in mucinous ovarian cancers [46], as activated Ras pathway has been reported to interact with Pin1 in increasing cyclin D1 expression [15]. In additon, there might be a different mechanism or pathway that is responsible for the observed suppression of cell growth in MCAS and a few cancer cell lines that did not show SRC dephosphorylation after Pin1 knockdown and warrants further investigation.
In conclusion, this is the first report to identify SRC as the central effector to mediate Pin1 function in promoting ovarian cancer cell proliferation and tumor growth. Mucinous ovarian cancer cells, however, are distinct that targeting Pin1 function actually leads to increased SRC activity. Advanced stage mucinous ovarian carcinoma is drug-resistant and associated with shorter survival time after progression or recurrence of disease than with serous histology. SRC was found highly activated after chemotherapy among mucinous ovarian carcinomas [44, 47]. Hence, combination therapy employing both Pin1 inhibitor and SRC inhibitor may be a promising therapeutic approach for patients with mucinous ovarian carcinoma.
Materials and Methods
Clinical specimens and ovarian cell lines
All clinical specimens were collected and archived under protocols approved by the Human Subjects Committee of the Brigham and Women’s Hospital, Boston, Massachusetts. Samples were collected as discarded materials from patients undergoing surgery for a diagnosis of ovarian cancer and confirmed histologically by pathologists. Cases were staged according to the International Federation of Gynecology and Obstetrics (FIGO) system. Control subjects underwent hysterectomy or oophorectomy for benign indications.
The normal human ovarian surface epithelial (HOSE) cells immortalized by an HPV E6/E7 gene introduction and ovarian cancer cell lines have been described previously [48]. All ovarian cell lines were maintained in a mixture of medium 199 and MCDB105 medium (1:1) (Sigma, St. Louis, MO) supplemented with 10% fetal calf serum (Invitrogen, Carlsbad, CA).
Immunohistochemistry
Standard immunohistochemistry (IHC) with microwave in 0.1M citrate buffer (pH 6.0) as the antigen retrieval method was performed on archived normal, benign, and malignant specimens using reagents from Vector Laboratories, Inc (Burlingame, CA, USA) as described previously [48]. The Pin1 antibody was from Cell Signaling Technology, Inc (Danvers, MA). The monoclonal anti-cyclinD1 antibody was from BD Biosciences (San Jose, CA). After incubation, the reaction was visualized using Vectastain Elite ABC Kit with diaminobenzidine chromogen as a substrate (Vector Laboratories, Burlingame, CA) and counterstained lightly with hematoxylin and mounted. Immunohistochemical results were evaluated semi-quantitatively by considering the percentage and intensity of the staining [48].
Establishment of HOSE cell lines with ectopic expression of Pin 1 and ovarian cancer cell lines with knockdown expression of Pin1, and subsequent functional assays
The enhanced green fluorescent protein-tagged wild-type Pin1 expression construct, pEGFP-C1-Pin1, has been described [49]. Mission™ lentiviral Pin1-targeting and non-target control shRNA constructs were purchased from Sigma-Aldrich (St. Louis, MO). The production of transduction particles and infection of ovarian cancer cells were performed according to manufacturer’s protocol. The TRC numbers for the knockdown of pin1 expression are TRCN0000001033 and TRCN0000001036. Since cell lines established using both knockdown constructs behaved similarly in cell growth study, only the cell lines established with TRCN0000001036 were included in the comparative studies.
Cell proliferation was determined by seeding 3 × 10⁴ cells to 35-mm culture dishes and allowed to grow to different time points. Every other day, the number of cells in three culture dishes were manually counted using a hemacytometer and averaged for each cell line. Real-time cell migration assay was performed using an xCELLigence system (Roche Applied Science, Indianapolis, IN, USA), which measured electrical impedance across interdigitated gold microelectrodes on the bottom of a Boyden chamber for quantitative kinetic data of cell migration. The culture plate was assembled on the RTCA DP analyzer, with cells resuspended in serum-free medium in the upper chamber and either serum-free medium or medium containing 10% fetal bovine serum was present in the lower chamber. Data were gathered at 5 minute intervals for 24 hours at 37 °C in 5% CO2 chamber. The data obtained were analyzed using the RTCA software (Roche Applied Science, Indianapolis, IN). All the functional assays were performed in triplicates and repeated twice.
Western blot analysis
Total cell lysates were prepared from growing cells using RIPA buffer (50 mM Tris HCl pH 8, 150 mM NaCl, 1% NP-40, 0.5% sodium deoxycholate and 0.1% SDS) supplemented with PhosStop phosphatase inhibitor cocktail and Complete protease inhibitor cocktail (Roche Applied Science, Indianapolis, IN). 20 μg of total cell lysates of the cell lines were resolved by sodium dodecyl sulfate-polyacrylamide gel electrophoresis (SDS-PAGE) and transferred to a polyvinylidene fluoride (PVDF) membrane using a SEMI-DRY Transfer cell (Bio-Rad Laboratories, Hercules, CA). Standard Western blot analysis was performed using primary antibodies from Cell Signaling Technology, Inc (Danvers, MA) and horseradish peroxidase chemiluminescence using Supersignal west pico kit (Pierce Biotechnology, Rockford, IL).
Microarray gene expression profiling and analysis
RNA was extracted from pelleted cells using TRIzol reagent (Invitrogen, Carlsbad, CA). The quality and quantity of the RNA were tested using Bioanalyzer (Agilent Technologies, Santa Clara, CA). 4.5 μg of RNA from each sample was used for target labeling by a two-round amplification protocol and expression profiles were acquired using Affymetrix 1.1 Human Gene ST arrays (Santa Clara, CA) and processed on the Affymetrix GeneAtlas Fluidic station according to the manufacturer’s instructions. All Affymetrix control genes were removed from the expression data and the remaining Affymetrix probe clusters were imported into the Affymetrix Power Tools software (APT package). The data were processed using Robust Mutichip Average (RMA) preprocessing followed by “per chip” normalization across all samples. Differentially expressed genes were identified using significance analysis of microarrays (SAM) with the R package ‘samr’, based on false discovery rate (FDR) < 0.05 and fold change >2. Two-dimensional hierarchical clusters were generated using TMeV 4.8 software. Differentially expressed genes between the control cell lines and the cell lines with changes of Pin1 were imported into the Ingenuity Systems Pathway Analysis (www.ingenuity.com) to identify significant annotated pathways.
Phospho-tyrosine kinase profiling
The Luminex immunosandwich kinase profiling assay has been described previously [27]. Luminex xMAP microspheres were coupled separately to capture antibodies against individual kinases using Sulfo-NHS (Pierce Biotechnology, Rockford, IL). The antibody-coupled beads were then incubated with 100 μg of cell lysates in individual wells of a 96-well microtiter plate (EMD Millipore, Bedford, MA). After washing twice with phosphate-buffered saline (PBS) plus 1% bovine serum albumin, biotin-conjugated anti-phosphotyrosine antibody 4G10 (EMD Millipore, Bedford, MA) was added and incubated for 30 min while shaking. After washing, the mixture was incubated with 0.2 μg of R-phycoerythrin streptavidin conjugates (Invitrogen, Carlsbad, CA) for 10 min. The samples were then washed and analyzed using a Luminex 100 instrument (Luminex, Austin, TX). Values were background-subtracted, normalized and analyzed similar to microarray data [27]. Heatmap was generated using TMeV 4.8 software.
Transient gene knockdown and cell cycle analysis
Ovarian cell lines were transfected with 20 pmol of siRNAs in Opti-MEM® reduced serum medium (Invitrogen, Carlsbad, CA) using Lipofectamine™ 2000 reagent (Invitrogen, Carlsbad, CA) according to the manufacturer’s recommendation. Mission siRNA against human Pin1 (SASI_Hs01_00180075 and SASI_Hs01_00180077) and SRC (SASI_Hs01_00112905 and SASI_Hs01_00112907) were purchased from Sigma-Aldrich (St. Louis, MO). For cell cycle analysis, single cells were resuspended in ice-cold 70% ethanol, washed twice with 1× PBS and once with 1× PBS supplemented with 0.1% (v/v) TritonX-100 (Sigma-Aldrich, St. Louis, MO) and resuspended in 50 μg ml/L propidium iodide staining buffer in the presence of 300 μg ml/L RNase A for 30 min at room temperature. Samples were analyzed using an Accuri C6 flow cytometer (BD Biosciences, San Jose, CA).
Drug sensitivity assays
Pin1 inhibitor Juglone and SRC inhibitor Dasatinib were purchased respectively from EMD Millipore (Billerica, MA) and Selleckchem (Houston, TX) and dissolved in dimethyl sulfoxide according to the manufacturers’ recommendation. For the assays, 5000 cells were seeded in each well of a 96-well microtiter plate and serial dilutions of drugs were added on the following day. Cell viability was determined after 48 hr of incubation, using a MTT cell proliferation assay kit (Sigma-Aldrich, St. Louis, MO). Data was analyzed using the Prism software from GraphPad, Inc (San Diego, CA).
Statistical analysis
All calculations were performed with MINITAB statistical software (Minitab, State College, PA) unless otherwise indicated. ANOVA with post hoc Tukey’s multiple comparisons test was used to determine any significant differences of immunohistochemistry scores between groups. For the functional assays, significance of differences was determined using 2-tailed T-Test, with P-value less than 0.05 was considered statistically significant.
ACKNOWLEDGMENTS
This work was generously supported by William F. Milton Fund of Harvard University (to SWN). We also acknowledge the support of the Robert and Deborah First Fund, the Sperling Family Fund Foundation, Ruth N. White Gynecologic Oncology Research Fund, Women’s Cancer Program and Gillette Center for Women’s Cancer from Dana-Farber Cancer Institute, Ovarian Cancer Research Foundation, Adler Foundation, Inc., and Friends of Dana Farber Cancer Institute to The Laboratory of Gynecologic Oncology at Brigham and Women’s Hospital.
CONFLICTS OF INTEREST
The authors have no potential conflicts of interest to disclose.
References
1. Howlader N, Noone AM, Krapcho M, Garshell J, Miller D, Altekruse SF, Kosary CL, Yu M, Ruhl J, Tatalovich Z, Mariotto A, Lewis DR, Chen HS, et al. SEER Cancer Statistics Review, 1975-2012. Bethesda, MD: National Cancer Institute; 2015.
2. American Cancer Society. Cancer Facts and Figures. American Cancer Society, Inc; 2015.
3. Rodriguez M, Dubeau L. Ovarian tumor development: insights from ovarian embryogenesis. Eur J Gynaecol Oncol. 2001; 22:175–183. [PubMed].
4. Dubeau L. The cell of origin of ovarian epithelial tumours. Lancet Oncol. 2008; 9:1191–7. https://doi.org/10.1016/S1470-2045(08)70308-5.
5. Prat J. New insights into ovarian cancer pathology. Ann Oncol. 2012; 23:x111–7. https://doi.org/10.1093/annonc/mds300.
6. Lee TH, Pastorino L, Lu KP. Peptidyl-prolyl cis-trans isomerase Pin1 in ageing, cancer and Alzheimer disease. Expert Rev Mol Med. 2011; 13:e21. https://doi.org/10.1017/S1462399411001906. [PubMed].
7. Lu KP, Zhou XZ. The prolyl isomerase PIN1: a pivotal new twist in phosphorylation signalling and disease. Nat Rev Mol Cell Biol. 2007; 8:904–916. https://doi.org/10.1038/nrm2261. [PubMed].
8. Suizu F, Ryo A, Wulf G, Lim J, Lu KP. Pin1 regulates centrosome duplication, and its overexpression induces centrosome amplification, chromosome instability, and oncogenesis. Mol Cell Biol. 2006; 26:1463–1479. https://doi.org/10.1128/MCB.26.4.1463-1479.2006. [PubMed].
9. Zheng H, You H, Zhou XZ, Murray SA, Uchida T, Wulf G, Gu L, Tang X, Lu KP, Xiao ZX. The prolyl isomerase Pin1 is a regulator of p53 in genotoxic response. Nature. 2002; 419:849–853. https://doi.org/10.1038/nature01116. [PubMed].
10. Moretto-Zita M, Jin H, Shen Z, Zhao T, Briggs SP, Xu Y. Phosphorylation stabilizes Nanog by promoting its interaction with Pin1. Proc Natl Acad Sci USA. 2010; 107:13312–13317. https://doi.org/10.1073/pnas.1005847107. [PubMed].
11. Wulf G, Ryo A, Liou YC, Lu KP. The prolyl isomerase Pin1 in breast development and cancer. Breast Cancer Res. 2003; 5:76–82. https://doi.org/10.1186/bcr572. [PubMed].
12. Bao L, Kimzey A, Sauter G, Sowadski JM, Lu KP, Wang DG. Prevalent overexpression of prolyl isomerase Pin1 in human cancers. Am J Pathol. 2004; 164:1727–1737. https://doi.org/10.1016/S0002-9440(10)63731-5. [PubMed].
13. Jawanjal P, Salhan S, Dhawan I, Tripathi R, Rath G. Peptidyl-prolyl isomerase Pin1-mediated abrogation of APC-beta-catenin interaction in squamous cell carcinoma of cervix. Rom J Morphol Embryol. 2014; 55:83–90. [PubMed].
14. Saegusa M, Hashimura M, Kuwata T. Pin1 acts as a modulator of cell proliferation through alteration in NF-kappaB but not beta-catenin/TCF4 signalling in a subset of endometrial carcinoma cells. J Pathol. 2010; 222:410–420. https://doi.org/10.1002/path.2773. [PubMed].
15. Wulf GM, Ryo A, Wulf GG, Lee SW, Niu T, Petkova V, Lu KP. Pin1 is overexpressed in breast cancer and cooperates with Ras signaling in increasing the transcriptional activity of c-Jun towards cyclin D1. EMBO J. 2001; 20:3459–3472. https://doi.org/10.1093/emboj/20.13.3459. [PubMed].
16. Ayala G, Wang D, Wulf G, Frolov A, Li R, Sowadski J, Wheeler TM, Lu KP, Bao L. The prolyl isomerase Pin1 is a novel prognostic marker in human prostate cancer. Cancer Res. 2003; 63:6244–6251. [PubMed].
17. Wulf G, Garg P, Liou YC, Iglehart D, Lu KP. Modeling breast cancer in vivo and ex vivo reveals an essential role of Pin1 in tumorigenesis. EMBO J. 2004; 23:3397–3407. https://doi.org/10.1038/sj.emboj.7600323. [PubMed].
18. Ryo A, Nakamura M, Wulf G, Liou YC, Lu KP. Pin1 regulates turnover and subcellular localization of beta-catenin by inhibiting its interaction with APC. Nat Cell Biol. 2001; 3:793–801. https://doi.org/10.1038/ncb0901-793. [PubMed].
19. Zhou XZ, Lu KP. The isomerase PIN1 controls numerous cancer-driving pathways and is a unique drug target. Nat Rev Cancer. 2016; 16:463–478. https://doi.org/10.1038/nrc.2016.49. [PubMed].
20. Girardini JE, Napoli M, Piazza S, Rustighi A, Marotta C, Radaelli E, Capaci V, Jordan L, Quinlan P, Thompson A, Mano M, Rosato A, Crook T, et al. A Pin1/mutant p53 axis promotes aggressiveness in breast cancer. Cancer Cell. 2011; 20:79–91. https://doi.org/10.1016/j.ccr.2011.06.004. [PubMed].
21. Luo ML, Gong C, Chen CH, Lee DY, Hu H, Huang P, Yao Y, Guo W, Reinhardt F, Wulf G, Lieberman J, Zhou XZ, Song E, et al. Prolyl isomerase Pin1 acts downstream of miR200c to promote cancer stem-like cell traits in breast cancer. Cancer Res. 2014; 74:3603–3616. https://doi.org/10.1158/0008-5472.CAN-13-2785. [PubMed].
22. Ryo A, Uemura H, Ishiguro H, Saitoh T, Yamaguchi A, Perrem K, Kubota Y, Lu KP, Aoki I. Stable suppression of tumorigenicity by Pin1-targeted RNA interference in prostate cancer. Clin Cancer Res. 2005; 11:7523–7531. https://doi.org/10.1158/1078-0432.CCR-05-0457. [PubMed].
23. Ryo A, Suizu F, Yoshida Y, Perrem K, Liou YC, Wulf G, Rottapel R, Yamaoka S, Lu KP. Regulation of NF-kappaB signaling by Pin1-dependent prolyl isomerization and ubiquitin-mediated proteolysis of p65/RelA. Mol Cell. 2003; 12:1413–1426. https://doi.org/10.1016/S1097-2765(03)00490-8. [PubMed].
24. Greenman C, Stephens P, Smith R, Dalgliesh GL, Hunter C, Bignell G, Davies H, Teague J, Butler A, Stevens C, Edkins S, O’Meara S, Vastrik I, et al. Patterns of somatic mutation in human cancer genomes. Nature. 2007; 446:153–158. https://doi.org/10.1038/nature05610. [PubMed].
25. Wood LD, Parsons DW, Jones S, Lin J, Sjoblom T, Leary RJ, Shen D, Boca SM, Barber T, Ptak J, Silliman N, Szabo S, Dezso Z, et al. The genomic landscapes of human breast and colorectal cancers. Science. 2007; 318:1108–1113. https://doi.org/10.1126/science.1145720. [PubMed].
26. Futreal PA, Coin L, Marshall M, Down T, Hubbard T, Wooster R, Rahman N, Stratton MR. A census of human cancer genes. Nat Rev Cancer. 2004; 4:177–183. https://doi.org/10.1038/nrc1299. [PubMed].
27. Du J, Bernasconi P, Clauser KR, Mani DR, Finn SP, Beroukhim R, Burns M, Julian B, Peng XP, Hieronymus H, Maglathlin RL, Lewis TA, Liau LM, et al. Bead-based profiling of tyrosine kinase phosphorylation identifies SRC as a potential target for glioblastoma therapy. Nat Biotechnol. 2009; 27:77–83. https://doi.org/10.1038/nbt.1513. [PubMed].
28. Wells NJ, Watanabe N, Tokusumi T, Jiang W, Verdecia MA, Hunter T. The C-terminal domain of the Cdc2 inhibitory kinase Myt1 interacts with Cdc2 complexes and is required for inhibition of G(2)/M progression. J Cell Sci. 1999; 112:3361–3371. [PubMed].
29. Atherton-Fessler S, Liu F, Gabrielli B, Lee MS, Peng CY, Piwnica-Worms H. Cell cycle regulation of the p34cdc2 inhibitory kinases. Mol Biol Cell. 1994; 5:989–1001. https://doi.org/10.1091/mbc.5.9.989. [PubMed].
30. Knudsen ES, Wang JY. Dual mechanisms for the inhibition of E2F binding to RB by cyclin-dependent kinase-mediated RB phosphorylation. Mol Cell Biol. 1997; 17:5771–5783. https://doi.org/10.1128/MCB.17.10.5771. [PubMed].
31. Lundberg AS, Weinberg RA. Functional inactivation of the retinoblastoma protein requires sequential modification by at least two distinct cyclin-cdk complexes. Mol Cell Biol. 1998; 18:753–761. https://doi.org/10.1128/MCB.18.2.753. [PubMed].
32. Anglesio MS, Wiegand KC, Melnyk N, Chow C, Salamanca C, Prentice LM, Senz J, Yang W, Spillman MA, Cochrane DR, Shumansky K, Shah SP, Kalloger SE, et al. Type-specific cell line models for type-specific ovarian cancer research. PLoS One. 2013; 8:e72162. https://doi.org/10.1371/journal.pone.0072162. [PubMed].
33. Baugh EH, Ke H, Levine AJ, Bonneau RA, Chan CS. Why are there hotspot mutations in the TP53 gene in human cancers? Cell Death Differ. 2018; 25:154–160. https://doi.org/10.1038/cdd.2017.180. [PubMed].
34. Shimizu T, Bamba Y, Kawabe Y, Fukuda T, Fujimori F, Takahashi K, Uchida C, Uchida T. Prolyl isomerase Pin1 regulates doxorubicin-inducible P-glycoprotein level by reducing Foxo3 stability. Biochem Biophys Res Commun. 2016; 471:328–333. https://doi.org/10.1016/j.bbrc.2016.02.014. [PubMed].
35. Mamidipudi V, Zhang J, Lee KC, Cartwright CA. RACK1 regulates G1/S progression by suppressing Src kinase activity. Mol Cell Biol. 2004; 24:6788–6798. https://doi.org/10.1128/MCB.24.15.6788-6798.2004. [PubMed].
36. Siriwardana G, Seligman PA. Iron depletion results in Src kinase inhibition with associated cell cycle arrest in neuroblastoma cells. Physiol Rep. 2015; 3:e12341. https://doi.org/10.14814/phy2.12341. [PubMed].
37. Ma JG, Huang H, Chen SM, Chen Y, Xin XL, Lin LP, Ding J, Liu H, Meng LH. PH006, a novel and selective Src kinase inhibitor, suppresses human breast cancer growth and metastasis in vitro and in vivo. Breast Cancer Res Treat. 2011; 130:85–96. https://doi.org/10.1007/s10549-010-1302-4. [PubMed].
38. Puls LN, Eadens M, Messersmith W. Current status of SRC inhibitors in solid tumor malignancies. Oncologist. 2011; 16:566–78. https://doi.org/10.1634/theoncologist.2010-0408. [PubMed].
39. Zhang S, Yu D. Targeting Src family kinases in anti-cancer therapies: turning promise into triumph. Trends Pharmacol Sci. 2012; 33:122–8. https://doi.org/10.1016/j.tips.2011.11.002. [PubMed].
40. Biscardi JS, Maa MC, Tice DA, Cox ME, Leu TH, Parsons SJ. c-Src-mediated phosphorylation of the epidermal growth factor receptor on Tyr845 and Tyr1101 is associated with modulation of receptor function. J Biol Chem. 1999; 274:8335–8343. https://doi.org/10.1074/jbc.274.12.8335. [PubMed].
41. Sato K. Cellular functions regulated by phosphorylation of EGFR on Tyr845. Int J Mol Sci. 2013; 14:10761–90. https://doi.org/10.3390/ijms140610761. [PubMed].
42. Domcke S, Sinha R, Levine DA, Sander C, Schultz N. Evaluating cell lines as tumour models by comparison of genomic profiles. Nat Commun. 2013; 4:2126. https://doi.org/10.1038/ncomms3126. [PubMed].
43. Shaw TJ, Senterman MK, Dawson K, Crane CA, Vanderhyden BC. Characterization of intraperitoneal, orthotopic, and metastatic xenograft models of human ovarian cancer. Mol Ther. 2004; 10:1032–1042. https://doi.org/10.1016/j.ymthe.2004.08.013. [PubMed].
44. Matsuo K, Nishimura M, Bottsford-Miller JN, Huang J, Komurov K, Armaiz-Pena GN, Shahzad MM, Stone RL, Roh JW, Sanguino AM, Lu C, Im DD, Rosenshien NB, et al. Targeting SRC in mucinous ovarian carcinoma. Clin Cancer Res. 2011; 17:5367–78. https://doi.org/10.1158/1078-0432.CCR-10-3176. [PubMed].
45. Aponte M, Jiang W, Lakkis M, Li MJ, Edwards D, Albitar L, Vitonis A, Mok SC, Cramer DW, Ye B. Activation of platelet-activating factor receptor and pleiotropic effects on tyrosine phospho-EGFR/Src/FAK/paxillin in ovarian cancer. Cancer Res. 2008; 68:5839–48. https://doi.org/10.1158/0008-5472.CAN-07-5771. [PubMed].
46. Mackenzie R, Kommoss S, Winterhoff BJ, Kipp BR, Garcia JJ, Voss J, Halling K, Karnezis A, Senz J, Yang W, Prigge ES, Reuschenbach M, Doeberitz MV, et al. Targeted deep sequencing of mucinous ovarian tumors reveals multiple overlapping RAS-pathway activating mutations in borderline and cancerous neoplasms. BMC Cancer. 2015; 15:415. https://doi.org/10.1186/s12885-015-1421-8. [PubMed].
47. Liu T, Hu W, Dalton HJ, Choi HJ, Huang J, Kang Y, Pradeep S, Miyake T, Song JH, Wen Y, Lu C, Pecot CV, Bottsford-Miller J, et al. Targeting SRC and tubulin in mucinous ovarian carcinoma. Clin Cancer Res. 2013; 19:6532–43. https://doi.org/10.1158/1078-0432.CCR-13-1305. [PubMed].
48. Huang KC, Park DC, Ng SK, Lee JY, Ni X, Ng WC, Bandera CA, Welch WR, Berkowitz RS, Mok SC, Ng SW. Selenium binding protein 1 in ovarian cancer. Int J Cancer. 2006; 118:2433–2440. https://doi.org/10.1002/ijc.21671. [PubMed].
49. Lu PJ, Zhou XZ, Liou YC, Noel JP, Lu KP. Critical role of WW domain phosphorylation in regulating phosphoserine binding activity and Pin1 function. J Biol Chem. 2002; 277:2381–4. https://doi.org/ 10.1074/jbc.C100228200. [PubMed].