
Introduction
Papillary thyroid cancer (PTC) is one of the most prevalent malignancies and comprises the majority of all thyroid cancers [1]. Although the most of PTC exhibit slow disease progression and increasing ultrasonography screening has contributed to early detection of PTC and providing more treatment options for patients, ~10% of patients are still diagnosed with advanced or metastatic disease [2].
Accumulation of genetic alterations and epigenetic gene modifications are one of the hallmarks of cancer [3]. Cancer emerges as a result of such epigenetic changes or genetic abnormalities [4]. In differentiated thyroid cancers, several genetic alterations such as BRAFV600E mutation, RET/PTC or PAX8/PPARγ translocation and RAS mutation are thought involved in carcinogenesis in thyroid follicular cells, and further genetic change drives stepwise dedifferentiation of cancer cells [5]. A growing body of evidences have demonstrated that complicated mechanisms of carcinogenesis and cancer progression cannot be solved by genetic alterations alone, but also involve epigenetic modifications such as DNA methylation, histone modifications, and microRNA expression [6]. The differentiation and proliferation of thyroid cancer cells are strongly affected by epigenetic alterations, results in cancer progression [7]. Accordingly, it is important approach to seek into epigenetic mechanisms in thyroid cancer progression in order to identify a clinically available biomarker.
HOPX (GeneBank accession number NT 022853), also known as HOP, NECC1, LAGY or OB1, belongs to a homeobox gene family, and is involved in gene transcription. Three spliced transcript variants (HOPX-α, -β, and -γ) encode a same protein, which is a transcriptional corepressor that is essential for the normal development of the mammalian organs [8]. HOPX expression is ubiquitous in a variety of normal tissues, but is attenuated in malignant tissues including choriocarcinoma, lung, uterine endometrial, breast, and gastrointestinal cancers [9–17]. The mechanisms of HOPX inactivation is essentially caused by promoter DNA methylation in endometrial, esophageal, gastric, colorectal, and breast cancer. Moreover, enforced HOPX expression inhibited tumor progression, and knockdown of endogenous HOPX restored the tumor aggressiveness by influencing several mechanism of cancer cell activities [12, 18, 19]. These evidences suggest that the HOPX plays a role as a tumor suppressor gene.
Using a pharmacological unmasking microarray method, we have identified novel tumor suppressor genes which are epigenetically silenced in a cancer-specific manner [20]. Among them, promoter methylation of HOPX is observed very frequently in a cancer-specific manner, and is correlated with worse long-term prognosis in esophageal squamous cell carcinoma [21], gastric cancer [14], colorectal cancer [12], pancreas cancer [15], and breast cancer [13]. We revealed that HOPX plays suppressive roles in tumor angiogenesis, proliferation, or invasion [12]. Despite that epigenetic DNA modifications may be critical events also in thyroid cancer, the clinical importance and the involved mechanisms of HOPX in thyroid cancer has been elusive. In this study, HOPX expression and the DNA promoter methylation status were assessed in human thyroid cancer tissues and cell lines. Here, we particularly focused on the clinical impact of epigenetic silencing of HOPX in PTC that comprises the majority of thyroid cancer.
Results
Structure of HOPX promoter region
The CpG islands of the promoter region of HOPX is shown in Figure 1A. HOPX has 3 transcript variants, of which only HOPX-β harbors promoter CpG islands (promoter B) encompassed by the first exon and intron. All 3 transcript variants share the same open reading frame.
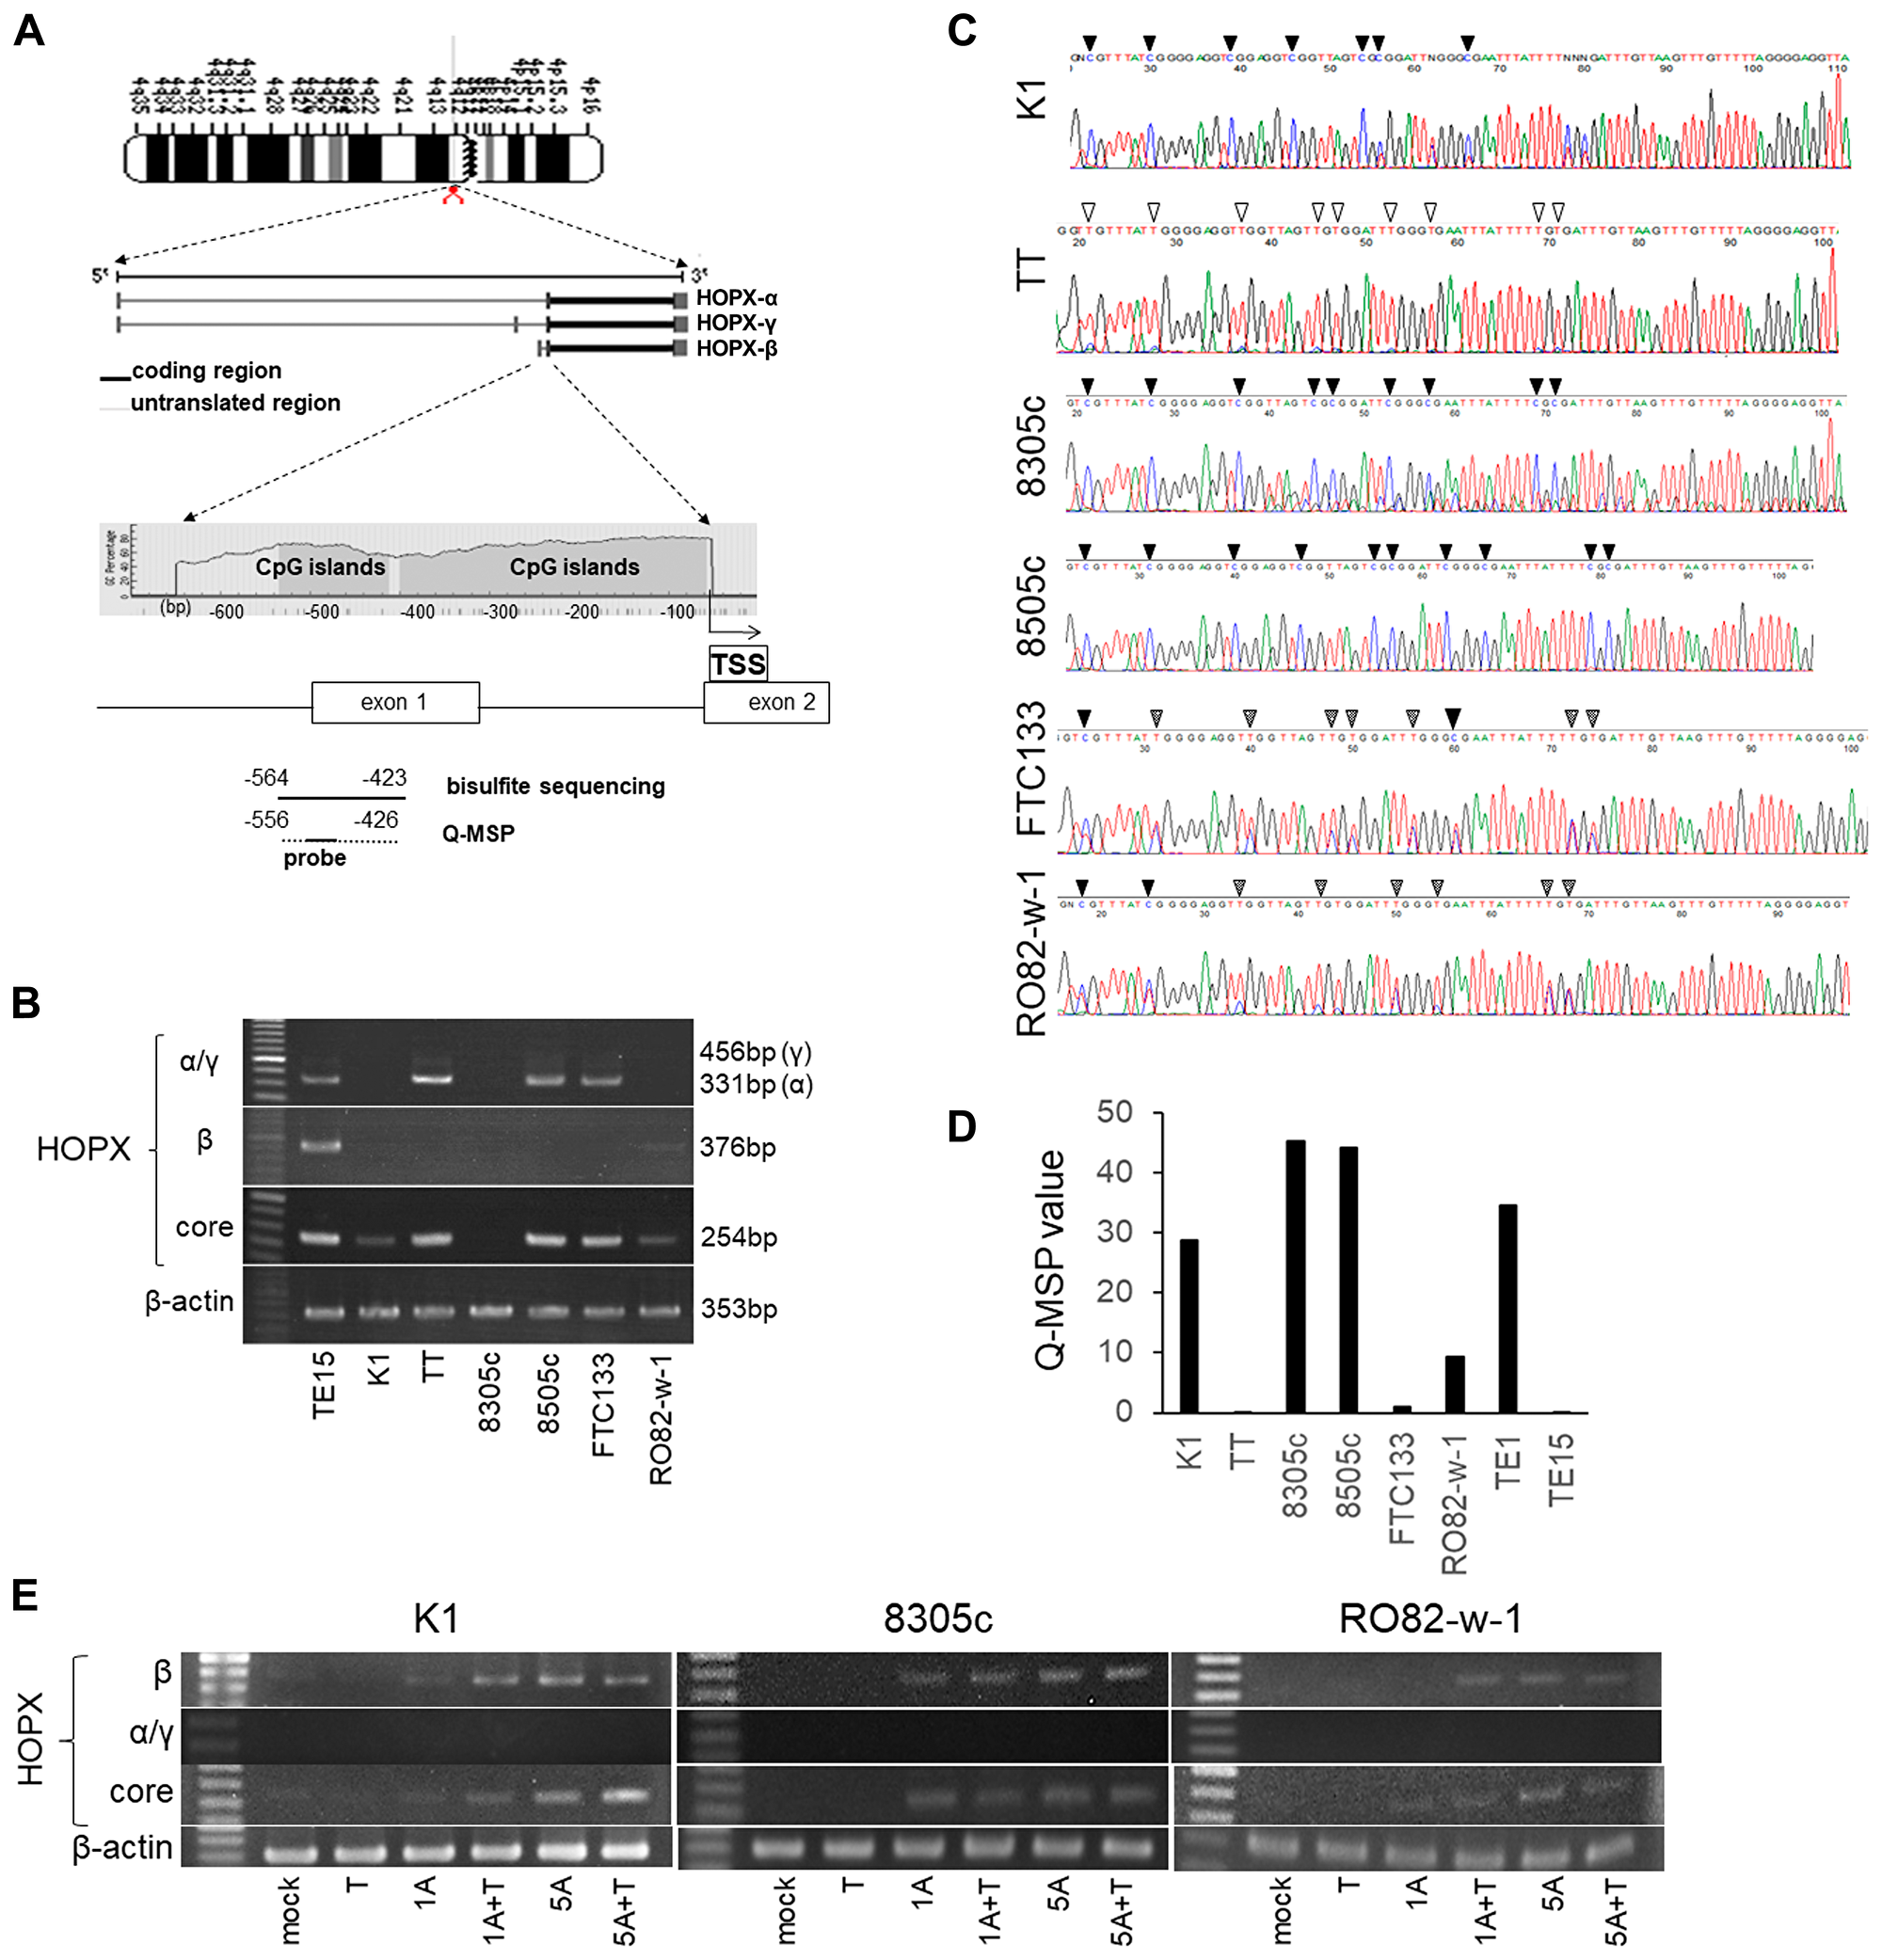
Figure 1: Analysis of promoter DNA methylation of HOPX and its expression in human papillary thyroid cancer (PTC) cell lines. (A) Schematic diagram of the genes coding 3 spliced transcript variants of HOPX (the second middle panel) and CpG islands (gray area) in the 5′-flanking region of HOPX (bottom panel). Arrows with dotted lines below the bottom panel indicate the sequences for bisulfite sequencing analysis and Q-MSP. TSS, transcription start site. (B) mRNA expression of HOPX variants in thyroid cancer cell lines. TE15 served as a positive control of HOPX-β and core expression. (C) Representative results of bisulfited direct sequencing assays in 6 thyroid cancer cell lines. Arrowhead indicates dinucleotide CpG. Filled or unfilled arrowhead indicates methylated or unmethylated CpG site, respectively. Dotted arrowhead means partial methylation. (D) Q-MSP values in 6 thyroid cancer cell lines. TE1 and TE15 served as a methylation positive and a negative control, respectively. (E) mRNA expression of HOPX-β, -α, -γ, and -core in K1, 8305c and RO82-w-1 cell lines after treatment with a demethylating agent, 5-Aza-dC, in the presence or absence of TSA, a histone deacetylase inhibitor. 1A or 5A, 1 or 5 μM 5-Aza-dC; T, TSA.
Promoter methylation of HOPX-β critically affects HOPX expression in human papillary thyroid cancer cell line
HOPX expression was initially examined in 6 human thyroid cancer cell lines. PTC cell line K1 and FTC cell line RO82-w-1 express faint HOPX-core reflecting very weak HOPX-β expression, but did not express HOPX-α and -γ. On the other hand, HOPX-β mRNA expression was not detected in TT (MTC line), 8305c, 8505c (UTC lines), and FTC-133 (FTC line). HOPX-γ expression was not observed in all 6 thyroid cancer cell lines tested. Among them, HOPX-core transcript is expressed in TT, 8505c and FTC-133 in concordance with HOPX-α transcripts (Figure 1B), suggesting that HOPX-α dominantly regulate HOPX expression in TT, 8505c and FTC-133.
Promoter DNA methylation status of HOPX-β was tested in 6 human thyroid cancer cell lines by direct sequencing. Promoter region of HOPX exhibited complete methylation in cytosine residues of CpG islands in K1, 8305c, and 8505c (Figure 1C). Partial methylation was observed in FTC-133 and RO82-w-1. Promoter methylation was not detected in TT. Indeed, the methylation status of HOPX in these cells were confirmed by the methylation levels quantified by Q-MSP (Q-MSP values) (Figure 1D). PTC line K1, UTC lines 8305c and 8505c showed high Q-MSP values than other cell lines.
To postulate that promoter methylation of HOPX-β critically affects HOPX expression, cell lines (K1, 8305c, and RO082-w-1) were treated with a demethylating agent 5-Aza-dC alone or in combination with a HDAC inhibitor trichostatin A, as a previous report showing the synergistic effect of 5-Aza-dC and a HDAC inhibitor [22]. Expression of HOPX-β and HOPX-core but not of HOPX-α and γ were restored by 5-Aza-dC treatment with or without trichostatin A in all 3 cell lines (Figure 1E). These findings suggest that the promoter methylation of HOPX-β is pivotally involved in HOPX silencing in K1 (PTC line), 8305c and RO082-w-1. Here, we focused on patients with PTC that consists the vast majority of thyroid cancer.
Tumor suppressive activities are increased in PTC cell line overexpressing HOPX
A construct containing the full-length cDNA of HOPX was built as described in Materials and Methods section. This construct is common to all three transcript variants and is transiently transfected to K1 PTC cells. As shown in Figure 2A, mock transfected K1 cells express very weak HOPX. As expected, enforced HOPX overexpression resulted in increased levels of HOPX mRNA and protein. The mRNA levels in the HOPX transfectants were comparable to those in normal human thyroid tissues (data not shown).
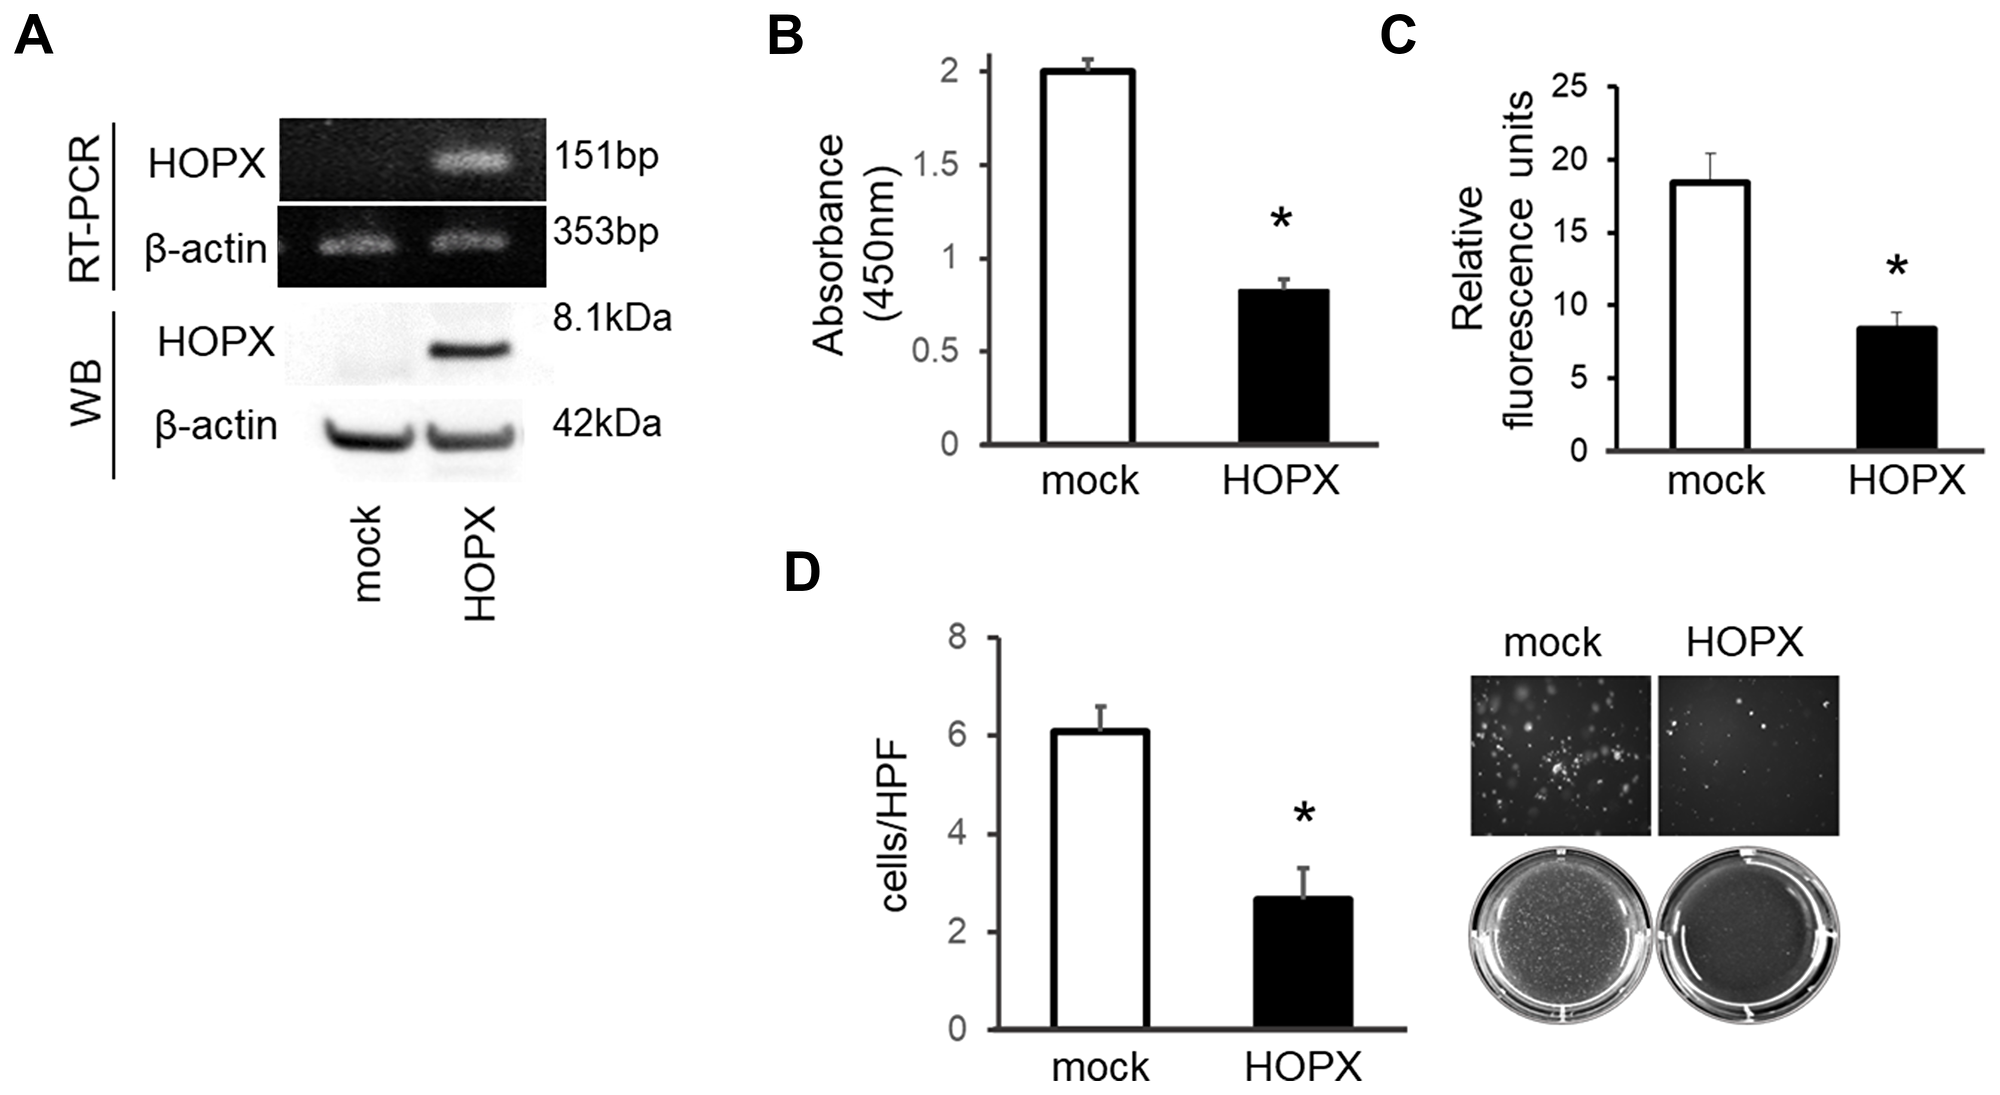
Figure 2: Tumor suppressive activities of HOPX in papillary thyroid cancer cell line. (A) HOPX mRNA (top) and protein (bottom) expression in control (mock) and HOPX transfected K1 cells. Western blot (WB) analysis was conducted using a HOPX-specific monoclonal antibody (3D6). (B) Proliferation assay was performed for 5 days. Forced HOPX expression significantly suppressed proliferation of K1 cells. Data are expressed as absorbance levels at 450 nm. Experiments were repeated twice in triplicates. *p < 0.05. Error bars, SEM. (C) Matrigel invasion assay using a CytoSelect™ 24-Well Cell Invasion Assay. HOPX induction attenuated invasive activities of K1 cells. Cell growth for 24 hours determined by the WST-1 assay was similar (data not shown). Two independent experiments were done in triplicate, and values indicate means ± SEM. *p < 0.05. Error bars, SEM. (D) Anchorage-independent colony formation assay was performed using the indicated transfected cells. After 3 weeks of cell culture, colonies were photographed at 100× magnification under a microscope. Colonies were visualized by EtBr and counted. HOPX transfectants exhibited remarkable reduction of colonies compared with mock transfected cells in K1 cells. *p < 0.05.
To investigate the effects of HOPX reactivation, several tumor aggressiveness assays were performed. Forced HOPX induction suppressed proliferative ability in K1 cells (Figure 2B). Matrigel invasive activity was significantly attenuated by HOPX expression (Figure 2C). In addition, HOPX transfectants exhibited remarkable reduction of colonies compared to the mock transfectants in an anchorage-independent colony formation assay (Figure 2D). These results indicate that HOPX is pivotally involved in tumor suppressive activities in human PTC.
Promoter methylation of HOPX is frequent and caner-specific in human PTC tissues
To evaluate the clinical relevance of the HOPX methylation level, Q-MSP values of PTC tissues were initially assessed in 20 independent patients with PTC. The Q-MSP values of paired normal tissues were also tested. The median Q-MSP value of primary tumor tissues was 7.4, ranging from 0.7 to 57.0. In contrast, the Q-MSP value of paired normal thyroid tissues was significantly lower (median 2.0 (0.4-13.0)) (p = 0.002, Figure 3A). A receiver operating characteristic curve (ROC) determined the optimal cutoff value (4.98) for distinguishing between malignant and normal tissues, yielding 65% sensitivity and 80% specificity (Figure 3B).
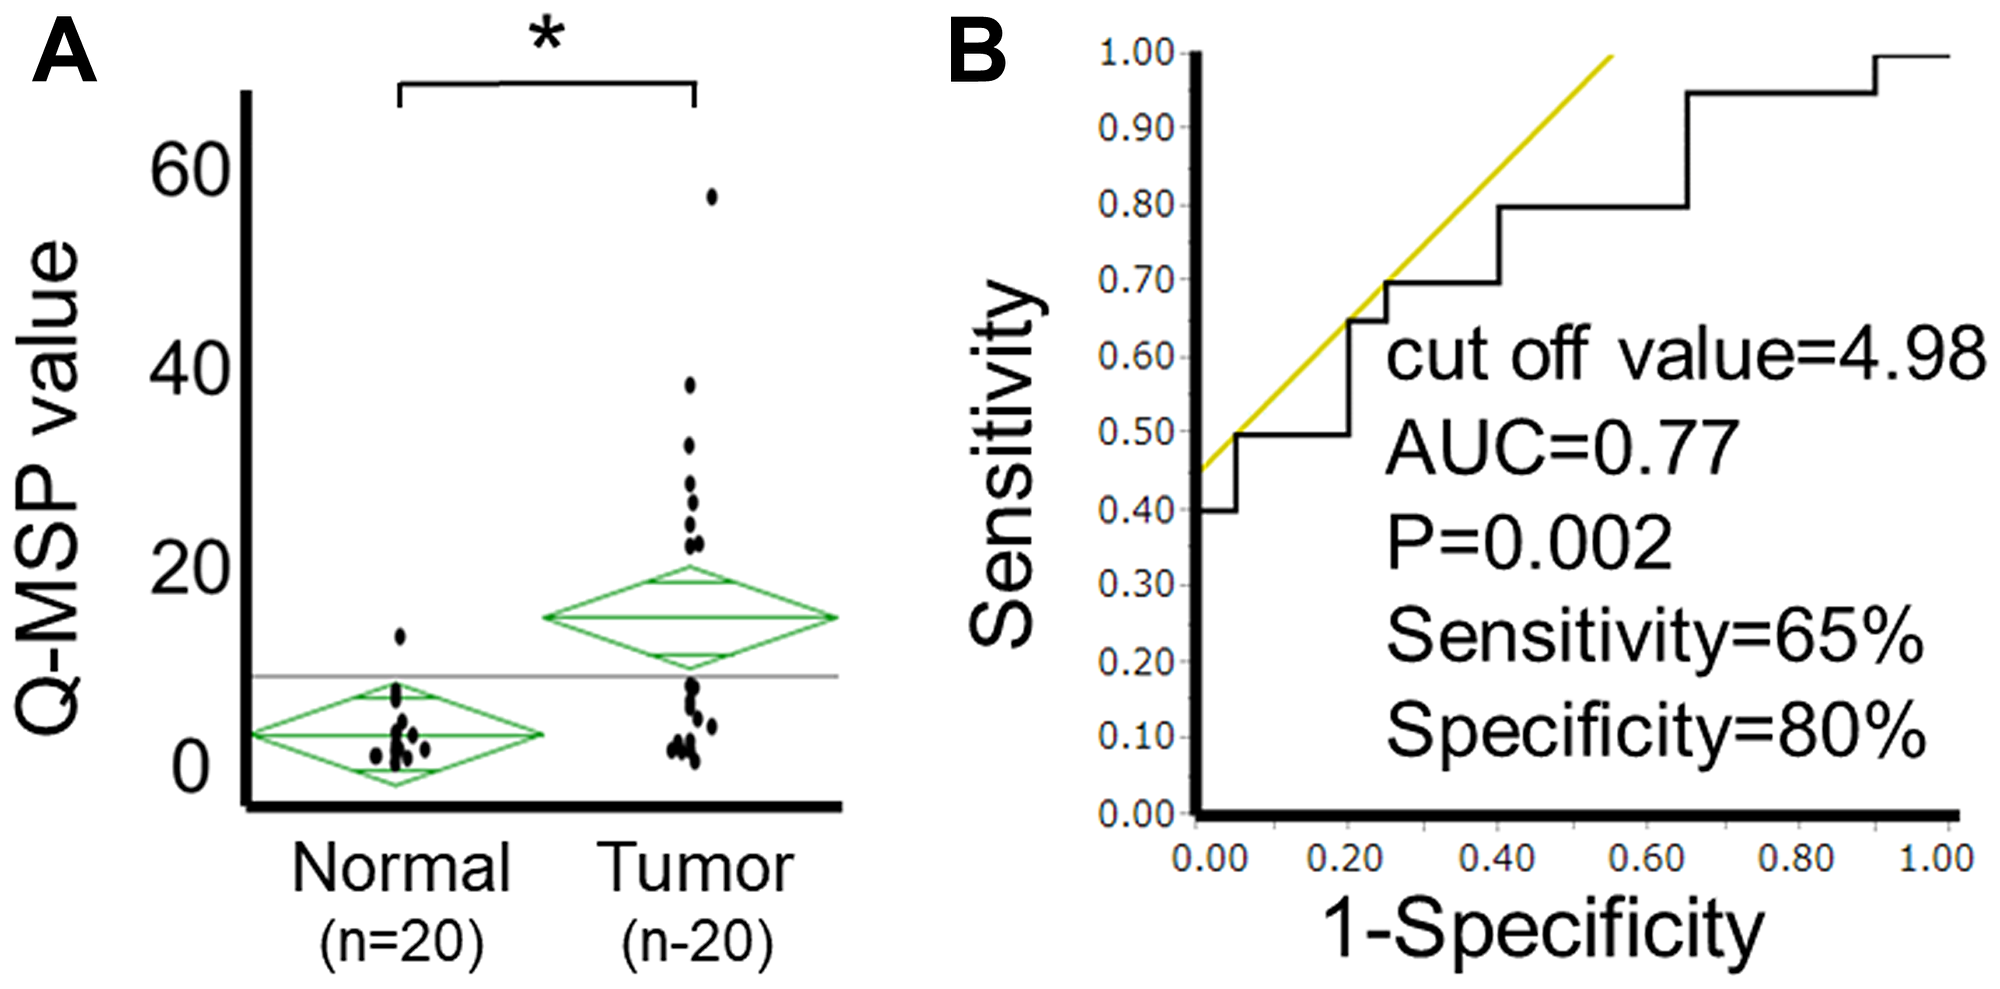
Figure 3: Analysis of HOPX-β Q-MSP values in human PTC. (A) Scatterplots of HOPX-β Q-MSP values of primary tumors and paired normal tissues. *p < 0.01. (B) ROC curve of HOPX-β Q-MSP values for distinguishing between malignant and normal samples. Area under the curve (AUC) is 0.77 and represents the accuracy in distinguishing PTC from normal samples in terms of sensitivity and specificity (p = 0.002).
HOPX promoter DNA hypermethylation predicts worse prognosis in PTC patients
Next, HOPX Q-MSP values in 191 PTC patients were analyzed in association with long-term prognosis. The optimal cut-off Q-MSP value (6.1) was determined using log-rank plots (Figure 4A), and the following prognostic analyses were performed based on this cut-off value. Kaplan–Meier curves indicate that patients with high Q-MSP values exhibited dramatically worse RFS (10-year RFS=70.3%) compared with their counterparts (10-year RFS=92.3%) (Figure 4B). Patients with high Q-MSP values showed marginally poor overall survival (OS) (Supplementary Figure 1A). A Cox proportional hazard model was employed to perform a multivariable prognostic analysis (Table 1). In univariable analyses, elder age, male gender, tumor size, extrathyroidal extension, pathological lymph node metastasis (pN), higher pStage and high Q-MSP values exhibited significantly poor 10-year RFS among tumor factors (Table 1). Since pT and pstage were confound factors with tumor size and extrathyroidal invasion, these variables were excluded from the multivariable analysis. In the multivariable analysis, high HOPX Q-MSP value, elder age, and pN independently predicted worse prognosis.
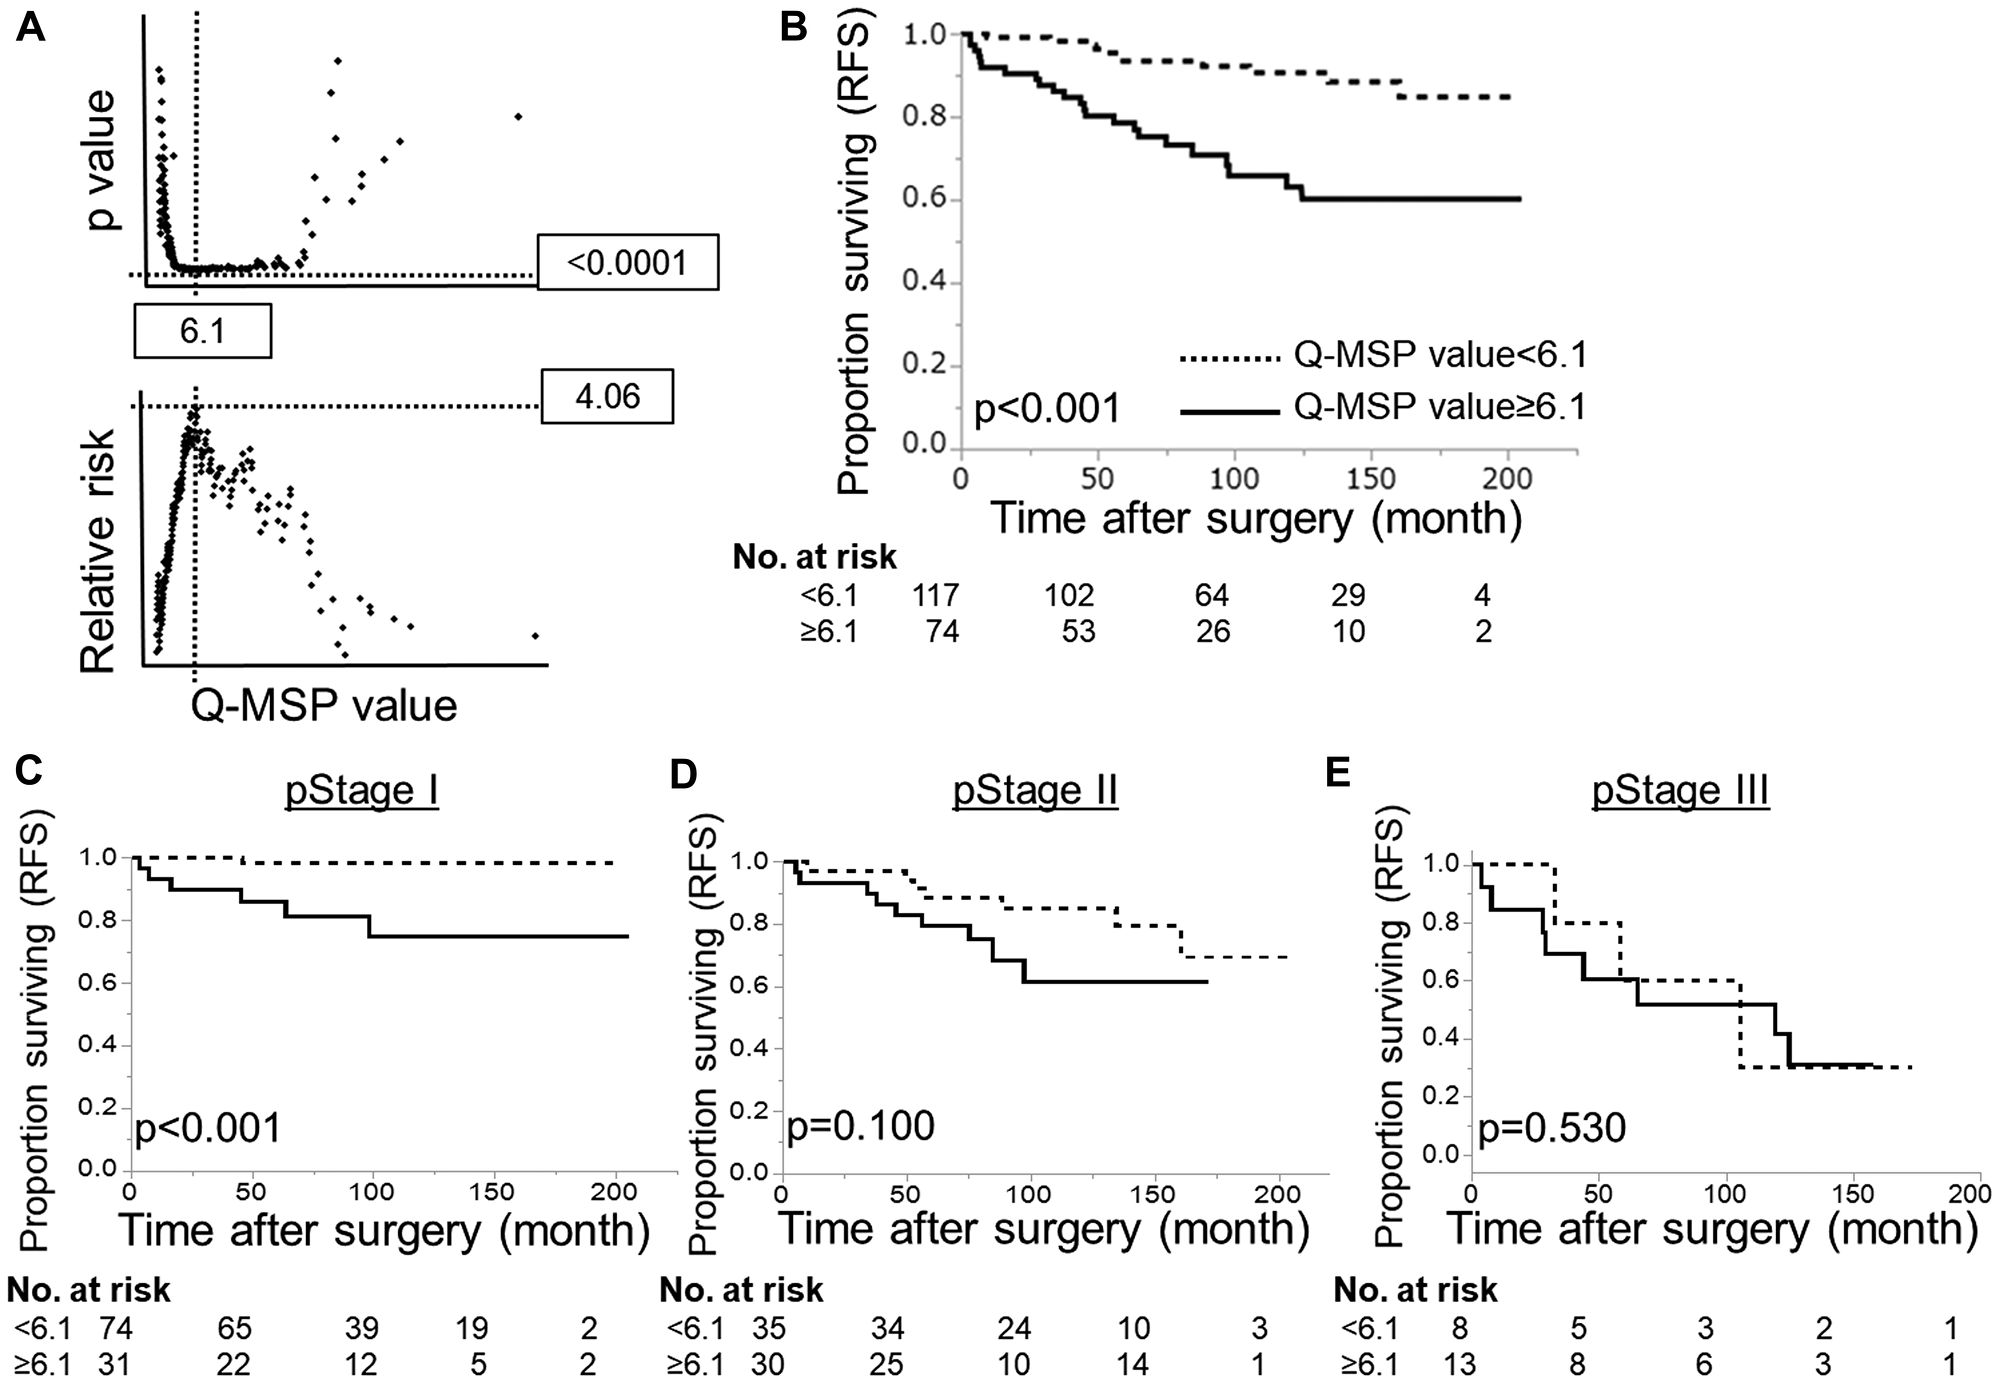
Figure 4: Prognostic implication of HOPX-β Q-MSP values in patients with PTC. (A) Log-rank plots were used to determine the optimal cut-off (6.1) of Q-MSP value for the 10-year RFS. (B) Kaplan–Meier analysis of 10-year RFS according to Q-MSP values using 6.1 as a cut-off level (p < 0.001). (C–E) Kaplan–Meier analysis of 10-year RFS in each stage according to Q-MSP values (C: stage I, D: stage II, E: stage III). Patients with hypermethylation of HOPX-β exhibited dramatically poor long-term prognosis than the counterpart in pStage I PTC (p < 0.001).
Table 1: Prognostic analysis of clinicopathological variables in 191 patients with PTC
| Variables | No. of Pt. | 10-year RFS (%) | Univariable analysis* | Multivariable analysis* | |||||
|---|---|---|---|---|---|---|---|---|---|
| p | HR | 95%Cl | p | HR | 95%Cl | ||||
| Age | <55 | 92 | 92.5 | <0.001 | 0.27 | 0.11–0.58 | 0.006 | 0.33 | 0.13–0.74 |
| ≥55 | 98 | 75.5 | 3.77 | 1.73–9.40 | 3.02 | 1.35–7.65 | |||
| Gender | male | 32 | 65.6 | 0.002 | 3.50 | 1.62–7.17 | 0.442 | 1.38 | 0.59–3.06 |
| female | 159 | 87.4 | 0.29 | 0.14–0.62 | 0.72 | 0.32–1.70 | |||
| pStage** | I | 105 | 93.3 | reference | |||||
| II | 65 | 78.5 | <0.001 | 3.56 | 1.52–9.27 | n/d | n/d | n/d | |
| III | 21 | 52.4 | 11.06 | 4.35–30.15 | |||||
| Tumor diameter (cm) | ≤1 | 54 | 96.3 | reference | reference | ||||
| 1<, ≤2 | 53 | 86.8 | <0.001 | 3.56 | 0.86-23.89 | 1.93 | 0.44–13.30 | ||
| 2<, ≤4 | 65 | 80 | 5.87 | 1.62-37.50 | 0.204 | 2.49 | 0.64–16.53 | ||
| 4≤ | 19 | 52.6 | 18.80 | 4.84-123.42 | 4.68 | 1.04–33.36 | |||
| Ex*** | Ex0 | 73 | 94.4 | reference | reference | ||||
| Ex1 | 88 | 83 | <0.001 | 2.83 | 1.12–8.61 | 0.747 | 1.22 | 0.43–4.0 | |
| Ex2 | 30 | 61.3 | 7.91 | 2.93–24.90 | 1.60 | 0.48–5.63 | |||
| pN | pN0 | 64 | 98.4 | reference | reference | ||||
| pN1a | 50 | 90 | <0.001 | 6.07 | 0.98–116.16 | 0.007 | 3.04 | 0.6422.1 | |
| pN1b | 77 | 67.5 | 23.46 | 4.98–418.96 | 7.17 | 1.82–48.47 | |||
| HOPX-β Q-MSP value | Low (<6.1) | 117 | 92.3 | <0.001 | 0.21 | 0.09–0.45 | 0.037 | 0.44 | 0.2–0.95 |
| high (≥6.1) | 74 | 70.3 | 4.68 | 2.22–10.74 | 2.26 | 1.05–5.08 | |||
In the dissociative analyses taking stages into account, patients with high Q-MSP values exhibited significantly poor prognosis in stage I PTC (p < 0.001, Figure 4C). On the other hand, patients with high Q-MSP values have prognostic association only marginally in stage II PTC (p = 0.100, Figure 4D), and no statistical significance in stage III (Figure 4E). Similarly, patients with high Q-MSP values showed poor 10-year overall survival in stage I PTC (Supplementary Figure 1).
HOPX protein expression closely reflects HOPX promoter DNA methylation status, and epigenetic silencing of HOPX promotes cancer cell proliferation in human primary tumor
Immunohistochemistry confirmed that HOPX protein expression was significantly weak in primary tumor tissues with high Q-MSP values (≥6.1) (p = 0.004, Figure 5A and 5B, Table 2). Patient with lower HOPX expression level showed worse prognosis than the counterpart as well although it did not reach statistical significance (Supplementary Figure 3). Accordingly, HOPX Q-MSP value may be more sensitive predictor for long-term prognosis than HOPX immunohistochemical detection. Furthermore, immunohistochemical assay of Ki-67 revealed that Ki-67 expression is significantly higher in patients with HOPX hypermethylation (p = 0.038, Figure 5C and 5D, Table 2). These results show that silencing of HOPX by its promoter hypermethylation promotes cancer cell proliferation in PTC. Collectively, epigenetic silencing of HOPX expression caused by the promoter methylation is critically involved in cancer progression and patient prognosis in PTC.
Table 2: Correlation of clinicopathological variables with HOPX-β Q-MSP value
| Variables | No. of Pt. | HOPX-β Q-MSP value | p* | Multivariable analysis | ||||
|---|---|---|---|---|---|---|---|---|
| low (<6.1) | high (≥6.1) | |||||||
| No. | % | No. | % | p** | ||||
| Age | <55 | 41 | 28 | 68 | 13 | 31 | 0.297 | n/d |
| ≤55 | 150 | 89 | 59 | 61 | 41 | |||
| Gender | male | 32 | 11 | 34 | 21 | 66 | 0.001 | 0.778 |
| female | 159 | 106 | 67 | 53 | 33 | |||
| pStage | I | 105 | 74 | 70 | 31 | 42 | 0.007 | n/d |
| II | 65 | 35 | 54 | 30 | 46 | |||
| III | 21 | 8 | 38 | 13 | 62 | |||
| Tumor diameter | ≤1 | 54 | 40 | 74 | 14 | 26 | <0.001 | 0.016 |
| 1<, ≤2 | 53 | 38 | 72 | 15 | 28 | |||
| 2<, ≤4 | 65 | 35 | 54 | 30 | 46 | |||
| 4≤ | 19 | 4 | 21 | 15 | 79 | |||
| Ex | Ex0 | 73 | 56 | 77 | 17 | 23 | 0.001 | 0.282 |
| Ex1 | 88 | 48 | 55 | 40 | 46 | |||
| Ex2 | 30 | 13 | 42 | 18 | 58 | |||
| pN | pN0 | 64 | 48 | 75 | 16 | 25 | 0.017 | 0.480 |
| pN1a | 50 | 29 | 58 | 21 | 42 | |||
| pN1b | 77 | 40 | 52 | 37 | 48 | |||
| HOPX | IHC 1+ | 56 | 25 | 45 | 31 | 55 | 0.004 | n. a. |
| IHC 2+ | 86 | 55 | 64 | 31 | 36 | |||
| IHC 3+ | 49 | 37 | 76 | 12 | 24 | |||
| Ki-67 | IHC 1+ | 111 | 70 | 63 | 41 | 37 | 0.038 | n. a. |
| IHC 2+ | 64 | 42 | 66 | 22 | 34 | |||
| IHC 3+ | 16 | 5 | 31 | 11 | 69 | |||
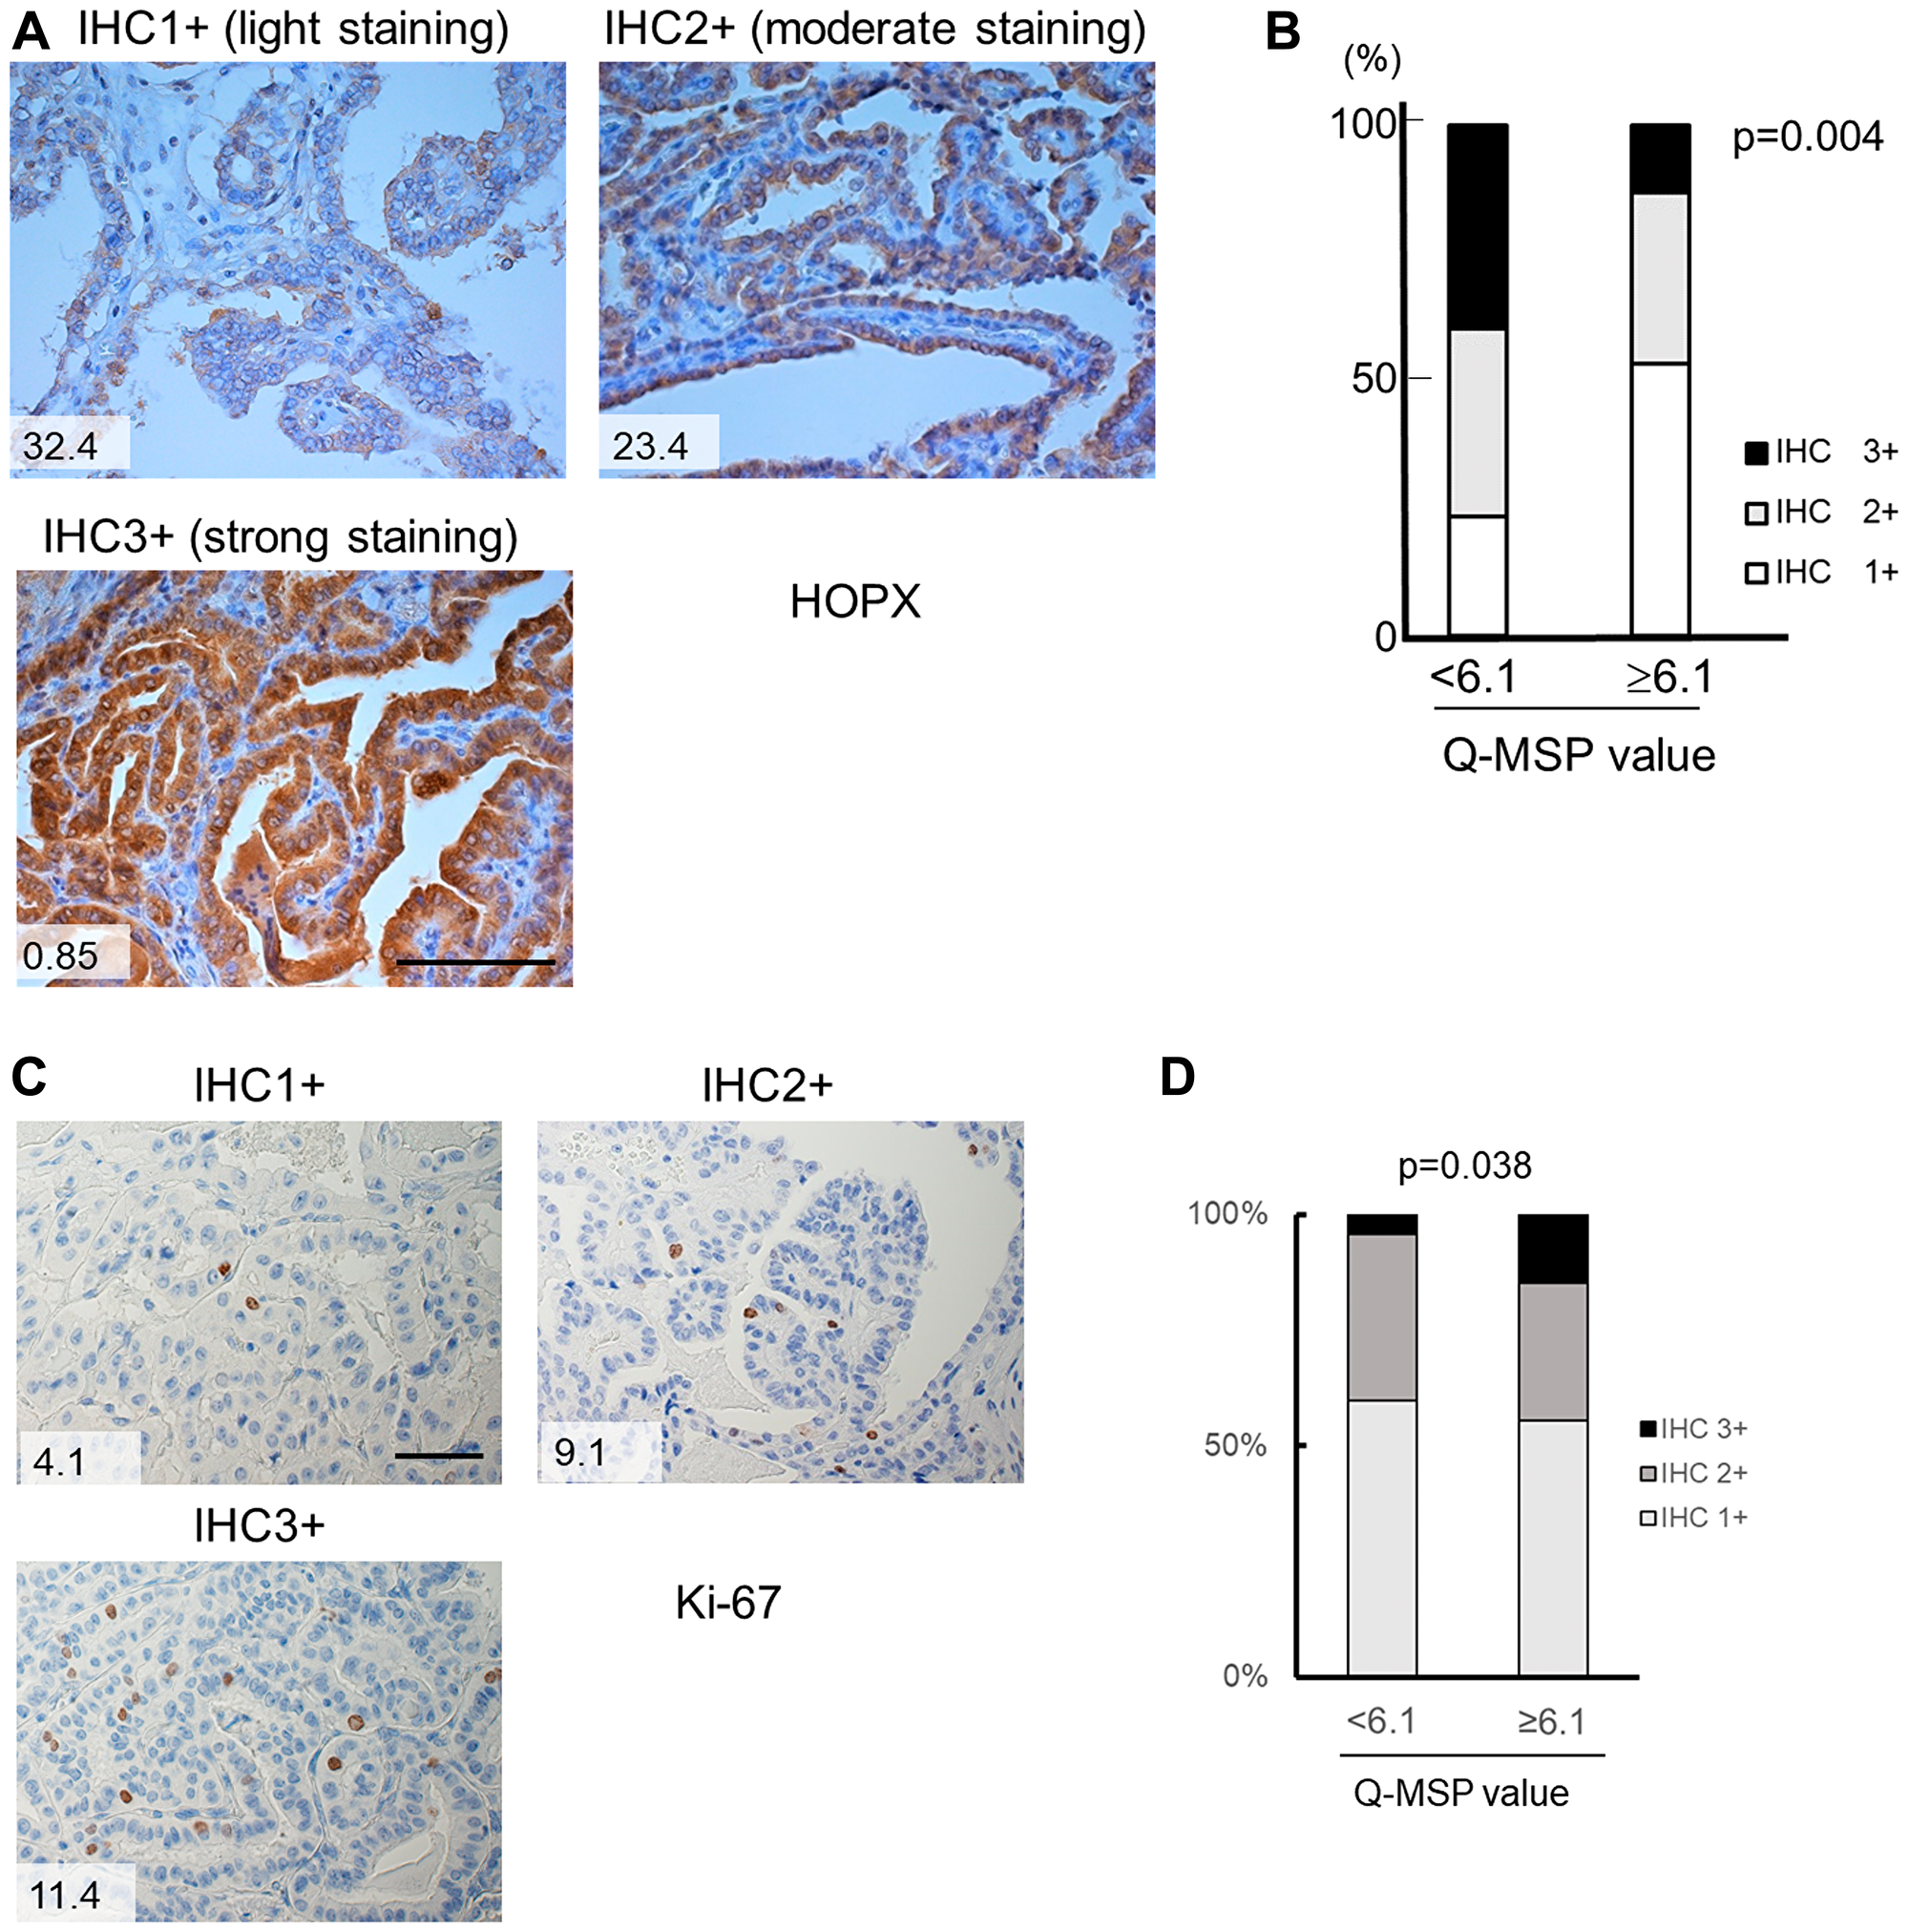
Figure 5: Immunohistochemistry of HOPX and Ki-67 in human primary PTC tissues. (A) Representative images from immunohistochemistry of HOPX in primary PTC tissues with light expression (IHC 1+, left upper panel), moderate expression (IHC 2+, right panel) and strong expression (IHC 3+, left bottom panel). Values in the images denote Q-MSP value. Bar, 100 mm. (B) Cumulative bar charts indicate that PTC tissues with high Q-MSP significantly exhibit reduced HOPX expression (p = 0.004). (C) Representative images from immunohistochemistry of Ki-67 in primary PTC tissues with light expression (IHC 1+, left upper panel), moderate expression (IHC 2+, right panel) and strong expression (IHC 3+, left bottom panel). Values in the images denote Q-MSP value. Bar, 50 mm. (D) Cumulative bar charts indicate that PTC tissues with high Q-MSP significantly exhibit reduced Ki-67 expression (p = 0.038).
DISCUSSION
We have reported that HOPX is frequently methylated in a cancer-specific manner, and functions as a tumor suppressor gene in esophageal, gastric, colon and pancreas cancers in the previous studies [12–15, 21, 24]. These previous results prompted us to seek the clinical ramifications of epigenetic silencing of HOPX in papillary thyroid cancer (PTC) which represents the vast majority of thyroid malignancies. Indeed, epigenetic silencing of HOPX by its promoter methylation was observed with high sensitivity and specificity in PTC as well (Figure 3). Notably, the promoter methylation of HOPX is independently associated with poor prognosis especially in patients with stage I PTC.
HOPX has unique 3 transcript variants (α, β and γ) which share the same open reading frame. Among them, only HOPX-β harbors CpG islands in its promoter region. The bisulfite sequencing analyses showed that the promoter methylation of HOPX-β in its CpG islands was observed in the 5 human thyroid cancer cell lines except MTC cell line TT. The expression of HOPX-core is faint or undetectable in human PTC cell line K1, FTC line RO82-w-1, and UTC line 8305c in consistent with the very weak or undetectable expression of HOPX-β without HOPX-α/γ expression (Figure 1B). In these cell lines, HOPX-β and HOPX-core expression were restored by 5-Aza-dC with/without TSA, suggesting that HOPX expression depends on HOPX-β expression. On the other hand, although the promoter methylation of HOPX-βwere also observed in FTC line FTC133 and UTC line 8505c, these lines express HOPX-core reflecting HOPX-α expression. Demethylation treatment of 8505c and FTC133 actually reactivated HOPX-β expression but enhancement of HOPX-core expression was not observed (data not shown). On the other hand, DLD1 (colon cancer cell line) expresses weak HOPX-α but HOPX-βreactivation significantly increased HOPX-core expression in our previous report [12]. These results suggest that HOPX-β is dominant to HOPX expression when HOPX-α expression is insufficient. These results suggest that the mechanisms of HOPX expression is different among histological types of thyroid cancer.
Consistent with our previous study in gastrointestinal cancers and breast cancer [12–14, 21], the promoter hypermethylation of HOPX dramatically predicts disease recurrence in patients with PTC. Actually, a very recent study reports hypermethylation of HOPX-β was associated with poor survival in differentiated thyroid cancer [25]. In our current study, the hypermethylation of HOPX independently correlated with tumor size among the tumor factors in PTC. Immunohistochemistry of Ki-67 supports that hypermethylation of HOPX leads to more cancer cell proliferation in patients with PTC (Table 2, Figures 5C and 5D). Of note, HOPX promoter hypermethylation is critically associated with poor prognosis in patients with stage I PTC but only marginally in patients with stage II. These results indicate that HOPX may particularly regulate early steps of cancer progression. Indeed, enforced expression of HOPX suppress cell proliferation, invasive activities, and anchorage-independent growth (Figure 2) that reflects metastatic potential of cancer cells [26]. In TCGA PTC data set, putative HOPX target co-expressed gene profiles support tumor suppressive function of HOPX (Supplementary Table 2 and Supplementary Figure 4). In addition, co-expressed gene profiles indicate that HOPX may suppress dedifferentiation of cancer cell in consistent with our previous study on colorectal cancer in which epigenetic silencing of HOPX was associated with poor differentiation [12].
HOPX is an unusual homeodomain-containing protein that is unable to bind DNA, and modulates chromatin structure and represses nuclear transcription [17]. HOPX is essential for normal cardiac growth and development, and is involved in a wide range of organ development [9, 27–30]. Moreover, HOPX exclusively specifies cardiomyoblast commitment by harnessing Wnt signialing through Smad4 interaction [31]. Indeed, poor differentiated histology is significantly associated with HOPX silencing by its promoter methylation in colorectal cancer [12, 32], and HOPX represents +4 quiescent intestinal stem cells which can interconvert between Lgr5+ active stem cells [33]. Recent study reported that HOPX suppresses tumor progression by an epigenetic regulation of SNAIL transcription through the enhancement of histone H3K9 deacetylation in the SNAIL promoter [34]. Moreover, HOPX plays a critical role in epithelial cell homeostasis and functions as a tumor suppressor in head and neck cancer [35]. These findings suggest that silencing of HOPX may promote dedifferentiation of epithelial cells and accelerate cancer initiation and progression. Further insights into the association of HOPX with radioactive iodine-refractoriness or chemosensitivity are needed in the next study.
Materials and Methods
Cell lines and human thyroid cancer tissue samples
Human thyroid cancer cell lines, K1, TT, 8305c, 8505c, FTC-133, and RO82-w-1 were purchased from RIKEN Bio Resource Center (Tsukuba, Japan). An esophageal squamous cell carcinoma cell line TE1 and TE15 were also purchased from RIKEN Bio Resource Center as control cell lines. K1 and FTC-133 were cultured in DMEM/F12 Glutamax (GIBCO, Carlsbad, CA, USA) supplemented with 10% FBS. 8305c, 8505c, RO82-w-1, TE1, and TE15 were maintained in RPMI1640 Medium (GIBCO) supplemented with 10% FBS. TT was cultured in ATCC-formulated F12 K Medium (ATCC, Manassas, VA, USA) containing 10% FBS.
One-hundred ninety-one patients with papillary thyroid cancer (PTC) who have undergone curative surgical resection of the primary tumors at the Kitasato University Hospital between January 1, 2000 and December 31, 2006 were assessed. These patients were clinicopathologically analyzed. Independent 20 PTC patients were initially analyzed for the methylation status of HOPX-β as a study set. Clinicopathological characteristics of 191 PTC patients were shown in Table 1. TNM classification was made according to the latest 8th edition of the Unio Internationalis Contra Cancrum (UICC) staging system. This study was approved by the IRB of the Kitasato University School of Medicine (the IRB approved #B17-233), and was performed in accordance with the clinical research guidelines of the ethics committee of the Kitasato University School of Medicine. All patients gave written informed consent.
Collection of TCGA public data
Gene expression data on 496 PTCs were downloaded from http://www.cbioportal.org/ (Papillary Thyroid Carcinoma (TCGA, Cell 2014). csv).
Bisulfite treatment of DNA and sequencing analysis
Tissue sections from primary tumors and corresponding normal tissues were stained with hematoxylin and eosin and dissected under microscope. Genomic DNA was extracted from cell lines or formalin-fixed paraffin embedded (FFPE) tissues using a QIAamp DNA Mini Kit or a QIAamp DNA FFPE Tissue Kit (Qiagen, Hilden, Germany), respectively. Bisulfite treatment was done by using an EZ DNA Methylation-Gold TM Kit (Zymo Research, Orange, CA, USA) and the bisulfited DNA was subsequently amplified by PCR. Primer sequences were designed to recognize the DNA alterations caused by bisulfite treatment (Supplementary Table 1). The PCR products were purified with a QIAquick PCR Purification Kit (Qiagen) and were sequenced using a Big DyeR Terminator v3.1 Cycle Sequencing Kit (Applied Biosystems, Foster City, CA, USA).
Quantitative methylation-specific PCR (Q-MSP)
TaqMan methylation-specific PCR (Q-MSP) was carried out using a iQ Supermix (Bio-Rad, Hercules, CA, USA) in triplicate on a C1000 TouchTM Thermal Cycler CFX96 Real Time System (Bio-Rad). PCR conditions, the primer and probe sequences are provided in Supplementary Table 1. Serial dilutions of bisulfite modified DNA from human esophageal cancer cell line TE1 was used to construct the calibration curve on each plate as a methylation positive control, and TE15 served as a methylation negative control as reported [14]. The methylation value was defined by a ratio of amplified signal value of methylated HOPX normalized to β-actin and then multiplied by 100 (Q-MSP value).
RNA purification and reverse transcription-polymerase chain reaction (RT-PCR)
Total RNA from cell lines was extracted using an RNeasy Mini Kit (Qiagen), and reverse-transcribed with a SuperScript III reverse transcriptase kit (Invitrogen, Carlsbad, CA, USA). Primer sequences are described in Supplementary Table 1. RT-PCR was performed, and the PCR products were separated on 1.5% agarose gel, then visualized by EtBr. β-actin served as an internal control.
Western blot analysis
Whole cell lysates were extracted in RIPA buffer (Pierce, Rockford, IL, USA) supplemented with a Halt Protease Inhibitor Cocktail kit (Pierce) and a Halt Phosphatase Inhibitor Cocktail kit (Pierce). The protein concentrations were determined using a Coomassie Plus-The Better Bradford Assay kit (Pierce), separated on NuPAGE 4–12% Bis–Tris Gel (Invitrogen). The mouse HOPX monoclonal IgG1κ antibody (3D6; Sigma-Aldrich, Inc, St Louis, MO, USA), and mouse β-actin IgG2a monoclonal antibody (Sigma-Aldrich) were used. A WesternBreeze® Chemiluminescent Kit–Anti-Mouse (Invitrogen) was used for detection.
5-aza-2’-deoxycytidine and trichostatin A treatments in human breast cancer cell lines
Cells (1 × 10⁶ cells/T-75 flask) were treated with 1 or 5μM of a demethylating agent 5-aza-2′-deoxycytidine (5-Aza-dC) (Sigma-Aldrich, St Louis, MO, USA) dissolved in 50% acetic acid (Wako, Osaka, Japan) or mock-treatment with PBS (GIBCO) including the same amount of acetic acid every 24 h for 4 days. When combined with a histone deacetylase (HDAC) inhibitor trichostatin A (TSA) (Sigma-Aldrich), 300 nM of TSA was added to the medium for the final 24 h.
Immunohistochemistry
Primary PTC tissue and the adjacent normal thyroid tissue were fixed in formalin and embedded in paraffin. Four mm thick serial sections were made. Briefly, antigen retrieval was performed by autoclaving for 10 min at 120° C in antigen retrieval buffer (1.8 mM citric acid, 8.2 mM sodium citrate, 0.05% Tween 20, pH 6.0) for HOPX. For Ki-67, antigen retrieval was performed with microwave for 5 min, three times in 1mM ethylenediaminetetraacetic acid buffer. Endogenous peroxidase activity was blocked by incubation in 3% H2O2/methanol at room temperature for 5 min, and non-specific binding was blocked by incubation with 1% diluted normal horse serum for 30 min. Either anti-HOPX mouse IgG1κ monoclonal antibody (3D6, Sigma) (1:100 dilution) or anti-Ki-67 antibody (MIB-1, DAKO) (1:300 dilution) was added and the slices were incubated at 4° C overnight. For HOPX, immune complexes were detected with a Vectastain Elite ABC kit (Vector Laboratories, Inc, Burlingame, CA) according to the manufacturer's instruction. For Ki-67, immune complexes were detected with a Histofine Simplestain Max PO (Nichirei) according to the manufacturer's instruction. These immune complexes were detected using the 3,3′-diaminobenzidine (DAB) substrate as a chromogen for 2 min (HOPX) or 30sec (Ki-67). Sections were counterstained with hematoxylin. HOPX expression level was graded according to the diagnostic criteria of American Society of Clinical Oncology/College of American Pathology 2007 guidelines as follows [36]. IHC 1+: light staining of more than 10% of the specimens; IHC 2+: moderate staining of more than 10% and less than or equal to 30% of the specimens; IHC3+: strong staining of more than 30% of the specimens. Ki67 intensity was classified as follows. IHC 1+: light staining of less than 1% of the tumor cells; IHC 2+: moderate staining of more than or equal to 1% and less than 5% of the tumor cells; IHC3+: strong staining of more than or equal to 5% of the tumor cells.
Plasmid and transfection
A full-length cDNA of HOPX was previously isolated and subcloned into pcDNATM3.1D/V5-His-TOPO vector (pcDNATM3.1-HOPX) [12]. The vector with self-ligation was used as a control. Plasmid vectors were transfected into PTC cell line K1 using a Lipofectamine 2000 reagent (Invitrogen).
Proliferation assay
Cell proliferation and viability (2 × 10³ cells/well) were assessed using a Premix WST-1 Cell Proliferation Assay System (Takara Bio, Tokyo, Japan) in 96-well plates. Data are expressed as an absorbance at 450 nm. Experiments were performed in triplicates.
Matrigel invasion assay
Matrigel invasion assay was analyzed using a CytoSelect™ 24-Well Cell Invasion Assay (Cell Biolabs, Inc. San Diego, CA, USA) according to the manufacturer’s protocol. Cells were seeded at a density of 3 × 10⁶ per well with 300μL of serum free medium to an ECM-coated well (Cell Biolabs, Inc.). 10%FBS was used as a chemoattractant. After incubation for 24 hours at 37° C, the membrane of the upper chamber was incubated a clean well containing 225μL of Cell Detachment Solution (Cell Biolabs, Inc.) for 30 minutes at 37° C. Then, 1μL of 4× Lysis Buffer and 74μL of CyQuant® GR dye (Cell Biolabs, Inc.) were added to each well. After 20 minutes incubation at room temperature, 200μL of the mixture was transferred to a 96-well plate for reading fluorescence with a Varioskan LUX (Thermo Fisher Scientific Inc. Waltham, MA, USA) at 480nm/520nm. Each experiment was done in triplicate. Simultaneously, an equal number of cells were seeded on 24-well plates and incubated for 24 hours, and WST assay was performed.
Anchorage-independent colony formation assay
Anchorage-independent cell growth was analyzed by plating 0.36% top agarose (BactoTM Ager, Becton Dickison and Company, Franklin Lakes, NL) containing 1 × 10⁵ cells on a surface of 0.72% bottom agarose in 6-well plates. Cells were fed weekly by overlying fresh soft agar solution containing G418. Colonies were visualized with EtBr after 3 wk of incubation. Two independent experiments were conducted and each experiment was done in triplicate.
Statistical analysis
For continuous variables, Student’s t-test or ANOVA followed by Bonferroni test were used for comparison between two groups, or among multiple variables, respectively. c2 test or Fisher exact test was used for categorical variables. Clinicopathological characteristics and follow-up data were analyzed in terms of relapse free survival (RFS). The follow up time was calculated from the date of surgery to death or end-point, and patients with other disease deaths were censored. RFS was estimated by a Kaplan–Meier method, and compared using a log-rank test. Variables suggested potential prognostic factors on univariable analyses (p < 0.05) were subjected to a multivariable analysis using a Cox proportional-hazards model. Correlation of clinicopathological characteristics with HOPX Q-MSP value were also evaluated. Variables with significant correlation in univariable analyses were subjected to a multivariable logistic regression analysis. P < 0.05 was considered significant. All statistical analyses were conducted with JMP Pro14 (SAS Institute, Cary, NC, USA).
Conclusions
HOPX promoter methylation is frequent and cancer-specific in papillary thyroid cancer (PTC). HOPX promoter methylation critically predicts disease recurrence particularly in stage I PTC. Furthermore, HOPX is involved in multiple functions of cancer cell progression. Therefore, silencing of HOPX expression may have significant potential as a useful biomarker in patients with PTC. Further insights into the detailed mechanism of HOPX silencing in cancer progression are likely to provide a clue to tackle PTC with treatment refractoriness.
ACKNOWLEDGMENTS AND FUNDING
This work was supported, in part, by JSPS KAKENHI (Grants-in-Aid for Scientific Research) Grant Number 15K10148 (to H.K.), the Kanae Foundation for the Promotion of Medical Science Grant (to H.K.), and the Yasuda Memorial Foundation (Grants-in-Aid for Cancer Research by Young Investigators) (to H.K.). We thank Tomomi Miyake for her assistance to conduct immunohistochemical analyses.
CONFLICTS OF INTEREST
All authors declare that there is no conflicts of interest that could be perceived as prejudicing the impartiality of the research reported and state there is no conflicts of interest.
References
1. Sherman SI. Thyroid carcinoma. Lancet. 2003; 361:501–511. https://doi.org/10.1016/S0140-6736(03)12488-9. [PubMed].
2. Haugen BR, Alexander EK, Bible KC, Doherty GM, Mandel SJ, Nikiforov YE, Pacini F, Randolph GW, Sawka AM, Schlumberger M, Schuff KG, Sherman SI, Sosa JA, et al. 2015 American Thyroid Association Management Guidelines for Adult Patients with Thyroid Nodules and Differentiated Thyroid Cancer: The American Thyroid Association Guidelines Task Force on Thyroid Nodules and Differentiated Thyroid Cancer. Thyroid. 2016; 26:1–133. https://doi.org/10.1089/thy.2015.0020. [PubMed].
3. Hanahan D, Weinberg RA. Hallmarks of cancer: the next generation. Cell. 2011; 144:646–674. https://doi.org/10.1016/j.cell.2011.02.013. [PubMed].
4. Feinberg AP. Phenotypic plasticity and the epigenetics of human disease. Nature. 2007; 447:433–440. https://doi.org/10.1038/nature05919. [PubMed].
5. Katoh H, Yamashita K, Enomoto T, Watanabe M. Classification and General Considerations of Thyroid Cancer. Ann Clin Pathol. 2015; 3:1045.
6. Taby R, Issa JP. Cancer epigenetics. CA Cancer J Clin. 2011; 60:376–392. https://doi.org/10.3322/caac.20085. [PubMed].
7. Russo D, Damante G, Puxeddu E, Durante C, Filetti S. Epigenetics of thyroid cancer and novel therapeutic targets. J Mol Endocrinol. 2011; 46:R73–R81. https://doi.org/10.1530/JME-10-0150. [PubMed].
8. Kook H, Yung WW, Simpson RJ, Kee HJ, Shin S, Lowry JA, Loughlin FE, Yin Z, Epstein JA, Mackay JP. Analysis of the structure and function of the transcriptional coregulator HOP. Biochemistry. 2006; 45:10584–10590. https://doi.org/10.1021/bi060641s. [PubMed].
9. Asanoma K, Kato H, Yamaguchi S, Shin CH, Liu ZP, Kato K, Inoue T, Miyanari Y, Yoshikawa K, Sonoda K, Fukushima K, Wake N. HOP/NECC1, a novel regulator of mouse trophoblast differentiation. J Biol Chem. 2007; 282:24065–24074. https://doi.org/10.1074/jbc.M701380200. [PubMed].
10. Asanoma K, Matsuda T, Kondo H, Kato K, Kishino T, Niikawa N, Wake N, Kato H. NECC1, a candidate choriocarcinoma suppressor gene that encodes a homeodomain consensus motif. Genomics. 2003; 81:15–25. https://doi.org/10.1016/S0888-7543(02)00011-3. [PubMed].
11. Chen H, Taylor NP, Sotamaa KM, Mutch DG, Powell MA, Schmidt AP, Feng S, Hampel HL, de la Chapelle A, Goodfellow PJ. Evidence for heritable predisposition to epigenetic silencing of MLH1. Int J Cancer. 2007; 120:1684–1688. https://doi.org/10.1002/ijc.22406. [PubMed].
12. Katoh H, Yamashita K, Waraya M, Margalit O, Ooki A, Tamaki H, Sakagami H, Kokubo K, Sidransky D, Watanabe M. Epigenetic silencing of HOPX promotes cancer progression in colorectal cancer. Neoplasia. 2012; 14:559–571. https://doi.org/10.1593/neo.12330. [PubMed].
13. Kikuchi M, Katoh H, Waraya M, Tanaka Y, Ishii S, Tanaka T, Nishizawa N, Yokoi K, Minatani N, Ema A, Kosaka Y, Tanino H, Yamashita K, et al. Epigenetic silencing of HOPX contributes to cancer aggressiveness in breast cancer. Cancer Lett. 2017; 384:70–78. https://doi.org/10.1016/j.canlet.2016.10.017. [PubMed].
14. Ooki A, Yamashita K, Kikuchi S, Sakuramoto S, Katada N, Kokubo K, Kobayashi H, Kim MS, Sidransky D, Watanabe M. Potential utility of HOP homeobox gene promoter methylation as a marker of tumor aggressiveness in gastric cancer. Oncogene. 2010; 29:3263–3275. https://doi.org/10.1038/onc.2010.76. [PubMed].
15. Waraya M, Yamashita K, Katoh H, Ooki A, Kawamata H, Nishimiya H, Nakamura K, Ema A, Watanabe M. Cancer specific promoter CpG Islands hypermethylation of HOP homeobox (HOPX) gene and its potential tumor suppressive role in pancreatic carcinogenesis. BMC Cancer. 2012; 12:397. https://doi.org/10.1186/1471-2407-12-397. [PubMed].
16. Yamaguchi S, Asanoma K, Takao T, Kato K, Wake N. Homeobox gene HOPX is epigenetically silenced in human uterine endometrial cancer and suppresses estrogen-stimulated proliferation of cancer cells by inhibiting serum response factor. Int J Cancer. 2009; 124:2577–2588. https://doi.org/10.1002/ijc.24217. [PubMed].
17. Yamashita K, Katoh H, Watanabe M. The homeobox only protein homeobox (HOPX) and colorectal cancer. Int J Mol Sci. 2013; 14:23231–23243. https://doi.org/10.3390/ijms141223231. [PubMed].
18. Cheung WK, Zhao M, Liu Z, Stevens LE, Cao PD, Fang JE, Westbrook TF, Nguyen DX. Control of alveolar differentiation by the lineage transcription factors GATA6 and HOPX inhibits lung adenocarcinoma metastasis. Cancer Cell. 2013; 23:725–738. https://doi.org/10.1016/j.ccr.2013.04.009. [PubMed].
19. Kovárová D, Plachy J, Kosla J, Trejbalová K, Čermák V, Hejnar J. Downregulation of HOPX controls metastatic behavior in sarcoma cells and identifies genes associated with metastasis. Mol Cancer Res. 2013; 11:1235–1247. https://doi.org/10.1158/1541-7786.MCR-12-0687. [PubMed].
20. Yamashita K, Dai T, Dai Y, Yamamoto F, Perucho M. Genetics supersedes epigenetics in colon cancer phenotype. Cancer Cell. 2003; 4:121–131. https://doi.org/10.1016/S1535-6108(03)00190-9. [PubMed].
21. Yamashita K, Kim MS, Park HL, Tokumaru Y, Osada M, Inoue H, Mori M, Sidransky D. HOP/OB1/NECC1 promoter DNA is frequently hypermethylated and involved in tumorigenic ability in esophageal squamous cell carcinoma. Mol Cancer Res. 2008; 6:31–41. https://doi.org/10.1158/1541-7786.MCR-07-0213. [PubMed].
22. Cameron EE, Bachman KE, Myöhänen S, Herman JG, Baylin SB. Synergy of demethylation and histone deacetylase inhibition in the re-expression of genes silenced in cancer. Nat Genet. 1999; 21:103–107. https://doi.org/10.1038/5047. [PubMed].
23. Cancer Genome Atlas Research Network. Integrated genomic characterization of papillary thyroid carcinoma. Cell. 2014; 159:676–690. https://doi.org/10.1016/j.cell.2014.09.050. [PubMed].
24. Ushiku H, Yamashita K, Kawamata H, Waraya M, Katoh H, Yokoi K, Tanaka T, Ishii S, Nishizawa N, Kikuchi M, Minatani N, Kojo K, Tajima H, et al. Homeobox-Only Protein Expression Is a Critical Prognostic Indicator of Pancreatic Neuroendocrine Tumor and Is Regulated by Promoter DNA Hypermethylation. Pancreas. 2016; 45:1255–1262. https://doi.org/10.1097/MPA.0000000000000646. [PubMed].
25. Lima EU, Rubio IGS, Silva JC Jr, Galrão AL, Pêssoa DP, Oliveira TLC, Carrijo F, Silva IC, Fonseca LE, Sampaio LJL, Lima CRA, Cerutti JM, Ramos HE. HOPX homeobox methylation in differentiated thyroid cancer and its clinical relevance. Endocr Connect. 2018; 7:1333–1342. https://doi.org/10.1530/EC-18-0380. [PubMed].
26. Mori S, Chang JT, Andrechek ER, Matsumura N, Baba T, Yao G, Kim JW, Gatza M, Murphy S, Nevins JR. Anchorage-independent cell growth signature identifies tumors with metastatic potential. Oncogene. 2009; 28:2796–2805. https://doi.org/10.1038/onc.2009.139. [PubMed].
27. Chen F, Kook H, Milewski R, Gitler AD, Lu MM, Li J, Nazarian R, Schnepp R, Jen K, Biben C, Runke G, Mackay JP, Novotny J, et al. Hop is an unusual homeobox gene that modulates cardiac development. Cell. 2002; 110:713–723. https://doi.org/10.1016/S0092-8674(02)00932-7. [PubMed].
28. De Toni A, Zbinden M, Epstein JA, Ruiz i Altaba A, Prochiantz A, Caillé I. Regulation of survival in adult hippocampal and glioblastoma stem cell lineages by the homeodomain-only protein HOP. Neural Dev. 2008; 3:13. https://doi.org/10.1186/1749-8104-3-13. [PubMed].
29. Yin Z, Gonzales L, Kolla V, Rath N, Zhang Y, Lu MM, Kimura S, Ballard PL, Beers MF, Epstein JA, Morrisey EE. Hop functions downstream of Nkx2.1 and GATA6 to mediate HDAC-dependent negative regulation of pulmonary gene expression. Am J Physiol Lung Cell Mol Physiol. 2006; 291:L191–L199. https://doi.org/10.1152/ajplung.00385.2005. [PubMed].
30. Obarzanek-Fojt M, Favre B, Kypriotou M, Ryser S, Huber M, Hohl D. Homeodomain-only protein HOP is a novel modulator of late differentiation in keratinocytes. Eur J Cell Biol. 2011; 90:279–290. https://doi.org/10.1016/j.ejcb.2010.11.001. [PubMed].
31. Jain R, Li D, Gupta M, Manderfield LJ, Ifkovits JL, Wang Q, Liu F, Liu Y, Poleshko A, Padmanabhan A, Raum JC, Li L, Morrisey EE, et al. HEART DEVELOPMENT. Integration of Bmp and Wnt signaling by Hopx specifies commitment of cardiomyoblasts. Science. 2015; 348:aaa6071. https://doi.org/10.1126/science.aaa6071. [PubMed].
32. Harada Y, Kijima K, Shinmura K, Sakata M, Sakuraba K, Yokomizo K, Kitamura Y, Shirahata A, Goto T, Mizukami H, Saito M, Kigawa G, Nemoto H, et al. Methylation of the homeobox gene, HOPX, is frequently detected in poorly differentiated colorectal cancer. Anticancer Res. 2011; 31:2889–92. [PubMed].
33. Takeda N, Jain R, LeBoeuf MR, Wang Q, Lu MM, Epstein JA. Interconversion between intestinal stem cell populations in distinct niches. Science. 2011; 334:1420–1424. https://doi.org/10.1126/science.1213214. [PubMed].
34. Ren X, Yang X, Cheng B, Chen X, Zhang T, He Q, Li B, Li Y, Tang X, Wen X, Zhong Q, Kang T, Zeng M, et al. HOPX hypermethylation promotes metastasis via activating SNAIL transcription in nasopharyngeal carcinoma. Nat Commun. 2017; 8:14053. https://doi.org/10.1038/ncomms14053. [PubMed].
35. Yap LF, Lai SL, Patmanathan SN, Gokulan R, Robinson CM, White JB, Chai SJ, Rajadurai P, Prepageran N, Liew YT, Lopes V, Wei W, Hollows RJ, et al. HOPX functions as a tumour suppressor in head and neck cancer. Sci Rep. 2016; 6:38758. https://doi.org/10.1038/srep38758. [PubMed].
36. Vergara-Lluri ME, Moatamed NA, Hong E, Apple SK. High concordance between HercepTest immunohistochemistry and ERBB2 fluorescence in situ hybridization before and after implementation of American Society of Clinical Oncology/College of American Pathology 2007 guidelines. Mod Pathol. 2012; 25:1326–1332. https://doi.org/10.1038/modpathol.2012.93. [PubMed].