
Introduction
Topoisomerase II (TOP2) poisons belong to the most efficient class of anti-cancer drugs. They prevent re-ligation of otherwise transient DNA single and double strand breaks generated by TOP2, ultimately triggering apoptosis [1, 2]. Unfortunately, due to the involvement of TOP2 in such fundamental cellular processes as DNA replication and transcription, its poisoning affects both cancerous and normal cells. Thus, in addition to the transient bone marrow toxicity, TOP2 poisons cause irreversible side-effects such as secondary leukemia [3] and cardiotoxicity [4]. They are, therefore, gradually being supplemented by drugs targeting molecules and processes more specific to cancer cells.
Taking AML as an example, midostaurin and enasidenib can be nowadays added to standard chemotherapeutic regimens [5, 6] in patients carrying specific mutations in the protein targets of these drugs, FLT3 and IDH2, respectively. It is expected that, eventually, each cancer patient’s molecular tumor profile will be matched to a tailored treatment regimen. However, reaching the point where we can do this will take many years, as drugs targeting such individual targets will have to be developed, tested, and approved for even smaller patient cohorts. Furthermore, new cancer drugs remain out-of-reach to most patients due to prohibitive costs and they confer rather modest clinical benefits [7].
Here we explore the alternative and largely untested approach of fine-tuning established cancer therapies by combining them with already approved or experimental drugs targeting their cytotoxicity drivers. To this end, we analyzed gene expression profiles preceding and following the exposure to TOP2 poison etoposide. We reasoned that: (i) these profiles co-determine cell-killing effects of TOP2 poisons; and (ii) drugs targeting some of the involved genes’ protein products would be already available for testing as combination partners. We chose the TOP2 poison etoposide as a case scenario since apoptosis resulting from etoposide-driven DNA damage is accompanied by considerable gene expression changes of unexplored consequences [8, 9]. Furthermore, etoposide acts exclusively via TOP2, in contrast to anthracyclines, which additionally intercalate with DNA and target cellular mitochondria [10].
We chose AML as a cancer model, since AML is frequently treated with etoposide, especially relapsed cases [11]. We employed transcription analysis, since this is currently the most sensitive technique interrogating the expression of all genes, while broadly correlating with expression levels of their protein products. We assessed etoposide-driven gene expression changes by comparing pre-and post-treatment cell transcriptomes. We also considered the impact of prior-to-treatment gene expression levels on the response to etoposide across AML cell lines. Here, we reasoned that, in addition to expression changes, the response to etoposide is likely to be affected by pre-existing levels of proteins modulating its effects.
Tumor growth and metastasis are driven only by a fraction of the accompanying molecular changes. We assumed a similar relationship for etoposide response and gene expression levels. We intended to enrich for drivers as opposed by bystanders of etoposide cytotoxicity using two parallel approaches. Firstly, we focused on genes co-regulated within networks correlating with etoposide cytotoxicity. Here, we reasoned that genes involved in such networks are more likely to be involved in etoposide response compared to genes taken individually [12, 13]. Secondly, we focused on individual, but essential genes, i.e., on those reducing the survival of each of the AML cell lines investigated when knocked down using shRNA [14]. Among drivers thus identified, we differentiated between modulators, mediators, and emulators of etoposide response. Etoposide modulators are genes, whose expression correlates with etoposide cytotoxicity, but remains unchanged upon treatment. Etoposide mediators are genes that convey cytotoxicity via etoposide-driven changes in their expression levels. Etoposide emulators are upstream gene modulations and other drugs that evoke gene expression profiles resembling those evoked by etoposide.
Results
Overview of the pipeline
To identify drugs that could supplement or replace etoposide, we determined, analyzed, and functionally verified gene expression profiles prior and after etoposide treatment (Figure 1A). Two parallel approaches were followed. First, we identified networks of co-regulated genes (step 1 in Figure 1A). Genes derived from these networks, whose co-regulation was unaffected by etoposide and whose expression correlated with etoposide IC50, were defined as potential modulators of etoposide cytotoxicity (step 2). Second, among the etoposide-evoked individual gene expression changes (step 3), the essential genes were identified by applying the PAch-derived cancer cell essentiality filter (step 4). Putative etoposide emulators, i.e., gene modulations and drugs that cause gene expression changes either similar or contrary to those evoked by etoposide, were identified using CMap (step 5). Putative modulators, effectors, and emulators thus identified were further analyzed based on their: (i) biological function; (ii) relevance to a majority of AML cell lines; and (iii) inhibitor availability, and subjected to functional validation.
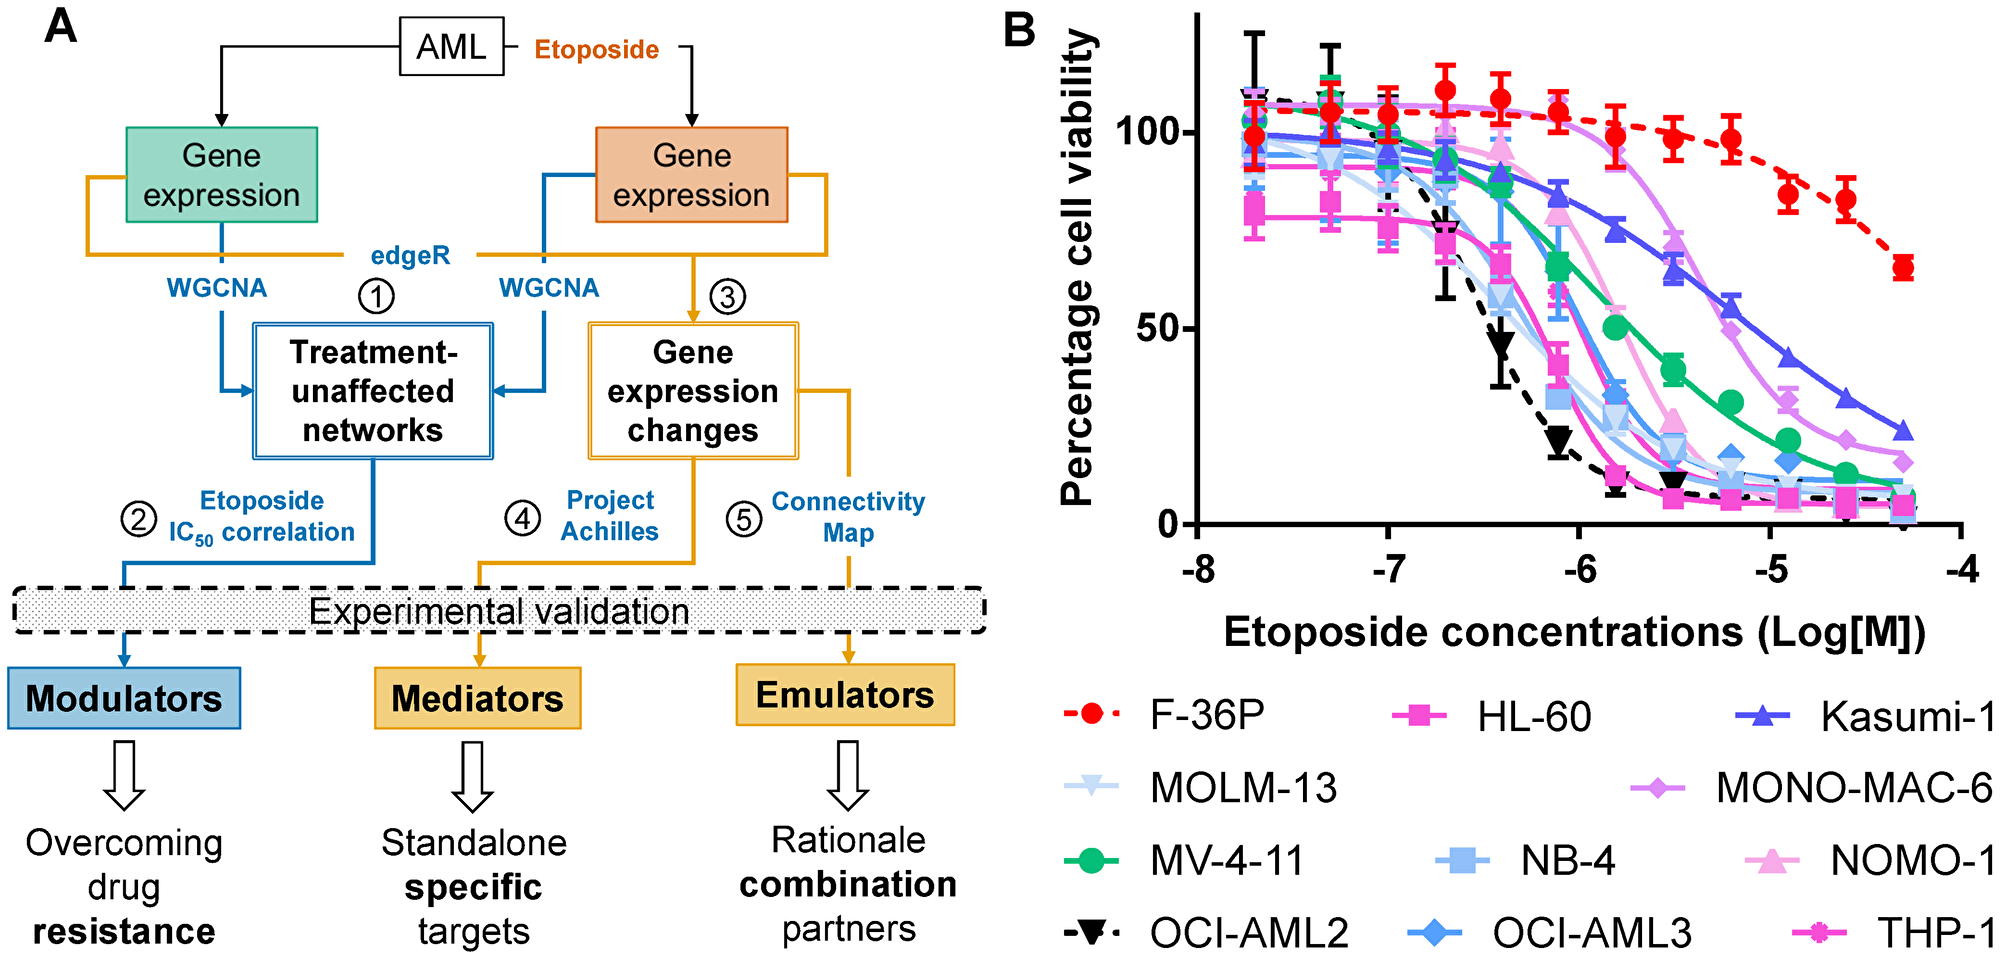
Figure 1: Identifying drivers of differential etoposide sensitivity in AML cell lines. (A) Pipeline integrating experimental data with publicly available resources to identify drivers of etoposide-mediated cytotoxicity. Numbers in circles identify major procedural steps (See Results section for details). (B) Concentration-dependent effect of etoposide on survival of AML cell lines after 24 hours. The most (OCI-AML2) and the least (F-36P) sensitive cell lines are depicted in black and red dotted lines respectively.
AML cell lines differ in etoposide sensitivity
We applied the WST8 cell viability assay to 11 AML cell lines following 24 hours of exposure to 0.02–50 μM etoposide. The cell lines exhibited differential sensitivity to etoposide (Figure 1B, Supplementary Table 1), with IC50 concentrations ranging from 0.3 μM (OCI-AML2) to 99 μM (F-36P). Since WST8 assay rely on metabolic activity of cells, we validated the IC50 concentrations by measuring apoptosis with Annexin V-FITC staining. The percentages of dead cells at WST8-derived IC50 values differed, on average, by 16% (1.4–30.6%) from percentages of apoptotic cells in the same cell lines treated identically but interrogated using Annexin V-FITC (Supplementary Figure 1).
Modulators synergize with etoposide
The AML cell lines were then treated for 24 hours with cell line-specific IC50 concentrations of etoposide to obtain similar cytotoxicity levels. We discarded RNA-Seq data from etoposide-treated OCI-AML2 cells, because it failed in the quality control of raw RNA sequences. Using WGCNA, we identified genes co-regulated in all 11 untreated AML cell lines, as well as in the remaining 10 etoposide-treated cell lines. By comparing pre- and post-treatment networks, we first identified and analyzed the genes with co-regulation unaffected by the treatment (Supplementary Figure 2). The 24 treatment-unaffected clusters comprised 5711 genes. The genes with expression levels correlating with etoposide response were involved in processes such as apoptosis, proteasomal catabolism, response to DNA damage, and DNA repair (Figure 2A and Supplementary Table 3). The 71 genes correlating positively with etoposide IC50 concentrations were considered putative assisting modulators; the 909 negatively correlating ones as putative impeding modulators (p < 0.05, Pearson’s r > |0.5|, Supplementary Table 3). Among them, we identified the previously reported modulators SLFN11 [15, 16] and SMARCA4 [17] whose expression correlated with etoposide sensitivity (Supplementary Table 3).
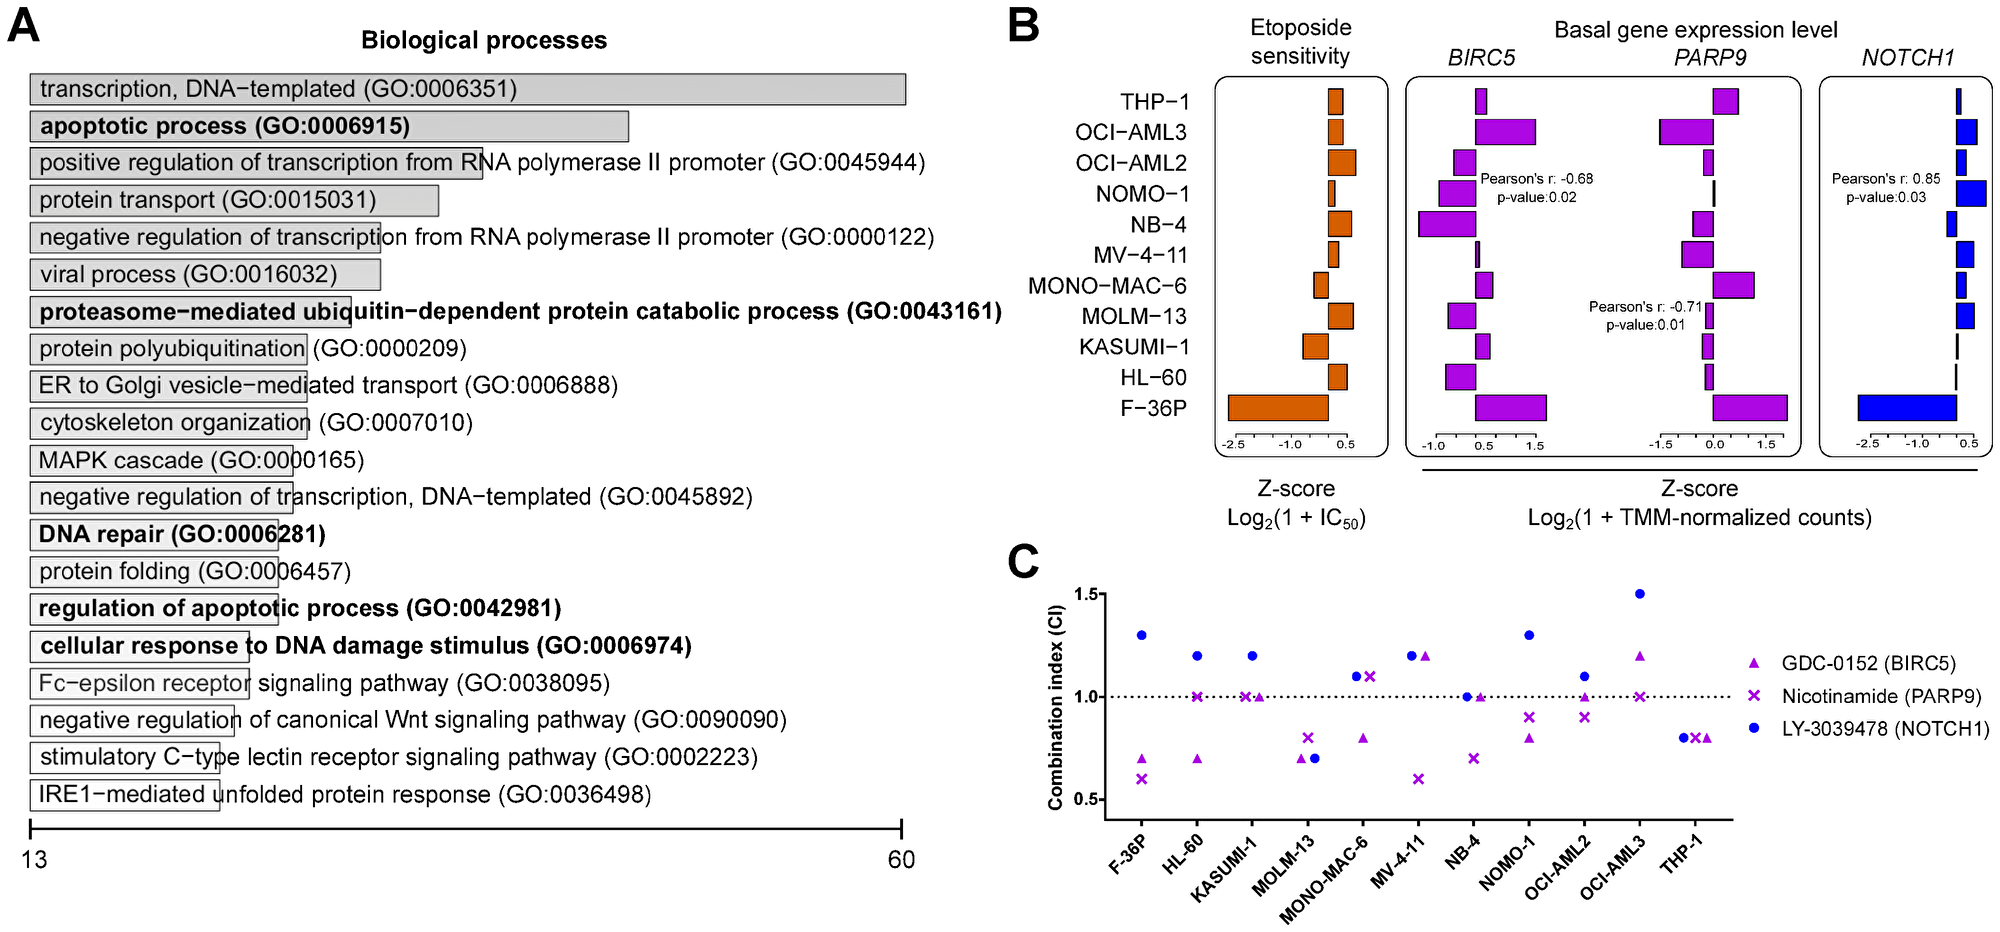
Figure 2: Impeding modulators synergize with etoposide. (A) Top 20 biological processes for the co-expressed genes from the consensus network negatively correlating with etoposide sensitivity. The scale represents number of genes enriched for individual biological processes. Processes previously linked to etoposide are shown in bold type. (B) Pearson correlations between the pre-treatment basal gene expression level of the impeding modulators BIRC5 and PARP9 and of the assisting modulator NOTCH1 with etoposide sensitivity across AML cell lines. (C) Combination index (CI; see Methods for details) for the cytotoxicity following treatment with IC25 concentrations of etoposide with inhibitors targeting the impeding modulators BIRC5 and PARP9 and the assisting modulator NOTCH1. CI < 1: synergism, CI = 1: additivity, and CI > 1: antagonism.
The putative impeding modulators BIRC5 and PARP9 (Figure 2B) were selected for experimental validation using chemical inhibitors against their protein products because of their involvement in apoptosis regulation and in double strand break repair, respectively. NOTCH1 (Figure 2B) was selected for experimental validation to confirm its putative etoposide-assisting activity. AML cell lines were treated for 24 hours with 3 concentrations (0.001 μM, 0.1 μM, and 10 μM) of chemical inhibitors alone, as well as in combination with cell line-specific IC25 concentrations of etoposide. The BIRC5 inhibitor GDC-0152 and the PARP inhibitor nicotinamide exhibited effects synergistic or additive to etoposide in 9 and 10 cell lines, respectively (Figure 2C and Table 1). The NOTCH1 inhibitor LY-3039478 antagonized with etoposide in 8 out of 11 AML cell lines (Figure 2C, Table 1, and Supplementary Table 4). Stand-alone cytotoxicity was observed in OCI-AML3 cells following BIRC5 inhibition and in two cell lines following NOTCH1 inhibition (Table 1 and Supplementary Table 5). In summary, all putative modulators investigated were confirmed by chemical inhibitors.
Table 1: Drivers of etoposide cytotoxicity identified in this study
| Drivers type | Targets (inhibitors) | Standalone cytotoxicity (no. of cell lines) | Synergy/additivity with etoposide (no. of cell lines) |
|---|---|---|---|
| Modulators | NOTCH1 (LY-3039478) | 2 | 2 |
| BIRC5 (GDC-0152) | 1 | 9 | |
| PARP9 (Nicotinamide) | 0 | 10 | |
| Mediators | BCL2A1 (Sabutoclax) | 11 | 1 |
| PRKCH (Sotrastaurin) | 7 | 3 | |
| PLK1 (Volasertib) | 11 | 1 | |
| IGF1R (GSK-1838705A) | 9 | 2 | |
| Emulators | MYC (TWS-119) | 10 | 2 |
| mTORi (Rapamycin) | 7 | 6 | |
| HDACi (Vorinostat) | 9 | 9 | |
| ROCK1 (Rockout) | 3 | 7 |
Mediators exhibit standalone cytotoxicity
We next analyzed co-regulated genes with expression levels correlating with the etoposide IC50 concentrations, but transcriptionally altered by etoposide treatment. The co-regulated genes found only in untreated cells, e.g., BRD4, MATL1, and MYC, regulate, among others, cell proliferation, transcription, and apoptosis (Supplementary Table 6). The genes co-regulated only in networks newly formed after etoposide treatment, e.g., SIRT1, regulate, among others, transcription, response to DNA damage, and DNA repair (Supplementary Table 7). BRD4 and MYC were transcriptionally repressed, while MALT1 and SIRT1 were transcriptionally induced by etoposide in the less responsive AML cell lines (Supplementary Figure 3). However, all of them, except MYC, were essential in only 4 AML cell lines, based on their DEMETER scores.
Therefore, we next analyzed and functionally verified etoposide-driven gene expression changes at the level of individual genes. Gene inductions accounted for 81% of etoposide treatment-driven transcriptional changes (Supplementary Table 8). Essentiality analysis suggested that, on average, about 33% of etoposide-driven changes could have reduced AML cell survival (Supplementary Table 9). An example of gene expression changes grouped according to essentiality in F-36P cell line is shown in Figure 3A. We selected IGF1R for experimental validation, since it was essential for 7 AML cell lines and repressed in 4 AML cell lines after etoposide treatment (Figure 3B and Supplementary Table 10). Likewise, PLK1, was essential as well as repressed in 4 AML cell lines (Figure 3B and Supplementary Table 10). We pursued PLK1 because it exhibited highest essentiality for the least etoposide-sensitive F-36P cell line (Figure 3A and Supplementary Table 10). BCL2A1 and PRKCH were selected because of their predicted essentiality for 6 AML cell lines each, and because they were induced by etoposide in 9 and 6 AML cell lines, respectively (Figure 3B and Supplementary Table 10).
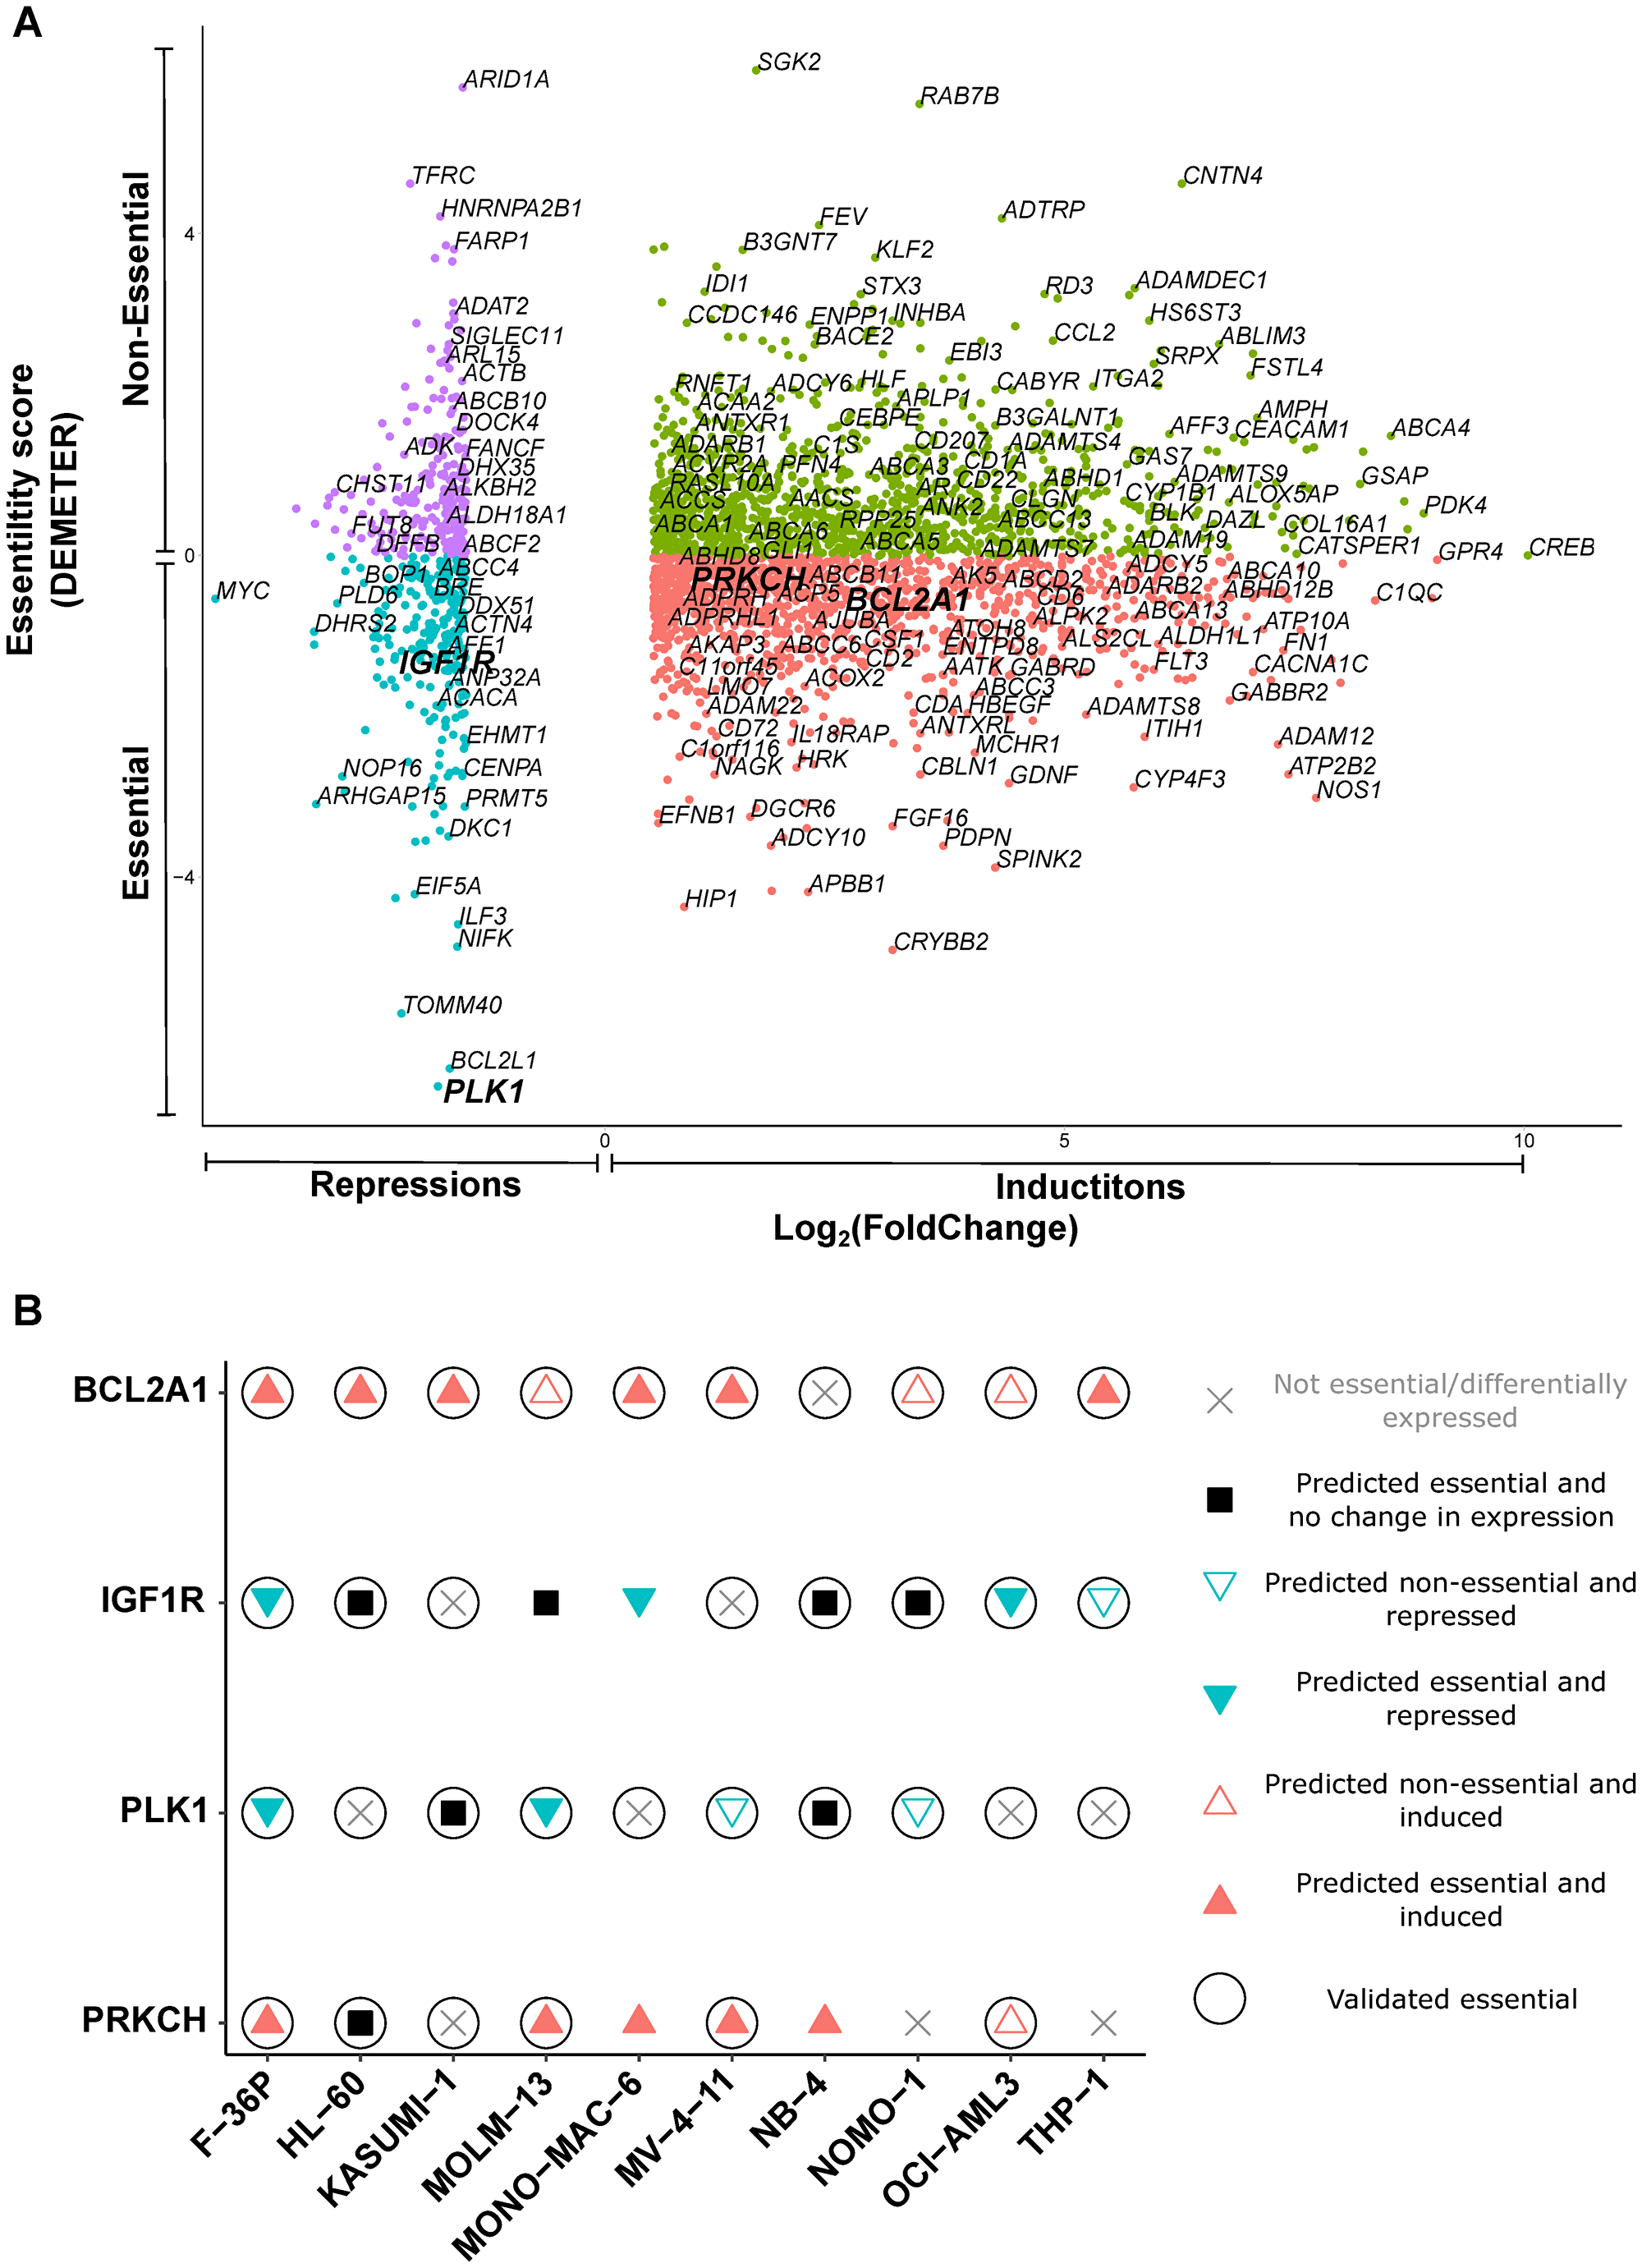
Figure 3: Essential mediators exert cytotoxicity in AML cell lines. (A) Scatterplot of etoposide-evoked differentially expressed genes in F-36P cell line, arranged according to essentiality for survival. DEMETER score < 0 signifies essentiality. The genes essential for tumor cell survival and differentially expressed after etoposide treatment were considered as putative essential mediators. The mediators shortlisted for experimental validation (BCL2A1, IGF1R, PLK1, and PRKCH) are depicted in larger font. Other gene names are random examples taken from the entire gene set. (B) Experimental validation of putative essential mediators shortlisted in (A). Cell viability was assessed by WST-8 assay after treatment with inhibitors targeting protein products of shortlisted drivers. Filled symbols represent predicted essentiality for survival in individual AML cell lines. Circles around the symbols represent experimentally confirmed cytotoxicity.
We treated all AML cell lines with the inhibitors of the protein products of these genes alone, as well as in combination with IC25 concentrations of etoposide. The inhibitors targeting the protein products of BCL2A1 and PLK1 exerted standalone cytotoxicity in all AML cell lines, while the IGF1R inhibitor and the PKC inhibitor exhibited cytotoxicity in 9 and 7 AML cell lines, respectively (Figure 3B, Table 1, and Supplementary Figure 4). Inhibition of BCL2A1 and PLK1 synergized with etoposide in MOLM-13 and NB-4 cell lines, respectively. Inhibition of PRKCH and IGF1R exhibited synergy with etoposide in 2 AML cell lines each (Table 1 and Supplementary Table 4). We additionally investigated in HL-60 cells the cytotoxic effects of the essential mediators BCL2A1 and IGF1R using shRNA-mediated knockdown. Knockdown of the mediator IGF1R was cytotoxic to HL-60 cells. (Supplementary Figure 5). In summary, all putative etoposide mediators investigated were confirmed to be cytotoxic in most AML cell lines.
Emulators are cytotoxic and synergize with etoposide
Using the CMap resource, we identified gene modulations and drugs that cause gene expression changes either similar or contrary to those evoked by etoposide. There were 32 gene knockdowns and 76 drugs whose application led to etoposide-like gene expression changes. They were referred to as putative etoposide-like emulators. The majority of the drugs belonged to the classes mTOR inhibition, topoisomerase inhibition, and HDAC inhibition. We also identified 12 drugs evoking opposite gene expression changes, referred to as putative etoposide-contrary emulators (Supplementary Table 11). We measured cell viability in AML cell lines treated with inhibitors targeting the protein products of selected putative etoposide-like emulators individually, as well as in combination with etoposide (IC25 concentrations) for 24 hours. Targeting of the etoposide-like emulator MYC with TWS-119 led to cytotoxicity in all AML cell lines except MONO-MAC-6 (Figure 4A and Table 1). Similarly, inhibition of etoposide-like emulators HDAC with vorinostat and of mTOR with rapamycin evoked cell death in in 9 and 6 AML cell lines, respectively (Figure 4B and 4C, and Table 1). Interestingly, vorinostat and rapamycin also exhibited synergy or additivity with etoposide in 9 and 6 AML cell lines, respectively (Figure 4D, Table 1, and Supplementary Table 4).
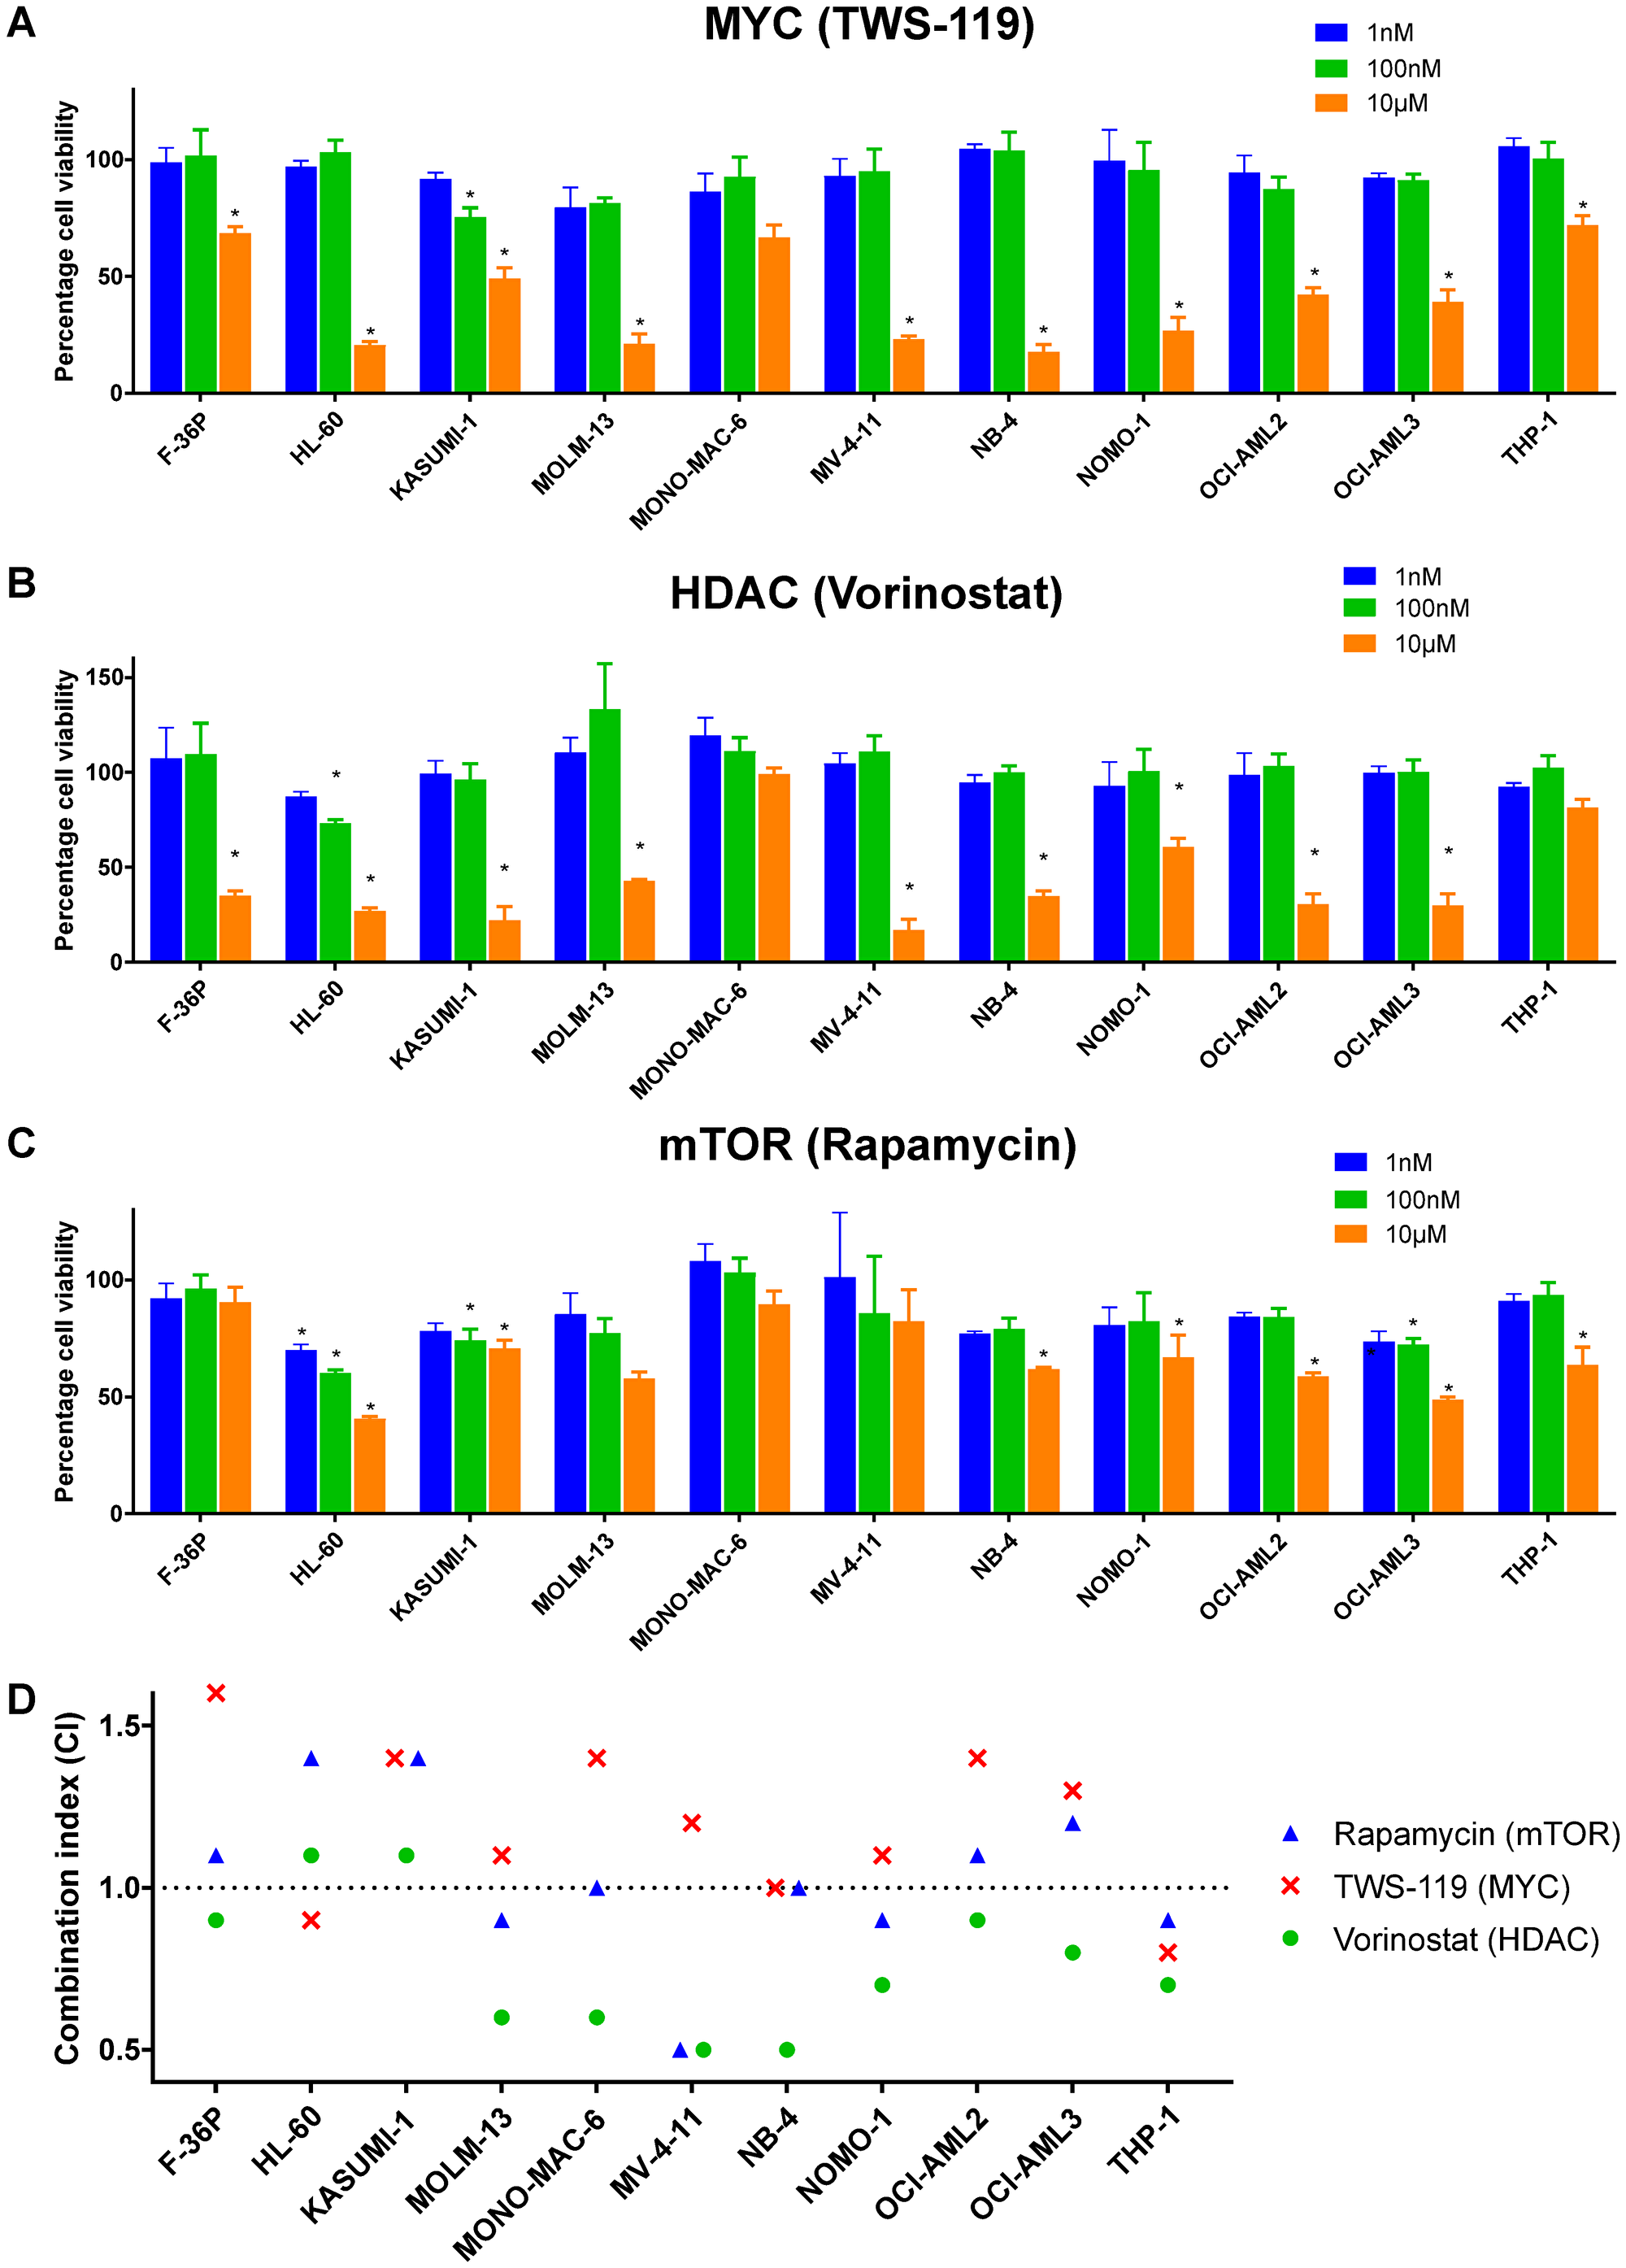
Figure 4: Etoposide-like emulators are cytotoxic and synergize with etoposide. Concentration-dependent cytotoxicity after inhibiting etoposide-like emulators (A) MYC with TWS-119, (B) HDAC with vorinostat, and (C) mTOR with rapamycin. (D) Combination index (CI; see Methods for details) of etoposide treatment with protein inhibitors targeting MYC, HDAC, and mTOR. CI < 1: synergism, CI = 1: additivity, and CI > 1: antagonism. Two-way ANOVA with Benjamini and Hochberg FDR correction was performed to identify statistically significant cytotoxicity in comparison to vehicle treated cells (indicated by asterisks, *Adj. P < 0.05). Data are represented as mean ± SD.
The etoposide-contrary emulator ROCK1 also synergized or exhibited additivity with etoposide in 7 out of 11 AML cell lines, when inhibited with rockout. Inhibition of ROCK1 was cytotoxic in only 3 AML cell lines (Table 1 and Supplementary Table 5). The target specificity of rockout was confirmed by demonstrating cytotoxicity in HL-60 cells upon shRNA-mediated knockdown of ROCK1 (Supplementary Figure 5).
Driver-etoposide combinations enhance cytotoxicity without increasing DNA damage
To assess the safety of the experimentally validated combinations of etoposide with other drugs, we examined their effect on DNA damage in the HL-60 cell line. We measured the number of FITC-conjugated anti-phospho H2A.X-labelled HL-60 cells by flow cytometry before and after the treatment with etoposide alone or in combination with other drugs for 24 hours. Etoposide caused, as an effect of TOP2-poisoning, DNA damage in 45% of cells at IC25 concentration. None of the investigated etoposide-combinations elevated the amount of DNA damage in comparison to etoposide alone (Figure 5A). The BIR inhibitor GDC-0152 even reduced the amount of DNA damage in comparison to etoposide alone.
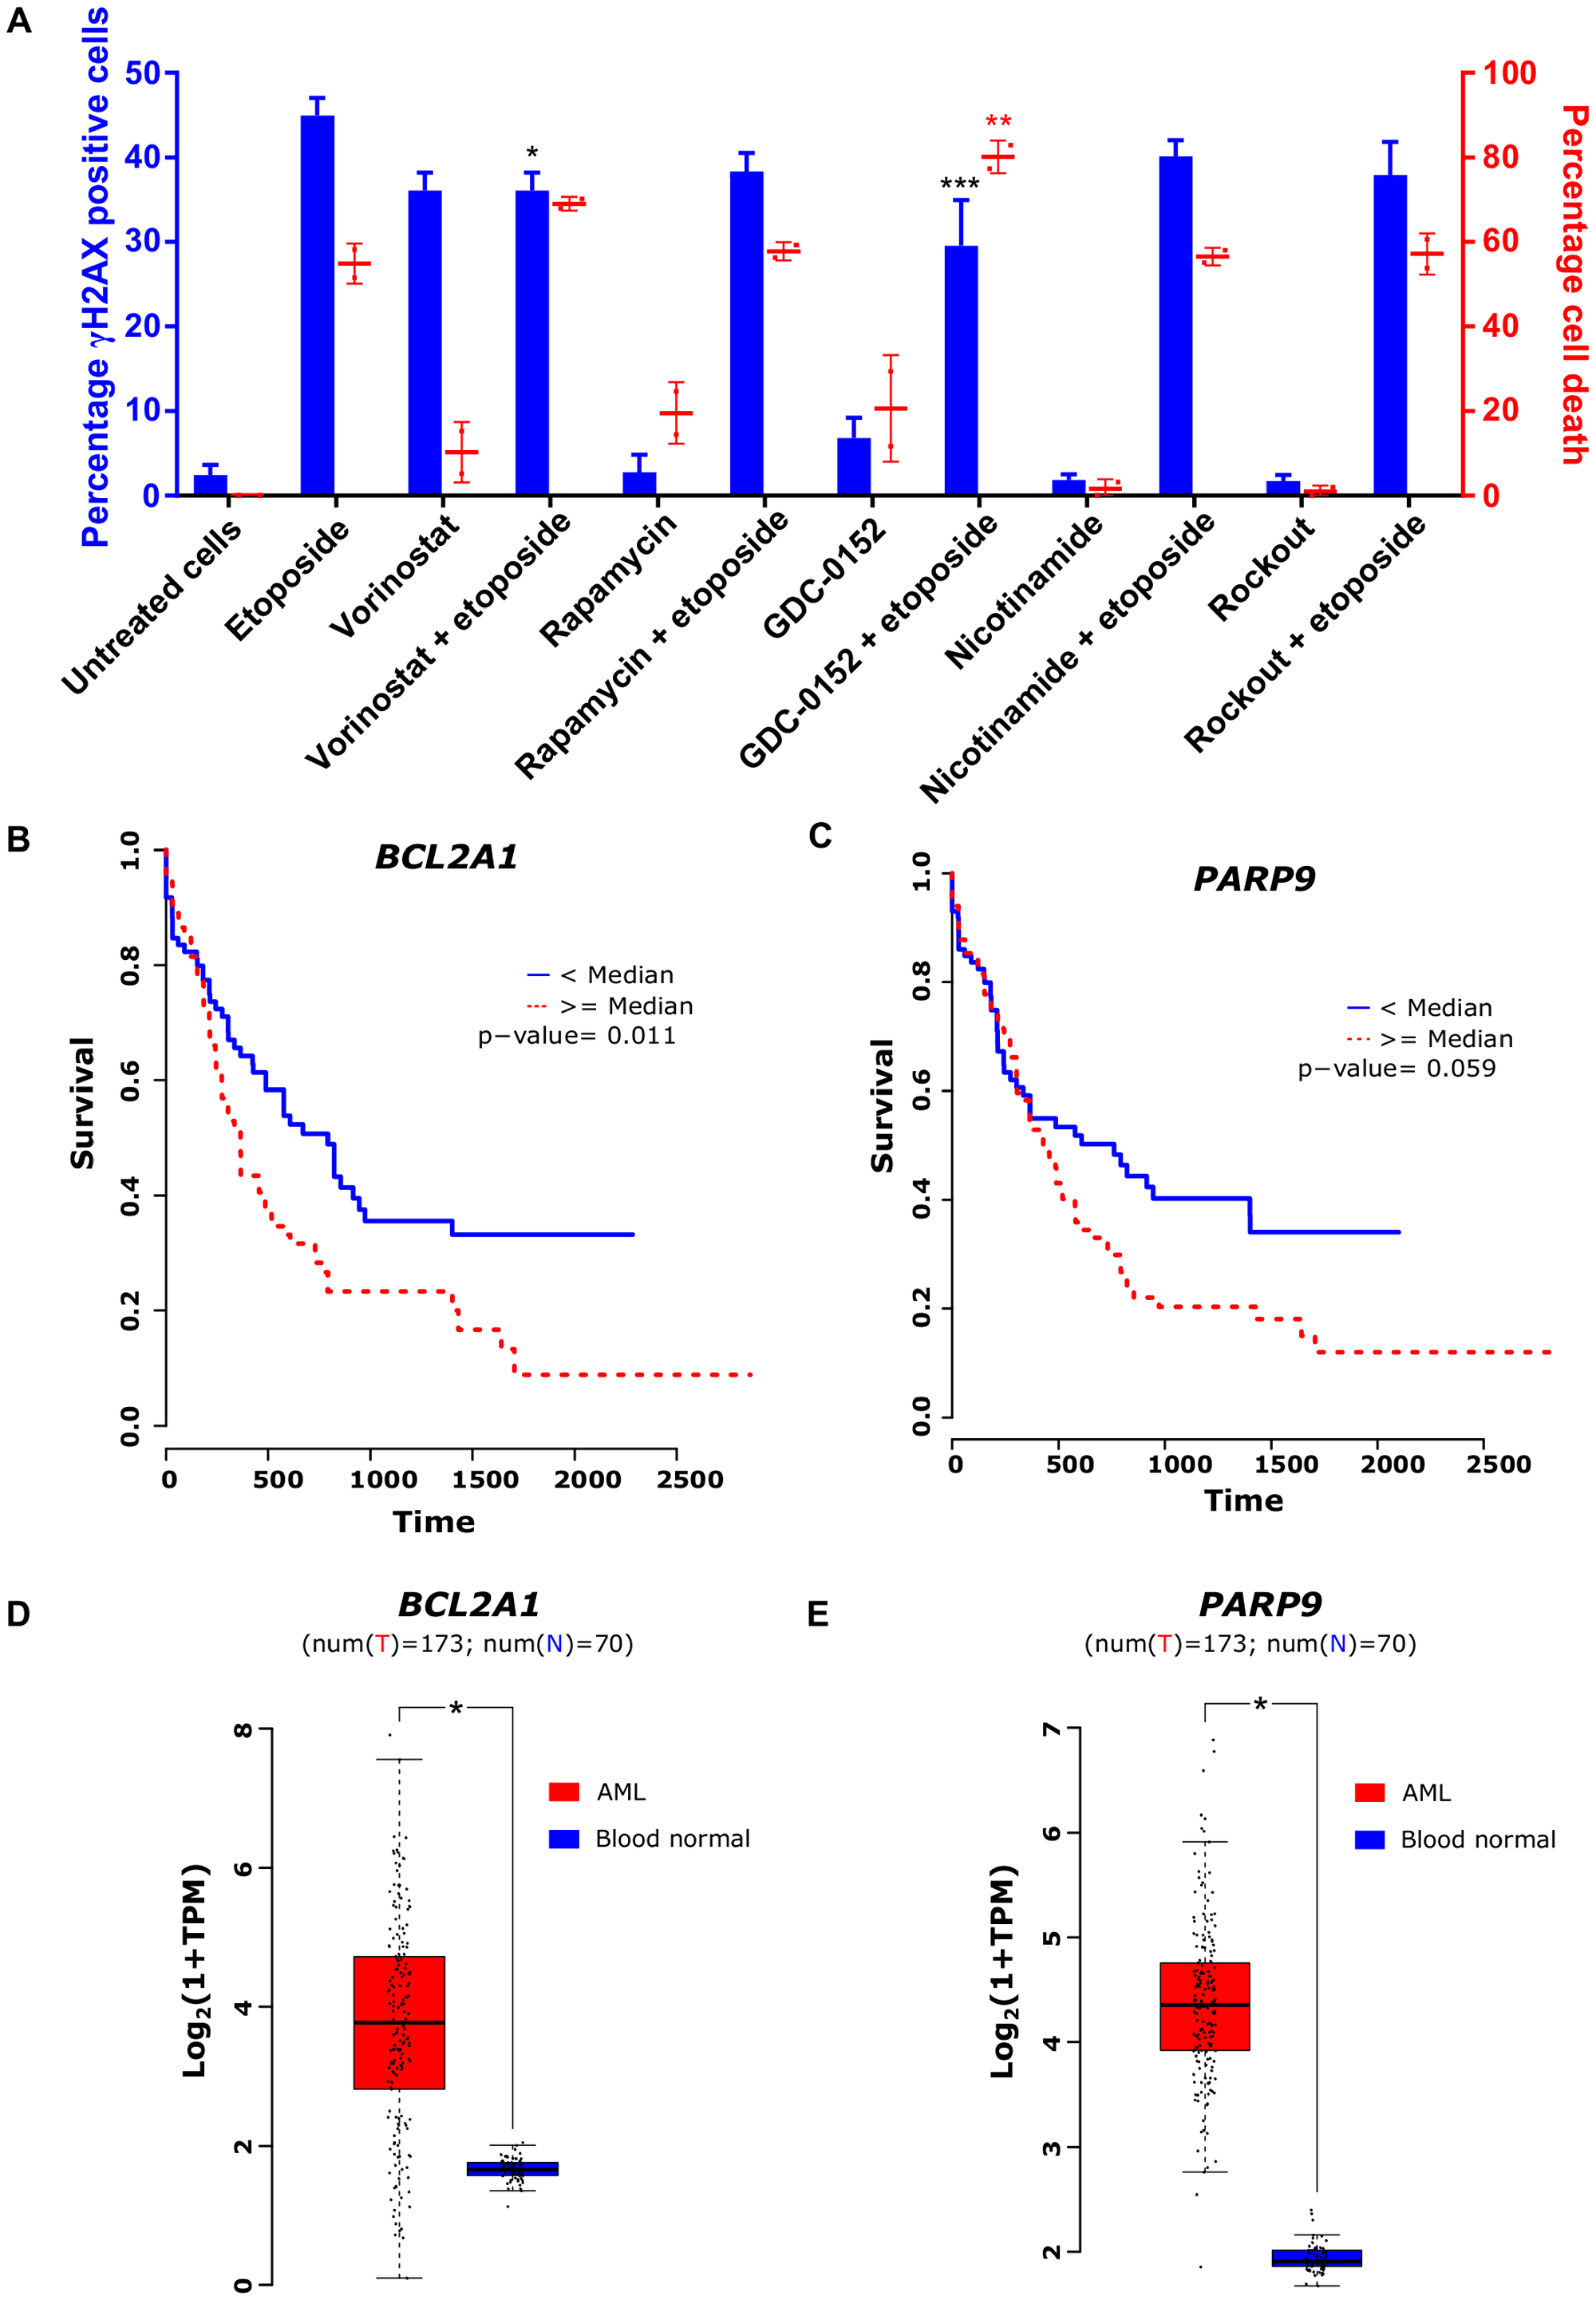
Figure 5: Safety and clinical relevance of transcriptional drivers of etoposide. (A) Fraction of phospho-H2A.X-positive cells counted using flow cytometry (black bars) and percentages of cell death after treatment with different inhibitors alone as well as in combination with IC25 concentration of etoposide in HL-60 cell line (gray bars). (B) and (C) Kaplan-Meier plots representing survival of AML patients with high and low expression of BCL2A1 and PARP9, respectively. (D) and (E) Basal expression of BCL2A1 and PARP9, respectively, in AML and normal blood cells. One-way ANOVA with Dunnett’s multiple comparisons test was performed to identify significant γH2AX formation and cell death induction in comparison to etoposide alone (indicated by asterisks, *Adj. P < 0.05, ***Adj. P < 0.0005). Data are represented as mean ± SD.
Drivers of etoposide cytotoxicity form unfavorable prognostic markers in AML patients
To assess the clinical relevance of identified drivers, we inspected gene expression and clinical data of 173 AML patients from TCGA and compared with gene expression in 30 normal blood samples from GTEx. The analysis revealed an association between high expression of BCL2A1 and PARP9 with poor survival in AML patients (Figure 5B and 5C). Furthermore, these genes were highly expressed in AML patients compared to healthy individuals (Figure 5D and 5E). Additionally, the Human Protein Atlas resource revealed high expression of BIRC5 or PLK1 to be associated with poor survival in renal, liver, and lung cancer patients and high expression of ROCK1 to be a marker of unfavorable prognosis in pancreatic cancer [18].
DISCUSSION
In this work, we demonstrate that etoposide kills cancer cells depending on expression levels of driver genes, some of which it modulates. Since WST8 data correlated well with Annexin V, we speculate that cell loss predominates over growth inhibition. This effect is distinct from the etoposide concentration-driven increase in DNA double stranded breaks [19]. Targeting these drivers genetically or pharmacologically mimics or augments the response to etoposide, indicating a potential for clinical exploration. The pipeline used to discover drivers of etoposide cytotoxicity is applicable to other TOP2 inhibitors and to cytotoxic drugs in general.
DNA double-strand-breaks independent cytotoxicity of etoposide
Since the response of cancer cells to TOP2 poisons is variable, attempts have been made to explain it by considering pre-treatment gene expression levels [15, 20–23]. SLFN11 [15, 16] and SMARCA4 [17], re-discovered in our study, have been identified as modulators of TOP2 poisons, including etoposide, but failed to make clinical impact. Treatment-driven gene expression changes have been likewise reported [24, 25], but not explored for optimizing response to TOP2 poisons. We considered both pre-treatment gene expression levels and drug-evoked changes, as a surrogate of pre- and post-treatment protein expression levels.
Post-treatment transcriptomes were particularly important, since they were essential for the discovery of 8 out of 11 functionally confirmed drivers (i.e., of all mediators and emulators depicted in Table 1). Only gene repressions can be expected to arise directly from DNA damage within regulatory or coding gene sequences. Furthermore, the number of etoposide-driven DNA double strand breaks, assessed by H2A.X, is typically 1–2 orders of magnitude lower than the number of gene expression changes [26]. Hence, most of the observed etoposide-evoked gene expression changes were likely secondary, which is also consistent with the predominance of gene inductions over reductions. Unsurprisingly, these secondary changes partly reflected the activation of DNA damage response.
The filtering strategies used, WGCNA and essentiality analysis, were originally meant to maximize the specificity of driver detection. Genes co-regulated across specimens are more likely to play important roles in, for example, drug response, than individual genes [12, 13]. The same applies to the genes essential for cancer cell survival [14]. This strategy was successful, since all 11 potential drivers identified were functionally confirmed according to pre-set criteria. In addition, combining these two strategies may have improved the sensitivity of our approach. For example, MYC missed detection in WGCNA analysis, but was identified as a potential driver in mediator and emulator screens.
We based our classification of etoposide drivers primarily on gene expression, with modulators remaining unchanged, mediators undergoing changes, and emulators mimicking etoposide-like expression profiles. Interestingly, this classification broadly correlates with the functional validation. Thus, mediators displayed standalone cytotoxicity but little synergy with etoposide, modulators behaved inversely, whereas emulators exhibited a mix of both (Table 1). The absence of synergy of etoposide with mediators likely reflects the convergence of etoposide (via expression change) and a mediator’s chemical inhibitor on one and the same target. Conversely, modulators may synergize with etoposide precisely because they remain unaffected by etoposide. Emulators may be cytotoxic alone and synergize with etoposide due to the complex expression changes they evoke.
Potential application to AML and other cancers
Etoposide effects can clearly be optimized by targeting drivers of its toxicity, but how relevant is this strategy to AML management? AML relapse occurs in around 40% of patients treated with first-line chemotherapy, typically comprising cytarabine and daunorubicin [27]. Although there is no standard treatment, relapsed cases are often treated with mitoxantrone, etoposide, and cytarabine (MEC) combinations. However, many patients do not tolerate the associated increased side-effects [27, 28]. Hence, there is a need to improve efficacy and reduce the toxicity of these treatment regimens. Similar needs exist for other etoposide applications, such as testicular, prostate, and small cell lung cancer.
Interestingly, some of the drivers described in this work have been or are currently undergoing testing. This provides an additional validation of our approach. Supplementing etoposide with the inhibitor of its emulator mTOR with rapamycin has already been shown to reduce the survival of cancer cells in a mouse model of AML [29]. A phase II trial for managing high-risk AML patients with rapamycin in combination with MEC regimen is ongoing (NCT02583893). The etoposide-synergy with HDAC inhibition is currently undergoing testing for Acute Lymphoblastic Leukemia (NCT02553460). Due to the interaction of TOP2 with HDAC1 and 2, etoposide-evoked DNA double strand breaks could affect the chromatin architecture [30]. Interestingly, we observed etoposide-evoked induction in SIRT1. It is evident that SIRT1 induction synergizes with HDAC inhibition [31]. This is in agreement with the observed etoposide-evoked induction of SIRT1 and its observed synergy with vorinostat.
Improved clinical outcomes in AML patients have been already reported for the PLK1 inhibitor volasertib [32] and a Phase III trial is ongoing (NCT01721876). Strikingly, PLK1 inhibition with volasertib was cytotoxic in all 11 AML cell lines. This suggests that cytotoxicity drivers can be efficient beyond the cohort subset in which they were detected. Inhibition of IGF1R (Insulin-like growth factor receptor 1) has been found to be efficacious together with etoposide and cisplatin in small-cell lung cancer [33] and further clinical trials are undergoing with other drugs and cancer types.
The use of DNA damaging drugs, including etoposide, is associated with increased risk of secondary leukemia because of chromosomal aberrations [34, 35]. Hence, it is crucial to formulate combination partners that do not increase the risk even further. Our primary investigation using DNA double strand breaks marker γH2A.X revealed that none of the combinational partners elevated the DNA damage compared to etoposide alone. We speculate that etoposide in combination with its cytotoxicity drivers would exert less side effects because of its dose reduction. However, this needs in-depth investigation using AML mouse models.
Limitations
The approach used in this study has certain limitations and caveats, beginning with the assumption of gene expression reflecting protein expression. While this assumption is generally true, the expression and activity levels of some proteins are regulated without changes in the RNA expression level. Nevertheless, all potential drivers selected for validation displayed standalone toxicity or modified that of etoposide. Altogether, using transcriptome data is sufficiently sensitive and specific to detect and confirm cytotoxicity drivers worth further exploration in animal models and in the clinic.
Furthermore, it seems that some genes identified as drivers serve as markers of additional, undetected drivers. For example, inhibiting the etoposide modulator BCL2A1 with sabutoclax caused cytotoxicity in all AML cells. In contrast, a shRNA-mediated knockdown of BCL2A1 in HL-60 cells had no effect. Additional members of the Bcl2 family may have contributed to the effect of sabutoclax, a pan-Bcl2 inhibitor. shRNA-mediated knockdowns did confirm the specific involvements of IGF1R and ROCK1. Wherever possible, putative drivers should undergo verification both by genetic and pharmacological means.
Perspective
Our results suggest a major and yet untapped contribution of etoposide-evoked gene expression changes to this drug’s anti-cancer effects. In order to make a clinical impact, the etoposide drivers will have to be validated in ex vivo models using AML patient samples, as well as in animal models.
Even though modulators generally exhibited synergy and mediators generally exhibited standalone cytotoxicity, their effect was not alike in all AML cell lines. None of the common AML oncogenic alterations correlated with observed response. However, few etoposide-evoked changes were in agreement with the response. For example, the absence of synergy between GDC-0152 (targeting the modulator BIRC5) and etoposide in MV-4-11 and OCI-AML3 cell lines may have resulted from bypassing TP53-mediated apoptosis because of high expression of CDKN1A (P21) and MDM2 after etoposide treatment. Furthermore, high expression BRCA1 in HL-60 cells may have contributed to efficient DNA double strand repair and absence of synergy between nicotinamide (targeting the modulator PARP9) and etoposide. Along the same line, presence of synergy between sabutoclax (targeting the mediator BCL2A1) and etoposide may have resulted from high expression of BAX after etoposide treatment in MOLM-13 cells. Finally, the highest basal expression of PLK1 and etoposide-driven dynamics may have contributed to observed synergy between volasertib (targeting the mediator PLK1) and etoposide.
Similar studies could be conducted with other classical cancer drugs. New anti-cancer drugs provide limited clinical benefits and they are prohibitively costly. We envision fine-tuning and individualization of established chemotherapies based on their transcriptional response and resulting changes to cellular dynamics.
Materials and Methods
Cell culture and drug treatment
Acute Myeloid Leukemia (AML) cell lines F-36P, HL-60, KASUMI-1, MOLM-13, MONO-MAC-6, MV-4-11, NB-4, NOMO-1, OCI-AML2, OCI-AML3, and THP-1 were purchased from Deutsche Sammlung von Mikroorganismen und Zellkulturen (DSMZ, Germany). Cell lines were maintained at 37°C and 5% CO2 in appropriate media (Supplementary Table 1). 293T cells were cultured in DMEM (Gibco, Germany) along with 10% FBS (Biochrom, Germany). Cell lines were routinely verified for mycoplasma contamination using Venor®GeM Mycoplasma Detection Kit (Sigma-Aldrich, Germany). Cell lines were authenticated by Multiplexion, Germany. The inhibitors were purchased from Abcam (UK), Biozol (Germany), and Santa Cruz Biotechnology (US).
WST-8 cell viability assay
Reduction of WST-8 by cellular dehydrogenases produce formazan, whose signal is directly proportional to the number of viable cells. Both reduced cell proliferation and cell loss due to drug toxicity diminish the WST-8 signal. We seeded 1 × 10⁴ cells per well in a 96-well plate and incubated overnight. Cells were then treated for 24 hours with various concentrations of etoposide (0.02, 0.05, 0.1, 0.2, 0.37, 0.78, 1.56, 3.13, 6.25, 12.5, 25, 50 μM). Cell viability was measured using a colorimetric cell viability kit (WST-8) from PromoKine, Germany. In short, after the treatment with etoposide, 10% WST-8 reagent was added to the cells. After 1-4 hours incubation in dark at room temperature, absorbance was measured at 450 nm using Spectramax iD3 (Molecular Devices, USA) spectrometer. Absorbance from the DMSO-treated cells (vehicle control) was considered as 100% cell viability and used to calculate percentage cell viability after etoposide treatment.
Annexin V apoptosis assay
We seeded 2 × 10⁵ cells/ml in a 6-well plate and incubated overnight. Cells were then treated with cell line-specific etoposide IC50 concentrations, derived from the cell viability assay, for 24 hours, washed twice with ice-cold PBS, and resuspended in binding buffer (1 × 10⁶ cells/ml). Thereafter, 100 μl of cell suspension (1 × 10⁵ cells) was transferred to a new tube, followed by addition of 5 μl each of Annexin V and PI staining solution (FITC Annexin V apoptosis detection kit I, BD Biosciences, USA). Cells were then gently vortexed and incubated in dark for 15 minutes at room temperature. 400 μl of binding buffer was then added to the cells and analyzed using BD Accuri C6 flow cytometer (BD Biosciences, USA).
RNA-Seq: RNA extraction and library preparation
The gene expression profiles in 11 untreated and etoposide-treated AML cell lines were determined by RNA sequencing. 1 × 10⁶ cells per well were seeded in a 6 well plate containing 5 ml of the media. Cells were incubated overnight and then treated for 24 hours with etoposide at cell line-specific IC50 concentrations. Cells from 3 wells were then pooled together and total RNA was isolated using TriFast, peqGOLD total RNA kit and DNase I Digest kit (VWR PEQLAB GmbH, Germany) according to manufacturer’s instructions. The quality and integrity of the extracted RNA was examined using a 2100 Bioanalyzer (Agilent technologies). Samples were sequenced by Illumina HiSeq 2000 using TruSeq stranded mRNA HT sample prep kit at the Genomics Core Facility at the Institute of Molecular Biology (IMB, Mainz, Germany). The targeted sequencing depth was 30 million reads.
RNA-Seq: analysis
We assessed the quality of raw sequencing reads using FastQC (Babraham Bioinformatics, Cambridge, UK). We then mapped these reads to the human reference genome (gencode release 25 GRCh38. p7) using the STAR aligner (v2.5.3a) [36], with the option “–quantMode GeneCounts” to count the number of reads mapped per gene. Quality of the expression data was assessed using NOISeq (v2.20.0) [37] R package [38]. We then performed differential gene expression analysis using edgeR (v3.20.1) [39]. Genes with fold change higher than 2 folds and FDR below 0.05 were considered as differentially expressed. Data is available at GEO Series accession number GSE126895 [40].
Weighted gene co-expression network analysis (WGCNA)
To identify modulators and mediators of etoposide sensitivity, we performed weighted gene co-expression network analysis (WGCNA) using basal gene expression in AML cell lines prior and after etoposide treatment. Prior to WGCNA analysis, raw RNA-Seq counts were subjected to trimmed mean of M values (TMM) normalization, a preferred method for between-sample normalization [41]. The resulting co-regulated networks were compared to identify genes: (i) co-regulated only before treatment; (ii) co-regulated only after treatment; and (iii) unaffected by treatment. Gene Ontology analysis was performed for identified networks using the Database for Annotation, Visualization and Integrated Discovery (DAVID, https://david.ncifcrf.gov/). Cell line specific expression levels of co-regulated genes unaffected by treatment were correlated with cell specific etoposide IC50 concentrations by Pearson correlation statistics using the WGCNA package in R [12]. The co-regulated genes with positive and negative correlation with etoposide IC50 were selected for Gene Ontology analysis using DAVID.
Identification of mediators among etoposide-evoked gene expression changes
The Project Achilles (PAch) [42] dataset was utilized to retrieve genes most likely to be essential for AML cell survival. PAch investigated the effect of more than 11k shRNA-mediated individual gene knockdowns on cell survival in 501 cancer cell lines, including all AML cell lines used in the present study. Genes with negative DEMETER scores (defined in a previous study [14]) were considered essential for cancer cell survival. Genes essential for 6 or more AML cell lines as well as differentially expressed after etoposide treatment were considered potential essential mediators and experimental validated.
Prediction of etoposide emulators
Emulators, i.e., gene modulations and compounds that evoke gene expression changes similar to those evoked by etoposide, were identified using the Connectivity Map (CMap, Broad Institute) [43]. CMap provides changes in the expression of 1000 genes following gene perturbations and treatments with numerous small-molecule compounds. These genes and drugs were identified by uploading the top 300 overlapping etoposide-evoked gene expression changes (150 up- and 150 down-regulated) from AML cell lines to CMap via the CLUE platform (CMap and LINCS Unified Environment).
Driver validation using inhibitors
The inhibitors against the selected drivers were identified using the GeneCards [44], IUPHAR/BPS guide to pharmacology [45], and CMap [43] resources. These drivers were then validated using WST-8 cell viability assay. AML cell lines were treated for 24 hours with 1 nM, 100 nM, and 10 μM of each inhibitor alone, as well as in combinations with cell-specific IC25 concentrations of etoposide, followed by WST-8 cell viability assay. Percentage cell viability compared to vehicle-treated cells, taken as 100%, was calculated for single and combination treatments. For combination treatment screening, the synergy was defined as per-response additivity approach [46]. The combination index (CI) was calculated as
Driver validation using shRNA-mediated gene knockdown
To investigate the effect of individual gene knockdowns on AML cell survival, we cloned shRNA targeting BCL2A1, IGFIR, and ROCK1 into Tet-pLKO.1-puro vector (kindly provided by Dimitri Wiederschain, Novartis Institutes for BioMedical Research, Cambridge, MA). shRNA sequences were obtained from the PAch resource and were synthesized by Sigma-Aldrich, along with RHS4743 expressing scrambled shRNA (Supplementary Table 2). These sequences have been validated at the protein levels in several previous publications [47–49]. Lentiviral particles were generated by co-transfecting psPAX2, pMD2. G along with previously generated shRNA expressing vectors into 293T cells. Transfection was carried out using TransIT (Mirus) as per the manufacturer’s instructions. To achieve stable transduction, AML cell lines were seeded 1 × 10⁶ in a 6-well plate, with indicated virus supernatant in presence of 5 μg/mL polybrene and spin-infected at 2500 rpm at 32° C for 1 and 45 hours. Following 16 hours incubation at 37° C, cells were supplemented with 1–2 μg/mL puromycin (Sigma-Aldrich, Germany). Furthermore, to induce knockdown of the indicated drivers, we seeded 5 × 10⁵ cells per well in 6-well cell culture plates. We then induced the knockdown by treating the cells with doxycycline (200 ng/ml) and measured the cell viability after 24, 48, and 72 hours using the WST-8 assay. The effect of shRNA-mediated gene knockdown on cell viability was calculated by comparing doxycycline-untreated and -treated cells.
DNA damage measurement using flow cytometry
To compare the amount of DNA damage caused by etoposide alone and in combination with other drugs, we measured the levels of phosphorylated H2A.X in HL-60 cells using flow cytometry. We stained the fixed HL-60 cells using the H2A.X phosphorylation assay kit (Merck, Germany) according to manufacturer’s instructions. In short, 5 × 10⁵ HL-60 cells were seeded per well in a 6-well plate and incubated overnight. Cells were treated for 24 hours with IC25 concentration of etoposide alone and in combination with other drugs. Next, cells were harvested and washed with PBS followed by fixation. Cells were then stained with either FITC-conjugated anti-phospho-Histone H2A.X (Ser139) or with the negative control mouse IgG-FITC conjugate for 20 minutes on ice. The amount of H2A.X was then measured using BD Accuri flow cytometer. The data was then analyzed using FlowJo software (v10).
TCGA survival analysis
We retrieved the raw gene expression counts for 151 AML patients from The Cancer Genome Atlas (TCGA) through the Broad GDAC Firehose, along with the clinical data, using the R package RTCGAToolbox (v2.8.0) [50]. We then performed univariate survival analysis comparing the groups with high expression (above median) and low expression (below median) of selected drivers. We generated Kaplan-Meier plots with p-values calculated using Log-rank test. The comparison between gene expression in AML patients, from TCGA, and normal blood samples, from The Genotype-Tissue Expression (GTEx) [51], was performed using Gene Expression Profiling Interactive Analysis (GEPIA) web server [52].
Statistical analysis
Unless otherwise specified, the experiments reflect 3 biological replicates. Data was analyzed using R language packages and GraphPad Prism software (v7). Graphs were plotted as mean ± SD. The etoposide IC50 concentrations were calculated using GraphPad Prism software by fitting the dose response curve by non-linear regression. Shapiro-Wilk test was performed to determine normal distribution for parametric tests. Two-way ANOVA with Benjamini and Hochberg FDR correction was performed to identify inhibitors with significant cytotoxicity [53]. Multiple t-tests with Benjamini and Hochberg FDR correction were performed to identify significant gene expression change between resistant and sensitive AML cell lines. One-way ANOVA with Dunnett’s multiple comparisons test was performed to identify significant γH2AX formation and cell death induction with drug-combinations in comparison to etoposide alone. Two-way ANOVA with Dunnett's multiple comparisons test was performed to identify statistically significant cytotoxicity after shRNA-mediated gene knockdown in comparison to cells treated with scrambled shRNA.
Availability of data and material
The RNA sequencing data included in this work have been deposited in NCBI’s Gene Expression Omnibus (GEO) database with the accession number GSE126895 (https://www.ncbi.nlm.nih.gov/geo/) [40].
Abbreviations
AML: acute myeloid leukemia; CI: combination index; CMap: connectivity map; DAVID: database for annotation, visualization and integrated discovery; DMSO: dimethyl sulfoxide; FDR: false discovery rate; FITC: fluorescein isothiocyanate; GEPIA: gene expression profiling interactive analysis; GTEx: The Genotype-Tissue Expression; PAch: project achilles; PBS: phosphate-buffered saline; PI: propidium iodide; shRNA: short hairpin RNA; TCGA: The Cancer Genome Atlas; TOP2: topoisomerase II; WGCNA: weighted gene co-expression network analysis.
ACKNOWLEDGMENTS
We thank Prof. Bernd Kaina from the Department of Toxicology and Prof. Huige Li from the Department of Pharmacology, University Medical Center, Mainz for insightful discussions, Genomics Core Facility at the Institute of Molecular Biology, Mainz for preparing libraries and RNA sequencing, Dr. Federico Marini and Mohit Navandar for discussion regarding RNA sequencing analysis. We greatly acknowledge the Mogon supercomputer facility at the Johannes Gutenberg University Mainz (https://hpc.uni-mainz.de) for granting the computing time.
CONFLICTS OF INTEREST
The authors declare no conflicts of interest.
FUNDING
This work was supported by Naturwissenschaftlich-medizinisches Forschungszentrum (NMFZ, University Medical Center, Mainz, Germany) grant (to T. Kindler, M. A. Andrade-Navarro, and L. Wojnowski), by the International PhD Programme Mainz (to P. More and V. Shah), and by Monika Kutzner Stiftung and Brigitte & Konstanze Stiftung grants (to P. More). Data is partly included in the doctoral thesis of P. More.
References
1. Nitiss JL. Targeting DNA topoisomerase II in cancer chemotherapy. Nat Rev Cancer. 2009; 9:338–350. https://doi.org/10.1038/nrc2607. [PubMed].
2. Pommier Y, Leo E, Zhang H, Marchand C. DNA topoisomerases and their poisoning by anticancer and antibacterial drugs. Chem Biol. 2010; 17:421–433. https://doi.org/10.1016/j.chembiol.2010.04.012. [PubMed].
3. Pendleton M, Lindsey RH Jr, Felix CA, Grimwade D, Osheroff N. Topoisomerase II and leukemia. Ann N Y Acad Sci. 2014; 1310:98–110. https://doi.org/10.1111/nyas.12358. [PubMed].
4. McGowan JV, Chung R, Maulik A, Piotrowska I, Walker JM, Yellon DM. Anthracycline Chemotherapy and Cardiotoxicity. Cardiovasc Drugs Ther. 2017; 31:63–75. https://doi.org/10.1007/s10557-016-6711-0. [PubMed].
5. Stein EM, DiNardo CD, Pollyea DA, Fathi AT, Roboz GJ, Altman JK, Stone RM, DeAngelo DJ, Levine RL, Flinn IW, Kantarjian HM, Collins R, Patel MR, et al. Enasidenib in mutant IDH2 relapsed or refractory acute myeloid leukemia. Blood. 2017; 130:722–731. https://doi.org/10.1182/blood-2017-04-779405. [PubMed].
6. Stone RM, Mandrekar SJ, Sanford BL, Laumann K, Geyer S, Bloomfield CD, Thiede C, Prior TW, Dohner K, Marcucci G, Lo-Coco F, Klisovic RB, Wei A, et al. Midostaurin plus Chemotherapy for Acute Myeloid Leukemia with a FLT3 Mutation. N Engl J Med. 2017; 377:454–464. https://doi.org/10.1056/NEJMoa1614359. [PubMed].
7. Schilsky RL, Schnipper LE. Hans Christian Andersen and the Value of New Cancer Treatments. J Natl Cancer Inst. 2018; 110:441–442. https://doi.org/10.1093/jnci/djx261. [PubMed].
8. Jeong E, Brady OA, Martina JA, Pirooznia M, Tunc I, Puertollano R. The transcription factors TFE3 and TFEB amplify p53 dependent transcriptional programs in response to DNA damage. eLife. 2018; 7:e40856. https://doi.org/10.7554/eLife.40856. [PubMed].
9. Troester MA, Hoadley KA, Parker JS, Perou CM. Prediction of toxicant-specific gene expression signatures after chemotherapeutic treatment of breast cell lines. Environ Health Perspect. 2004; 112:1607–1613. https://doi.org/10.1289/txg.7204. [PubMed].
10. Thorn CF, Oshiro C, Marsh S, Hernandez-Boussard T, McLeod H, Klein TE, Altman RB. Doxorubicin pathways: pharmacodynamics and adverse effects. Pharmacogenet Genomics. 2011; 21:440–446. https://doi.org/10.1097/FPC.0b013e32833ffb56. [PubMed].
11. Dombret H, Gardin C. An update of current treatments for adult acute myeloid leukemia. Blood. 2016; 127:53–61. https://doi.org/10.1182/blood-2015-08-604520. [PubMed].
12. Langfelder P, Horvath S. WGCNA: an R package for weighted correlation network analysis. BMC Bioinformatics. 2008; 9:559. https://doi.org/10.1186/1471-2105-9-559. [PubMed].
13. Li J, Zhou D, Qiu W, Shi Y, Yang JJ, Chen S, Wang Q, Pan H. Application of Weighted Gene Co-expression Network Analysis for Data from Paired Design. Sci Rep. 2018; 8:622. https://doi.org/10.1038/s41598-017-18705-z. [PubMed].
14. Tsherniak A, Vazquez F, Montgomery PG, Weir BA, Kryukov G, Cowley GS, Gill S, Harrington WF, Pantel S, Krill-Burger JM, Meyers RM, Ali L, Goodale A, et al. Defining a Cancer Dependency Map. Cell. 2017; 170:564–76 e16. https://doi.org/10.1016/j.cell.2017.06.010. [PubMed].
15. Zoppoli G, Regairaz M, Leo E, Reinhold WC, Varma S, Ballestrero A, Doroshow JH, Pommier Y. Putative DNA/RNA helicase Schlafen-11 (SLFN11) sensitizes cancer cells to DNA-damaging agents. Proc Natl Acad Sci USA. 2012; 109:15030–15035. https://doi.org/10.1073/pnas.1205943109. [PubMed].
16. Rees MG, Seashore-Ludlow B, Cheah JH, Adams DJ, Price EV, Gill S, Javaid S, Coletti ME, Jones VL, Bodycombe NE, Soule CK, Alexander B, Li A, et al. Correlating chemical sensitivity and basal gene expression reveals mechanism of action. Nat Chem Biol. 2016; 12:109–116. https://doi.org/10.1038/nchembio.1986. [PubMed].
17. Lee SI, Celik S, Logsdon BA, Lundberg SM, Martins TJ, Oehler VG, Estey EH, Miller CP, Chien S, Dai J, Saxena A, Blau CA, Becker PS. A machine learning approach to integrate big data for precision medicine in acute myeloid leukemia. Nat Commun. 2018; 9:42. https://doi.org/10.1038/s41467-017-02465-5. [PubMed].
18. Uhlen M, Bjorling E, Agaton C, Szigyarto CA, Amini B, Andersen E, Andersson AC, Angelidou P, Asplund A, Asplund C, Berglund L, Bergstrom K, Brumer H, et al. A human protein atlas for normal and cancer tissues based on antibody proteomics. Mol Cell Proteomics. 2005; 4:1920–1932. https://doi.org/10.1074/mcp.M500279-MCP200. [PubMed].
19. Smart DJ, Halicka HD, Schmuck G, Traganos F, Darzynkiewicz Z, Williams GM. Assessment of DNA double-strand breaks and gammaH2AX induced by the topoisomerase II poisons etoposide and mitoxantrone. Mutat Res. 2008; 641:43–47. https://doi.org/10.1016/j.mrfmmm.2008.03.005. [PubMed].
20. Liu X, Yang J, Zhang Y, Fang Y, Wang F, Wang J, Zheng X, Yang J. A systematic study on drug-response associated genes using baseline gene expressions of the Cancer Cell Line Encyclopedia. Sci Rep. 2016; 6:22811. https://doi.org/10.1038/srep22811. [PubMed].
21. Reinhold WC, Varma S, Rajapakse VN, Luna A, Sousa FG, Kohn KW, Pommier YG. Using drug response data to identify molecular effectors, and molecular “omic” data to identify candidate drugs in cancer. Hum Genet. 2015; 134:3–11. https://doi.org/10.1007/s00439-014-1482-9. [PubMed].
22. Sun Y, Zhang W, Chen Y, Ma Q, Wei J, Liu Q. Identifying anti-cancer drug response related genes using an integrative analysis of transcriptomic and genomic variations with cell line-based drug perturbations. Oncotarget. 2016; 7:9404–9419. https://doi.org/10.18632/oncotarget.7012. [PubMed].
23. Yadav B, Gopalacharyulu P, Pemovska T, Khan SA, Szwajda A, Tang J, Wennerberg K, Aittokallio T. From drug response profiling to target addiction scoring in cancer cell models. Dis Model Mech. 2015; 8:1255–1264. https://doi.org/10.1242/dmm.021105. [PubMed].
24. Huang CT, Hsieh CH, Oyang YJ, Huang HC, Juan HF. A Large-Scale Gene Expression Intensity-Based Similarity Metric for Drug Repositioning. iScience. 2018; 7:40–52. https://doi.org/10.1016/j.isci.2018.08.017. [PubMed].
25. Woo JH, Shimoni Y, Yang WS, Subramaniam P, Iyer A, Nicoletti P, Rodríguez Martínez M, López G, Mattioli M, Realubit R, Karan C, Stockwell BR, Bansal M, Califano A. Elucidating Compound Mechanism of Action by Network Perturbation Analysis. Cell. 2015; 162:441–51. https://doi.org/10.1016/j.cell.2015.05.056. [PubMed].
26. Huelsenbeck SC, Schorr A, Roos WP, Huelsenbeck J, Henninger C, Kaina B, Fritz G. Rac1 protein signaling is required for DNA damage response stimulated by topoisomerase II poisons. J Biol Chem. 2012; 287:38590–38599. https://doi.org/10.1074/jbc.M112.377903. [PubMed].
27. Thol F, Schlenk RF, Heuser M, Ganser A. How I treat refractory and early relapsed acute myeloid leukemia. Blood. 2015; 126:319–327. https://doi.org/10.1182/blood-2014-10-551911. [PubMed].
28. Ramos NR, Mo CC, Karp JE, Hourigan CS. Current Approaches in the Treatment of Relapsed and Refractory Acute Myeloid Leukemia. J Clin Med. 2015; 4:665–695. https://doi.org/10.3390/jcm4040665. [PubMed].
29. Xu Q, Thompson JE, Carroll M. mTOR regulates cell survival after etoposide treatment in primary AML cells. Blood. 2005; 106:4261–4268. https://doi.org/10.1182/blood-2004-11-4468. [PubMed].
30. Montecucco A, Zanetta F, Biamonti G. Molecular mechanisms of etoposide. EXCLI J. 2015; 14:95–108. [PubMed].
31. Scuto A, Kirschbaum M, Buettner R, Kujawski M, Cermak JM, Atadja P, Jove R. SIRT1 activation enhances HDAC inhibition-mediated upregulation of GADD45G by repressing the binding of NF-kappaB/STAT3 complex to its promoter in malignant lymphoid cells. Cell Death Dis. 2013; 4:e635. https://doi.org/10.1038/cddis.2013.159. [PubMed].
32. Kobayashi Y, Yamauchi T, Kiyoi H, Sakura T, Hata T, Ando K, Watabe A, Harada A, Taube T, Miyazaki Y, Naoe T. Phase I trial of volasertib, a Polo-like kinase inhibitor, in Japanese patients with acute myeloid leukemia. Cancer Sci. 2015; 106:1590–1595. https://doi.org/10.1111/cas.12814. [PubMed].
33. Ellis PM, Shepherd FA, Laurie SA, Goss GD, Olivo M, Powers J, Seymour L, Bradbury PA. NCIC CTG IND.190 phase I trial of dalotuzumab (MK-0646) in combination with cisplatin and etoposide in extensive-stage small-cell lung cancer. J Thorac Oncol. 2014; 9:410–413. https://doi.org/10.1097/JTO.0000000000000058. [PubMed].
34. Ezoe S. Secondary leukemia associated with the anti-cancer agent, etoposide, a topoisomerase II inhibitor. Int J Environ Res Public Health. 2012; 9:2444–2453. https://doi.org/10.3390/ijerph9072444. [PubMed].
35. Kollmannsberger C, Beyer J, Droz JP, Harstrick A, Hartmann JT, Biron P, Flechon A, Schoffski P, Kuczyk M, Schmoll HJ, Kanz L, Bokemeyer C. Secondary leukemia following high cumulative doses of etoposide in patients treated for advanced germ cell tumors. J Clin Oncol. 1998; 16:3386–3391. https://doi.org/10.1200/JCO.1998.16.10.3386. [PubMed].
36. Dobin A, Davis CA, Schlesinger F, Drenkow J, Zaleski C, Jha S, Batut P, Chaisson M, Gingeras TR. STAR: ultrafast universal RNA-seq aligner. Bioinformatics. 2013; 29:15–21. https://doi.org/10.1093/bioinformatics/bts635. [PubMed].
37. Tarazona S, Furio-Tari P, Turra D, Pietro AD, Nueda MJ, Ferrer A, Conesa A. Data quality aware analysis of differential expression in RNA-seq with NOISeq R/Bioc package. Nucleic Acids Res. 2015; 43:e140. https://doi.org/10.1093/nar/gkv711. [PubMed].
38. R Core Team. R: A language and environment for statistical computing. R Foundation for Statistical Computing. Vienna, Austria. 2014. https://www.r-project.org/.
39. Robinson MD, McCarthy DJ, Smyth GK. edgeR: a Bioconductor package for differential expression analysis of digital gene expression data. Bioinformatics. 2010; 26:139–140. https://doi.org/10.1093/bioinformatics/btp616. [PubMed].
40. Edgar R, Domrachev M, Lash AE. Gene Expression Omnibus: NCBI gene expression and hybridization array data repository. Nucleic Acids Res. 2002; 30:207–210. https://doi.org/10.1093/nar/30.1.207. [PubMed].
41. Robinson MD, Oshlack A. A scaling normalization method for differential expression analysis of RNA-seq data. Genome Biol. 2010; 11:R25. https://doi.org/10.1186/gb-2010-11-3-r25. [PubMed].
42. Cowley GS, Weir BA, Vazquez F, Tamayo P, Scott JA, Rusin S, East-Seletsky A, Ali LD, Gerath WF, Pantel SE, Lizotte PH, Jiang G, Hsiao J, et al. Parallel genome-scale loss of function screens in 216 cancer cell lines for the identification of context-specific genetic dependencies. Sci Data. 2014; 1:140035. https://doi.org/10.1038/sdata.2014.35. [PubMed].
43. Subramanian A, Narayan R, Corsello SM, Peck DD, Natoli TE, Lu X, Gould J, Davis JF, Tubelli AA, Asiedu JK, Lahr DL, Hirschman JE, Liu Z, et al. A Next Generation Connectivity Map: L1000 Platform and the First 1,000,000 Profiles. Cell. 2017; 171:1437–52 e17. https://doi.org/10.1016/j.cell.2017.10.049. [PubMed].
44. Ben-Ari Fuchs S, Lieder I, Stelzer G, Mazor Y, Buzhor E, Kaplan S, Bogoch Y, Plaschkes I, Shitrit A, Rappaport N, Kohn A, Edgar R, Shenhav L, et al. GeneAnalytics: An Integrative Gene Set Analysis Tool for Next Generation Sequencing, RNAseq and Microarray Data. OMICS. 2016; 20:139–151. https://doi.org/10.1089/omi.2015.0168. [PubMed].
45. Alexander SP, Fabbro D, Kelly E, Marrion NV, Peters JA, Faccenda E, Harding SD, Pawson AJ, Sharman JL, Southan C, Davies JA; CGTP Collaborators. THE CONCISE GUIDE TO PHARMACOLOGY 2017/18: Enzymes. Br J Pharmacol. 2017; 174:S272–S359. https://doi.org/10.1111/bph.13877. [PubMed].
46. Foucquier J, Guedj M. Analysis of drug combinations: current methodological landscape. Pharmacol Res Perspect. 2015; 3:e00149. https://doi.org/10.1002/prp2.149. [PubMed].
47. Iskit S, Lieftink C, Halonen P, Shahrabi A, Possik PA, Beijersbergen RL, Peeper DS. Integrated in vivo genetic and pharmacologic screening identifies co-inhibition of EGRF and ROCK as a potential treatment regimen for triple-negative breast cancer. Oncotarget. 2016; 7:42859–42872. https://doi.org/10.18632/oncotarget.10230. [PubMed].
48. Lyu H, Yang XH, Edgerton SM, Thor AD, Wu X, He Z, Liu B. The erbB3- and IGF-1 receptor-initiated signaling pathways exhibit distinct effects on lapatinib sensitivity against trastuzumab-resistant breast cancer cells. Oncotarget. 2016; 7:2921–2935. https://doi.org/10.18632/oncotarget.6404. [PubMed].
49. Whittaker SR, Theurillat JP, Van Allen E, Wagle N, Hsiao J, Cowley GS, Schadendorf D, Root DE, Garraway LA. A genome-scale RNA interference screen implicates NF1 loss in resistance to RAF inhibition. Cancer Discov. 2013; 3:350–362. https://doi.org/10.1158/2159-8290.CD-12-0470. [PubMed].
50. Samur MK. RTCGAToolbox: a new tool for exporting TCGA Firehose data. PLoS One. 2014; 9:e106397. https://doi.org/10.1371/journal.pone.0106397. [PubMed].
51. Gamazon ER, Segrè AV, van de Bunt M, Wen X, Xi HS, Hormozdiari F, Ongen H, Konkashbaev A, Derks EM, Aguet F, Quan J, Nicolae DL, Eskin E, et al, and GTEx Consortium. Using an atlas of gene regulation across 44 human tissues to inform complex disease- and trait-associated variation. Nat Genet. 2018; 50:956–67. https://doi.org/10.1038/s41588-018-0154-4. [PubMed].
52. Tang Z, Li C, Kang B, Gao G, Li C, Zhang Z. GEPIA: a web server for cancer and normal gene expression profiling and interactive analyses. Nucleic Acids Res. 2017; 45:W98–W102. https://doi.org/10.1093/nar/gkx247. [PubMed].
53. Benjamini Y, Hochberg Y. Controlling the False Discovery Rate - a Practical and Powerful Approach to Multiple Testing. J R Stat Soc Series B Stat Methodol. 1995; 57:289–300.