
Introduction
Chronic lymphocytic leukemia (CLL), one of the most common mature B cell neoplasm subtypes, is characterized by the monoclonal expansion of malignant B cells. CLL is a clinically and biologically heterogeneous disease. In fact, while some patients exhibit slow progression of the disease, others experience a more aggressive form and require adequate therapy to be initiated soon after diagnosis. No screening tests are currently recommended for this disease, and CLL is often diagnosed when undergoing blood tests for other reasons. The two staging systems currently used, Rai and Binet, remain good indicators of survival, but do not take into account other biological factors implied in the disease course, and consequently do not allow early recognition of the aggressive forms of the disease [1]. To date, several recurrent genomic aberrations, such as del(17p), del(11q), trisomy 12, and del(13q), and genetic alterations, such as TP53, BIRC3, NOTCH1, SF3B1, have been proposed as prognostic biomarkers of CLL cases [2], and their characterization is recommended before initiating therapeutic treatment. However, since genetic aberrations might not be present at diagnosis, and they might occur later during the disease course, their characterization is not always sufficient to predict the clinical outcome in the initial stage. The mutational status of IGHV gene is one of the most commonly used prognostic biomarkers but, alone, it is inadequate to explain the clinical course heterogeneity of this disease. Therefore, diagnostic biomarkers and prognostic biomarkers characterizing different clinical courses in the early stages of the disease are urgently needed.
Aberrant methylation patterns, which represent a molecular hallmark of cancer, are early events in tumor development, and they might represent early diagnostic biomarkers. It has been shown that methylome alterations would predict the diagnosis several years prior to the clinical appearance of the disease, thus proving to be potential markers for carrying out large-scale screening tests [3, 4]. Besides, aberrant methylation changes might represent a specific signature of different types of leukemia, depending on the originating cell [5]. Our aim was to identify specific-CLL methylation patterns by conducting a genome-wide methylation analysis, and to evaluate whether methylation aberrations in selected genes are associated with changes in gene expression.
Results
Differential methylation analyses
We conducted a first differential methylation analysis between 18 CLL cases and 6 population controls (Figure 1A), identifying 5001 CpG sites differentially methylated (adjusted p-value <0.05). As expected, the CLL methylome was characterized by a widespread hypomethylation, but by restricting the analysis to the regulatory regions, a switch towards hypermethylation, especially in the CpG islands (CGIs), was evident (Figure 2). Since the genome-wide methylation analysis was conducted on whole blood samples, which are characterized by a high level of cellular heterogeneity, we were not able to detect CpG islands significantly (adjusted p-value <0.05) hypermethylated in CLL samples compared to normal control samples. For this reason, we selected the 100 top-ranked differentially methylated CGIs (Supplementary Table 1).
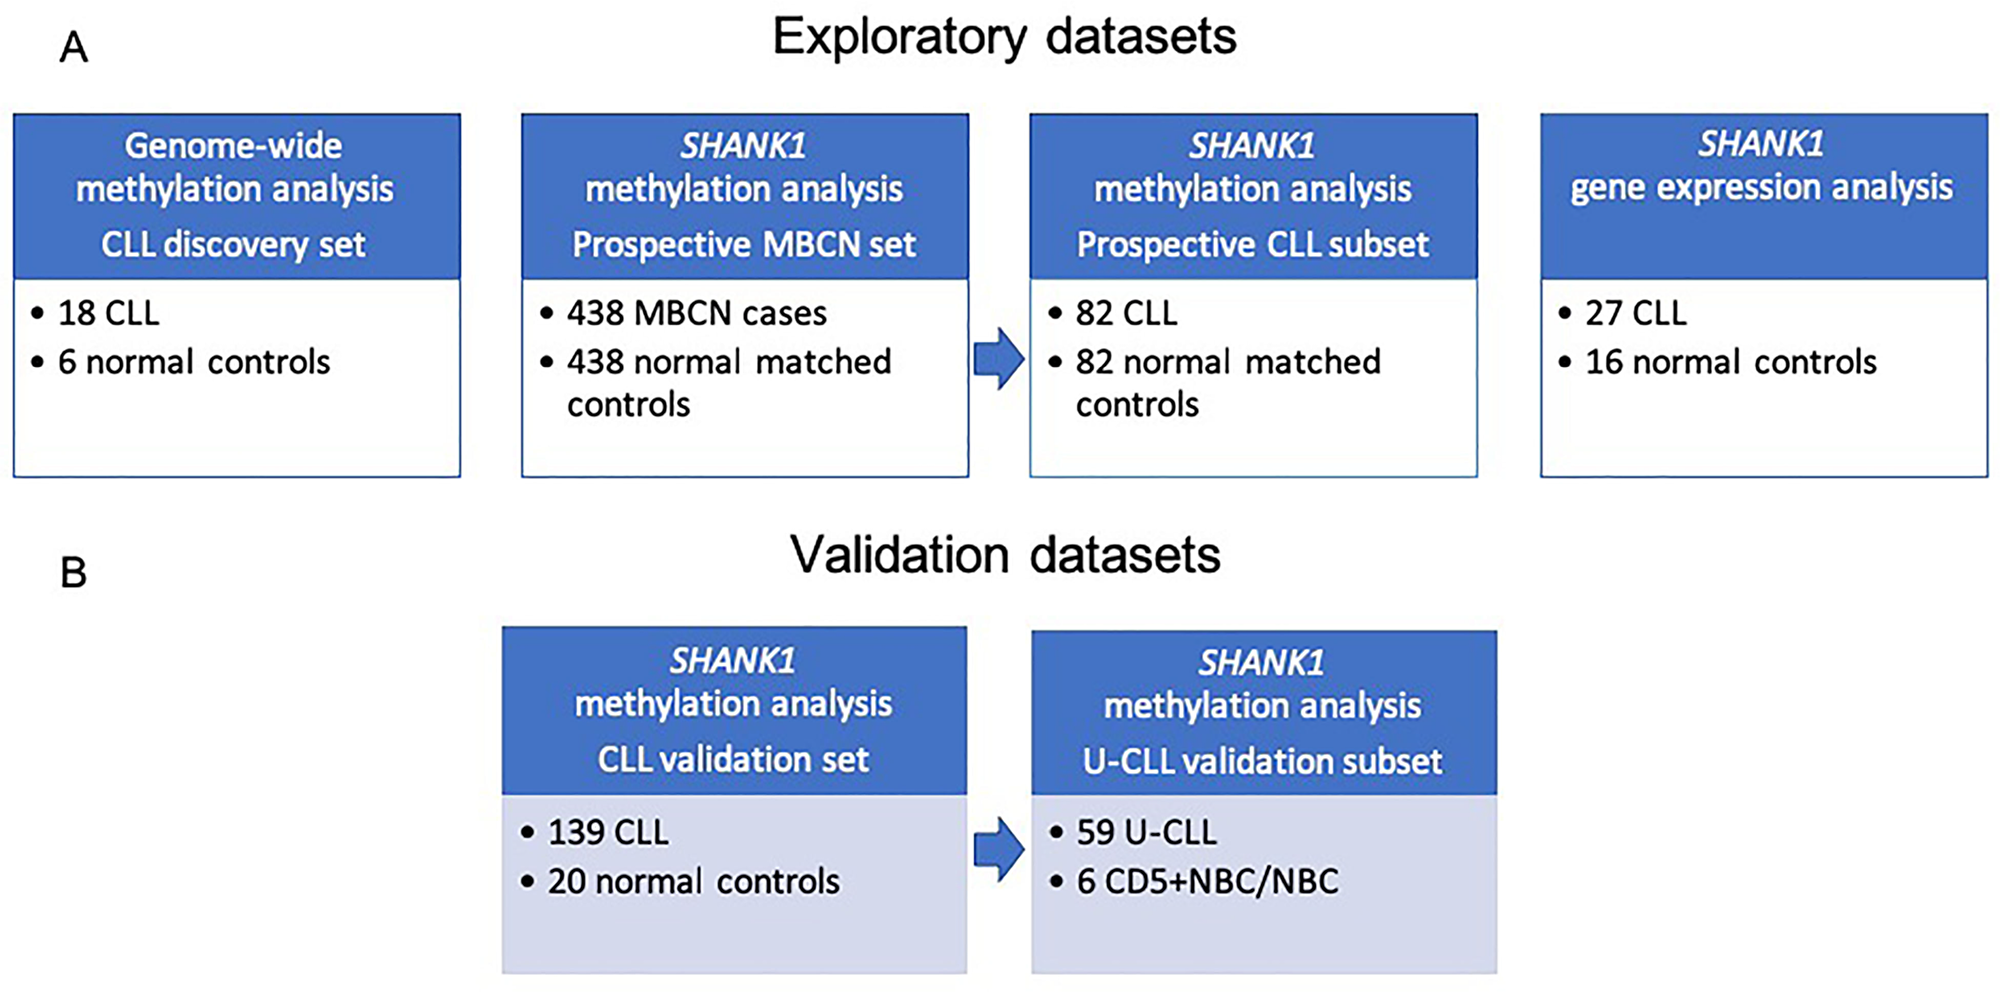
Figure 1: Study workflow including description of sample datasets used in the current study. (A) Discovery datasets: CLL, MBCN and normal samples for methylation and gene expression studies; (B) Validation datasets: CLL and normal samples analyzed to validate our finding. Abbreviations: CLL: chronic lymphocytic leukemia; MBCN: mature B-cell neoplasm; U-CLL: unmutated chronic lymphocytic leukemia.
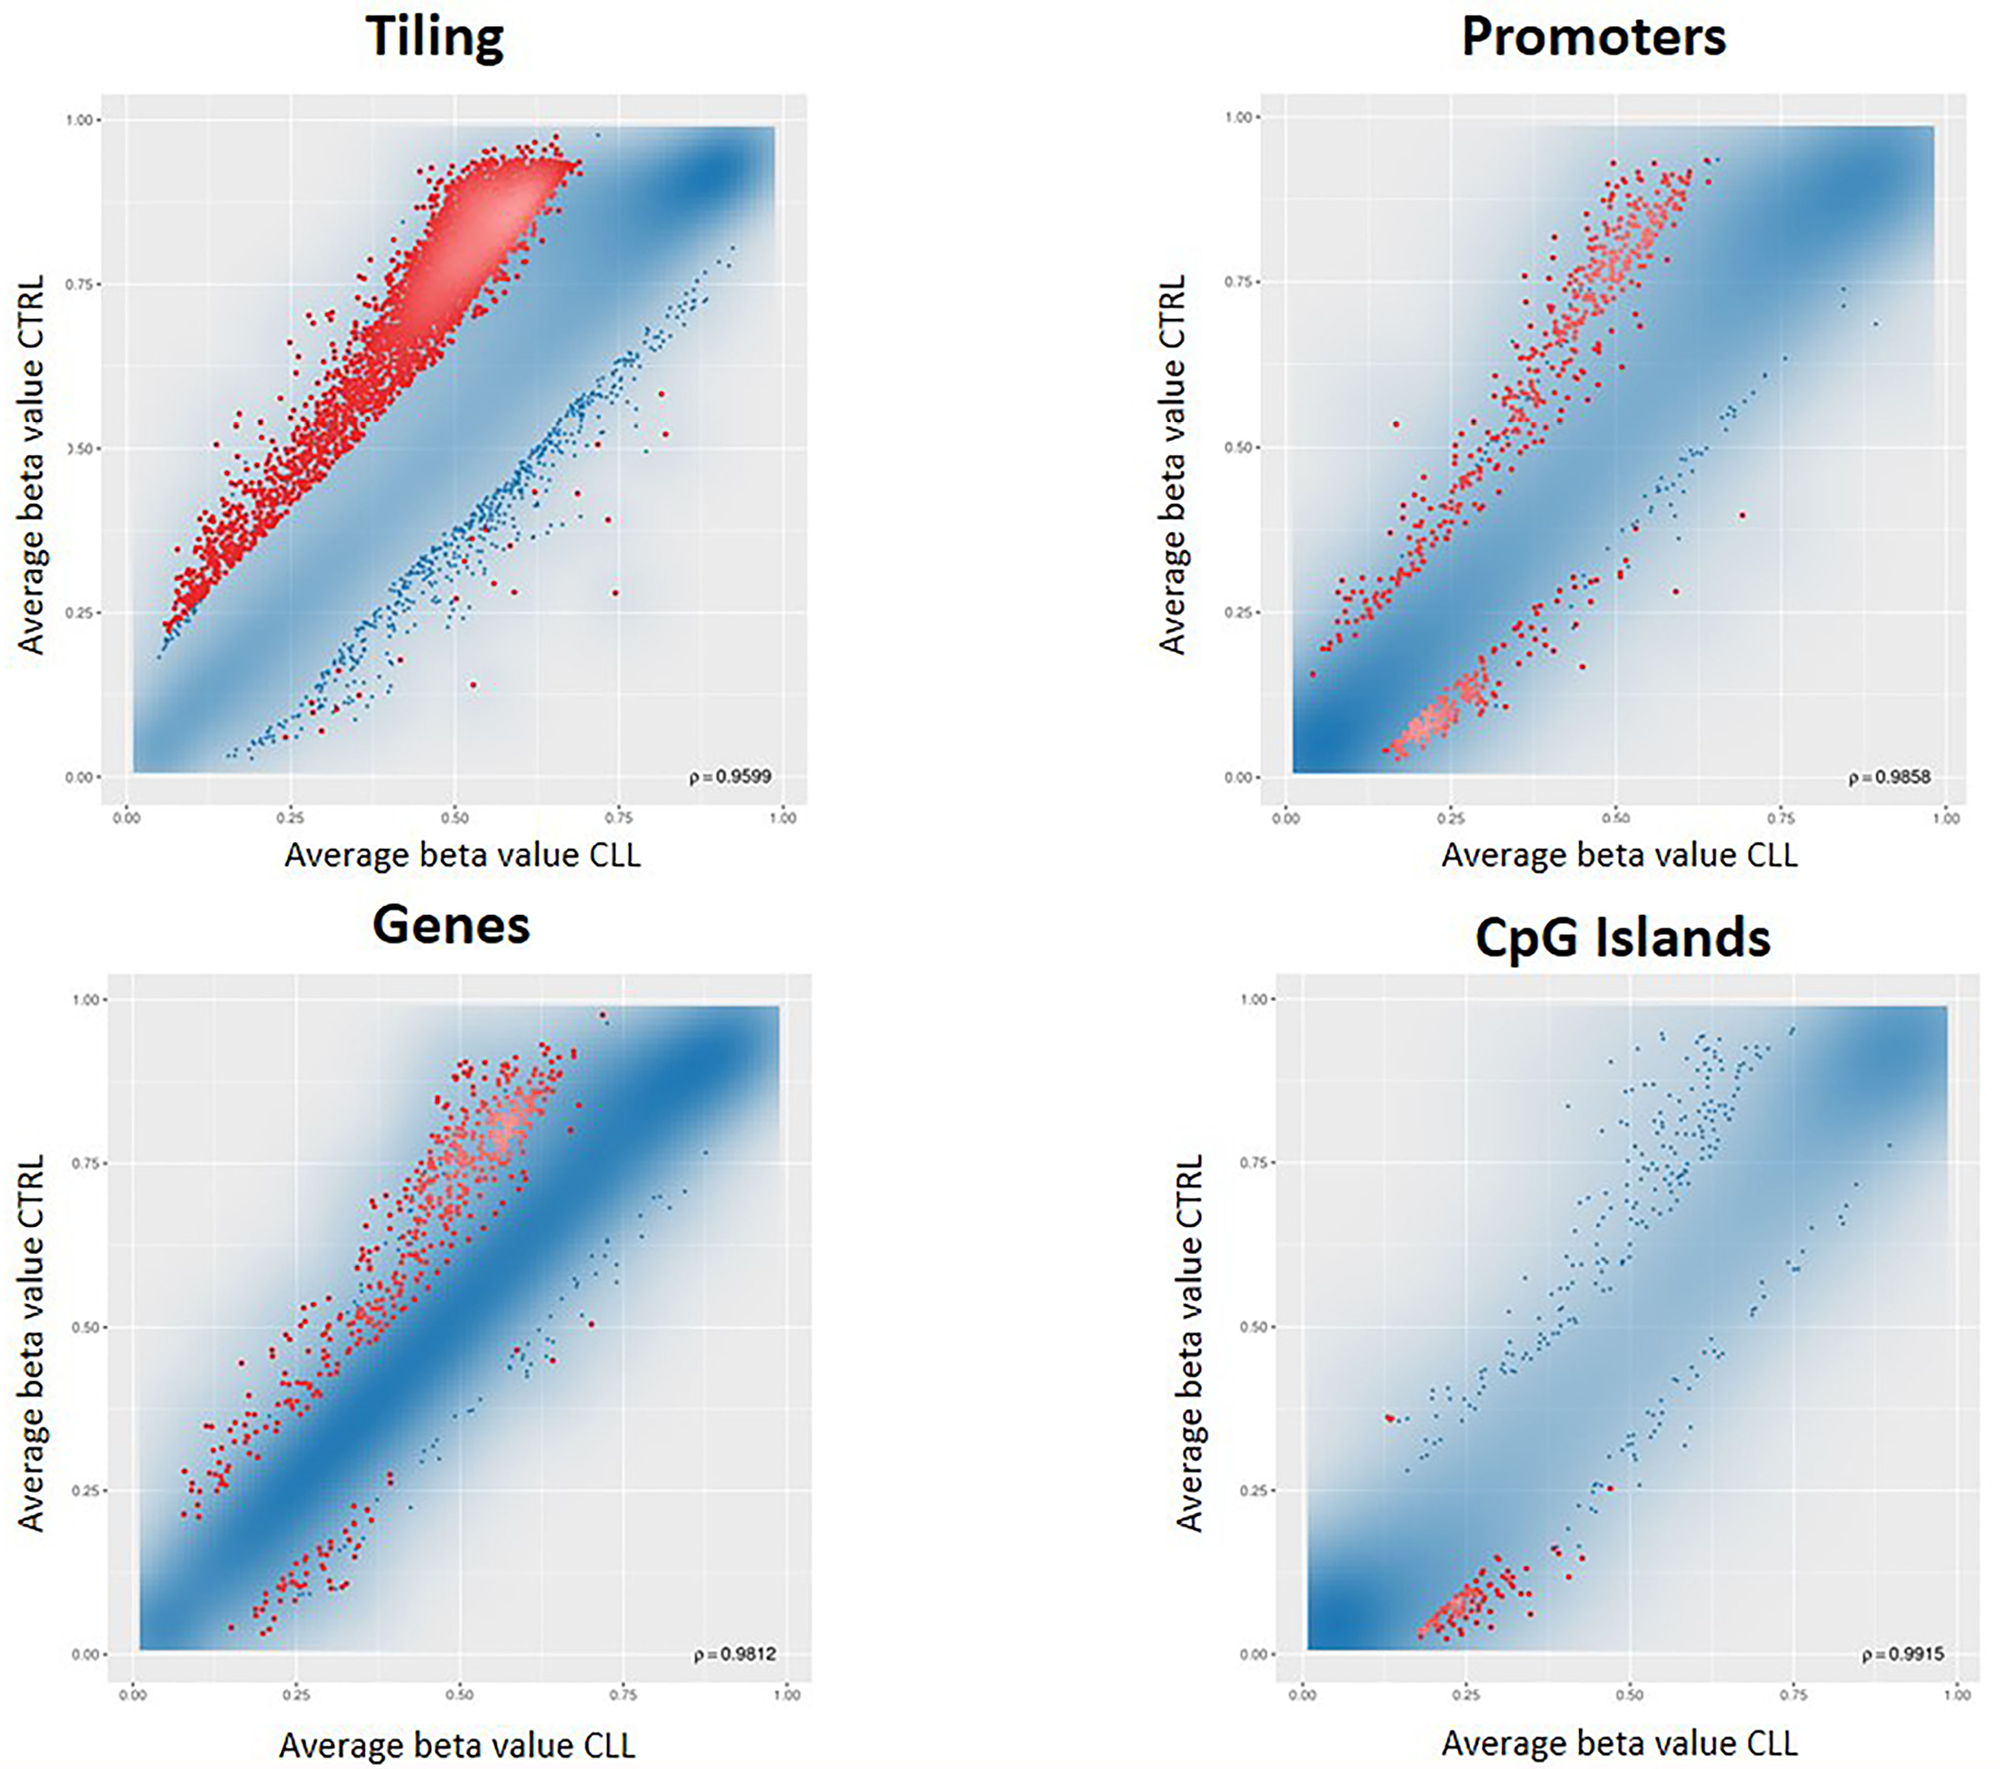
Figure 2: RnBeads differential methylation analysis for tiling, genes, promoters and CpG islands. Each dot represents the average beta value for each CpG locus in the region, resulting from the average of the samples belonging to that group. Red dots indicate CpG loci significantly differentially methylated between the two groups.
As the total number of lymphocytes is much higher in tumor samples than in control samples, it must be taken into account in the differential methylation analysis. For this reason, we repeated the differential methylation analysis using the absolute lymphocyte count data as a covariate in the limma model. This analysis identified 7886 CpG sites differentially methylated (adjusted p-value <0.05) between CLL and control samples. There was no substantial change in the list of the 100-top ranked differentially methylated CGIs (Supplementary Table 1) detected in this second analysis, which indicates that the differences in the DNA methylation pattern we observed between CLL cases and controls were not due to the different number of circulating lymphocytes.
SHANK1 methylation alteration as a potential tumor biomarker
In order to be able to subsequently carry out a functional study, and having little material available, we focused our attention on the most altered CGI, located in the gene body of SHANK1 (chr19:51198143-51198460, referred to hg19 assembly). This CGI was hypermethylated in the CLL samples, and it showed the highest mean differential methylation value (Δβ = 0.29) between CLL and control samples (Table 1 and Supplementary Table 1).
Table 1: SHANK1 differential methylation data in the datasets analyzed
| Groups | Mean Δβ | p-value | adj p-value |
|---|---|---|---|
| 18 CLLs vs 6 normal controls (experimental dataset) | 0.29 | 0.0023 | 0.2641 |
| 139 CLLs vs 20 normal controls (validation dataset) [6] | 0.26 | 8.66e-12 | 2.43e-10 |
| 59 U-CLL vs 6 CD5+NBC/NBC (validation dataset) [8] | 0.38 | FDR<0.05 [8] | |
| 82 CLL/SLL yr before diagnosis vs matched controls (experimental predictive dataset) | 0.047 | 0.00863 | 0.0921 |
| 438 MBCN cases yr before diagnosis vs matched controls (experimental predictive dataset) | 0.03 | 4.97e-07 | 7.47e-05 |
We conducted a correlation analysis between the methylation percentage and the absolute lymphocyte count revealing a significant positive correlation (r = 0.78, p-value = 0.0045) (Figure 3A) between the two variables.
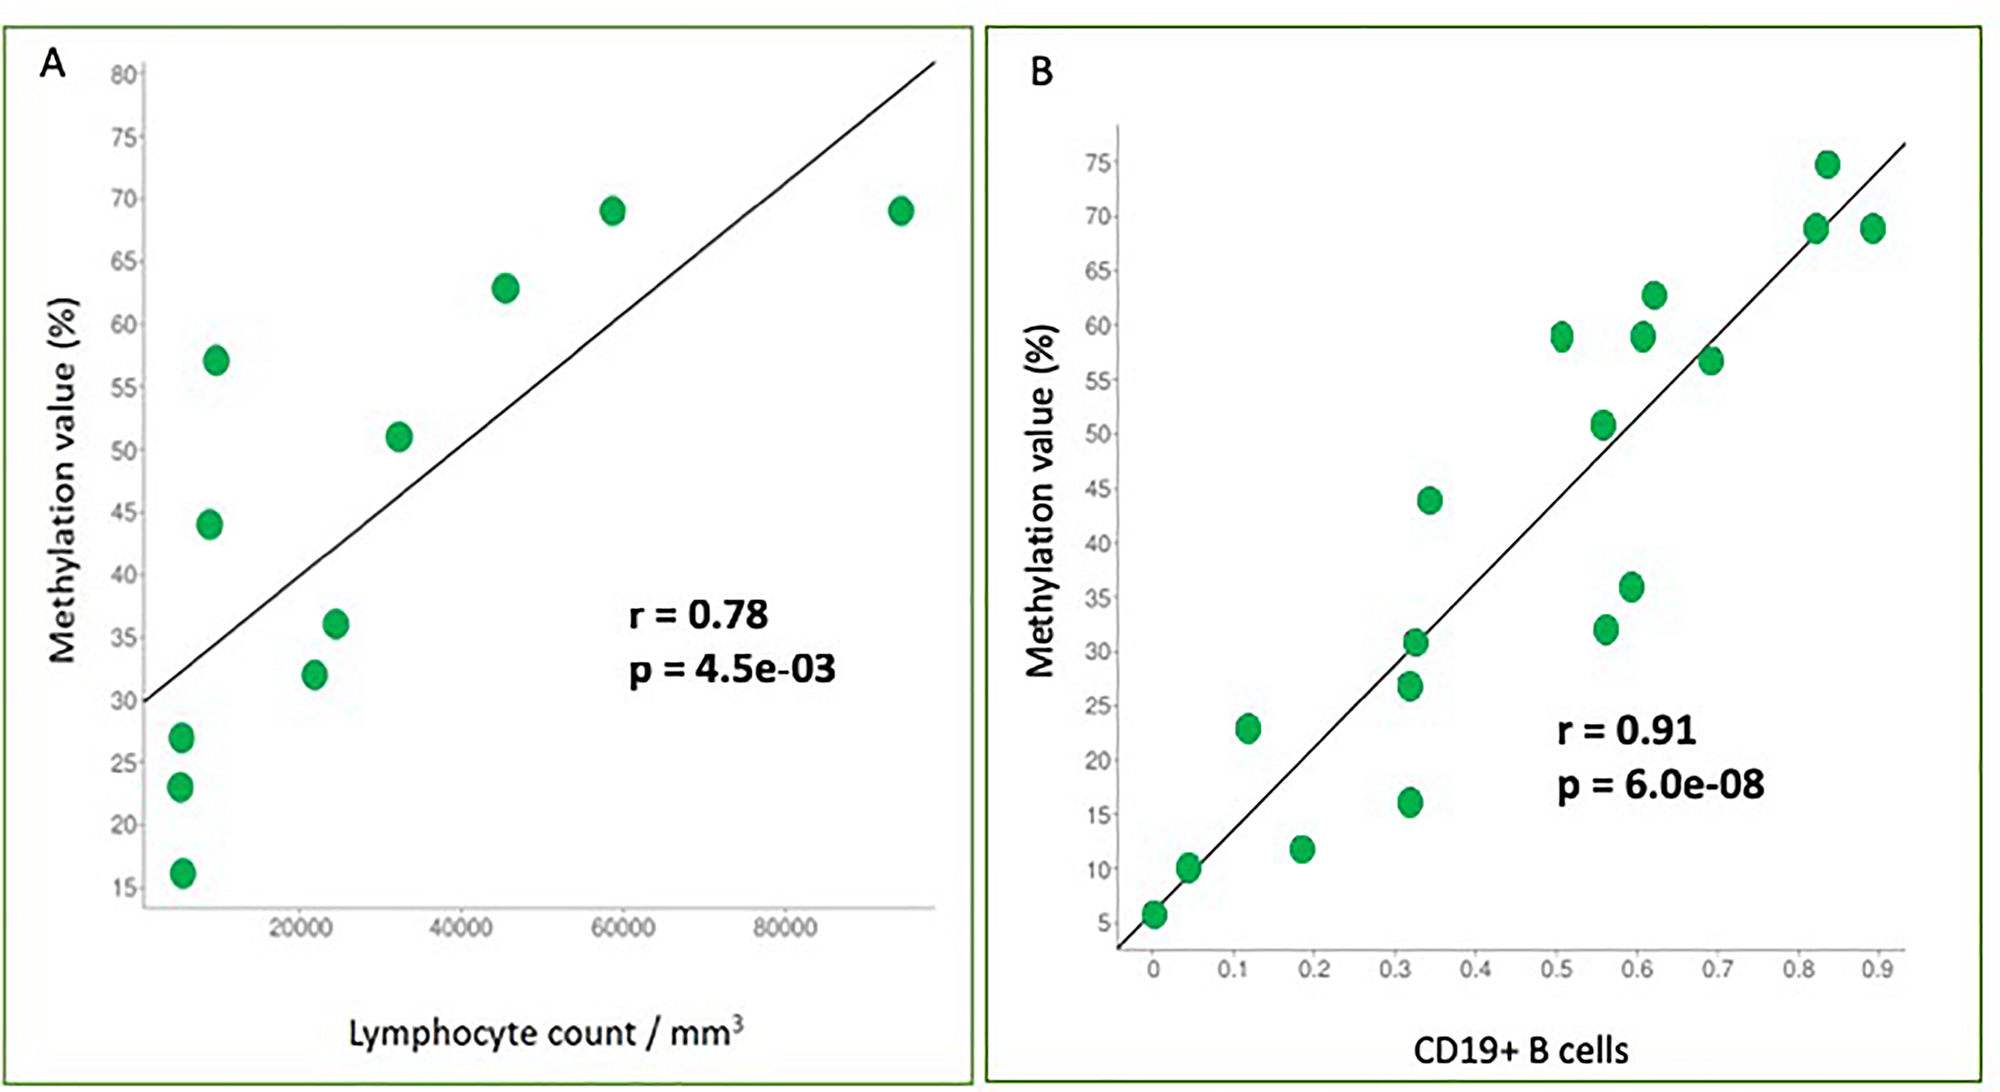
Figure 3: Correlation analyses between two variables. (A) Correlation analysis between methylation percentage and absolute lymphocyte count. SHANK1 methylation values (%) are plotted against absolute lymphocyte count values. Pearson correlation coefficient (r) shows a significant positive correlation (r = 0.78, p-value = 0.0045); (B) Correlation analysis between methylation percentage and CD19+ B-cells. SHANK1 methylation values (%) are plotted against CD19+ cells contribution values. Pearson correlation coefficient (r) shows a significant positive correlation (r = 0.91, p-value = 6,00e-08).
Since this methylation alteration was detected analyzing whole blood samples and a differential cell type content has an effect on DNA methylation profile, we investigated cell type heterogeneity in our samples. The relative contributions of each principal immune components of whole blood (B cells, granulocytes, monocytes, NK cells, and T cells subsets) in each sample were estimated by applying the algorithm of Houseman et al. [6] based on the distinctive methylation profiles of each cell type.
As expected, granulocytes, the most abundant leukocytes in peripheral blood in a healthy condition [7], contributed for most of cell type composition in normal blood control samples (data not shown).
On the other hand, tumor samples with a high lymphocyte count, showed a high CD19+ B-cells contribution and higher SHANK1 methylation values, compared to samples with low CD19+ B-cells contribution (Table 2). Correlation analysis confirmed that there was a strong positive correlation between CD19+ B-cells contribution and SHANK1 methylation values (r = 0.91, p-value = 6,00e-08) (Figure 3B).
Table 2: Comparison between estimated relative leucocyte contributions, lymphocyte count and SHANK1 methylation values in CLL samples
| Sample ID | CD14+ monocytes | CD19+ B cells | CD4+ T cells | CD56+ NK cells | CD8+ T cells | Granulocytes | Lymphocyte count/mm3 | SHANK1 Methylation value (%) |
|---|---|---|---|---|---|---|---|---|
| 304012_002 | 0,104 | 0,609 | -0,010 | 0,001 | 0,000 | 0,245 | NA | 59 |
| 304012_007 | 0,076 | 0,114 | -0,001 | 0,011 | 0,000 | 0,797 | 5050 | 23 |
| 304012_030 | 0,061 | 0,556 | 0,000 | 0,040 | 0,000 | 0,355 | 32380 | 51 |
| 304012_048 | 0,074 | 0,693 | 0,000 | 0,049 | 0,000 | 0,122 | 9580 | 57 |
| 304032_083 | 0,084 | 0,837 | 0,038 | 0,000 | 0,000 | 0,002 | NA | 75 |
| 304012_088 | 0,062 | 0,621 | -0,008 | 0,050 | 0,000 | 0,289 | 45330 | 63 |
| 304012_092 | 0,099 | 0,562 | 0,000 | 0,146 | 0,000 | 0,154 | 21830 | 32 |
| 304032_100 | 0,061 | 0,506 | 0,000 | 0,150 | 0,000 | 0,323 | NA | 59 |
| 304032_104 | 0,019 | 0,323 | 0,002 | 0,323 | 0,000 | 0,313 | NA | 31 |
| 304012_112 | 0,073 | 0,314 | 0,000 | 0,056 | 0,000 | 0,627 | 5270 | 27 |
| 304012_114 | 0,057 | 0,594 | 0,000 | 0,092 | -0,001 | 0,291 | 24360 | 36 |
| 304032_132 | 0,000 | 0,000 | -0,016 | 0,000 | 0,000 | 0,988 | NA | 6 |
| 304032_134 | 0,070 | 0,185 | 0,000 | 0,049 | 0,000 | 0,720 | NA | 12 |
| 304012_188 | 0,089 | 0,318 | 0,000 | 0,104 | 0,000 | 0,484 | 5410 | 16 |
| 304012_193 | 0,047 | 0,890 | -0,028 | 0,000 | -0,006 | 0,015 | 58880 | 69 |
| 304012_196 | 0,090 | 0,342 | 0,000 | 0,099 | 0,000 | 0,549 | 9060 | 44 |
| 304012_198 | 0,065 | 0,042 | 0,096 | 0,157 | 0,000 | 0,672 | NA | 10 |
| 304012_475 | 0,068 | 0,821 | 0,000 | 0,001 | 0,000 | 0,000 | 94100 | 69 |
Individual characteristics such as smoking status, age and BMI can affect DNA methylation and should be used for adjustment in differential methylation analysis. Since our sample size was small, we did not perform an adjustment of SHANK1 methylation values using these data. However, it can be observed that differences in SHANK1 methylation values in cases and between cases and controls are not associated to differences in smoking status, age or BMI (Table 3).
Table 3: Clinical and immunophenotypic characteristics of the samples used for methylome analysis
| Clinical and immunophenotypic characteristics | ||||||||||||
|---|---|---|---|---|---|---|---|---|---|---|---|---|
| CLL patients | Sample ID | Age | Sex | Smoking status | BMI | CD5+ (%) | CD5+/CD19+ (%) | CD23+(%) | CD38+ (%) | IGHV mutationalstatus | Lymphocyte count/mm3 | SHANK1 Methylation value (%) |
| 304012 002 | 67 | M | No Smoker | 19,6 | NA | NA | NA | NA | NA | NA | 59 | |
| 304012 007 | 81 | M | No Smoker | 23,8 | 93.30 | 71.50 | 72.10 | 42 | Positive | 5050 | 23 | |
| 304012 030 | 67 | M | No Smoker | 27,2 | 98.60 | 92 | 92 | 2.6 | Negative | 32380 | 51 | |
| 304012 048 | 64 | F | No Smoker | 26,7 | 94.1 | 78.70 | 75.40 | 15 | Negative | 9580 | 57 | |
| 304032 083 | 75 | M | Smoker | 32,9 | NA | NA | NA | NA | NA | NA | 75 | |
| 304012 088 | 79 | M | No Smoker | 33,8 | 98.2 | 91 | 91.4 | 4.7 | Negative | 45330 | 63 | |
| 304012 092 | 64 | M | No Smoker | 26,9 | 88.7 | 64.8 | 63.7 | 10 | Positive | 21830 | 32 | |
| 304012 112 | 83 | F | No Smoker | NA | 34 | 6 | 70.3 | 14 | Negative | 5270 | 27 | |
| 304012 114 | 73 | M | No Smoker | 25,5 | Negative/ weak | NA | 65 | 16 | Negative | 24360 | 36 | |
| 304012 188 | 43 | F | No Smoker | 21,0 | 97 | 87 | 88 | 9 | Positive | 5410 | 16 | |
| 304012 193 | 52 | M | Smoker | 30,8 | 56 | NA | NA | NA | Negative | 58880 | 69 | |
| 304012 196 | 58 | F | No Smoker | 18,6 | 68 | 54 | 76 | NA | Negative | 9060 | 44 | |
| 304012 198 | 48 | F | No Smoker | 21,9 | NA | NA | NA | NA | NA | NA | 10 | |
| 304012 475* | 60 | M | No Smoker | 23,0 | 97.9 | 94.60 | Partially expressed | Weak | Positive | 94100 | 69 | |
| Controls | 304012 357 | 37 | F | No Smoker | 24,7 | – | – | – | – | – | – | 9 |
| 304012 368 | 68 | M | No Smoker | 30,8 | – | – | – | – | – | – | 10 | |
| 304012 427 | 47 | M | No Smoker | 26,8 | – | – | – | – | – | – | 10 | |
| 304012 429 | 69 | M | No Smoker | 28,1 | – | – | – | – | – | – | 13 | |
| 304012 448 | 67 | F | No Smoker | 21,7 | – | – | – | – | – | – | 16 | |
| 304012 455 | 20 | M | Smoker | 21,7 | – | – | – | – | – | – | 8 | |
To validate and increase the robustness of our data, we analyzed the methylation data for this CGI, obtained by Kulis et al. [8], of 139 CLLs (≥95% neoplastic cells) and 20 non-tumoral samples (normal B-cells from peripheral blood including total B cells and various subtypes of B-cells) (Figure 1B). Methylation data were retrieved from the ICGC Data Portal (https://dcc.icgc.org), DCC Data Release 27, DCC Project Code: CLLE-ES. We detected a Δβ value of 0.26 (p-value = 8.66e-12, adjusted p-value = 2.43e-10), confirming SHANK1 hypermethylation in CLL (Table 1).
In addition, Kulis et al. identified the same CGI as hypermethylated in a subgroup of 59 CLL with a low or absent IGHV mutational load (U-CLLs) compared to 6 naïve B cells (CD5+NBC/NBC) (false discovery rate <0.05) [8] (Figure 1B, Table 1).
To evaluate the potential role of SHANK1-associated CGI as a potential predictive biomarker, we conducted a differential methylation analysis between cases and matched controls in blood collected at baseline entry into the prospective cohort study (Figure 1A), finding a gain of methylation in the SHANK1 CGI (chr19:51198143-51198460) detectable in blood samples collected years before diagnosis of 82 CLL and small lymphocytic lymphoma (SLL) (Δβ = 0.047, p = 0.00863, adjusted p-value = 0,0921) (Table 1). Moreover, by extending the methylation analysis to the larger series of 438 mature B-cell neoplasms (MBCN) cases, including the 82 CLL/SLL, we confirmed significant differential methylation of the same CGI (Δβ = 0.03, p-value < 10-7, adjusted p-value = 7.47e-05) between cases and controls (Table 1). Figure 4 shows the methylation values observed in the extended cohort (Figure 4A) and in the CLL/SLL subgroup (Figure 4B).
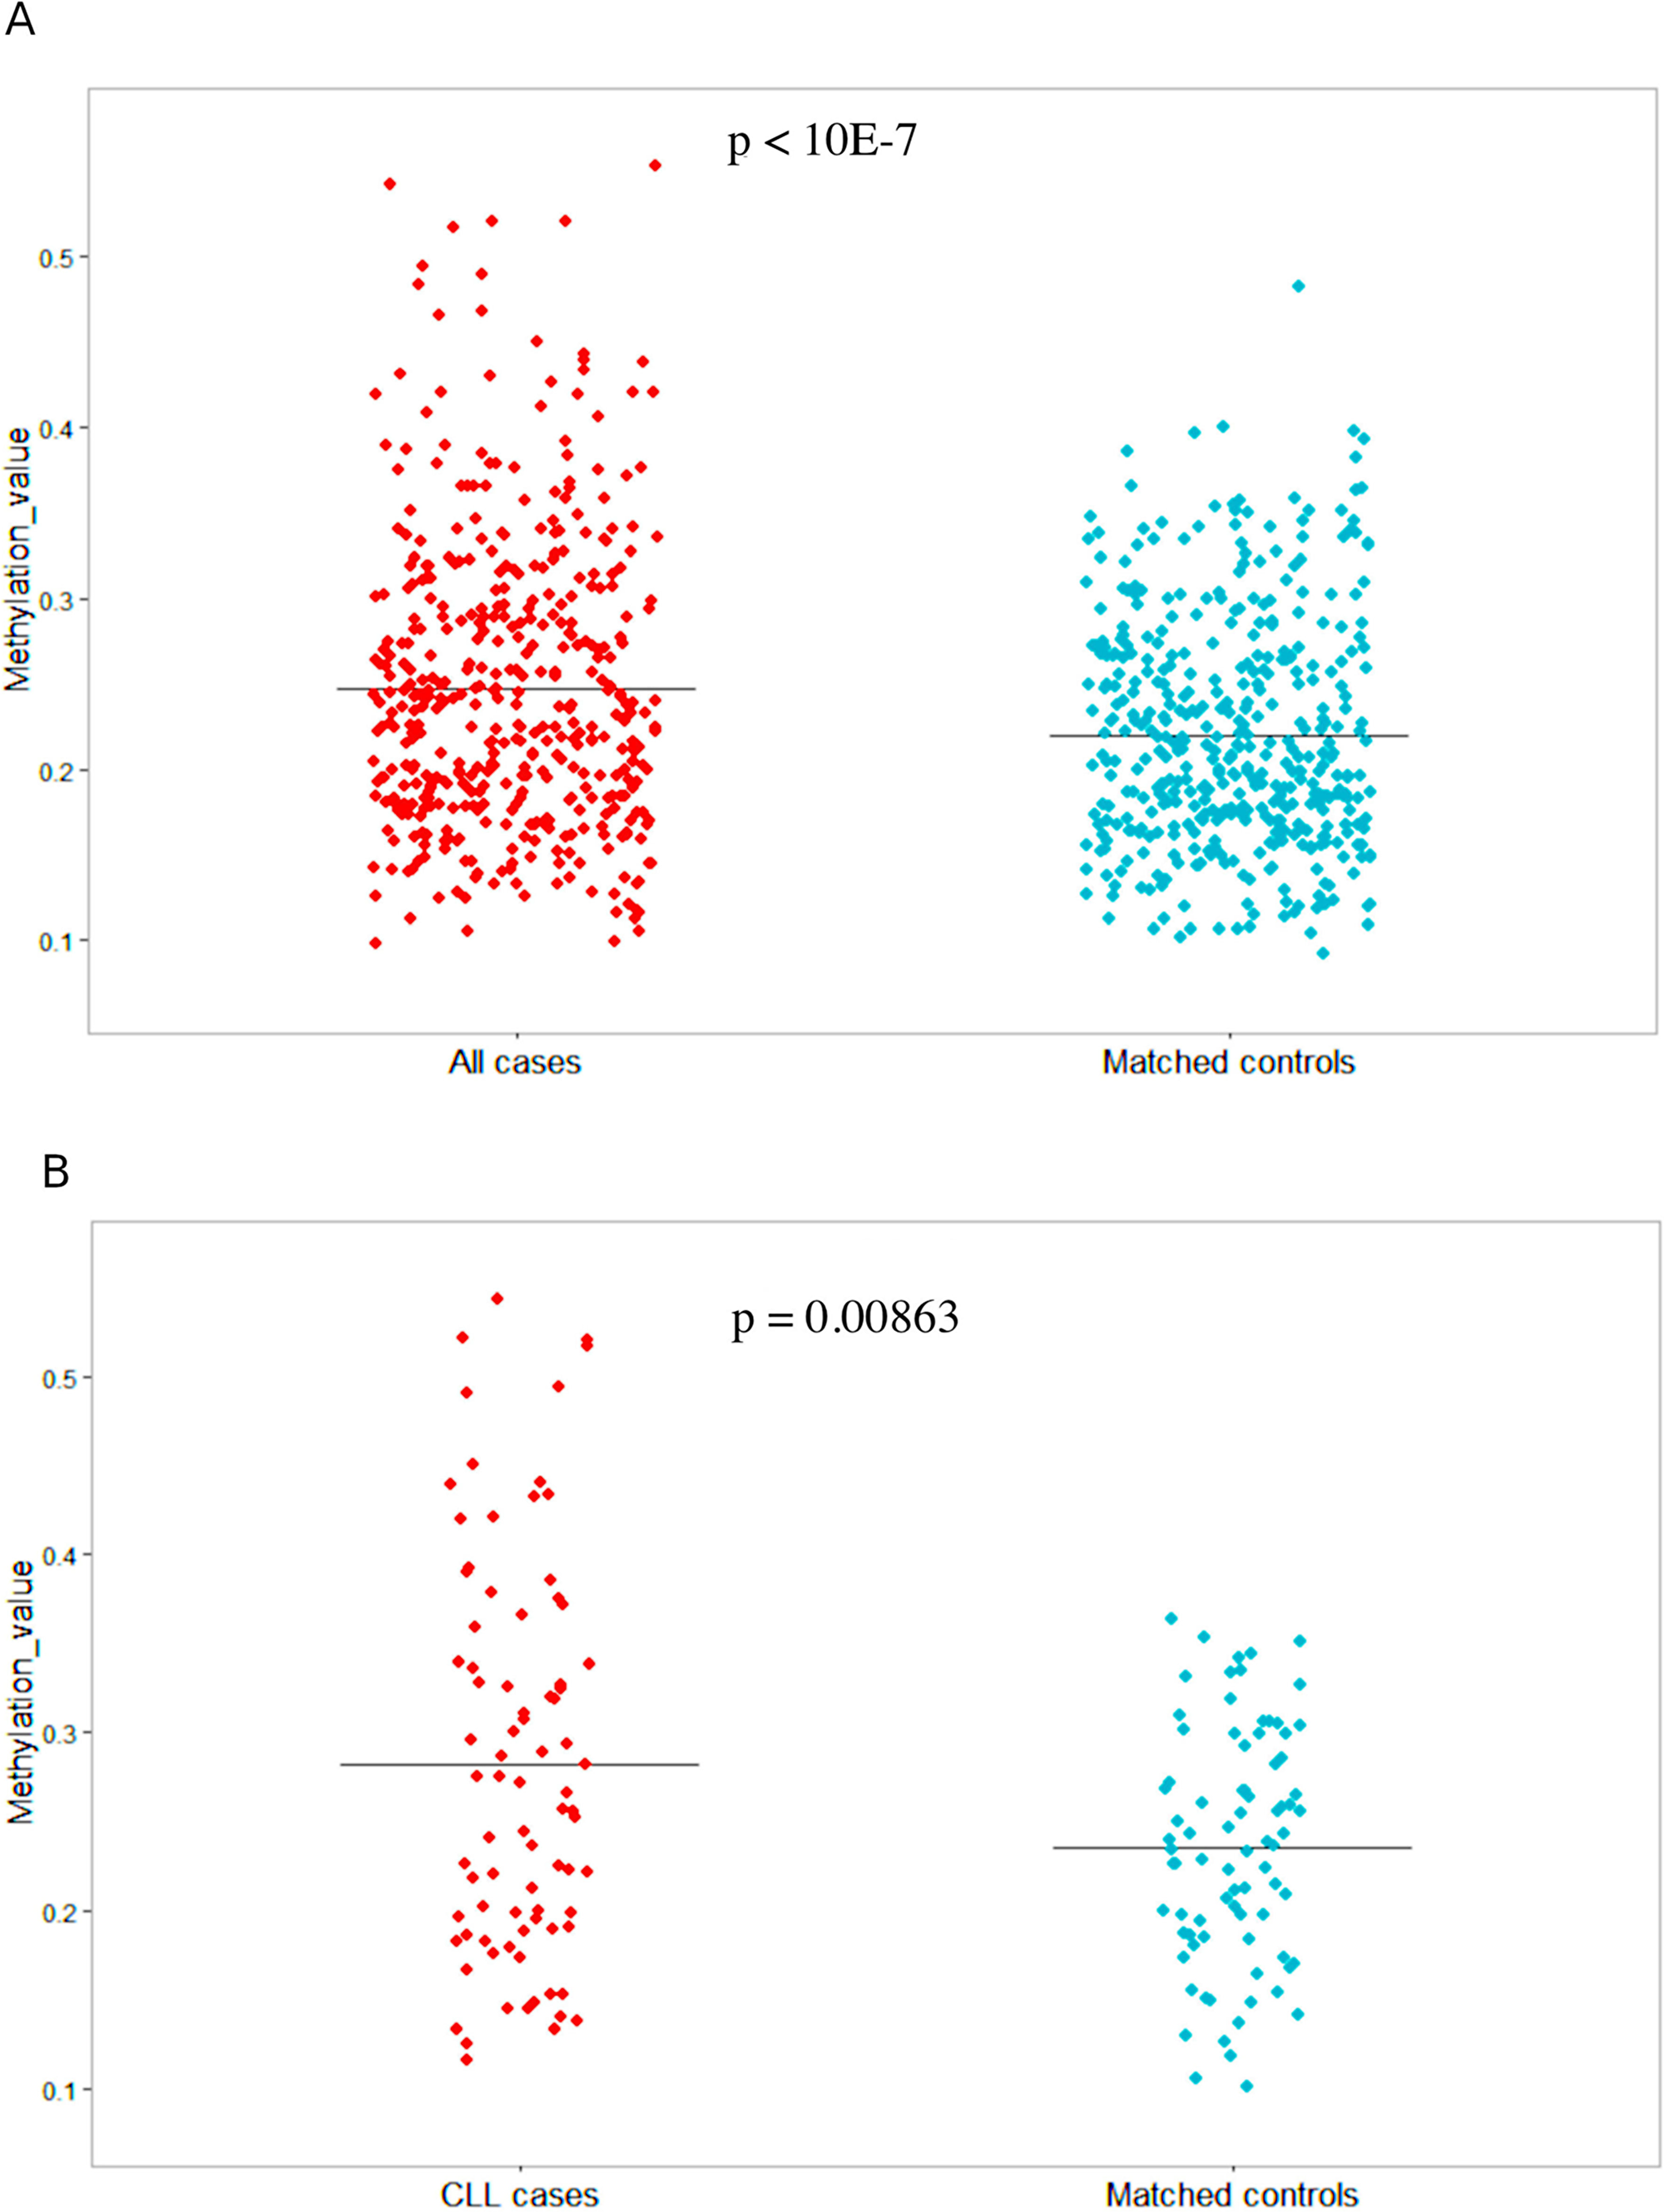
Figure 4: SHANK1 methylation values in 438 MBCN cases/controls and the 82 CLL/SLL cases and controls. (A) Jitter plot showing methylation values (Y-axis) in all cases and their matched controls; (B) Jitter plot showing methylation values (Y-axis) in CLL cases and their matched controls.
SHANK1 gene expression analysis
To investigate the impact of SHANK1-associated CGI hypermethylation on gene expression, we tested the gene expression level of SHANK1 in 27 CLL cases and 16 non-tumor subjects by qRT-PCR (Figure 1A). SHANK1 showed a significant almost 8-fold down-regulation (p-value <0.0001) in CLL cases compared to controls (Figure 5).
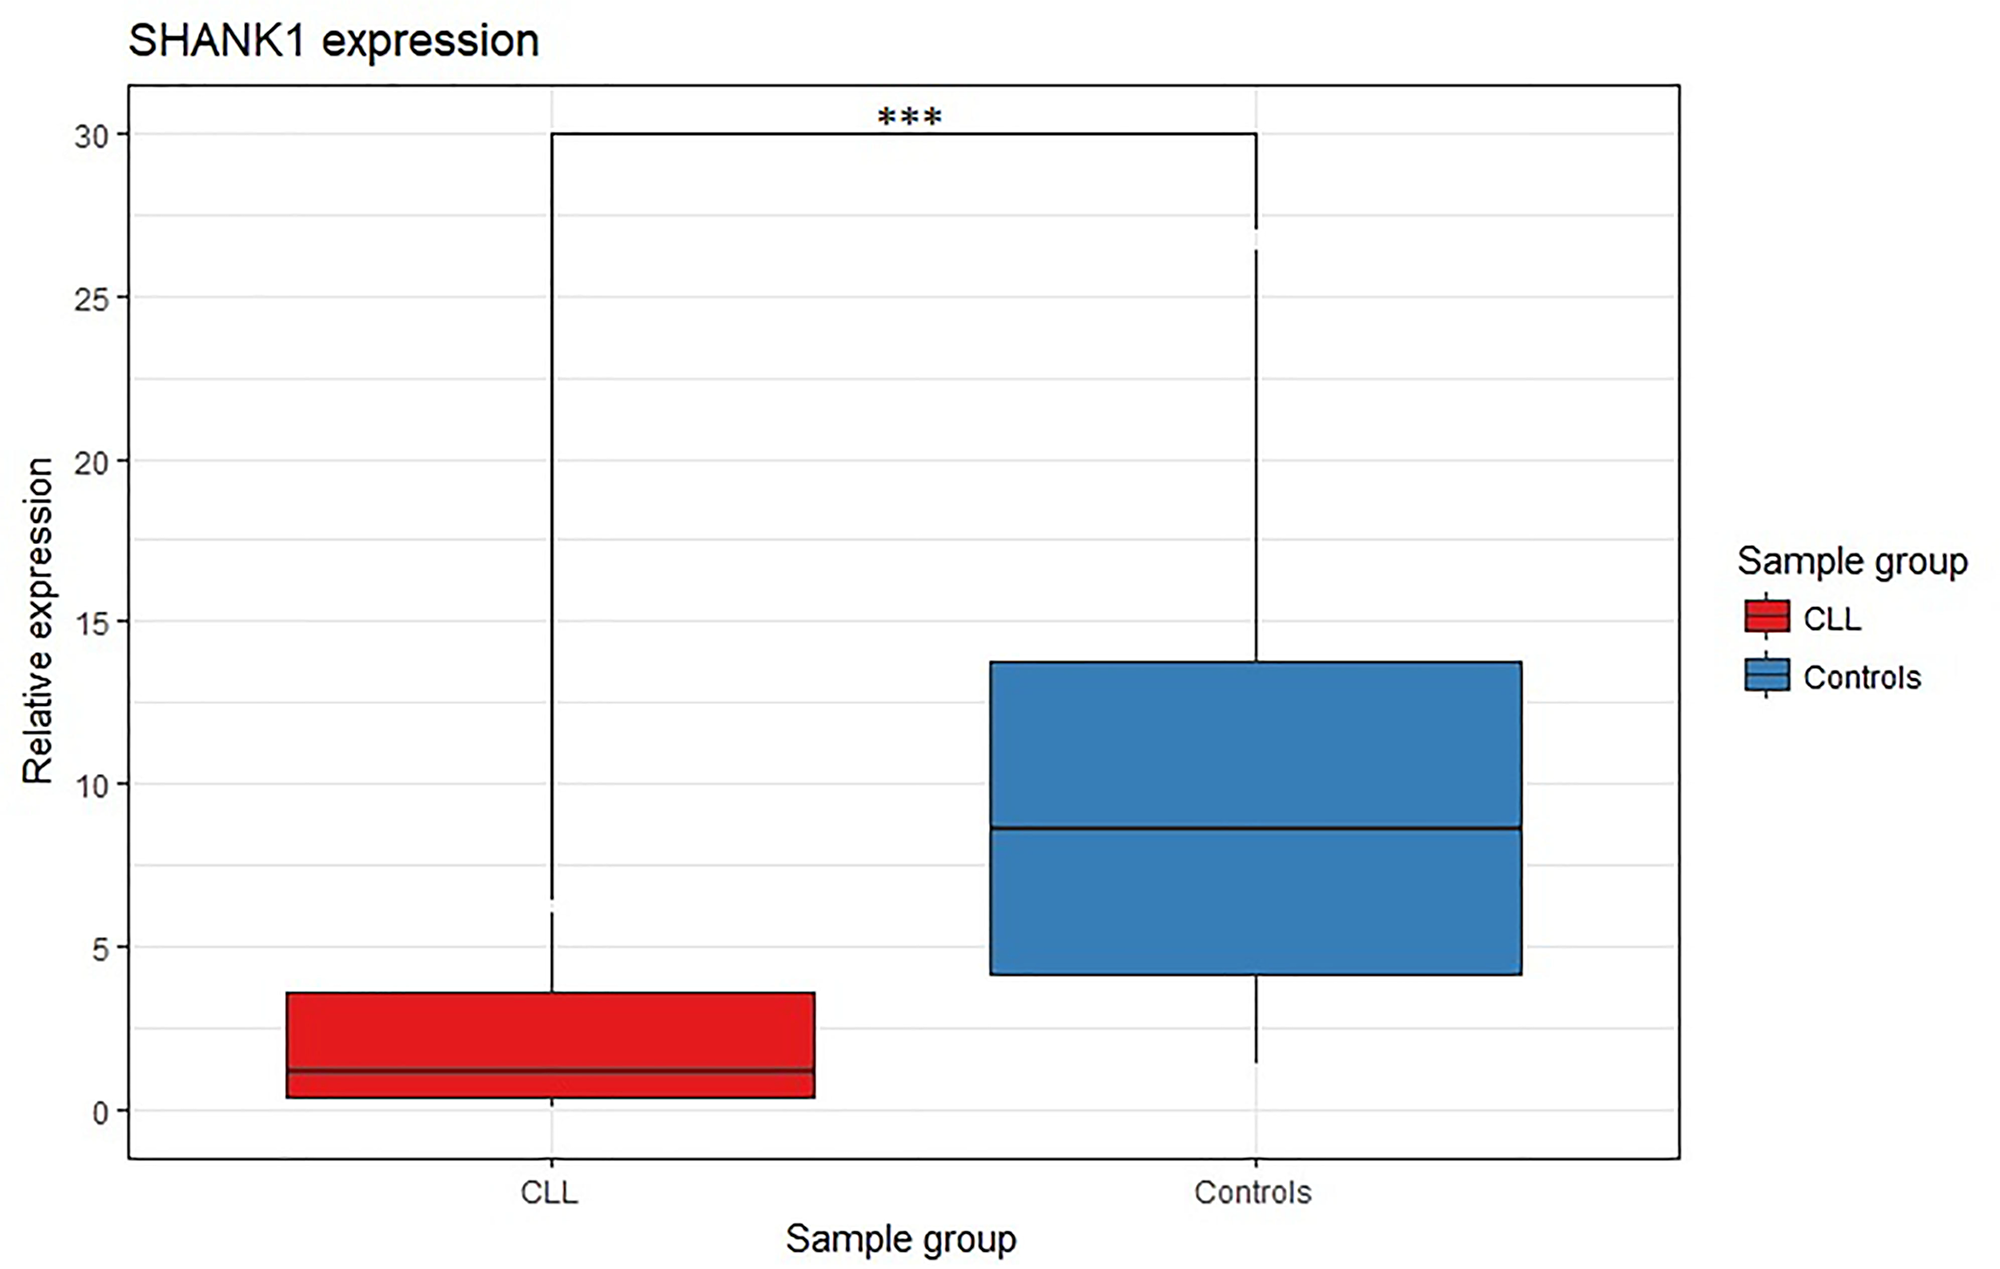
Figure 5: SHANK1 differential gene expression analysis between CLL and control samples. Box plot SHANK1 fold change values for CLL and controls samples. *** indicates p-value < 0.0001.
SHANK1 downregulation was also confirmed using GUSB as reference gene in a subgroup of samples (data not shown).
To validate SHANK1 downregulation observed in our CLL samples, we analyzed RNA-seq data publicly available. Differential gene expression data of ten CLL specimens versus five normal peripheral blood CD19+ B cells were retrieved from GEO database under the accession number GSE70830. In this dataset, SHANK1 gene showed a non-significant differential expression between CLL and control samples.
Gene expression data of a large dataset [9] including 98 CLL and three subtypes of normal B cells (naïve, memory IgM/IgD, and memory IgG/IgA), from three different healthy individuals revealed that only three CLL samples show more than 10 reads and most CLL and normal samples have zero reads, therefore making these data unsuitable for a validation of SHANK1 downregulation.
Whole blood gene expression data from The Genotype-Tissue Expression (GTEx) Portal (https://gtexportal.org) revealed that SHANK1 is weakly expressed in whole blood (median Transcripts Per Kilobase Million (TPM): 0.030, number of samples: 407). RT-qPCR represents the most precise and sensitive method to detect differences in gene expression for weakly expressed genes. On the other hand, the accurate quantification of gene expression by RNA seq depends on the sequencing depth and it has been suggested that sequencing up to 100 million reads can be necessary to quantify precisely genes and transcripts that have low expression levels [10].
DISCUSSION
Aberrant methylation patterns, one of the most striking features of cancer, might represent useful biomarkers for prediction of cancer risk, early diagnosis, prognosis, and for prediction of response to treatment and cancer relapse. Furthermore, as DNA methylation is an early epigenetic reversible modification, specific drugs can be developed to restore the DNA methylation pattern of normal cells at the initial stages of carcinogenesis.
A substantial body of evidence suggests methylation changes as innovative biomarkers for both early cancer diagnosis and prognosis [11]. Some such changes have already shown clinical relevance, such as BRCA1 in breast cancer, MGMT in glioblastoma multiform, and SEPT9, which has been approved by the Food and Drug Administration (FDA) for the diagnosis of colon cancer. Since global DNA methylation is similar in resting and proliferative compartments [12], aberrant methylation patterns may be an early event in CLL, as suggested by its occurrence in blood samples collected years before diagnosis of mature B-cells neoplasm [3] and CLL [4].
In addition, methylation alterations in CLL, such as ZAP70 [13] and HOXA4 [14], have been proposed as prognostic biomarker, and differential methylation profiles are used to classify CLL patients in three molecular CLL subtypes having different clinical features and deriving from B-cell subpopulations at different stages of differentiation [5,15,16]. To our knowledge, biomarkers for detecting CLL at an early stage, which would permit the initiation of therapy in the first phases of the disease, are still lacking. In our study, we identified several CGIs differentially methylated (Supplementary Table 1), and we confirmed a genome-wide hypomethylation in CLL (Figure 2), as previously observed in other studies [8].
Although three CGIs resulted significantly hypomethylated in CLL samples (Supplementary Table 1), we do not suggest these alterations as diagnostic biomarkers since the difficulty of setting cut-off values to consider a sample as hypomethylated, especially when we want to look for an alteration that correlates, as in our case, with the number of tumor cells, then a biomarker that increases with the increase of tumor cells number. On the other hand, hypermethylated CGI showing high methylation values in tumoral samples could be more easily employed as tumoral biomarker.
Our most striking finding was the hypermethylation of a CGI located in the gene body of SHANK1 in CLL samples. Although this differential methylation was not statistically significant after correction for multiple testing probably due to the fact that the sample size in our study was small, we were able to replicate our finding by in silico analysis of a larger CLL series [8]. This type of approach has proved to be successful in the identification of other highly specific and sensitive tumor biomarkers [17–20]. Moreover, the robustness of our data was verified in different validation and exploratory sets (Table 1). For these reasons, it is important to mention that, although we are aware of the importance of significance threshold for epigenome-wide studies (EWAS) [21], the methylation alterations detected are somatic epimutations, and even at the onset of the disease, thus the heterogeneity of the tumor, and in particular, as in this case, a blood tumor, needs to be taken into account. In our previous work [19], we have shown that in a heterogeneous tissue, such as adenoma, the methylation alterations detected were not statistically significant after multiple testing adjustment. In contrast, the same methylation alteration detected in colorectal carcinomas resist to any correction for multiple testing. In fact, adenomas include a mixture of cells showing methylation alterations and cells not showing the alterations compared to colorectal carcinomas where many tumor cells present the epimutations.
In silico replication of our result analyzing data including CLL samples with ≥95% neoplastic cells and control normal B cells [8], confirmed that the detected SHANK1 methylation alteration belongs to neoplastic cells. The fact that we were able to detect this methylation alteration in CLL whole blood samples supported its potential use as a diagnostic biomarker to be introduced in clinical practice without the need of performing an expensive method such as cell sorting. Interestingly, Kulis et al [8] have shown that, in a differential methylation analysis between U-CLL samples and naïve B cells of control samples, the same SHANK1 CGI, identified as altered in our study, was significantly hypermethylated in U-CLL. IGHV mutational status is a prognostic biomarker in CLL: while patients with a high level of IGHV mutation (called as M-CLL) have a favorable prognosis, U-CLL is usually associated with poor outcomes. In our case series, patients with IGHV mutations had an average SHANK1 CGI methylation value of 35.0%, while it was 49.6 % in IGHV non-mutated patients (Table 3). Also, removing an outlier (69.0% methylation), probably due to the fact that this patient was first diagnosed with Follicular lymphoma, resulted in the methylation average dropping to 23.7%. Thus, SHANK1 methylation might be correlated with clinical outcomes in CLL. In this regard, it is interesting to note that we also observed that the β value for the altered CGI in SHANK1 correlates positively with the peripheral lymphocyte count at diagnosis (Figure 3), which also prompted us to repeat the differential methylation analysis by including the lymphocyte count as a covariate; this second analysis confirmed the same CGIs as the most affected by methylation changes (Supplementary Table 1). Inference of cell type contributions on tumor whole blood samples revealed that there was a strong positive correlation between CD19+ B-cells contributions and SHANK1 methylation values (Table 2). It is estimated that the increased number of lymphocytes, that is observed in the lymphocyte count at diagnosis, is mainly due (> 80%) to the proliferation of neoplastic cells. In fact, in an analysis of 110 patients with an absolute lymphocyte count of at least 5 x 10⁹/L, Shanafelt et al. have shown that monoclonal B-cells were more than 86% of B-cells, while polyclonal B-cells represented only a small fraction of total B-cells [22]. Therefore, SHANK1 methylation might be a useful molecular biomarker in the personalized quantification of tumor aggression in CLL.
Aberrant methylation of genes implicated in MBCN is detectable in blood samples collected many years before diagnosis [3, 4]. We found that within a prospective cohort, there was a significant gain of methylation (differential methylation of 3%) in the same SHANK1 CGI detectable in peripheral blood collected many years prior to diagnosis with MBCN (Figure 4A). In a subgroup of CLL/SLL cases within the prospective MBCN cohort, there was an even more pronounced gain of methylation (differential methylation of 4.7%) compared with matched unaffected controls (Figure 4B).
Since there is an overlap between SHANK1 methylation levels in cases and controls, SHANK1 cannot be suggested as a predictive biomarker at individual levels. However, 210/438 (48%) MBCN samples showed a differential methylation greater than the average Δβ (0.03), ranging from 0.031 to 0.36, and 38/82 (46%) CLL/SLL samples showed a differential methylation greater than the average Δβ (0.047), ranging from 0.06 to 0.33. It is important to mention that each case is matched to one control. Since we found that SHANK1 methylation values are positively correlated to lymphocyte counts at diagnosis and patients with poor prognosis according to IGHV mutational status showed higher methylation values, we can speculate that SHANK1 might be able to predict aggressive forms of disease years before diagnosis. Further studies including SHANK1 methylation status before diagnosis, at diagnosis and follow-up data are needed to investigate this hypothesis.
This difference of methylation is in line with, and even greater than that observed in other genes years before cancer diagnosis [3]. Thus, SHANK1 might be a potential predictive biomarker of CLL risk. Although SHANK1 methylation data at diagnosis in other MBCNs were not available in our study, we can speculate that methylation of this gene is an early event in leukemogenesis.
The use of an epigenetic biomarker proving to be so traceable and informative without cells sorting, is particularly useful for preventive purposes. Extensive screening aimed to identify individuals at risk for CLL would not make much sense using detectors requiring cells sorting, while it is possible to find alterations in the methylation pattern of this specific CGI already years before the onset, starting from whole blood.
SHANK1 is one of the three members of the SHANK (SH3 And Multiple Ankyrin Repeat Domains) gene family. Their respective proteins, SHANK1, SHANK2 and SHANK3 act as scaffold proteins and have a fundamental role in the formation, development and function of neuronal synapses. Mutations of the SHANK gene family are associated to developmental disorders, such as autism and schizophrenia. Investigating the association between SHANK genes methylation and their expression, Beri et al [23] showed that, although all these genes present several methylated CpG sites, only SHANK3 was highly methylated in tissues where its expression was low or absent, suggesting that methylation might regulate tissue-specific SHANK3 expression.
In our work, the gene expression analysis revealed that SHANK1 was significantly down-regulated in CLL. The inability to validate this data, in silico, may be due to the fact that a gene already normally repressed, if further down-regulated, is hardly detectable by means of whole exome / whole transcriptome NGS / microarrays techniques. It will therefore be important to verify our observation on a larger database, by means of a targeted expression study and an ultrasensitive technique such as ddPCR. The association between methylation and gene expression is very complex and, while hypermethylation of CGIs located in gene promoters is usually associated with gene down-regulation, hypermethylation of intragenic CGIs has been correlated either positively and negatively with gene expression [8, 24–27]. Intragenic DNA methylation might have a role in several molecular processes, such as regulation of cell-context specific alternative promoter in gene bodies [28], expression of intragenic non-coding RNA [29–32] and transposable elements [33], alternative splicing [34], alternative polyadenylation sites [35], and enhancer activation [36, 37]. It has also been shown that intragenic nucleosomes with H3K36 trimethylation (H3K36me3), a histone modification associated with transcript elongation, recruit DNA methyltransferases [38], suggesting that DNA methylation is unable to block transcript elongation. In CLL, Kulis et al [8], have shown that, in absence of CGI-promoter methylation, methylation of CpGs located in the gene bodies of around 900 genes shows a significant correlation (either positive or negative) with gene expression.
Since methylation of intragenic CGIs might be inversely correlated with the expression of an alternative transcript and positively regulated with the expression of the main transcript [39], it would be interesting to investigate the association between the methylation of the intragenic CGI of SHANK1 and the expression of alternative transcripts. SHANK1, like the other two SHANK genes, SHANK2 and SHANK3, presents a complex transcriptional structure. This gene contains two different promoters, which generate the longest protein isoform (called SHANK1A) and the shortest one (called SHANK1B), and several splicing sites generating alterative transcripts (Figure 6). SHANK1 is mainly expressed in the brain (https://www.gtexportal.org/home/gene/SHANK1). The CGI found to be hypermethylated in our CLL cases is located in the gene body of the main transcript (uc002psx.1 or ENST00000293441), but it is upstream of the shorter transcript (uc002psw.1 or ENST00000391813) (Figure 6). Thus, we speculate that the hypermethylation of the intragenic CGI might be associated with a down-regulation of this shorter transcript. Clearly, a gene expression study to accurately quantify each SHANK1 alternative transcript in a large number of CLL samples and controls is warranted to elucidate the impact of this intragenic CGI hypermethylation in gene expression regulation.
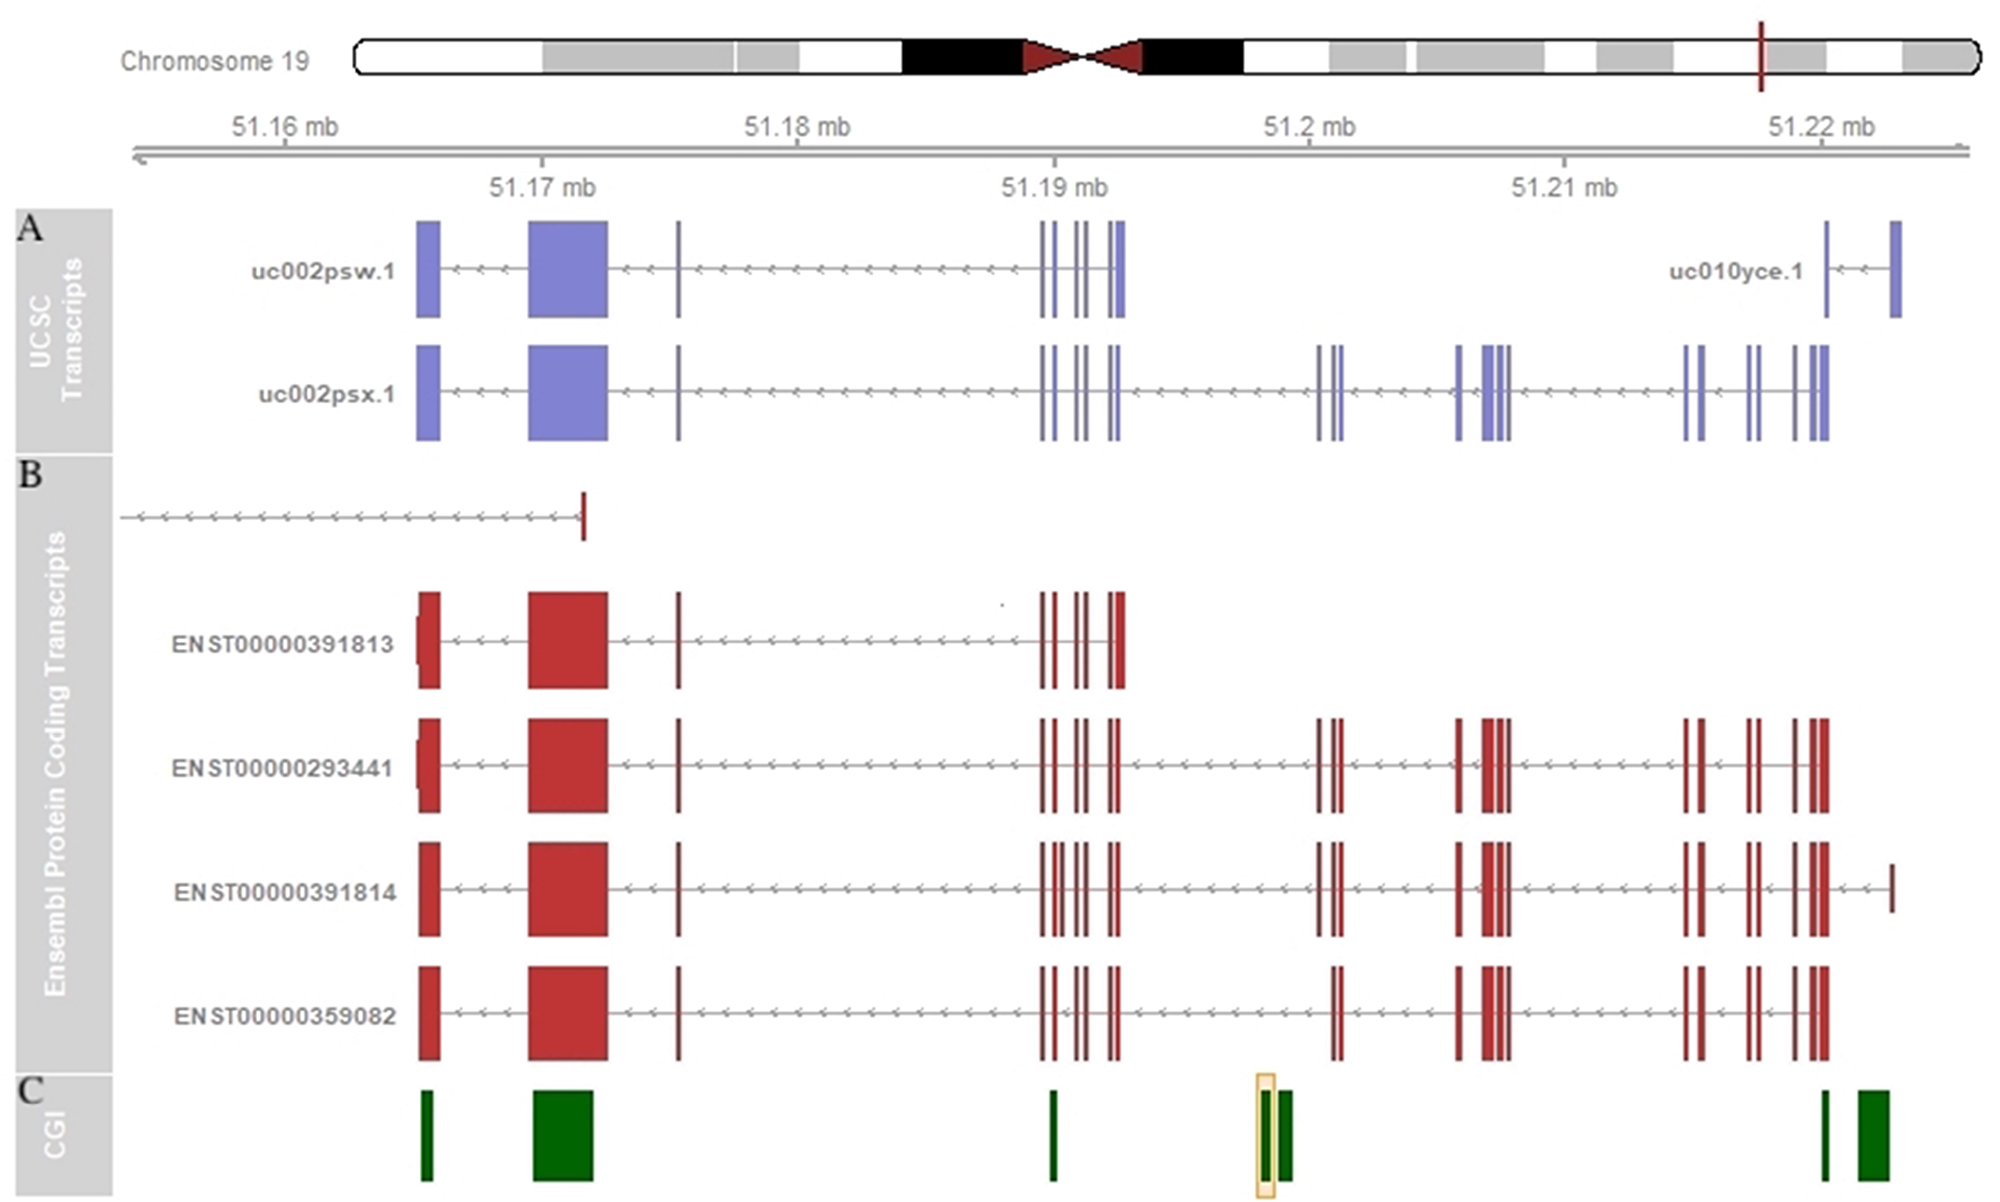
Figure 6: SHANK1 schematic representation. (A) SHANK1 transcripts representation in UCSC Genome Browser. (B) SHANK1 protein coding transcripts representation in Ensembl Genome Browser. (C) SHANK1-associated CGI annotation in UCSC Genome Browser. The orange box indicates the CGI found altered in our study.
To date, it is difficult to hypothesize whether the identified methylation alterations are really associated with a different gene expression profile and what this may possibly influence from a functional point of view. The putative activation or deactivation of isoforms that do not respect the normal cell differentiation program could obviously affect the cellular functionality, so as to induce it to a neoplastic iter. What is certain is that at the moment these alterations can provide useful biomarkers for the early diagnosis of a neoplasia, as well as, in the case of the marker we identified, associate with a different prognosis and even giving the possibility of predicting a risk of disease onset.
Other SHANK1-associated CGIs are reportedly differentially methylated in other cancers, and they have been proposed as tumor biomarkers [19, 40]. The most plausible scenario would be that methylation changes in different SHANK1-associated CGIs would be related to different types of cancer, thus serving as specific signatures for different types of tumors.
In summary, our results suggest SHANK1 as a promising tumor biomarker for CLL early diagnosis. Since no screening tests are recommended for CLL and patients can be asymptomatic, it is difficult to diagnose CLL in the first phases of the disease. The introduction of a methylation-based diagnostic biomarker in clinical practice could allow an early detection of CLL cases and the initiation of adequate therapeutic treatments in the first phases of the disease. SHANK1 hypermethylation can be easily found analyzing whole blood samples without cell sorting, supporting its utility in clinical practice. Moreover, since SHANK1 methylation levels correlated with lymphocyte count at diagnosis it can be particularly useful in the recognition of the most aggressive forms of the disease showing a fast progression. Finally, the detection of SHANK1-associated CGI gain of methylation many years before diagnosis suggests that SHANK1 methylation levels may be predictive of CLL development. Thus, a screening test based on SHANK1 methylation levels assessment could be developed to monitor people at risk, such as people over age 50, or subjects presenting familiarity for the disease. Further studies on sequential samples before diagnosis, at diagnosis and during disease course are needed to monitor SHANK1 methylation levels and ascertain its involvement in CLL progression.
Materials and Methods
Tumor specimens
Eighteen Italian patients (10 men and 8 women, mean age at diagnosis: 65.3±12.3) with a diagnosis of CLL donated a blood sample during their first visit at the outpatient ambulatory of the Hematology department of the A. Businco Oncology Hospital, Cagliari (Sardinia, Italy). All patients were diagnosed using the 2008 WHO Classification of lymphoid neoplasms criteria. [41]
Blood samples from six controls (mean age: 51.3±20.2), selected from the 151 participating in a population-based case-control study in the same area of CLL patients, were included in the genome-wide methylation analysis.
Demographic characteristics (age, sex, smoking status and BMI) of CLL patients and controls and clinical and immunophenotypic characteristics of CLL samples are reported in Table 3.
Mean age (p-value = 0,0711; Student t test), sex (p-value = 1,0000; Fisher’s exact test), smoking status (p-value = 1,0000; Fisher’s exact test) and mean BMI (p-value = 0,9613; Student t test) were not statistically significant different between cases and controls.
In addition, blood samples were available for 27 out of the 29 CLL incident cases (mean age at diagnosis: 65.1±9.3) recruited for the same study at participating Italian hospitals in Novara, Florence, Perugia and Cagliari, and for a random sample of 16 out of the 455 population controls from the same areas, who accepted taking part to the full study protocol. We conducted the gene expression analysis for these 27 CLL cases and 16 controls.
We also tested the hypothesis that the selected SHANK1 CpG island (CGI) might undergo methylation changes prior to the clinical manifestation of the disease using a case control study nested within a prospective cohort study of 438 samples of incident mature B-cell neoplasms (MBCN), including 82 CLL and small lymphocytic lymphoma (SLL) cases, considered two forms of the same disease only differing by the location where the cancer primarily occurs, and matched (individually matched to cases at 1:1 ratio based on age at enrollment, gender, ethnicity and DNA source) controls. Additional information about cases and controls demographic characteristics and matching criteria can be found in Woong Doo et al. [3]. In this cohort, the mean time between blood collection and diagnosis was 9.5 years (range 0.6-17.8 years) for CLL cases and 10.6 years (range 0.2-20 years) for the entire MBCN cohort. DNA was collected predominantly from whole blood samples and analyzed as previously described. In particular, of the 976 samples, 632 were processed from whole blood, 234 from Ficoll-separated mononuclear cells and 10 from buffy coat. [3]
All the biological samples analyzed were obtained with written informed consent signed by patients/study participants and ethical approval granted by the “Comitato Etico Azienda Ospedaliero Universitaria di Cagliari” (269/09/CE, 26/05/2009).
DNA and RNA extraction
DNA was isolated from peripheral whole blood lymphocytes using the DNA extraction 500 arrow® Kit (DiaSorin Ireland Ltd) kit. DNA was quantified with NanoDrop (NanoDrop Products Thermo Scientific Wilmington, DE) and by fluorometric reading (Quant-iT™ PicoGreen® dsDNA Assay Kit).
RNA was extracted from PBMCs (Mononuclear cell fractions, isolated over a Ficoll-Hypaque density gradient) using Qiagen RNAeasy mini kit (Qiagen, Hilden, Germany) and quantified using NanoPhotometer (NanoPhotometer™Pearl, Denville®, Denville Scientific, Holliston, MA).
DNA methylation analysis
The DNA extracted was bisulfite converted using the EZ DNA Methylation gold Kit (Zymo Research, Irvine, CA, USA) according to manufacturer’s instructions. Bisulfite converted DNA was hybridized to Illumina Infinium HumanMethylation450 BeadChips (450K), following the Illumina Infinium HD Methylation protocol. Hybridization fluorescent data were read on an Illumina HiScan SQ scanner.
Illumina Methylation 450K raw data were analyzed using the RnBeads analysis software package as previously described. [42, 43] Methylation levels [beta values (β)] were estimated as the ratio of signal intensity of the methylated alleles to the sum of methylated and unmethylated intensity signals of the alleles. The β values ranges from 0 (no methylation) to 1 (100% methylation).
Differential methylation analysis was conducted on the CpG sites and other 4 genomic regions (tailing, genes, promoters and CpG Islands, so called CGIs). CpG-level p-values were corrected for multiple testing using the false discovery rate (FDR) method. CpG-specific uncorrected p-values within a given genomic region were combined to obtain aggregate p-values for each genomic region and then corrected for multiple testing. [42, 43] Based on the absolute and relative effect size of the differences between the study groups, RnBeads combines statistical testing with a priority ranking scheme to assign a combined rank score for differential DNA methylation to each analyzed CpG site and genomic region. [42] The generated priority-ranked list was used to select the top-100 ranked differentially methylated CGIs. The selected CGIs were annotated to nearest genes by using R annotation package FDb.InfiniumMethylation.hg19. [44]
An additional methylome analysis was performed adding absolute lymphocyte count data as a covariate in the limma analysis of differential DNA methylation. [42, 45] DNA methylation analysis for the samples in the nested case-control study were also performed on the Illumina HM450K Infinium array as previously described. [3]
Inference of cell type contributions was conducted using RnBeads applying the method of Houseman et al. [6]. This method estimated the cell type contributions of whole blood samples based on methylation profiles of a sorted blood cell types reference. [46] The validity of this method for estimating whole blood cells composition in CLL samples has been recently demonstrated. [4, 47]
qRT-PCR
1μg RNA/sample was retro-transcribed using the High Capacity Kit (Applied Biosystems, Carlsbad, CA, USA). Gene expression analysis was performed by qRT-PCR, conducted on a DNA Engine Opticon 2 Real-Time Cycler (Bio-Rad, Hercules, CA, USA), using iQ™ SYBR® Green Supermix (Bio-Rad, Hercules, CA, USA) for each gene tested and for the reference genes. Actin Beta (ACTB) gene, which is one of the most often used reference genes in B-CLL gene expression studies [48, 49], was used as reference gene. A subgroup of tumoral and non-tumoral samples was also analyzed using Glucuronidase Beta (GUSB) as reference gene.
Primers used in this study to conduct qRT-PCR are the following:
- 5’-AGACCATCAGTGCAAGCGAA-3’ (SHANK1 forward)
- 5’-GGGATCGAAGCTCGACTCAG-3’ (SHANK1 reverse)
- 5’-AAATCTGGCACCACACCTTC-3’ (ACTB forward)
- 5’-AGCACAGCCTGGATAGCAAC-3’ (ACTB reverse)
- 5’-CACCTAGAATCTGCTGGCTACT-3’ (GUSB forward)
- 5’-AGAGTTGCTCACAAAGGTCACA-3’ (GUSB reverse)
Gene expression data were analyzed using the ΔΔCT method. We used a t-test for independent series to compare the average ΔCT of CLL cases and controls.
Power calculation
The power was estimated using a two-sample t test power calculation. A dataset of 18 samples, those available to us as discovery set, would guarantee a statistical power of 0.8 to detect a differential methylation level of at least 25%, using a type I error of 10e-8 (which takes into account the need to correct for multiple test).
CONFLICTS OF INTEREST
The authors declare no conflict of interest.
FUNDING
This work was supported by grants from the Italian Ministry for Education, University and Research (PRIN 2007 prot. 2007WEJLZB and PRIN 2009 prot. 20092ZELR2), and the Italian Association for Cancer Research (IG 2011/11855) to PC. Partly supported also by grants from Fondazione Banco di Sardegna (2012), Fondo per la Ricerca Locale (ex 60%), Università di Cagliari, Regione Autonoma della Sardegna (CRP-79303) to PZ.
The Melbourne Collaborative Cohort Study (MCCS) recruitment was funded by VicHealth and Cancer Council Victoria. The MCCS was further supported by Australian National Health and Medical Research Council grants 209057, 251553 and 1087683 and by infrastructure provided by Cancer Council Victoria. MCS is a National Health and Medical Research Council of Australia Senior Research Fellow.
References
1. Baliakas P, Mattsson M, Stamatopoulos K, Rosenquist R. Prognostic indices in chronic lymphocytic leukaemia: where do we stand how do we proceed? J Intern Med. 2016; 279: 347–57. https://doi.org/10.1111/joim.12455. [PubMed].
2. Puiggros A, Blanco G, Espinet B. Genetic abnormalities in chronic lymphocytic leukemia: where we are and where we go. Biomed Res Int. 2014; 2014: 435983. https://doi.org/10.1155/2014/435983. [PubMed].
3. Wong Doo N, Makalic E, Joo JE, Vajdic CM, Schmidt DF, Wong EM, Jung CH, Severi G, Park DJ, Chung J, Baglietto L, Prince HM, Seymour JF, et al. Global measures of peripheral blood-derived DNA methylation as a risk factor in the development of mature B-cell neoplasms. Epigenomics. 2016; 8: 55–66. https://doi.org/10.2217/epi.15.97. [PubMed].
4. Georgiadis P, Liampa I, Hebels DG, Krauskopf J, Chatziioannou A, Valavanis I, de Kok TMCM, Kleinjans JCS, Bergdahl IA, Melin B, Spaeth F, Palli D, Vermeulen RCH, et al. Evolving DNA methylation and gene expression markers of B-cell chronic lymphocytic leukemia are present in pre-diagnostic blood samples more than 10 years prior to diagnosis. BMC Genomics. 2017; 18: 728. https://doi.org/10.1186/s12864-017-4117-4. [PubMed].
5. Kulis M, Merkel A, Heath S, Queirós AC, Schuyler RP, Castellano G, Beekman R, Raineri E, Esteve A, Clot G, Verdaguer-Dot N, Duran-Ferrer M, Russiñol N, et al. Whole-genome fingerprint of the DNA methylome during human B cell differentiation. Nat Genet. 2015; 47: 746–56. https://doi.org/10.1038/ng.3291. [PubMed].
6. Houseman EA, Accomando WP, Koestler DC, Christensen BC, Marsit CJ, Nelson HH, Wiencke JK, Kelsey KT. DNA methylation arrays as surrogate measures of cell mixture distribution. BMC Bioinformatics. 2012; 13: 86. https://doi.org/10.1186/1471-2105-13-86. [PubMed].
7. Imhof BA, Dunon D. Leukocyte migration and adhesion. Adv Immunol. 1995; 58: 345–416. https://doi.org/10.1016/S0065-2776(08)60623-9. [PubMed].
8. Kulis M, Heath S, Bibikova M, Queirós AC, Navarro A, Clot G, Martínez-Trillos A, Castellano G, Brun-Heath I, Pinyol M, Barberán-Soler S, Papasaikas P, Jares P, et al. Epigenomic analysis detects widespread gene-body DNA hypomethylation in chronic lymphocytic leukemia. Nat Genet. 2012; 44: 1236–42. https://doi.org/10.1038/ng.2443. [PubMed].
9. Ferreira PG, Jares P, Rico D, Gomez-Lopez G, Martinez-Trillos A, Villamor N, Ecker S, Gonzalez-Perez A, Knowles DG, Monlong J, Johnson R, Quesada V, Djebali S, et al. Transcriptome characterization by RNA sequencing identifies a major molecular and clinical subdivision in chronic lymphocytic leukemia. Genome Res. 2014; 24: 212–26. https://doi.org/10.1101/gr.152132.112. [PubMed].
10. Sims D, Sudbery I, Ilott NE, Heger A, Ponting CP. Sequencing depth and coverage: key considerations in genomic analyses. Nat Rev Genet. 2014; 15: 121–32. https://doi.org/10.1038/nrg3642. [PubMed].
11. Leygo C, Williams M, Jin HC, Chan MWY, Chu WK, Grusch M, Cheng YY. DNA Methylation as a Noninvasive Epigenetic Biomarker for the Detection of Cancer. Dis Markers. 2017; 2017: 1–13. https://doi.org/10.1155/2017/3726595. [PubMed].
12. Cahill N, Rosenquist R. Uncovering the DNA methylome in chronic lymphocytic leukemia. Epigenetics. 2013; 8: 138–48. https://doi.org/10.4161/epi.23439. [PubMed].
13. Claus R, Lucas DM, Stilgenbauer S, Ruppert AS, Yu L, Zucknick M, Mertens D, Bühler A, Oakes CC, Larson RA, Kay NE, Jelinek DF, Kipps TJ, et al. Quantitative DNA methylation analysis identifies a single CpG dinucleotide important for ZAP-70 expression and predictive of prognosis in chronic lymphocytic leukemia. J Clin Oncol. 2012; 30: 2483–91. https://doi.org/10.1200/JCO.2011.39.3090. [PubMed].
14. Strathdee G, Sim A, Parker A, Oscier D, Brown R. Promoter hypermethylation silences expression of the HoxA4 gene and correlates with IgVh mutational status in CLL. Leukemia. 2006; 20: 1326–9. https://doi.org/10.1038/sj.leu.2404254. [PubMed].
15. Queirós AC, Villamor N, Clot G, Martinez-Trillos A, Kulis M, Navarro A, Penas EMM, Jayne S, Majid A, Richter J, Bergmann AK, Kolarova J, Royo C, et al. A B-cell epigenetic signature defines three biologic subgroups of chronic lymphocytic leukemia with clinical impact. Leukemia. 2015; 29: 598–605. https://doi.org/10.1038/leu.2014.252. [PubMed].
16. Oakes CC, Seifert M, Assenov Y, Gu L, Przekopowitz M, Ruppert AS, Wang Q, Imbusch CD, Serva A, Koser SD, Brocks D, Lipka DB, Bogatyrova O, et al. DNA methylation dynamics during B cell maturation underlie a continuum of disease phenotypes in chronic lymphocytic leukemia. Nat Genet. 2016; 48: 253–64. https://doi.org/10.1038/ng.3488. [PubMed].
17. Carmona FJ, Azuara D, Berenguer-Llergo A, Fernandez AF, Biondo S, de Oca J, Rodriguez-Moranta F, Salazar R, Villanueva A, Fraga MF, Guardiola J, Capella G, Esteller M, et al. DNA Methylation Biomarkers for Noninvasive Diagnosis of Colorectal Cancer. Cancer Prev Res (Phila). 2013; 6: 656–65. https://doi.org/10.1158/1940-6207.CAPR-12-0501. [PubMed].
18. Galamb O, Kalmár A, Péterfia B, Csabai I, Bodor A, Ribli D, Krenács T, Patai ÁV, Wichmann B, Barták BK, Tóth K, Valcz G, Spisák S, et al. Aberrant DNA methylation of WNT pathway genes in the development and progression of CIMP-negative colorectal cancer. Epigenetics. 2016; 11: 588–602. https://doi.org/10.1080/15592294.2016.1190894. [PubMed].
19. Fadda A, Gentilini D, Moi L, Barault L, Leoni VP, Sulas P, Zorcolo L, Restivo A, Cabras F, Fortunato F, Zavattari C, Varesco L, Gismondi V, et al. Colorectal cancer early methylation alterations affect the crosstalk between cell and surrounding environment, tracing a biomarker signature specific for this tumor. Int J Cancer. 2018; 143: 907–20. https://doi.org/10.1002/ijc.31380. [PubMed].
20. Antonelli M, Fadda A, Loi E, Moi L, Zavattari C, Sulas P, Gentilini D, Cameli C, Bacchelli E, Badiali M, Arcella A, Morra I, Giangaspero F, et al. Integrated DNA methylation analysis identifies topographical and tumoral biomarkers in pilocytic astrocytomas. Oncotarget. 2018; 9: 13807–21. https://doi.org/10.18632/oncotarget.24480. [PubMed].
21. Saffari A, Silver MJ, Zavattari P, Moi L, Columbano A, Meaburn EL, Dudbridge F. Estimation of a significance threshold for epigenome-wide association studies. Genet Epidemiol. 2018; 42: 20-33. https://doi.org/10.1002/gepi.22086. [PubMed].
22. Shanafelt TD, Kay NE, Jenkins G, Call TG, Zent CS, Jelinek DF, Morice WG, Boysen J, Zakko L, Schwager S, Slager SL, Hanson CA. B-cell count and survival: differentiating chronic lymphocytic leukemia from monoclonal B-cell lymphocytosis based on clinical outcome. Blood. 2009; 113: 4188–96. https://doi.org/10.1182/blood-2008-09-176149. [PubMed].
23. Beri S, Tonna N, Menozzi G, Bonaglia MC, Sala C, Giorda R. DNA methylation regulates tissue-speci.c expression of Shank3. J Neurochem. 2007; 101: 1380–91. https://doi.org/10.1111/j.1471-4159.2007.04539.x. [PubMed].
24. Rakyan VK, Down TA, Thorne NP, Flicek P, Kulesha E, Gräf S, Tomazou EM, Bäckdahl L, Johnson N, Herberth M, Howe KL, Jackson DK, Miretti MM, et al. An integrated resource for genome-wide identification and analysis of human tissue-specific differentially methylated regions (tDMRs). Genome Res. 2008; 18: 1518–29. https://doi.org/10.1101/gr.077479.108. [PubMed].
25. Ball MP, Li JB, Gao Y, Lee JH, LeProust EM, Park IH, Xie B, Daley GQ, Church GM. Targeted and genome-scale strategies reveal gene-body methylation signatures in human cells. Nat Biotechnol. 2009; 27: 361–8. https://doi.org/10.1038/nbt.1533. [PubMed].
26. Hon GC, Hawkins RD, Caballero OL, Lo C, Lister R, Pelizzola M, Valsesia A, Ye Z, Kuan S, Edsall LE, Camargo AA, Stevenson BJ, Ecker JR, et al. Global DNA hypomethylation coupled to repressive chromatin domain formation and gene silencing in breast cancer. Genome Res. 2012; 22: 246–58. https://doi.org/10.1101/gr.125872.111. [PubMed].
27. Rauch TA, Wu X, Zhong X, Riggs AD, Pfeifer GP. A human B cell methylome at 100-base pair resolution. Proc Natl Acad Sci U S A. 2009; 106: 671–8. https://doi.org/10.1073/pnas.0812399106. [PubMed].
28. Maunakea AK, Nagarajan RP, Bilenky M, Ballinger TJ, D'Souza C, Fouse SD, Johnson BE, Hong C, Nielsen C, Zhao Y, Turecki G, Delaney A, Varhol R, et al. Conserved role of intragenic DNA methylation in regulating alternative promoters. Nature. 2010; 466: 253–7. https://doi.org/10.1038/nature09165. [PubMed].
29. Saito Y, Liang G, Egger G, Friedman JM, Chuang JC, Coetzee GA, Jones PA. Specific activation of microRNA-127 with downregulation of the proto-oncogene BCL6 by chromatin-modifying drugs in human cancer cells. Cancer Cell. 2006; 9: 435–43. https://doi.org/10.1016/j.ccr.2006.04.020. [PubMed].
30. Lujambio A, Ropero S, Ballestar E, Fraga MF, Cerrato C, Setién F, Casado S, Suarez-Gauthier A, Sanchez-Cespedes M, Git A, Spiteri I, Das PP, Caldas C, et al. Genetic unmasking of an epigenetically silenced microRNA in human cancer cells. Cancer Res. 2007; 67: 1424–9. https://doi.org/10.1158/0008-5472.CAN-06-4218. [PubMed].
31. Brueckner B, Stresemann C, Kuner R, Mund C, Musch T, Meister M, Sültmann H, Lyko F. The human let-7a-3 locus contains an epigenetically regulated microRNA gene with oncogenic function. Cancer Res. 2007; 67: 1419–23. https://doi.org/10.1158/0008-5472.CAN-06-4074. [PubMed].
32. Cheung HH, Davis AJ, Lee TL, Pang AL, Nagrani S, Rennert OM, Chan WY. Methylation of an intronic region regulates miR-199a in testicular tumor malignancy. Oncogene. 2011; 30: 3404–15. https://doi.org/10.1038/onc.2011.60. [PubMed].
33. Saied MH, Marzec J, Khalid S, Smith P, Down TA, Rakyan VK, Molloy G, Raghavan M, Debernardi S, Young BD. Genome Wide Analysis of Acute Myeloid Leukemia Reveal Leukemia Specific Methylome and Subtype Specific Hypomethylation of Repeats. PLoS One. 2012; 7: e33213. https://doi.org/10.1371/journal.pone.0033213. [PubMed].
34. Shukla S, Kavak E, Gregory M, Imashimizu M, Shutinoski B, Kashlev M, Oberdoerffer P, Sandberg R, Oberdoerffer S. CTCF-promoted RNA polymerase II pausing links DNA methylation to splicing. Nature. 2011; 479: 74–9. https://doi.org/10.1038/nature10442. [PubMed].
35. Elkon R, Ugalde AP, Agami R. Alternative cleavage and polyadenylation: extent, regulation and function. Nat Rev Genet. 2013; 14: 496–506. https://doi.org/10.1038/nrg3482. [PubMed].
36. Schmidl C, Klug M, Boeld TJ, Andreesen R, Hoffmann P, Edinger M, Rehli M. Lineage-specific DNA methylation in T cells correlates with histone methylation and enhancer activity. Genome Res. 2009; 19: 1165–74. https://doi.org/10.1101/gr.091470.109. [PubMed].
37. Xie M, Hong C, Zhang B, Lowdon RF, Xing X, Li D, Zhou X, Lee HJ, Maire CL, Ligon KL, Gascard P, Sigaroudinia M, Tlsty TD, et al. DNA hypomethylation within specific transposable element families associates with tissue-specific enhancer landscape. Nat Genet. 2013; 45: 836–41. https://doi.org/10.1038/ng.2649. [PubMed].
38. Hahn MA, Wu X, Li AX, Hahn T, Pfeifer GP. Relationship between Gene Body DNA Methylation and Intragenic H3K9me3 and H3K36me3 Chromatin Marks. PLoS One. 2011; 6: e18844. https://doi.org/10.1371/journal.pone.0018844. [PubMed].
39. Kulis M, Queirós AC, Beekman R, Martín-Subero JI. Intragenic DNA methylation in transcriptional regulation, normal differentiation and cancer. Biochim Biophys Acta. 2013; 1829: 1161–74. https://doi.org/10.1016/j.bbagrm.2013.08.001. [PubMed].
40. Chinnaiyan AM, Dhanasekaran MS, Kim J, Inventors; University of Michigan, assignee. Dna methylation profiles in cancer. United States patent US 20130022974A1. 2013 Jan 24.
41. Campo E, Swerdlow SH, Harris NL, Pileri S, Stein H, Jaffe ES. The 2008 WHO classification of lymphoid neoplasms and beyond: evolving concepts and practical applications. Blood. 2011; 117: 5019–32. https://doi.org/10.1182/blood-2011-01-293050. [PubMed].
42. Assenov Y, Müller F, Lutsik P, Walter J, Lengauer T, Bock C. Comprehensive analysis of DNA methylation data with RnBeads. Nat Methods. 2014; 11: 1138–40. https://doi.org/10.1038/nmeth.3115. [PubMed].
43. Gentilini D, Scala S, Gaudenzi G, Garagnani P, Capri M, Cescon M, Grazi GL, Bacalini MG, Pisoni S, Dicitore A, Circelli L, Santagata S, Izzo F, et al. Epigenome-wide association study in hepatocellular carcinoma: Identification of stochastic epigenetic mutations through an innovative statistical approach. Oncotarget. 2017; 8: 41890–902. https://doi.org/10.18632/oncotarget.17462. [PubMed].
44. Triche JT. FDb.InfiniumMethylation.hg19: Annotation package for Illumina Infinium DNA methylation probes. R package version 2.2.0. 2014.
45. Smyth GK. Linear Models and Empirical Bayes Methods for Assessing Differential Expression in Microarray Experiments. Stat Appl Genet Mol Biol. 2004; 3: 1–25. https://doi.org/10.2202/1544-6115.1027. [PubMed].
46. Reinius LE, Acevedo N, Joerink M, Pershagen G, Dahlén SE, Greco D, Söderhäll C, Scheynius A, Kere J. Differential DNA methylation in purified human blood cells: implications for cell lineage and studies on disease susceptibility. PLoS One. 2012; 7:e41361. https://doi.org/10.1371/journal.pone.0041361. [PubMed].
47. Smith EN, Ghia EM, DeBoever CM, Rassenti LZ, Jepsen K, Yoon KA, Matsui H, Rozenzhak S, Alakus H, Shepard PJ, Dai Y, Khosroheidari M, Bina M, et al. Genetic and epigenetic profiling of CLL disease progression reveals limited somatic evolution and suggests a relationship to memory-cell development. Blood Cancer J. 2015; 5: e303–e303. https://doi.org/10.1038/bcj.2015.14. [PubMed].
48. Jelinek DF, Tschumper RC, Stolovitzky GA, Iturria SJ, Tu Y, Lepre J, Shah N, Kay NE. Identification of a global gene expression signature of B-chronic lymphocytic leukemia. Mol Cancer Res. 2003; 1: 346–61. [PubMed].
49. Nückel H, Collins CH, Frey UH, Sellmann L, Dürig J, Siffert W, Dü hrsen U. FCRL2 mRNA expression is inversely associated with clinical progression in chronic lymphocytic leukemia. Eur J Haematol. 2009; 83: 541–9. https://doi.org/10.1111/j.1600-0609.2009.01328.x. [PubMed].