
Introduction
The long-term effectiveness of broad-spectrum chemotherapies [1] and molecularly-targeted therapies [2] is mitigated by the evolutionary dynamics of tumor cells, wherein natural selection favors increasingly aggressive and drug-resistant clones. Therapeutic resistance presents one of the universal challenges in cancer treatment and can be attributed to the extensive genetic [3] and phenotypic [4] diversity present within tumor cell populations. Recent achievements in the field of immunotherapy [5–7] to treat advanced cancers have renewed optimism about harnessing the power of the adaptive immune system, and its ability to produce a nearly-unlimited diversity of antigen-recognizing receptors, to achieve lasting therapeutic results [8–10]. The promise of immunomodulatory approaches lies in the potential to confront one dynamic, diversity-rich system (the evolving tumor) with another (the adaptive immune system) [11–14]. Nevertheless, there are challenges to using the immune system to fight cancer: tumors appear to have a diversity of immune-evasion mechanisms that modulate the immune response [15–18]. As we learn more about the biomarkers that identify which immunotherapy approaches have promise for each patient [19–21], these challenges might be successfully addressed by developing a variety of approaches for immunomodulation in diverse patients and circumstances.
The goal of immunotherapy is typically to reverse tumor immune-evasion mechanisms and restore local immune response against cancer cells [22–25]. Cytotoxic T-lymphocyte associated protein 4 (CTLA-4), which represses early T-cell activation, was the first immune checkpoint receptor to be targeted therapeutically [26, 27]. Most recent immunotherapy studies focus on antibodies to block the programmed cell death protein 1 (PD-1) or its ligands (e.g. PD-L1), which have enabled breakthroughs in the treatment of melanoma, non-small cell lung cancer, and renal cell carcinoma [28–31]. These treatments can markedly improve patient survival, but only a minority of patients respond to therapy [32, 33]. Analysis of PD-1 blockade response data reveals increased response in patients with higher tumor PD-L1 expression, and higher PD-1 expression on the tumor infiltrating lymphocytes (TILs) [34]. These facts reaffirm the biological basis for immunotherapy: by reprogramming the suppressed TILs, it is possible to make tumors newly vulnerable to the immune system.
The development of an arsenal of approaches to modulate immune response is dependent on the identification and prioritization of targets that are likely to modulate immune activity in tumors in complementary ways to extant therapies [11–13]. To predict the best immunomodulatory treatment targets that would reverse the suppression of tumor-infiltrating T cells, an approach is needed that evaluates potential immunomodulatory interactions with T cells in the tumor microenvironment [35–37], analogous to approaches outside the realm of immunotherapy that identify targets based on functional associations of disease [38]. We reasoned that immunomodulatory targets would have to be relatively abundantly expressed in tumor-infiltrating T cells. Accordingly, we used mRNA expression of the pan T-cell marker CD3E as a metric for T-cell abundance within a tumor [12], and examined correlations between expression of CD3E and putative targets across 9,601 human tumors spanning 31 cancer types. We deemed genes whose expression is highly correlated with CD3E—and therefore are likely to be expressed in T cells within the tumor microenvironment—to be promising targets for therapy. We further reasoned that the most complementary targets would be those that are not co-expressed in common with PDCD1 (the gene coding for PD-1), as they might function in individuals for whom anti-PD-1 therapy is insufficient or inviable. Therefore, we also examined the correlation of putative targets with PDCD1 expression. We identified targets with high CD3E correlation and relatively low PDCD1 correlation, suggestive of the presence of T cells with low PD-1 expression. These immune-related genes could potentially be new targets for therapy complementary to PD-1 blockade therapy. Lastly, we extended our analysis to consider complementarity to therapies directed at both PD-1 and CTLA-4.
Results
T-cell associated genes exhibit consistent expression in tumor microenvironments across cancer types
We generated a heat map to indicate the strength of correlation in expression between each gene in a 40-gene candidate panel and the pan T-cell marker CD3E, across 31 cancer types. Candidate genes were selected based on expert knowledge for their known functional relevance in T-cell function and their known effects on CD8 T-cell function. CD3E was selected as a T-cell marker because of its relatively reliable and broad expression in T cells. Analyses using genes encoding other components of CD3 gave similar results (Supplementary Figure 1). Differentiating between CD4+ and CD8+ T-cell markers did result in different rankings, consistent with evidence that these T-cell types play divergent roles in the tumor microenvironment [39–42]. We chose not to use a combination of genes in a signature-based analysis because we did not want our search for new targets to be biased by a predefined gene signature. Four of the candidate genes we examined showed more highly correlated expression with CD3E than was exhibited by the sometimes highly effective immunotherapy target and checkpoint inhibitor PDCD1. Another successful immunotherapy target, CTLA4, ranks eighth on the list of candidate genes in terms of how strongly correlated its co-expression is with the CD3E T-cell marker (Figure 1A). Genes tend to show highly consistent CD3E co-expression patterns across the 31 cancer types studied (Figure 1A). Additional potential gene targets are identified that have more highly correlated expression with CD3E than PDCD1 (ranked #55) and CTLA4 (ranked #103) when we expanded the list of studied genes from our 40-candidate list to all genes known to be expressed in cancer (Figure 1B, Supplementary Figure 2). Promisingly, these genes tend to have known immune regulatory functions (Table 1). The gene for the co-stimulatory cell-adhesion molecule CD2 ranks at the top of both the candidate and exome-wide lists.
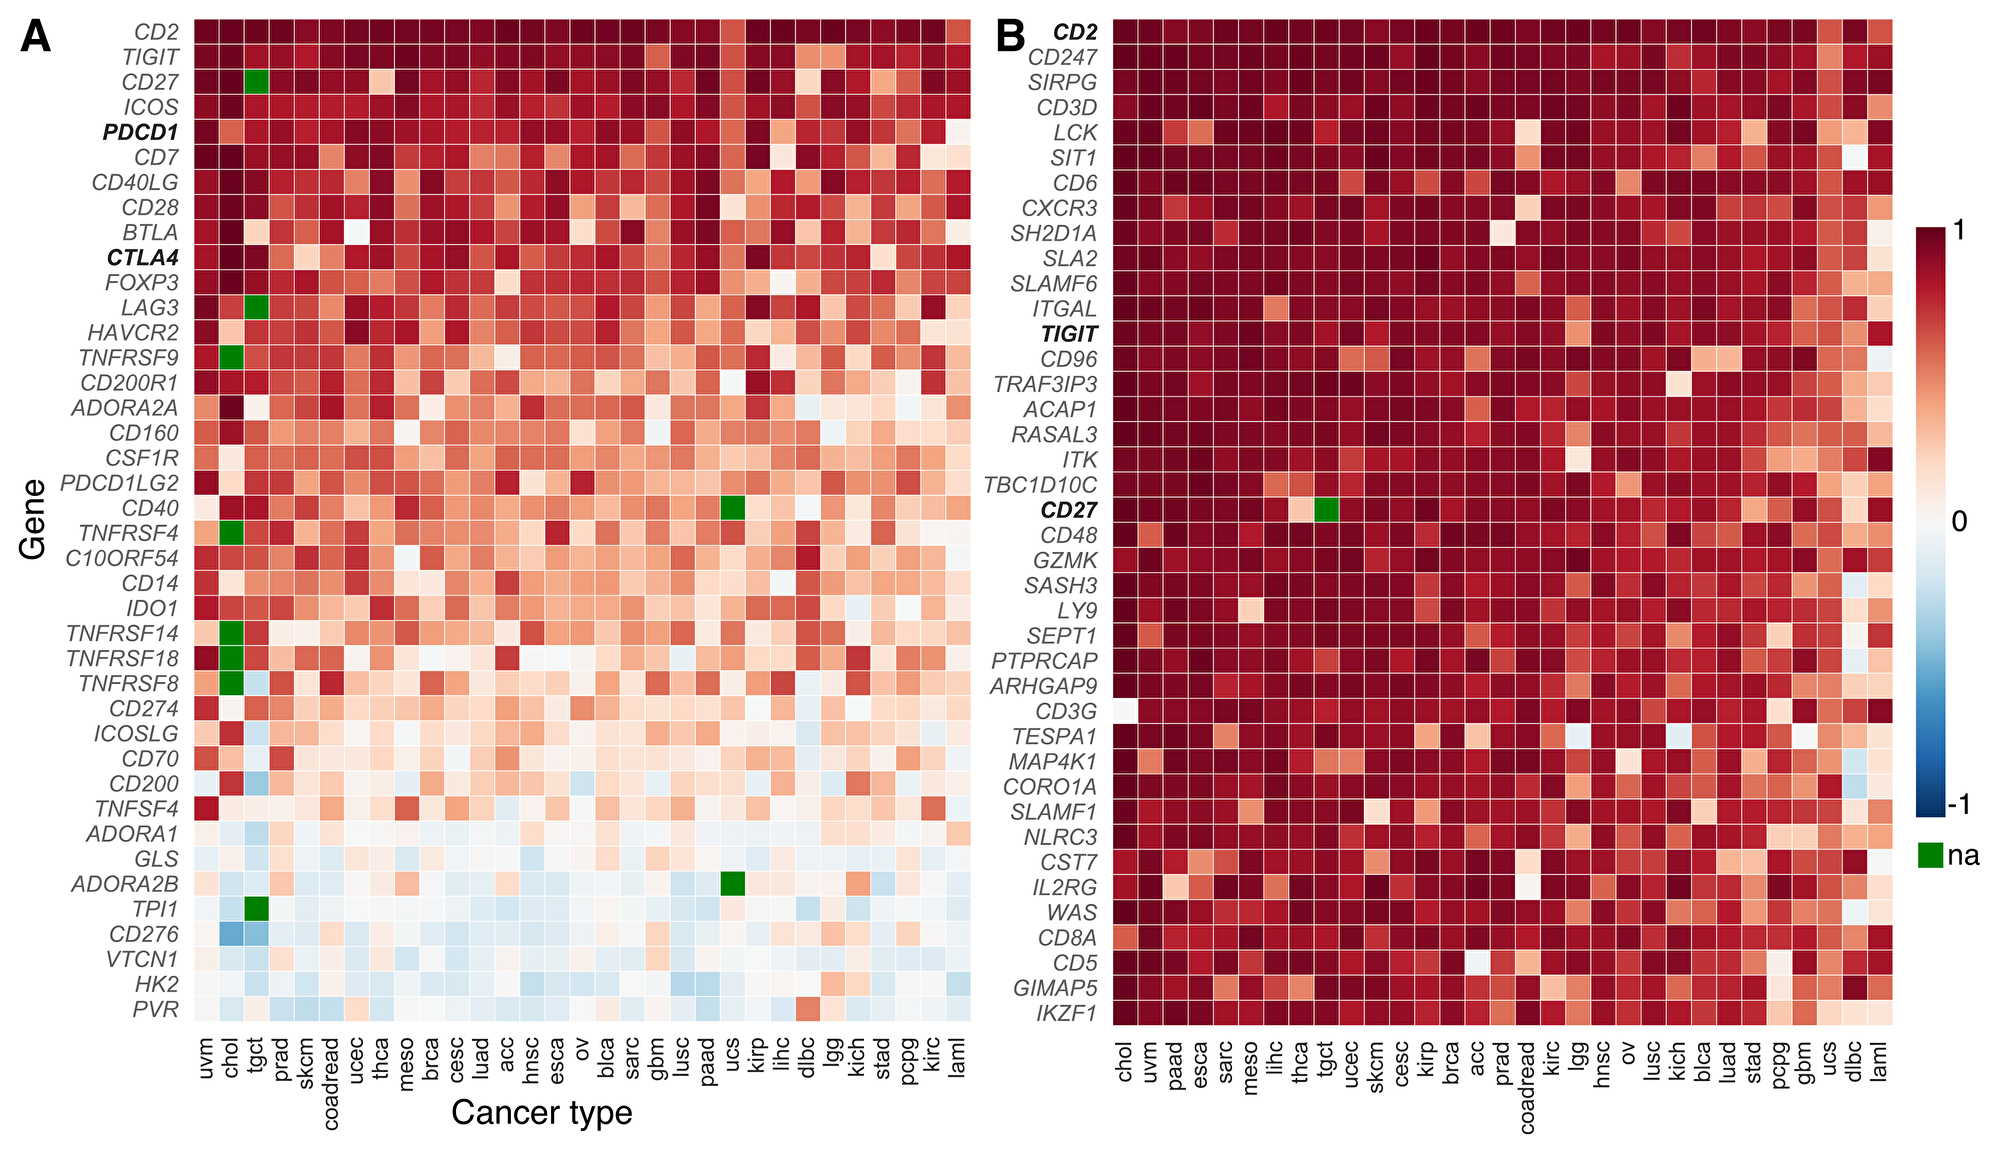
Figure 1: CD3E co-expression across cancer types (TCGA abbreviations; Supplementary Table 2). Among the (A) 40 candidate genes of the gene panel, several candidate genes show more correlated co-expression with the pan T-cell marker CD3E than successfully-targeted immune checkpoints like PDCD1 and CTLA4 (shown in bold). Candidate genes show remarkable consistency in their co-expression patterns across a variety of cancer types. Correlation coefficients in (B) a cancer exome-wide analysis reveal many genes that are highly-correlated with gene expression of pan T-cell marker CD3E in the tumor microenvironment. Higher correlation in expression than exhibited by PDCD1 and CTLA4 is observed in 54 and 102 genes, respectively. The gene CD2 tops both lists. Only two other candidate genes (TIGIT and CD27, shown in bold) fall in the top-50 ranking in the exome-wide analysis (#13 and #20; Supplementary Figure 2). The color of each tile indicates correlation with CD3E expression, (blue, low to red, high; green: not assayed). The genes are ranked according to the median of correlation coefficients across cancer types. Candidate genes from the gene panel are shown in bold.
Table 1: Genes with highest CD3E co-expression in exome-wide analysis
| Ranka | Symbol | Pearson’s r | Gene descriptionb | Panel?c |
|---|---|---|---|---|
| 1 | CD2 | 0.955 | T-cell surface antigen CD2 | ✓ |
| 2 | CD247 | 0.944 | T-cell receptor T3 zeta chain | |
| 3 | SIRPG | 0.942 | signal-regulatory protein gamma; CD172g antigen | |
| 4 | CD3D | 0.933 | T-cell surface glycoprotein CD3 delta chain | |
| 5 | LCK | 0.918 | lymphocyte-specific protein tyrosine kinase | |
| 6 | SIT1 | 0.917 | signaling threshold regulating transmembrane adaptor 1 | |
| 7 | CD6 | 0.912 | T-cell differentiation antigen CD6 | |
| 8 | CXCR3 | 0.910 | chemokine (C-X-C motif) receptor 3 | |
| 9 | SH2D1A | 0.907 | T-cell signal transduction molecule SAP | |
| 10 | SLA2 | 0.904 | Src-like-adaptor 2; modulator of antigen receptor signaling | |
| 11 | SLAMF6 | 0.902 | SLAM family member 6; activating NK receptor | |
| 12 | ITGAL | 0.897 | antigen CD11A (p180), lymphocyte function-associated antigen 1 | |
| 13 | TIGIT | 0.896 | T cell immunoreceptor with Ig and ITIM domains | ✓ |
| 14 | CD96 | 0.896 | T cell activation, increased late expression | |
| 15 | TRAF3IP3 | 0.892 | TRAF3-interacting JNK-activating modulator | |
| 16 | ACAP1 | 0.882 | ArfGAP with coiled-coil, ankyrin repeat and PH domains 1 | |
| 17 | RASAL3 | 0.882 | RAS protein activator like 3 | |
| 18 | ITK | 0.879 | interleukin-2-inducible T cell kinase | |
| 19 | TBC1D10C | 0.879 | carabin; TBC1 domain family, member 10C; RAS signaling inhibitor | |
| 20 | CD27 | 0.877 | T-cell activation antigen CD27 | ✓ |
| 21 | CD48 | 0.872 | CD48 antigen (B-cell membrane protein) | |
| 22 | GZMK | 0.870 | granzyme K (granzyme 3; tryptase II) | |
| 23 | SASH3 | 0.865 | SAM and SH3 domain containing 3 | |
| 24 | LY9 | 0.865 | lymphocyte antigen 9 | |
| 25 | SEPT1 | 0.865 | septin 1; serologically defined breast cancer antigen NY-BR-24 | |
| 26 | PTPRCAP | 0.862 | protein tyrosine phosphatase, receptor type, C-associated protein | |
| 27 | ARHGAP9 | 0.858 | Rho GTPase activating protein 9 | |
| 28 | CD3G | 0.857 | T-cell receptor T3 gamma chain | |
| 29 | TESPA1 | 0.856 | thymocyte expressed, positive selection associated 1 | |
| 30 | MAP4K1 | 0.854 | MAPK/ERK kinase kinase kinase 1 | |
| 31 | CORO1A | 0.842 | coronin, actin binding protein, 1A | |
| 32 | SLAMF1 | 0.841 | signaling lymphocytic activation molecule family member 1 | |
| 33 | NLRC3 | 0.839 | NLR family, CARD domain containing 3 | |
| 34 | CST7 | 0.838 | cystatin F; leukocystatin | |
| 35 | IL2RG | 0.838 | interleukin 2 receptor, gamma | |
| 36 | WAS | 0.837 | Wiskott-Aldrich syndrome | |
| 37 | CD8A | 0.834 | T-cell surface glycoprotein CD8 alpha chain | |
| 38 | CD5 | 0.829 | CD5 antigen (p56-62) | |
| 39 | GIMAP5 | 0.828 | immunity-associated nucleotide 5 protein | |
| 40 | IKZF1 | 0.828 | IKAROS family zinc finger 1 (Ikaros) | |
| 41 | ZAP70 | 0.828 | zeta chain of T-cell receptor associated protein kinase 70 | |
| 42 | KLRK1 | 0.827 | killer cell lectin like receptor K1 | |
| 43 | CCL5 | 0.827 | C-C motif chemokine ligand 5 | |
| 44 | GPR171 | 0.826 | G protein-coupled receptor 171 | |
| 45 | PVRIG | 0.825 | transmembrane protein PVRIG; CD112 receptor | |
| 46 | PTPN7 | 0.824 | protein tyrosine phosphatase, non-receptor type 7 | |
| 47 | CXCR6 | 0.823 | C-X-C motif chemokine receptor 6 | |
| 48 | EVI2B | 0.823 | ecotropic viral integration site 2B | |
| 49 | CCR5 | 0.819 | C-C motif chemokine receptor 5 | |
| 50 | GZMA | 0.815 | granzyme A; Cytotoxic T-lymphocyte-associated serine esterase-3 | |
| 51 | ICOS | 0.815 | inducible T-cell co-stimulator | ✓ |
| 52 | GRAP2 | 0.813 | GRB2-related adaptor protein 2 | |
| 53 | PTPRC | 0.808 | CD45; protein tyrosine phosphatase, receptor type, C | |
| 54 | GIMAP4 | 0.806 | GTPase, immunity-associated protein 4 | |
| 55 | PDCD1 | 0.806 | programmed cell death 1 | ✓ |
| 103 | CTLA4 | 0.727 | cytotoxic T-lymphocyte associated protein 4 | ✓ |
Candidate gene targets to complement anti-PD1 therapies
We re-ranked the 40-candidate gene panel and the exome-wide gene lists, using a “PDCD1-complementarity score” that simultaneously considers the strength of correlation between the gene target and CD3E (as above), and the strength of correlation in gene expression between the target and PDCD1. This re-ranking provided a list of genes that could potentially serve not only as effective therapeutic targets in general, but as complementary therapies to anti-PD-1 therapy, in that they might be especially effective for patients whose tumors do not respond to anti-PD-1 therapy. Genes with the highest PDCD1-complementarity score were highly correlated in expression with CD3E and less correlated with PDCD1 expression (Figure 2A, Supplementary Figure 3). When taking complementarity to PDCD1 into account, the C-C chemokine receptor type 7 gene CCR7 tops the list, and CD2 ranks #24. Among genes in our 40-candidate panel, CD40LG, CD2, and BTLA remain highly complementary in our joint analysis of complementarity to therapies directed at PDCD1 and to CTLA4 (Figure 2B–2D, Supplementary Figure 4).
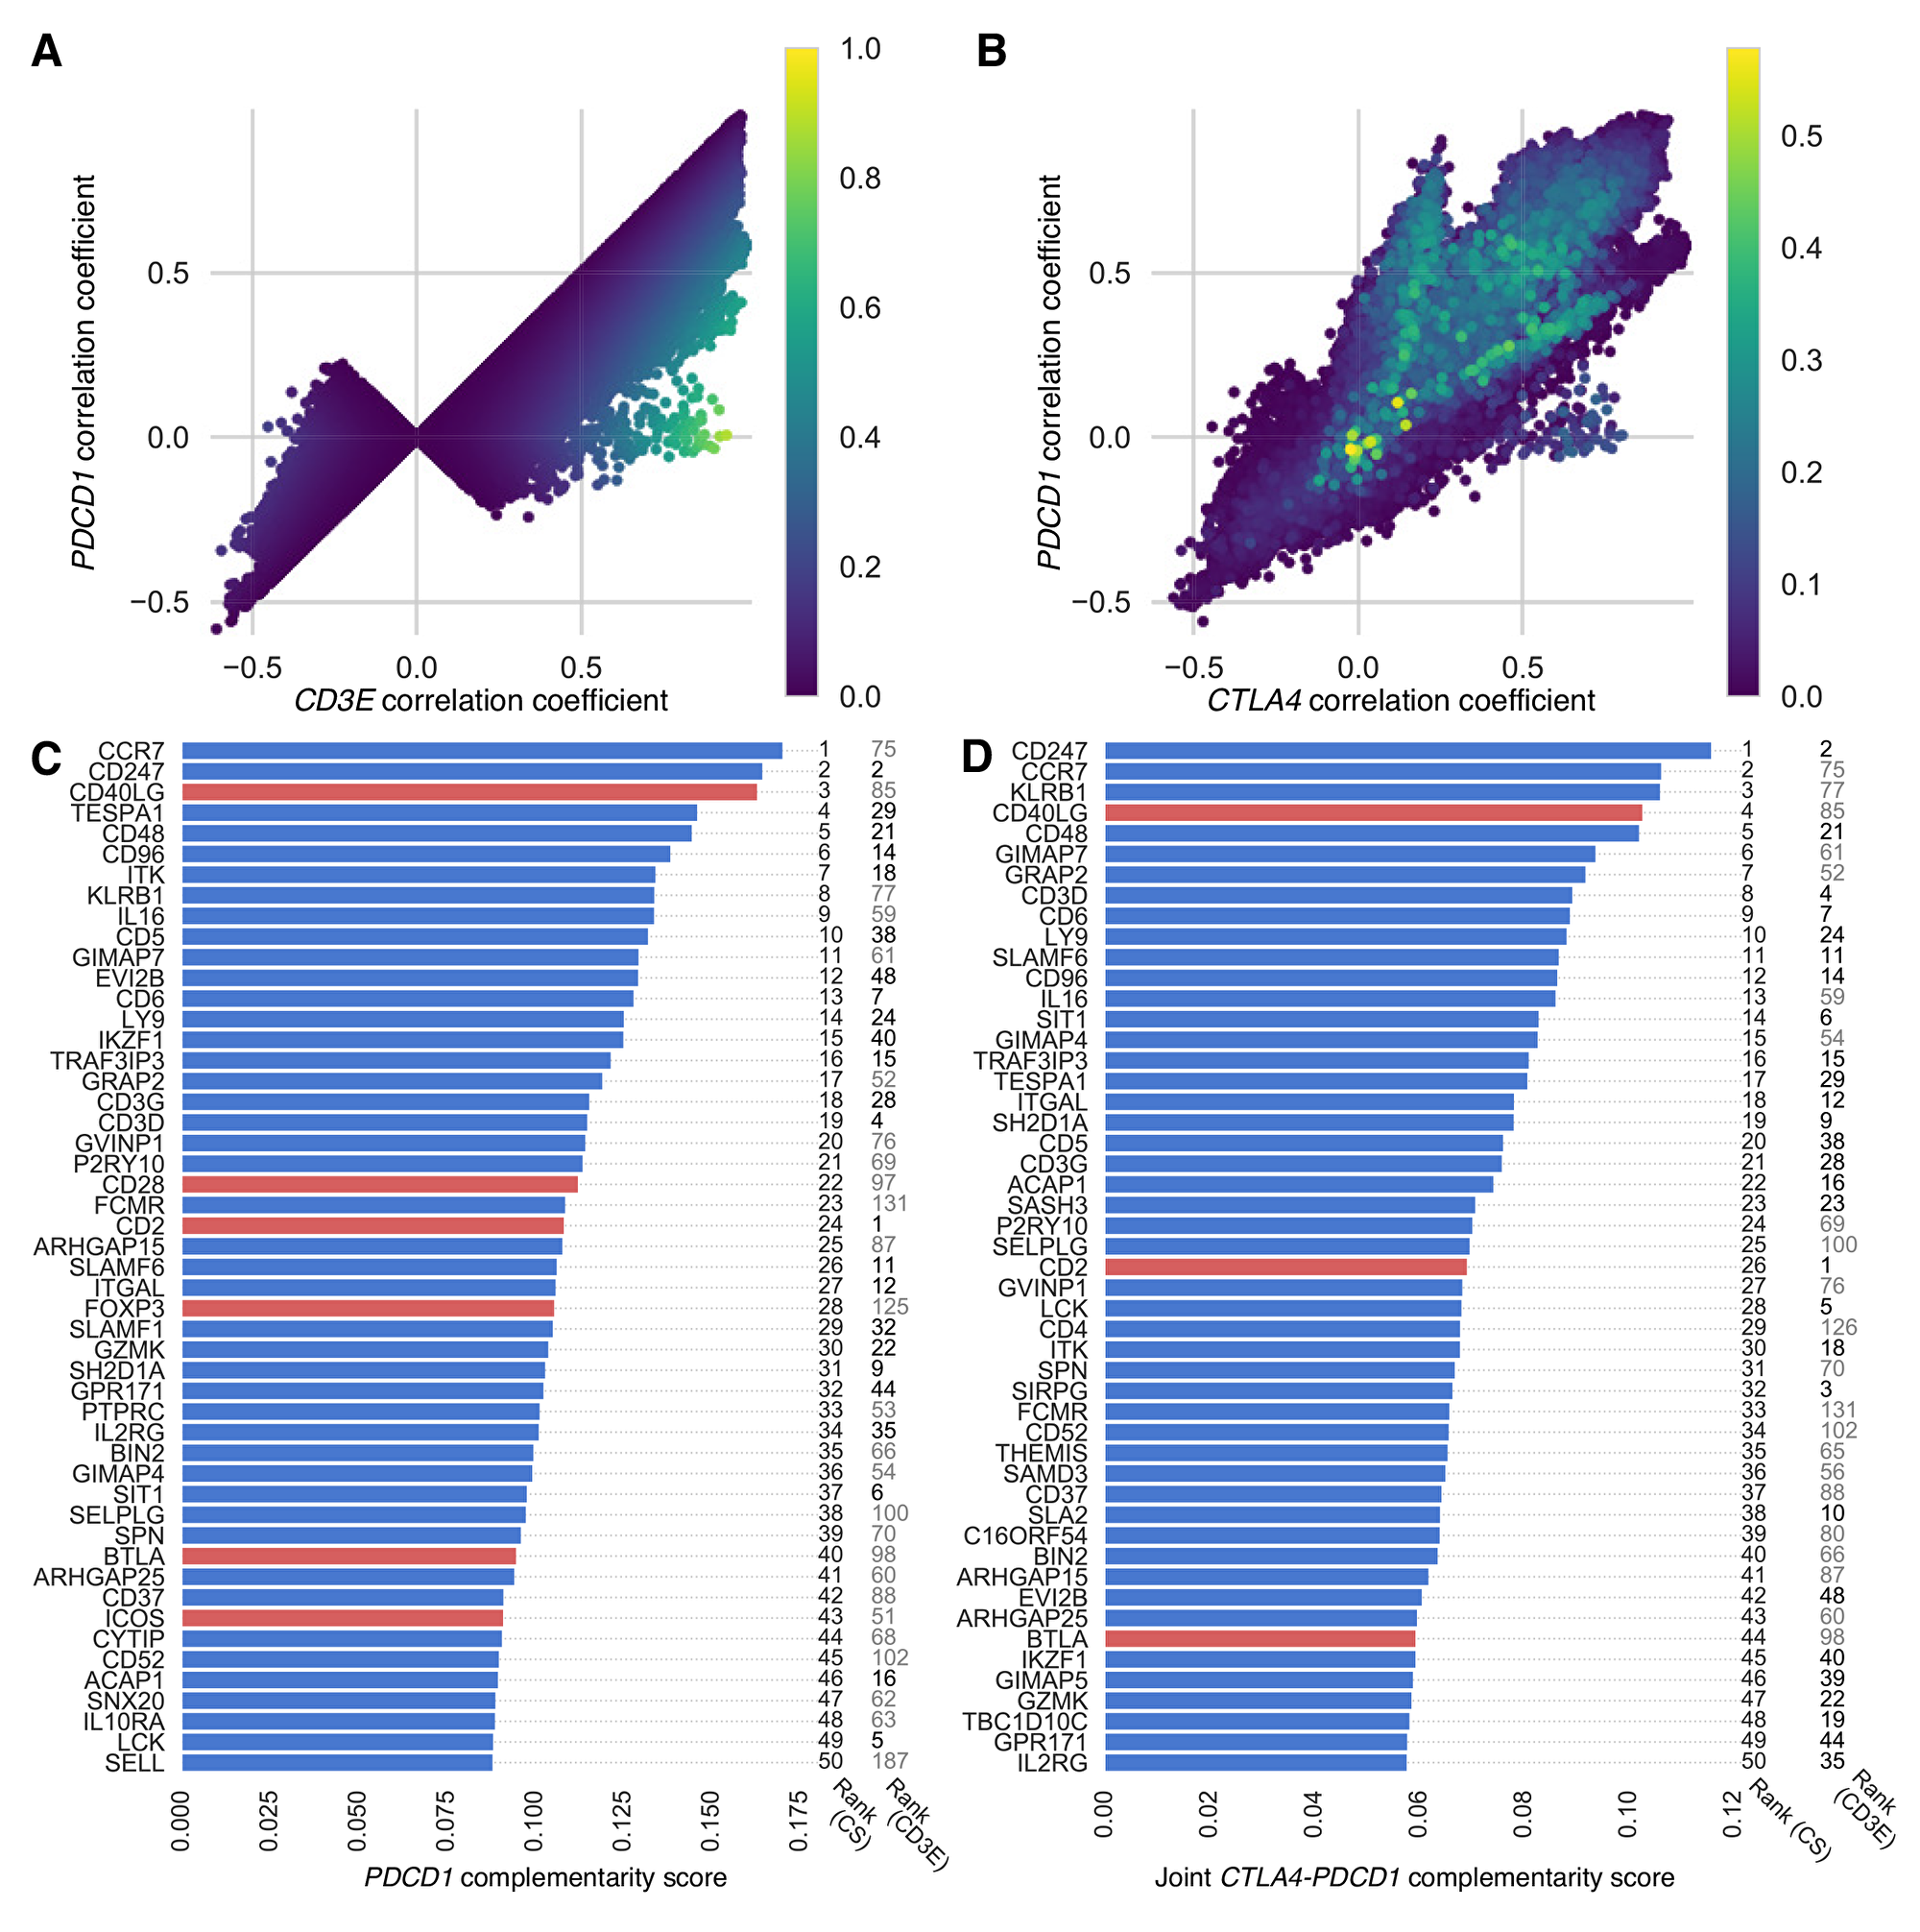
Figure 2: PDCD1-complementarity and joint CTLA4-PDCD1 complementarity scores of exome-wide gene list. Scatter plots show correlations for each target gene, with results from each cancer type superimposed and colored (blue, low to yellow, high) according to (A) PDCD1-complementarity score, which is high when expression of CD3E and PDCD1 are respectively correlated and uncorrelated with the target gene—genes with the highest PDCD1-complementarity scores are highly correlated with CD3E (approaching one on the x-axis) and less correlated with PDCD1 (approaching zero on the y-axis); and (B) joint CTLA4-PDCD1 complementarity score (including only scores above zero), which is high when expression of CD3E is correlated with the target gene and expression of PDCD1 and CTLA4 are uncorrelated with the target gene. Genes with the highest joint complementarity scores have close to zero correlation in expression with both CTLA4 and PDCD1. Bar plots show the top 50 genes ranked according to (C) their median PDCD1-complementarity score and (D) their joint CTLA4-PDCD1 complementarity score across cancer types. Top candidate genes (red bars) and top genes from the cancer exome (blue bars) are shown. To the right of each bar is its ranking based on complementarity score (CS) and CD3E co-expression (CD3E). Ranks up to 50 are in boldface.
GSEA pathway enrichment analysis of the exome-wide gene list ranked by CD3E co-expression revealed significant enrichment of immune-related pathways (Table 2; Supplementary Table 1). The top 50 pathways all have FDR Q value below 1 × 10⁻⁵, ranked by normalized enrichment scores in the range 2.06–2.38. The top-ranked pathway is TCR signaling in naïve CD4+ T cells (curated by the Pathway Interaction Database, Supplementary Figure 5). Other pathways of interest include the CD8 TCR pathway, numerous immunoregulatory interactions, natural killer cell mediated cytotoxicity, and costimulation by the CD28 family; PD-1 has recently been demonstrated to exert its primary effect via regulation of CD28 [43–45].
Table 2: The top ten enriched pathways from GSEA
| Rank | Pathway name | NESa |
|---|---|---|
| 1 | TCR pathway (PID) | 2.383 |
| 2 | CD8 TCR pathway (PID) | 2.366 |
| 3 | Immunoregulatory interactions between lymphoid & non-lymphoid cells (REACTOME) | 2.360 |
| 4 | Hematopoietic cell lineage (KEGG) | 2.315 |
| 5 | Class A1 rhodopsin like receptors (REACTOME) | 2.302 |
| 6 | Interferon gamma signaling (REACTOME) | 2.302 |
| 7 | Natural killer cell mediated cytotoxicity (KEGG) | 2.300 |
| 8 | Cell adhesion molecules cams (KEGG) | 2.280 |
| 9 | Cytokine cytokine receptor interaction (KEGG) | 2.259 |
| 10 | Costimulation by the CD28 family (REACTOME) | 2.251 |
Patients with response to anti-PD1 therapy have higher correlation between PDCD1 and CD3E expression than non-responders
To examine how the relationship between CD3E expression and PDCD1 expression influences response to anti-PD-1 therapy, we analyzed RNA-Seq transcriptome data from pretreatment samples of 26 metastatic melanoma patients who received anti-PD-1 therapy [82]. Patients had been categorized as ‘responders’ (n = 10 who experienced partial response, n = 4 who experienced complete response) and ‘non-responders’ (n = 12 who experienced progressive disease). Comparing CD3E and PDCD1 expression among responders and non-responders, we find higher correlation among responders than non-responders (Figure 3A). Among the ‘responder’ patients, the Pearson’s correlation coefficient for transcript per million (TPM) expression values for CD3E and PDCD1 is 0.998, while ‘non-responders’ have a lower correlation coefficient of 0.688. A linear regression of these expression values for responders yields an R2 statistic of 0.997, compared to a value of 0.473 for non-responders, indicating that a linear model has over twice the explanatory power for responders than non-responders. Squared residuals from the linear regressions are significantly lower for responders than non-responders (Figure 3B; P = 0.003, Mann–Whitney U test). One patient in the cohort, a responder, was an outlier with very high PDCD1 and CD3E expression values (Figure 3A). When this patient is excluded from the analysis, the pattern holds. Analysis of the responder cohort excluding the outlier yields a CD3E-PDCD1 correlation coefficient of 0.931, R2 of 0.868, and squared residuals from the linear regression remain significantly lower than non-responders; P = 0.005. These findings support our hypothesis that the immune regulatory genes we have discovered with highly correlated expression with CD3E may be promising candidates for new targeted-therapies.
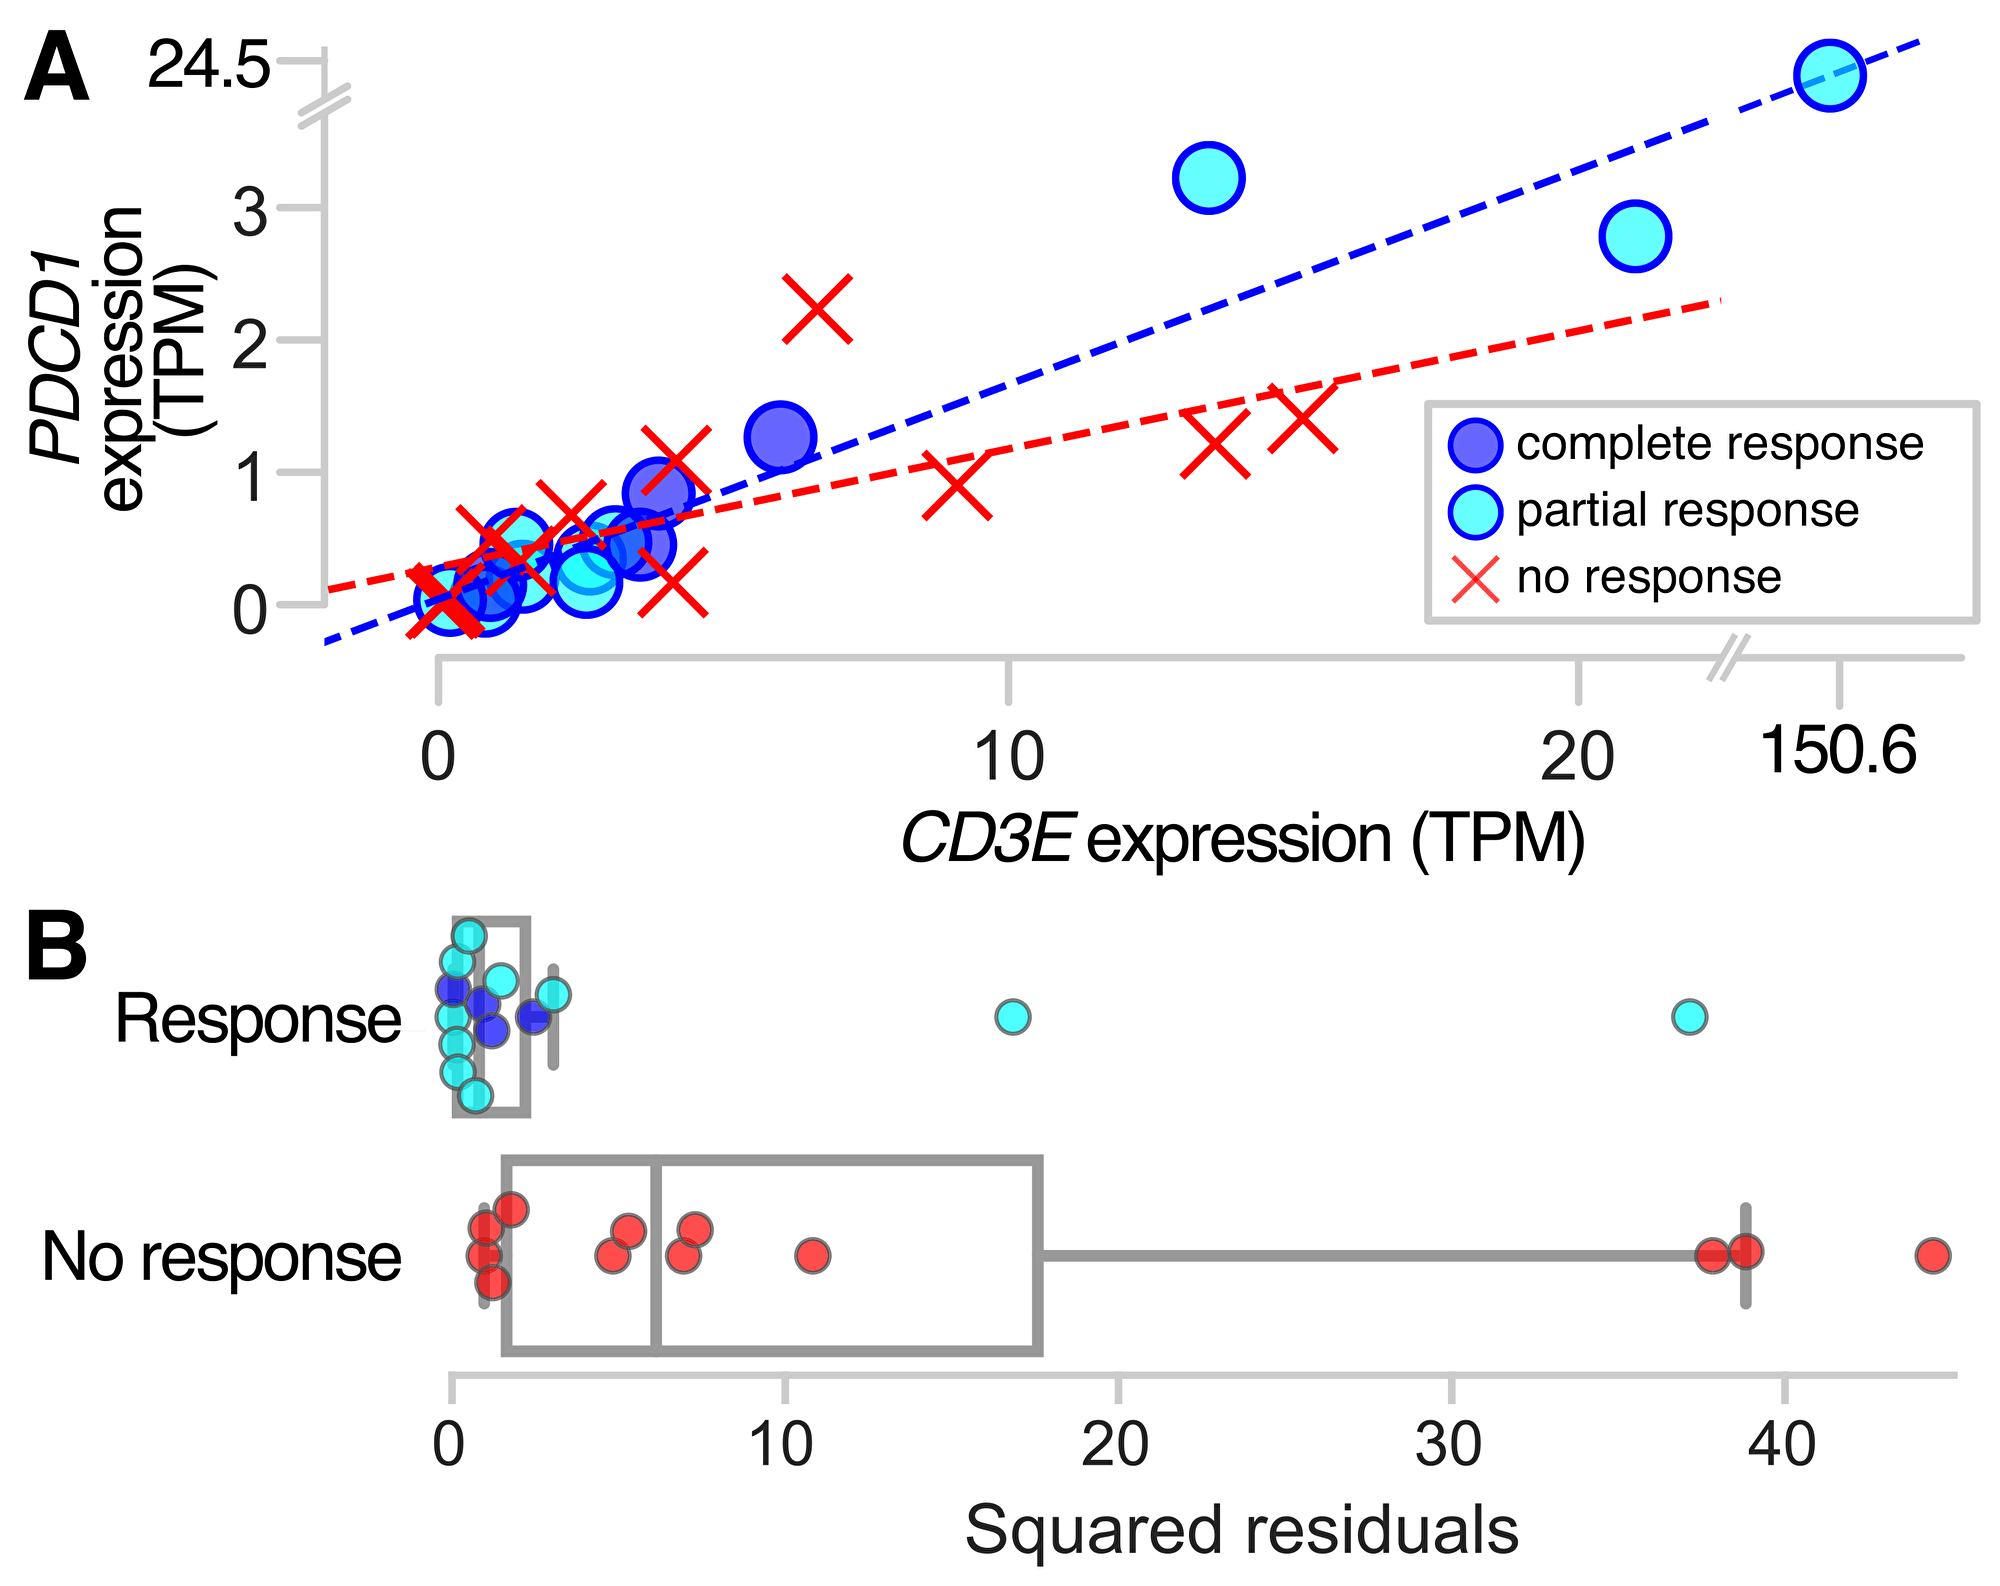
Figure 3: PDCD1 and CD3E expression in responders and non-responders to anti-PD-1 therapy. Pretreatment samples from metastatic melanoma patients who ultimately responded to anti-PD-1 therapy show more highly correlated co-expression between PDCD1 and the pan T-cell marker CD3E, as indicated by (A) a linear regression of the expression values for responders with a coefficient of determination R2 = 0.997, compared to R2 = 0.473 for non-responders; and (B) squared residuals from the linear regression of CD3E and PDCD1 that are significantly lower for responders than non-responders (P = 0.003).
DISCUSSION
We examined a 40-gene panel of candidate immune regulators and an unbiased list of 12,082 expressed genes in cancer to find genes consistently co-expressed with the T-cell marker CD3E in the tumor microenvironment. We found that expression patterns were remarkably consistent across the 31 cancer types analyzed, and that the top genes were highly enriched within immune-related pathways, indicating that tumor-infiltrating T cells may have universal characteristics that could be targeted effectively in multiple cancers. We also identified T-cell associated genes whose expression patterns do not correlate highly with PCDC1 that might be targeted for development of complementary therapies to anti-PD-1, or for patients who do not respond to anti-PD-1 therapy. When we examined anti-PD-1 responders and non-responders in metastatic melanoma, we found that responders had a significantly higher correlation between CD3E and PDCD1 than did non-responders, which supports the hypothesis that correlation in expression with CD3E in the tumor microenvironment can be a useful criterion for identifying new therapeutic targets with potential for therapeutic response. It has been shown that although PD-L1 expression in tumor biopsies does appear to predict response to anti-PD-1 therapies, many tumors predicted as PD-L1 positive do not respond, while some responses occur in PD-L1-negative tumors [46–51]. Our results are similar in that we find that some patients with high CD3E-PDCD1 correlation are not responders, whereas others with lower correlation do respond to anti-PD1 therapy. Also, when we performed a similar analysis on response to immune checkpoint therapies among patients with clear cell renal carcinoma, we did not find significant differences in CD3E-PDCD1 correlation in responders and non-responders [52]. More detailed expression analyses of responders and non-responders in additional cancer types will help to shed light on additional genetic and tumor microenvironmental factors that influence response to new and existing and therapies [52, 53].
As a purely correlation-based approach, our exome-wide expression analysis is very coarse-grained, and does not incorporate multi-omic pharmacogenomic data [54] or the specific molecular biology of the genes identified. Extensive molecular biological research on their functional and structural properties is required to assess their viability as immunomodulatory targets [55, 56]. However, the guidance provided by our approach complements extant molecular biological investigation, highlighting well-studied genes that deserve continued attention as well as pointing out genes whose molecular biology is less well known, but which could be important for future research. While a subset of these genes will lack exploitable properties or would produce undesirable outcomes if they were targeted, it is also likely that novel and complementary targets that do have high potential are highlighted by our analysis. Furthermore, the consistency of the results of our analysis across cancer types inspires confidence that successful targeting of the genes could yield a high breadth of therapeutic applicability either alone or in combination with other therapies.
Among the more well-studied genes with potential for targeting, some have been previously identified by other approaches. CD6, a known T-cell co-stimulatory molecule, was identified in the exome-wide analysis as being co-expressed with CD3E. The binding of CD6 to CD166 (also called ALCAM: activated leukocyte-cell adhesion molecule) enables formation of a functional immune synapse. Indeed, an antibody that particularly antagonizes the function of CD6—Itolizumab—is under investigation for use as an anti-inflammatory in psoriasis patients [57, 58]. This antibody presents a possibility of stabilizing (i.e. agonizing) the CD6:CD166 interaction in the immune synapse so as to stimulate effector T-cell function. Of course, the systemic consequences of such an agent might outweigh the local benefits of a productive anti-tumor immune response.
Other well-studied targets are encoded by TIGIT and CD96 [59, 60], which were similarly highly co-expressed with CD3E, and are known to inhibit effector T-cell activation. TIGIT and CD96 compete against the stimulatory receptor CD226 for shared ligands (i.e. CD155) and thus suppress CD226 activation [61]. TIGIT can suppress effector T-cell function by directly suppressing CD226 in cis or suppress APC function by signaling through CD155 in trans [62]. TIGIT and CD96 both suppress natural killer (NK) cell function as well [63, 64], and animal models of CD96 knockout mice revealed hyperinflammatory status with increased IFN-γ production in NK cells [64]. These mice are also resistant to a experimental lung metastasis model, suggesting a potential therapeutic role of CD96 blockade in cancer treatment [65]. TIGIT is known to additionally result in immunosuppression mediated by T regulatory cells (via secretion of IL-10 and TGF-β) [66]. Immunoregulatory function of TIGIT was shown to occur as a consequence of engagement with CD155 on dendritic cells, which results in increase IL-10 production, suppressing the effector T cells while promoting regulatory T cells [62]. Given the known functions of these receptors, the CD3E co-expression data reported here provides additional rationale for the development of selective antagonists and context for potential therapeutic application.
Expression of SLAMF6 (also called Ly108)—a CD2 family member that plays a critical role in NK-cell development and activation—is also correlated with CD3E expression. SLAMF6 is known to be expressed on T cells, and its co-stimulation was shown to drive naïve CD4+ T cells toward a Th1 phenotype, inducing IFN-γ production [67]. SLAMF6 educates NK cells by forming homodimers at a synapse between cells. This homodimerization reduces NK-cell activity toward hematopoietic (i.e. SLAMF6+) cells while enhancing activity toward non-hematopoietic (SLAMF6−) tumor cells [68]. During development, SLAMF6 also reduces NK-cell differentiation and proliferation [69, 70]. Antibodies targeting SLAMF6 have demonstrated efficacy in mouse oncology models [71], underscoring the therapeutic potential of targeting this receptor and highlighting the potential of NK cells to play a critical role in anti-tumor immunity.
Additional immunotherapy-relevant patterns emerge when the genes that are highly ranked in our analyses are considered in aggregate. For instance, the high rank of the NK-cell mediated cytotoxicity pathway in the GSEA analysis, as well as pathways that include NK-cell associated proteins (e.g. SLAMF6), could reflect the prevalence of MHC loss or reduction in T-cell rich tumors. Loss or reduction of MHC is an emerging mechanism of immune evasion by tumor cells [72–74]. MHC loss or reduction would simultaneously be expected to reduce presentation of tumor-associated antigens to the T cells and, conversely, to make the tumor cells more susceptible to NK-cell targeting. This implication of susceptibility indicates potential value in stimulating NK-cell activation toward tumor cells that have lost MHC expression. Our analysis does not partition gene expression associations among the various T-cell populations (e.g. conventional ab T cells, gd T cells or NK T cells), but future work could examine correlations within partitions.
Our analysis informs immunomodulatory target selection for tumors with infiltrating T cells but low PDCD1 expression. Other target-identification efforts could be aimed at recruiting T cells to the tumor or eliminating physical barriers (e.g. extracellular matrix) that limit the ability of effector T cells to exert cytotoxic effects on the tumor cell directly. It is possible that both approaches will be required in concert to ultimately drive the desired response in patients. For example, the remarkable success of chimeric-antigen receptor T-cell therapy (CAR-T therapy) in leukemias has been contrasted against more limited effects in solid tumors and some lymphomas. Targets identified in this report could also be relevant to the engineering of T cells to target solid tumors. Limited efficacy of CAR-T therapy in solid tumors might arise due to local signals that suppress cytotoxic effects upon arrival of the engineered T cells to the tumor microenvironment. The targets and pathways identified in this report might provide guidance regarding engineering approaches (i.e. Cas9-mediated knockouts or expression of decoy receptors) that could be applied where traditional antibody and small-molecule inhibitors are not feasible.
Immunotherapy approaches have produced some remarkable therapeutic successes, yet there is much uncharted territory left to explore. By identifying genes expressed in common with T-cell markers within the tumor microenvironments of 9,601 patients and 31 types of cancer, our work helps to map the boundaries of this landscape, narrowing the list of gene candidates for new therapeutic targets. Continued research will map out the immune composition and dynamic nature of the tumor microenvironment—providing opportunities to identify novel and complementary targets, and expanding the efficacy of therapeutics and the breadth of patients who benefit.
Materials and Methods
Detecting T-cell associated gene expression in the tumor microenvironment
RNA-Seq V2 data from 31 tumor types (including 9601 tumor samples total) were obtained from The Cancer Genome Atlas (TCGA) using the open platform cBio Cancer Genomics Portal [75, 76] in the form of RSEM z-scores. Though available from this source, we excluded thymoma from our analysis because tumors of the thymus (where T cells mature) are known to directly alter the T-cell composition [77]. To find candidate genes expressed by T cells in the tumor microenvironment, we generated lists of genes for each cancer type, ranked by the strength of their correlation with CD3E expression, a pan T-cell marker [78]. Pearson product-moment correlation coefficients were calculated using the corrcoef method of Python’s numpy library, applied to all tumors with expression values for both CD3E and a given gene of interest. A weak correlation between a candidate gene and the T-cell marker could indicate that not all T cells in the tumor express the gene, that there is variability in the amount of expression among T cells in the tumor, and/or that cells other than T cells in the tumor are expressing the gene. Each of these possibilities could have implications for the effectiveness of T-cell-based targeted therapy, and all support the conclusion that targets with weaker correlations may be less successful than targets with stronger correlations.
We first performed this analysis on a candidate gene panel of 40 known immune-associated genes, and then we extended the analysis to an unbiased ranking of the cancer exome (12082 genes found to be expressed in cancer) [79]. The candidate gene panel included costimulatory genes (CD2, CD27, CD28, TNFRSF8, CD40, CD40LG, CD70, ICOS, ICOSLG, TNFRSF4, TNFSF4, TNFRSF9), putative T-cell inhibitory genes (CTLA4, PDCD1, CD274, PDCD1LG2, VSIR, CD160, TNFRSF14, CD200, CD200R1, TIGIT, CD276, VTCN1, BTLA, LAG3, HAVCR2), regulatory markers (FOXP3, TNFRSF18), and metabolic checkpoints (ADORA1, ADORA2A, ADORA2B, HK2, GLS, IDO1, TPI1). We also included several myeloid cell-related immune checkpoints (CD14, CSF1R, KIR2DL1, PVR), based on their involvement in the complex cell-cell interaction within the tumor microenvironment.
Identifying candidate gene targets to complement anti-PD1 therapies
We developed a scoring metric to rank candidate genes according to their potential usefulness as alternative or complementary targets to PDCD1, an immune checkpoint gene that has already been successfully targeted in several cancer types. This metric, which we term ‘PDCD1 complementarity score’, takes into account each gene’s strength of correlation with CD3E expression (to indicate consistent expression by T cells in the tumor microenvironment), and also minimizes the overlap in expression pattern with PDCD1. The goal of this analysis is to identify genes that will potentially be useful as targets for combined immunotherapy and/or for the subset of patients who do not respond to anti-PD-1 therapy. The promise of a target gene can be quantified with a function of the co-expressions of two pairs of genes: the target gene and CD3E; and the target gene and PDCD1, by the score
Identifying candidate gene targets to complement anti-PD1 and anti-CTLA-4 therapies
To identify genes that could be complementary to CTLA4 as well as PDCD1, we extended the complementarity score to include co-expression with CTLA4. The joint complementarity score for a candidate gene was quantified as
Gene set enrichment analysis
To identify overrepresented pathways among genes with high CD3E co-expression, we used the gene- set enrichment software GSEA (v3.0) from the Broad Institute [80, 81], using the ‘GSEAPreranked’ algorithm. Our input rank file consisted of the exome-wide gene set and each gene’s corresponding median co-expression value across the 31 cancer types. We tested against the ‘Canonical Pathways’ gene set (v6.1), selecting the weighted algorithm with default parameters. Results were compared using Normalized Enrichment Score (NES) and false discovery rate (FDR).
Linking anti-PD1 therapy response to strength of correlation between CD3E and PD-1 expression in the tumor microenvironment
We accessed RNA-Seq transcriptome data from pretreatment samples of 26 metastatic melanoma patients who received anti-PD1 therapy, and that had been categorized as ”responders” (n = 10 who experienced partial response, plus n = 4 who experienced complete response) and ”non-responders” (n = 12 who experienced progressive disease) according to irRECIST criteria [82]. We looked for differences between responders and non-responders in terms of the strength of correlation between CD3E expression and PDCD1 expression. Because patients whose tumor-infiltrating T cells consistently express PDCD1 are more likely to respond to anti-PD1 therapy [5, 83, 84], we hypothesized a stronger correlation for responders than non-responders. Following the same logic, we also hypothesized that genes that are candidates for future tumor-infiltrating T-cell therapies will show high correlation in expression with CD3E in the tumor microenvironment. To assess differences in the CD3E-PDCD1 correlation between responders and non-responders, we calculated Pearson’s correlation coefficients as described above, and performed linear regressions using the ols function of Python’s statsmodels library. We quantified linear model fits by comparing their coefficients of determination (R2), and evaluated the statistical significance of the best fits using the Mann–Whitney U test.
Abbreviations
CTLA-4: Cytotoxic T-lymphocyte associated protein 4; PD-1: Programmed cell death protein 1; PD-L1: Programmed cell death protein 1 ligand; TILs: Tumor infiltrating lymphocytes; TCGA: The Cancer Genome Atlas; GSEA: Gene set enrichment analysis; NES: Normalized Enrichment Score; FDR: False discovery rate; TPM: Transcript per million; NK: Natural killer; CAR-T therapy: Chimeric-antigen receptor T-cell therapy.
ACKNOWLEDGMENTS
We thank Ziming Zhao and Xinru Ren for their comments and suggestions during early iterations of this research, and Paula Kavathas for comments on a near-final draft.
CONFLICTS OF INTEREST
The authors declare that they have no conflicts of interest.
FUNDING
This research was supported by Gilead Sciences, Inc. and the Notsew Orm Sands Foundation. The funding bodies did not have a role in the design of the study, collection/ analysis/interpretation of the data, or writing the manuscript.
Editorial note
This paper has been accepted based in part on peer-review conducted by another journal and the authors’ response and revisions as well as expedited peer-review in Oncotarget.
References
1. Holohan C, Van Schaeybroeck S, Longley DB, Johnston PG. Cancer drug resistance: an evolving paradigm. Nat Rev Cancer. 2013; 13:714–26. https://doi.org/10.1038/nrc3599. [PubMed].
2. Blair BG, Bardelli A, Park BH. Somatic alterations as the basis for resistance to targeted therapies. J Pathol. 2014; 232:244–54. https://doi.org/10.1002/path.4278. [PubMed].
3. Burrell RA, McGranahan N, Bartek J, Swanton C. The causes and consequences of genetic heterogeneity in cancer evolution. Nature. 2013; 501:338–45. https://doi.org/10.1038/nature12625. [PubMed].
4. Easwaran H, Tsai HC, Baylin SB. Cancer epigenetics: tumor heterogeneity, plasticity of stem-like states, and drug resistance. Mol Cell. 2014; 54:716–27. https://doi.org/10.1016/j.molcel.2014.05.015. [PubMed].
5. Pardoll DM. The blockade of immune checkpoints in cancer immunotherapy. Nat Rev Cancer. 2012; 12:252–64. https://doi.org/10.1038/nrc3239. [PubMed].
6. Swaika A, Hammond WA, Joseph RW. Current state of anti-PD-L1 and anti-PD-1 agents in cancer therapy. Mol Immunol. 2015; 67:4–17. https://doi.org/10.1016/j.molimm.2015.02.009. [PubMed].
7. Graciotti M, Berti C, Klok HA, Kandalaft L. The era of bioengineering: how will this affect the next generation of cancer immunotherapy? J Transl Med. 2017; 15:142. https://doi.org/10.1186/s12967-017-1244-2. [PubMed].
8. Restifo NP, Dudley ME, Rosenberg SA. Adoptive immunotherapy for cancer: harnessing the T cell response. Nat Rev Immunol. 2012; 12:269–81. https://doi.org/10.1038/nri3191. [PubMed].
9. Liu X, Zhou Q, Xu Y, Chen M, Zhao J, Wang M. Harness the synergy between targeted therapy and immunotherapy: what have we learned and where are we headed? Oncotarget. 2017; 8:86969–84. https://doi.org/10.18632/oncotarget.21160. [PubMed].
10. Pagès F, Berger A, Camus M, Sanchez-Cabo F, Costes A, Molidor R, Mlecnik B, Kirilovsky A, Nilsson M, Damotte D, Meatchi T, Bruneval P, Cugnenc PH, et al. Effector memory T cells, early metastasis, and survival in colorectal cancer. N Engl J Med. 2005; 353:2654–66. https://doi.org/10.1056/NEJMoa051424. [PubMed].
11. Dave VP. Role of CD3ε-mediated signaling in T-cell development and function. Crit Rev Immunol. 2011; 31:73–84. https://doi.org/10.1615/CritRevImmunol.v31.i1.70. [PubMed].
12. Finotello F, Trajanoski Z. Quantifying tumor-infiltrating immune cells from transcriptomics data. Cancer Immunol Immunother. 2018; 67:1031–40. https://doi.org/10.1007/s00262-018-2150-z. [PubMed].
13. Hackl H, Stocker G, Charoentong P, Mlecnik B, Bindea G, Galon J, Trajanoski Z. Information technology solutions for integration of biomolecular and clinical data in the identification of new cancer biomarkers and targets for therapy. Pharmacol Ther. 2010; 128:488–98. https://doi.org/10.1016/j.pharmthera.2010.08.012. [PubMed].
14. Calì B, Molon B, Viola A. Tuning cancer fate: the unremitting role of host immunity. Open Biol. 2017; 7:170006. https://doi.org/10.1098/rsob.170006. [PubMed].
15. Anderson J. Unleashing the immune response against childhood solid cancers. Pediatr Blood Cancer. 2017; 64. https://doi.org/10.1002/pbc.26548. [PubMed].
16. Passarelli A, Mannavola F, Stucci LS, Tucci M, Silvestris F. Immune system and melanoma biology: a balance between immunosurveillance and immune escape. Oncotarget. 2017; 8:106132–106142. https://doi.org/10.18632/oncotarget.22190. [PubMed].
17. Aravalli RN, Steer CJ. Immune-Mediated Therapies for Liver Cancer. Genes (Basel). 2017; 8:E76. https://doi.org/10.3390/genes8020076. [PubMed].
18. Wang M, Zhang C, Song Y, Wang Z, Wang Y, Luo F, Xu Y, Zhao Y, Wu Z, Xu Y. Mechanism of immune evasion in breast cancer. Onco Targets Ther. 2017; 10:561–1573. https://doi.org/10.2147/OTT.S126424. [PubMed].
19. Thorsson V, Gibbs DL, Brown SD, Wolf D, Bortone DS, Ou Yang TH, Porta-Pardo E, Gao GF, Plaisier CL, Eddy JA, Ziv E, Culhane AC, Paull EO, et al, and Cancer Genome Atlas Research Network. The Immune Landscape of Cancer. Immunity. 2018; 48:812–830.e14. https://doi.org/10.1016/j.immuni.2018.03.023. [PubMed].
20. Jamieson NB, Maker AV. Gene-expression profiling to predict responsiveness to immunotherapy. Cancer Gene Ther. 2017; 24:134–40. https://doi.org/10.1038/cgt.2016.63. [PubMed].
21. Galon J, Angell HK, Bedognetti D, Marincola FM. The continuum of cancer immunosurveillance: prognostic, predictive, and mechanistic signatures. Immunity. 2013; 39:11–26. https://doi.org/10.1016/j.immuni.2013.07.008. [PubMed].
22. Mahoney KM, Rennert PD, Freeman GJ. Combination cancer immunotherapy and new immunomodulatory targets. Nat Rev Drug Discov. 2015; 14:561–84. https://doi.org/10.1038/nrd4591. [PubMed].
23. Brahmer JR, Topalian S, Wollner I, Powderly JD, Picus J, Drake C, Covino J, Korman A, Pardoll D, Lowy I. Safety and activity of MDX-1106 (ONO-4538), an anti-PD-1 monoclonal antibody, in patients with selected refractory or relapsed malignancies. J Clin Oncol. 2008; 26:3006–3006. https://doi.org/10.1200/jco.2008.26.15_suppl.3006.
24. Hegde PS, Karanikas V, Evers S. The Where, the When, and the How of Immune Monitoring for Cancer Immunotherapies in the Era of Checkpoint Inhibition. Clin Cancer Res. 2016; 22:1865–74. https://doi.org/10.1158/1078-0432.CCR-15-1507. [PubMed].
25. Hwang I, Nguyen N. Mechanisms of tumor-induced T cell immune suppression and therapeutics to counter those effects. Arch Pharm Res. 2015; 38:1415–33. https://doi.org/10.1007/s12272-015-0566-y. [PubMed].
26. Hodi FS, O’Day SJ, McDermott DF, Weber RW, Sosman JA, Haanen JB, Gonzalez R, Robert C, Schadendorf D, Hassel JC, Akerley W, van den Eertwegh AJ, Lutzky J, et al. Improved survival with ipilimumab in patients with metastatic melanoma. N Engl J Med. 2010; 363:711–23. https://doi.org/10.1056/NEJMoa1003466. [PubMed].
27. Mocellin S, Benna C, Pilati P. Coinhibitory molecules in cancer biology and therapy. Cytokine Growth Factor Rev. 2013; 24:147–61. https://doi.org/10.1016/j.cytogfr.2013.01.003. [PubMed].
28. Robert C, Long GV, Brady B, Dutriaux C, Maio M, Mortier L, Hassel JC, Rutkowski P, McNeil C, Kalinka-Warzocha E, Savage KJ, Hernberg MM, Lebbé C, et al. Nivolumab in previously untreated melanoma without BRAF mutation. N Engl J Med. 2015; 372:320–30. https://doi.org/10.1056/NEJMoa1412082. [PubMed].
29. Horn L, Spigel DR, Vokes EE, Holgado E, Ready N, Steins M, Poddubskaya E, Borghaei H, Felip E, Paz-Ares L, Pluzanski A, Reckamp KL, Burgio MA, et al. Nivolumab Versus Docetaxel in Previously Treated Patients With Advanced Non-Small-Cell Lung Cancer: Two-Year Outcomes From Two Randomized, Open-Label, Phase III Trials (CheckMate 017 and CheckMate 057). J Clin Oncol. 2017; 35:3924–33. https://doi.org/10.1200/JCO.2017.74.3062. [PubMed].
30. Motzer RJ, Escudier B, McDermott DF, George S, Hammers HJ, Srinivas S, Tykodi SS, Sosman JA, Procopio G, Plimack ER, Castellano D, Choueiri TK, Gurney H, et al, and CheckMate 025 Investigators. Nivolumab versus Everolimus in Advanced Renal-Cell Carcinoma. N Engl J Med. 2015; 373:1803–13. https://doi.org/10.1056/NEJMoa1510665. [PubMed].
31. Sanlorenzo M, Vujic I, Posch C, Dajee A, Yen A, Kim S, Ashworth M, Rosenblum MD, Algazi A, Osella-Abate S, Quaglino P, Daud A, Ortiz-Urda S. Melanoma immunotherapy. Cancer Biol Ther. 2014; 15:665–74. https://doi.org/10.4161/cbt.28555. [PubMed].
32. Somasundaram A, Burns TF. The next generation of immunotherapy: keeping lung cancer in check. J Hematol Oncol. 2017; 10:87. https://doi.org/10.1186/s13045-017-0456-5. [PubMed].
33. Sharma P, Hu-Lieskovan S, Wargo JA, Ribas A. Primary, Adaptive, and Acquired Resistance to Cancer Immunotherapy. Cell. 2017; 168:707–23. https://doi.org/10.1016/j.cell.2017.01.017. [PubMed].
34. Taube JM. Unleashing the immune system: PD-1 and PD-Ls in the pre-treatment tumor microenvironment and correlation with response to PD-1/PD-L1 blockade. Oncoimmunology. 2014; 3:e963413. https://doi.org/10.4161/21624011.2014.963413. [PubMed].
35. Maker AV. Precise identification of immunotherapeutic targets for solid malignancies using clues within the tumor microenvironment-Evidence to turn on the LIGHT. Oncoimmunology. 2015; 5:e1069937. https://doi.org/10.1080/2162402X.2015.1069937. [PubMed].
36. Iafolla MA, Selby H, Warner K, Ohashi PS, Haibe-Kains B, Siu LL. Rational design and identification of immuno-oncology drug combinations. Eur J Cancer. 2018; 95:38–51. https://doi.org/10.1016/j.ejca.2018.02.027. [PubMed].
37. Charoentong P, Angelova M, Efremova M, Gallasch R, Hackl H, Galon J, Trajanoski Z. Bioinformatics for cancer immunology and immunotherapy. Cancer Immunol Immunother. 2012; 61:1885–903. https://doi.org/10.1007/s00262-012-1354-x. [PubMed].
38. Koscielny G, An P, Carvalho-Silva D, Cham JA, Fumis L, Gasparyan R, Hasan S, Karamanis N, Maguire M, Papa E, Pierleoni A, Pignatelli M, Platt T, et al. Open Targets: a platform for therapeutic target identification and validation. Nucleic Acids Res. 2017; 45:D985–94. https://doi.org/10.1093/nar/gkw1055. [PubMed].
39. Hadrup S, Donia M, Thor Straten P. Effector CD4 and CD8 T cells and their role in the tumor microenvironment. Cancer Microenviron. 2013; 6:123–33. https://doi.org/10.1007/s12307-012-0127-6. [PubMed].
40. Riazi Rad F, Ajdary S, Omranipour R, Alimohammadian MH, Hassan ZM. Comparative analysis of CD4+ and CD8+ T cells in tumor tissues, lymph nodes and the peripheral blood from patients with breast cancer. Iran Biomed J. 2015; 19:35–44. https://doi.org/10.6091%2Fibj.1289.2014. [PubMed].
41. Zanetti M. Tapping CD4 T cells for cancer immunotherapy: the choice of personalized genomics. J Immunol. 2015; 194:2049–56. https://doi.org/10.4049/jimmunol.1402669. [PubMed].
42. Perez-Diez A, Joncker NT, Choi K, Chan WF, Anderson CC, Lantz O, Matzinger P. CD4 cells can be more efficient at tumor rejection than CD8 cells. Blood. 2007; 109:5346–54. https://doi.org/10.1182/blood-2006-10-051318. [PubMed].
43. Hui E, Cheung J, Zhu J, Su X, Taylor MJ, Wallweber HA, Sasmal DK, Huang J, Kim JM, Mellman I, Vale RD. T cell costimulatory receptor CD28 is a primary target for PD-1-mediated inhibition. Science. 2017; 355:1428–33. https://doi.org/10.1126/science.aaf1292. [PubMed].
44. Kamphorst AO, Wieland A, Nasti T, Yang S, Zhang R, Barber DL, Konieczny BT, Daugherty CZ, Koenig L, Yu K, Sica GL, Sharpe AH, Freeman GJ, et al. Rescue of exhausted CD8 T cells by PD-1-targeted therapies is CD28-dependent. Science. 2017; 355:1423–27. https://doi.org/10.1126/science.aaf0683. [PubMed].
45. Clouthier DL, Ohashi PS. Costimulation, a surprising connection for immunotherapy. Science. 2017; 355:1373–74. https://doi.org/10.1126/science.aan1467. [PubMed].
46. Maleki Vareki S, Garrigós C, Duran I. Biomarkers of response to PD-1/PD-L1 inhibition. Crit Rev Oncol Hematol. 2017; 116:116–24. https://doi.org/10.1016/j.critrevonc.2017.06.001. [PubMed].
47. Shien K, Papadimitrakopoulou VA, Wistuba II. Predictive biomarkers of response to PD-1/PD-L1 immune checkpoint inhibitors in non-small cell lung cancer. Lung Cancer. 2016; 99:79–87. https://doi.org/10.1016/j.lungcan.2016.06.016. [PubMed].
48. Sodji Q, Klein K, Sravan K, Parikh J. Predictive role of PD-L1 expression in the response of renal Medullary carcinoma to PD-1 inhibition. J Immunother Cancer. 2017; 5:62. https://doi.org/10.1186/s40425-017-0267-9. [PubMed].
49. Wu SP, Liao RQ, Tu HY, Wang WJ, Dong ZY, Huang SM, Guo WB, Gou LY, Sun HW, Zhang Q, Xie Z, Yan LX, Su J, et al. Stromal PD-L1-Positive Regulatory T cells and PD-1-Positive CD8-Positive T cells Define the Response of Different Subsets of Non-Small Cell Lung Cancer to PD-1/PD-L1 Blockade Immunotherapy. J Thorac Oncol. 2018; 13:521–32. https://doi.org/10.1016/j.jtho.2017.11.132. [PubMed].
50. Diggs LP, Hsueh EC. Utility of PD-L1 immunohistochemistry assays for predicting PD-1/PD-L1 inhibitor response. Biomark Res. 2017; 5:12. https://doi.org/10.1186/s40364-017-0093-8. [PubMed].
51. Teng F, Meng X, Kong L, Yu J. Progress and challenges of predictive biomarkers of anti PD-1/PD-L1 immunotherapy: A systematic review. Cancer Lett. 2018; 414:166–73. https://doi.org/10.1016/j.canlet.2017.11.014. [PubMed].
52. Miao D, Margolis CA, Gao W, Voss MH, Li W, Martini DJ, Norton C, Bossé D, Wankowicz SM, Cullen D, Horak C, Wind-Rotolo M, Tracy A, et al. Genomic correlates of response to immune checkpoint therapies in clear cell renal cell carcinoma. Science. 2018; 359:801–06. https://doi.org/10.1126/science.aan5951. [PubMed].
53. Gettinger SN, Choi J, Mani N, Sanmamed MF, Datar I, Sowell R, Du VY, Kaftan E, Goldberg S, Dong W, Zelterman D, Politi K, Kavathas P, et al. A dormant TIL phenotype defines non-small cell lung carcinomas sensitive to immune checkpoint blockers. Nat Commun. 2018; 9:3196. https://doi.org/10.1038/s41467-018-05032-8. [PubMed].
54. Schwab M, Schaeffeler E. Pharmacogenomics: a key component of personalized therapy. Genome Med. 2012; 4:93. https://doi.org/10.1186/gm394. [PubMed].
55. Barber A. Costimulation of Effector CD8 T Cells: Which Receptor is Optimal for Immunotherapy? MOJ Immunol. 2014; 1:00011. https://doi.org/10.15406/moji.2014.01.00011.
56. Ochoa de Olza M, Oliva M, Hierro C, Matos I, Martin-Liberal J, Garralda E. Early-drug development in the era of immuno-oncology: are we ready to face the challenges? Ann Oncol. 2018; 29:1727–40. https://doi.org/10.1093/annonc/mdy225. [PubMed].
57. Menon R, David BG. Itolizumab - a humanized anti-CD6 monoclonal antibody with a better side effects profile for the treatment of psoriasis. Clin Cosmet Investig Dermatol. 2015; 8:215–22. https://doi.org/10.2147/CCID.S47784. [PubMed].
58. Srivastava A. Itolizumab in Psoriasis. Indian J Dermatol. 2017; 62:418–21. https://doi.org/10.4103/ijd.IJD_467_16. [PubMed].
59. Blake SJ, Dougall WC, Miles JJ, Teng MW, Smyth MJ. Molecular Pathways: Targeting CD96 and TIGIT for Cancer Immunotherapy. Clin Cancer Res. 2016; 22:5183–88. https://doi.org/10.1158/1078-0432.CCR-16-0933. [PubMed].
60. Anderson AC, Joller N, Kuchroo VK. Lag-3, Tim-3, and TIGIT: Co-inhibitory Receptors with Specialized Functions in Immune Regulation. Immunity. 2016; 44:989–1004. https://doi.org/10.1016/j.immuni.2016.05.001. [PubMed].
61. Dougall WC, Kurtulus S, Smyth MJ, Anderson AC. TIGIT and CD96: new checkpoint receptor targets for cancer immunotherapy. Immunol Rev. 2017; 276:112–20. https://doi.org/10.1111/imr.12518. [PubMed].
62. Yu X, Harden K, Gonzalez LC, Francesco M, Chiang E, Irving B, Tom I, Ivelja S, Refino CJ, Clark H, Eaton D, Grogan JL. The surface protein TIGIT suppresses T cell activation by promoting the generation of mature immunoregulatory dendritic cells. Nat Immunol. 2009; 10:48–57. https://doi.org/10.1038/ni.1674. [PubMed].
63. Stanietsky N, Simic H, Arapovic J, Toporik A, Levy O, Novik A, Levine Z, Beiman M, Dassa L, Achdout H, Stern-Ginossar N, Tsukerman P, Jonjic S, Mandelboim O. The interaction of TIGIT with PVR and PVRL2 inhibits human NK cell cytotoxicity. Proc Natl Acad Sci USA. 2009; 106:17858–63. https://doi.org/10.1073/pnas.0903474106. [PubMed].
64. Chan CJ, Martinet L, Gilfillan S, Souza-Fonseca-Guimaraes F, Chow MT, Town L, Ritchie DS, Colonna M, Andrews DM, Smyth MJ. The receptors CD96 and CD226 oppose each other in the regulation of natural killer cell functions. Nat Immunol. 2014; 15:431–38. https://doi.org/10.1038/ni.2850. [PubMed].
65. Blake SJ, Stannard K, Liu J, Allen S, Yong MC, Mittal D, Aguilera AR, Miles JJ, Lutzky VP, de Andrade LF, Martinet L, Colonna M, Takeda K, et al. Suppression of Metastases Using a New Lymphocyte Checkpoint Target for Cancer Immunotherapy. Cancer Discov. 2016; 6:446–59. https://doi.org/10.1158/2159-8290.CD-15-0944. [PubMed].
66. Kurtulus S, Sakuishi K, Ngiow SF, Joller N, Tan DJ, Teng MW, Smyth MJ, Kuchroo VK, Anderson AC. TIGIT predominantly regulates the immune response via regulatory T cells. J Clin Invest. 2015; 125:4053–62. https://doi.org/10.1172/JCI81187. [PubMed].
67. Valdez PA, Wang H, Seshasayee D, van Lookeren Campagne M, Gurney A, Lee WP, Grewal IS. NTB-A, a new activating receptor in T cells that regulates autoimmune disease. J Biol Chem. 2004; 279:18662–69. https://doi.org/10.1074/jbc.M312313200. [PubMed].
68. Wu N, Zhong MC, Roncagalli R, Pérez-Quintero LA, Guo H, Zhang Z, Lenoir C, Dong Z, Latour S, Veillette A. A hematopoietic cell-driven mechanism involving SLAMF6 receptor, SAP adaptors and SHP-1 phosphatase regulates NK cell education. Nat Immunol. 2016; 17:387–96. https://doi.org/10.1038/ni.3369. [PubMed].
69. Griewank K, Borowski C, Rietdijk S, Wang N, Julien A, Wei DG, Mamchak AA, Terhorst C, Bendelac A. Homotypic interactions mediated by Slamf1 and Slamf6 receptors control NKT cell lineage development. Immunity. 2007; 27:751–62. https://doi.org/10.1016/j.immuni.2007.08.020. [PubMed].
70. Kageyama R, Cannons JL, Zhao F, Yusuf I, Lao C, Locci M, Schwartzberg PL, Crotty S. The receptor Ly108 functions as a SAP adaptor-dependent on-off switch for T cell help to B cells and NKT cell development. Immunity. 2012; 36:986–1002. https://doi.org/10.1016/j.immuni.2012.05.016. [PubMed].
71. Yigit B, Halibozek PJ, Chen SS, O’Keeffe MS, Arnason J, Avigan D, Gattei V, Bhan A, Cen O, Longnecker R, Chiorazzi N, Wang N, Engel P, Terhorst C. A combination of an anti-SLAMF6 antibody and ibrutinib efficiently abrogates expansion of chronic lymphocytic leukemia cells. Oncotarget. 2016; 7:26346–60. https://doi.org/10.18632/oncotarget.8378. [PubMed].
72. Garrido F, Aptsiauri N, Doorduijn EM, Garcia Lora AM, van Hall T. The urgent need to recover MHC class I in cancers for effective immunotherapy. Curr Opin Immunol. 2016; 39:44–51. https://doi.org/10.1016/j.coi.2015.12.007. [PubMed].
73. Vinay DS, Ryan EP, Pawelec G, Talib WH, Stagg J, Elkord E, Lichtor T, Decker WK, Whelan RL, Kumara HM, Signori E, Honoki K, Georgakilas AG, et al. Immune evasion in cancer: mechanistic basis and therapeutic strategies. Semin Cancer Biol. 2015; 35:S185–98. https://doi.org/10.1016/j.semcancer.2015.03.004. [PubMed].
74. Menter T, Tzankov A. Mechanisms of Immune Evasion and Immune Modulation by Lymphoma Cells. Front Oncol. 2018; 8:54. https://doi.org/10.3389/fonc.2018.00054. [PubMed].
75. Gao J, Aksoy BA, Dogrusoz U, Dresdner G, Gross B, Sumer SO, Sun Y, Jacobsen A, Sinha R, Larsson E, Cerami E, Sander C, Schultz N. Integrative analysis of complex cancer genomics and clinical profiles using the cBioPortal. Sci Signal. 2013; 6:pl1. https://doi.org/10.1126/scisignal.2004088. [PubMed].
76. Cerami E, Gao J, Dogrusoz U, Gross BE, Sumer SO, Aksoy BA, Jacobsen A, Byrne CJ, Heuer ML, Larsson E, Antipin Y, Reva B, Goldberg AP, et al. The cBio cancer genomics portal: an open platform for exploring multidimensional cancer genomics data. Cancer Discov. 2012; 2:401–04. https://doi.org/10.1158/2159-8290.CD-12-0095. [PubMed].
77. Hoffacker V, Schultz A, Tiesinga JJ, Gold R, Schalke B, Nix W, Kiefer R, Müller-Hermelink HK, Marx A. Thymomas alter the T-cell subset composition in the blood: a potential mechanism for thymoma-associated autoimmune disease. Blood. 2000; 96:3872–79. [PubMed].
78. Chetty R, Gatter K. CD3: structure, function, and role of immunostaining in clinical practice. J Pathol. 1994; 173:303–07. https://doi.org/10.1002/path.1711730404. [PubMed].
79. Kandoth C. MAF files - hg19, reannotated, and deduplicated. Synapse. 2013; cited 2018 Jan 19. Available from: https://doi.org/10.7303/syn1734155.1.
80. Subramanian A, Tamayo P, Mootha VK, Mukherjee S, Ebert BL, Gillette MA, Paulovich A, Pomeroy SL, Golub TR, Lander ES, Mesirov JP. Gene set enrichment analysis: a knowledge-based approach for interpreting genome-wide expression profiles. Proc Natl Acad Sci USA. 2005; 102:15545–50. https://doi.org/10.1073/pnas.0506580102. [PubMed].
81. Mootha VK, Lindgren CM, Eriksson KF, Subramanian A, Sihag S, Lehar J, Puigserver P, Carlsson E, Ridderstråle M, Laurila E, Houstis N, Daly MJ, Patterson N, et al. PGC-1alpha-responsive genes involved in oxidative phosphorylation are coordinately downregulated in human diabetes. Nat Genet. 2003; 34:267–73. https://doi.org/10.1038/ng1180. [PubMed].
82. Hugo W, Zaretsky JM, Sun L, Song C, Moreno BH, Hu-Lieskovan S, Berent-Maoz B, Pang J, Chmielowski B, Cherry G, Seja E, Lomeli S, Kong X, et al. Genomic and Transcriptomic Features of Response to Anti-PD-1 Therapy in Metastatic Melanoma. Cell. 2016; 165:35–44. https://doi.org/10.1016/j.cell.2016.02.065. [PubMed].
83. Tumeh PC, Harview CL, Yearley JH, Shintaku IP, Taylor EJ, Robert L, Chmielowski B, Spasic M, Henry G, Ciobanu V, West AN, Carmona M, Kivork C, et al. PD-1 blockade induces responses by inhibiting adaptive immune resistance. Nature. 2014; 515:568–71. https://doi.org/10.1038/nature13954. [PubMed].
84. Yao S, Zhu Y, Chen L. Advances in targeting cell surface signalling molecules for immune modulation. Nat Rev Drug Discov. 2013; 12:130–46. https://doi.org/10.1038/nrd3877. [PubMed].