
INTRODUCTION
The diagnosis of colorectal cancer occurs primarily by histological examination of tissue specimens obtained during an endoscopic procedure, or at the time of surgical resection [1]. Accurate staging is essential, as it used to predict disease prognosis and influence treatment options for individual patients. However, current staging is not completely accurate as evidenced by the fact that up to 25% of stage II patients will suffer recurrence [2, 3]. Given these shortcomings in existing clinicopathological staging, interest has focused on molecular biomarkers that have the potential to predict prognosis and guide therapy more accurately for individual patients [4]. While a number of biomarkers have been proposed, few have been implemented in routine clinical practice.
Our understanding of the molecular basis of colorectal cancer has increased with the advent of molecular technologies that enable genome-wide expression analysis, such as microarrays and massively parallel sequencing [5, 6]. In 2012, The Cancer Genome Atlas Network (TCGA) reported a comprehensive study of 276 colorectal tumour samples, which utilised sequencing technologies to analyse tumour exome sequence, DNA copy number, promoter methylation, and expression of messenger RNA and microRNA [7].The study provided key insights into colorectal cancer biology, including identification of potential prognostic and therapeutic targets. However, as with other genomic profiling studies, there has been a paucity of candidate markers translated into clinical practice [4, 8].
The inconsistencies seen may be due to the confounding effect of tumour heterogeneity combined with limitations in PCR-based technology and immunohistochemistry. The quantitative PCR-based method might be considered the ‘gold standard’ for measuring gene expression because of its high sensitivity and specificity. However, the sensitivity of this method is limited if applied to heterogeneous multicellular tumour samples, and it is prone to interference from non-cancerous cells. Immunohistochemistry has proven to be an integral method for measuring protein expression levels in tissue samples for diagnostic laboratories, however it is less quantitative than other molecular methods [9]. Furthermore, many genes show a low correlation between mRNA transcript expression and corresponding protein levels [10], and only 25% of the proteins within the human proteome have validated antibodies [11]. The limitations that tumour heterogeneity imposes upon PCR-based methods and IHC can be resolved to an extent with the use of laser microdissection to select cells of interest to produce an enriched population of cells for analysis [12–14]. However, this requires further investment in additional hardware; time and reliance on pathologist/scientist to correctly identify target cells of interest. More suitable methods are therefore required to verify and assess the application of potential diagnostic and prognostic markers whilst taking into account the effects of tumour heterogeneity. RNAscope® (Advanced Cell Diagnostics, Inc. (Hayward, CA) is one such method that can satisfy these requirements.
RNAscope® is an RNA in situ hybridisation method that enables single-molecule detection while preserving cellular and tissue morphology [15]. This method utilises a paired probe system to ensure sensitive and selective targeting of mRNA molecules [16], and has been successfully applied to measure gene expression in cancer cells [17–19]; stem cells [20–22] and circulating tumour cells [23, 24]. RNAscope® allows mRNA expression measurements for individual or multiple genes from archival tumour specimens to be obtained in a diagnostic setting [15]. Furthermore, a strong correlation of mRNA expression has been shown between RNAscope® and quantitative PCR [25].
The purpose of this study was to investigate the utility of RNAscope® for measuring mRNA expression levels of genes previously associated with poor prognostic outcomes in colorectal cancer, and determine mRNA transcript localisation and expression in different cell types within the tumour.
RESULTS
Comparison between copy number and mRNA expression level
To confirm the possibility that mean mRNA expression levels for TNFRSF11A and/or GFI1 can be affected by CNA, analysis of mRNA expression levels and CNA was performed using TCGA data. From a total of 629 patients, 218 had DNA copy number and gene expression data. GFI1 and TNFRSF11A, showed a significant association between predicted gene CNA and expression levels for both GFI1 (average difference between loss and neutral was −0.39, CI −0.70 − −0.08, P = 0.01) and TNFRSF11A (average difference between loss and neutral was −0.78, CI −1.06 – −0.50, P = 2.5E−07) with a trend of CNA deletions being associated with mRNA downregulation (Figure 1).
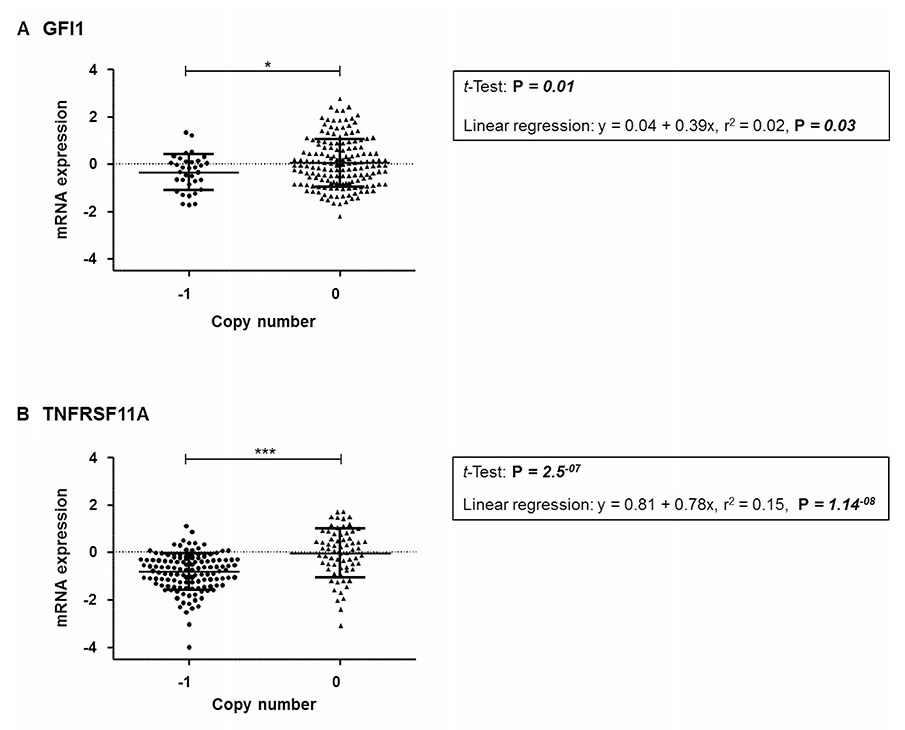
Figure 1: Comparison of mRNA expression relative to copy number from combined TCGA datasets for the respective gene (A) GFI1 (B) TNFRSF11A. Significant p-values are: < 0.001 = ***, < 0.05 = *.
Comparison of RNA in situ hybridization and immunohistochemistry assessment
Expression of MLH1 mRNA has been correlated closely with protein expression [20, 21], so this gene was selected to compare the utility of RNAscope® with a routinely used immunohistochemical diagnostic assay. RNAscope® and immunohistochemistry assays were performed on a total of 112 cases. Microscopic assessment of MLH1 mRNA expression showed clean staining (brown punctuate dots) with no background staining or staining artefacts (Figure 2). Interestingly, different mRNA expression patterns were observed in cases. A homogenous mRNA expression pattern where MLH1 probe signals were evenly dispersed throughout the tumour was found in 8 cases. These cases were more readily identifiable and generally scored higher (i.e. had more signals per cell) than 43 cases that presented a heterogeneous expression with MLH1 probe signals observed in localised areas of the tumour.
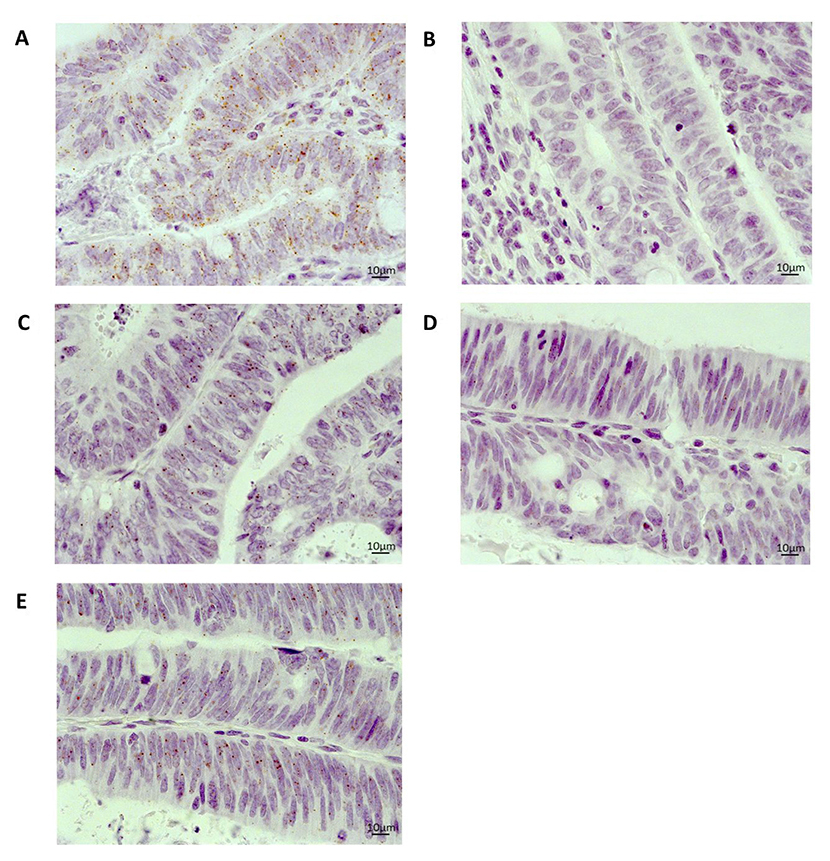
Figure 2: Representative images of mRNA expression using RNAscope® on an FFPE whole tissue section from a colorectal cancer case 40× magnification (A) Positive control (PPIB) (B) Negative control (DAB only) (C) MLH1 (D) GFI1 (E) TNFRSF11A.
Immunohistochemistry was successfully performed with the majority of cases demonstrating positive staining of MLH1 within carcinoma cells. However, staining intensities did vary between cases.
Comparison of results from these technologies correlated in 55.0% (62/112) of cases (Table 1). Positive mRNA expression correlated with positive protein expression in 57.0% (53/93) of cases. A negative mRNA expression correlated with a negative protein expression in 64.3% (9/14) of cases. Re-analysis of cases with good quality RNA present resulted in stronger concordance between RNAscope® and immunohistochemistry in 73.7% (56/76) of cases whilst 29 cases were excluded (Table 2). RNAscope® and immunohistochemistry were found not to be independent of each other (OR = 6.0; CI 1.59−22.62, P = 0.007, Fisher’s Exact test). A significant positive correlation between mRNA and protein expression was observed in 75.0% (48/64) of cases (P = 0.018). A negative mRNA expression correlated with a negative protein expression in 66.6% (8/12) of cases. Investigation of the discrepant cases found 16 cases with positive MLH1 protein expression had no detectable MLH1 mRNA expression present. Conversely, four cases with negative MLH1 protein expression, showed positive MLH1 mRNA expression. Such differences highlight potential variations in half-life between molecules and/or sensitivities between technologies. We were not able to evaluate these findings in relation to MLH1 mutation or methylation status, however, the results further demonstrate the utility of RNAscope® for measuring gene mRNA expression changes in archival FFPE tissue.
Table 1: Assessment of MLH1 mRNA expression using RNAscope® and MLH1 protein expression using immunohistochemistry
Immunohistochemistry |
|||||
|---|---|---|---|---|---|
Negative |
Positive |
Loss of tissue |
Total |
||
RNAscope® |
Negative |
9 |
39 |
0 |
48 |
Positive |
4 |
53 |
0 |
57 |
|
No Result Available |
1 |
1 |
5 |
7 |
|
Total |
14 |
93 |
5 |
112 |
|
Table 2: MLH1 mRNA expression using RNAscope® and MLH1 protein expression using immunohistochemistry from samples with a positive control score of 2+
Immunohistochemistry |
|||||
|---|---|---|---|---|---|
Negative |
Positive |
Total |
|||
RNAscope® |
Negative |
8 |
16 |
24 |
|
Positive |
4 |
48 |
52 |
||
Total |
12 |
64 |
76 |
||
RNA in situ hybridisation assessment of GFI1 and TNFRSF11A expression in colorectal cancer patients
We observed both homogenous and heterogeneous GFI1 and TNFRSF11A mRNA expression patterns across the tumour cohort. For GFI1, there were 3 cases with homogenous mRNA patterns and 9 cases with heterogeneous expression. For TNFRSF11A, a homogenous expression pattern was observed in 11 cases, whilst 28 cases showed a heterogeneous expression pattern. Colorectal adenocarcinoma cases were analysed for associations between GFI1 or TNFRSF11A mRNA expression and clinicopathological features. Significant associations between negative GFI1 mRNA expression and age groups (CI 0.55–12.27, P = 0.05), grade (CI 0.003–0.91, P = 0.05), left-sided tumours (CI 1.21–21.45, P = 0.02), and rectal tumours (CI 0.07 – 2.26, P = 0.04) were observed by univariate analysis (Table 3).
Table 3: GFI1 mRNA expression and association with clinicopathological features from colorectal cancer adenocarcinoma cases from the RNAscope cohort that had an RNAscope® positive control score of > 2
RNAscope® |
||||||
|---|---|---|---|---|---|---|
Clinicopathological features |
−ve |
+ve |
OR |
95% CI |
Pa |
|
Age |
30–65 |
14 |
3 |
1 |
0.05 |
|
66–75 |
26 |
2 |
0.36 |
[0.04, 2.41] |
||
76+ |
16 |
8 |
2.33 |
[0.55, 12.27] |
||
Gender |
Female |
24 |
4 |
1 |
0.42 |
|
Male |
32 |
9 |
1.69 |
[0.49, 6.83] |
||
Grade |
1-Well differentiated |
1 |
3 |
1 |
0.05 |
|
2-Moderately differentiated |
43 |
8 |
0.06 |
[0.01, 0.67] |
||
3-Poorly differentiated |
11 |
2 |
0.06 |
[0.003, 0.91] |
||
Grade Status |
Low |
45 |
11 |
1 |
- |
0.72 |
High |
11 |
2 |
0.74 |
[0.30, 9.50] |
||
Lymphatic Invasion |
Absent |
38 |
9 |
1 |
0.93 |
|
Present |
18 |
4 |
0.94 |
[0.81, 1.21] |
||
Vascular Invasion |
Absent |
42 |
11 |
1 |
0.47 |
|
Present |
14 |
2 |
0.55 |
[0.74, 1.15] |
||
Lymphovascular Invasion |
Absent |
38 |
9 |
1 |
0.92 |
|
Present |
18 |
4 |
0.94 |
[0.23, 3.31] |
||
Metastasis Present |
Absent |
37 |
9 |
1 |
0.83 |
|
Present |
19 |
4 |
0.87 |
[0.21, 3.04] |
||
Site |
Left-sided |
32 |
3 |
1 |
0.02 |
|
Right-sided |
24 |
10 |
4.4 |
[1.21, 21.45] |
||
Primary Site |
Ascending/Caecum |
24 |
10 |
1 |
- |
0.04 |
Descending/Sigmoid |
22 |
1 |
0.10 |
[0.01, 0.63] |
||
Rectum |
10 |
2 |
0.48 |
[0.07, 2.26] |
||
AJCC Pathologic Tumour Stage |
T1 |
16 |
6 |
1 |
0.23 |
|
T4 |
40 |
7 |
0.47 |
[0.13, 1.65] |
||
AJCC Nodal Stage |
N0 |
36 |
9 |
1 |
- |
0.73 |
N1+N2 |
20 |
4 |
0.8 |
[0.20, 2.80] |
||
AJCC Metastatic Stage |
M0 -unconfirmed |
53 |
13 |
1 |
0.26 |
|
M1 -confirmed |
3 |
0 |
0 |
[0.00, NaN] |
||
AJCC Tumour Stage Group |
1 |
11 |
5 |
1 |
- |
0.37 |
2 |
25 |
4 |
0.35 |
[0.07, 1.57] |
||
3 + 4 |
20 |
4 |
0.44 |
[0.09, 1.99] |
||
Survival |
Alive |
44 |
10 |
1 |
- |
0.90 |
Deceased |
12 |
3 |
1.10 |
[0.22, 4.30] |
||
aRNAscope data has univariate P value from Logistics’ regression.
Abbreviations: AJCC, American Joint Committee on Cancer; CI, Confidence Interval.
Analysis of TNFRSF11A mRNA expression and clinicopathological features showed significant associations for negative TNFRSF11A mRNA expression and presence of metastasis (CI 0.13 – 1.04, P = 0.05), and AJCC Nodal Stage involvement (CI 0.11 – 0.92, P = 0.03) (Table 4). No associations were observed between expression of GFI1 and/or TNFRSF11A with the clinicopathological features, histology, tumour size, lymphocytic infiltrate. No information relating to histological type (mucinous versus non-mucinous) was available for this study.
Table 4: TNFRSF11A mRNA expression and association with clinicopathological features form colorectal adenocarcinoma cases from the RNAscope cohort that had an RNAscope® positive control score of > 2
RNAscope® |
||||||
|---|---|---|---|---|---|---|
Clinicopathological Features |
−ve |
+ve |
OR |
95% CI |
Pa |
|
Age |
30–65 |
9 |
8 |
1 |
- |
0.65 |
66–75 |
15 |
13 |
0.98 |
[0.29, 3.31] |
||
76+ |
10 |
14 |
1.58 |
[0.45, 5.64] |
||
Gender |
Female |
10 |
18 |
1 |
- |
0.06 |
Male |
24 |
17 |
0.39 |
[0.14, 1.04] |
||
Grade |
1-Well differentiated |
1 |
3 |
1 |
- |
0.07 |
2-Moderately differentiated |
24 |
27 |
0.38 |
[0.04, 3.85] |
||
3-Poorly differentiated |
8 |
5 |
0.21 |
[0.02, 2.60] |
||
Grade Status |
Low |
26 |
30 |
1 |
- |
0.32 |
High |
8 |
5 |
0.54 |
[0.16, 1.86] |
||
Lymphatic Invasion |
Absent |
21 |
26 |
1 |
- |
0.27 |
Present |
13 |
9 |
0.56 |
[0.67, 1.12] |
||
Vascular Invasion |
Absent |
23 |
30 |
1 |
0.07 |
|
Present |
11 |
5 |
0.35 |
[0.59, 1.02] |
||
Lymphovascular Invasion |
Absent |
21 |
26 |
1 |
- |
0.26 |
Present |
13 |
9 |
0.56 |
[0.20, 1.55] |
||
Metastasis Present |
Absent |
19 |
27 |
1 |
- |
0.05 |
Present |
15 |
8 |
0.38 |
[0.13, 1.04] |
||
Site |
Left-sided |
17 |
18 |
1 |
0.91 |
|
Right-sided |
17 |
17 |
0.94 |
[0.37, 2.44] |
||
Primary Site |
Ascending/Caecum |
17 |
17 |
1 |
- |
0.70 |
Descending/Sigmoid |
10 |
13 |
1.30 |
[0.45, 3.83] |
||
Rectum |
7 |
5 |
0.71 |
[0.18, 2.68] |
||
AJCC Pathologic Tumour Stage |
T1 |
8 |
14 |
1 |
0.14 |
|
T4 |
26 |
21 |
0.46 |
[0.16, 1.29] |
||
AJCC Nodal Stage |
N0 |
18 |
27 |
1 |
- |
0.03 |
N1 + N2 |
16 |
8 |
0.33 |
[0.11, 0.92] |
||
AJCC Metastatic Stage |
M0 -unconfirmed |
33 |
33 |
1 |
0.57 |
|
M1 -confirmed |
1 |
2 |
2 |
[0.18, 44.27] |
||
AJCC Tumour Stage Group |
1 |
5 |
11 |
1 |
- |
0.07 |
2 |
13 |
16 |
0.56 |
[0.14, 1.97] |
||
3 + 4 |
16 |
8 |
0.23 |
[0.05, 0.84] |
||
Survival |
Alive |
25 |
29 |
1 |
- |
0.35 |
Deceased |
9 |
6 |
0.57 |
[0.17, 1.82] |
||
aRNAscope data has univariate P value from Logistic Regression.
Abbreviations: AJCC, American Joint Committee on Cancer; CI, Confidence Interval.
Quantitative assessment of GFI1 and TNFRSF11A mRNA expression in different tumour cell types
To better characterise the intra-tumoural expression patterns of GFI1 and TNFRSF11A, we used RNAscope® to quantify mRNA levels across 10 whole tumour sections according to tumour cell type (Figure 2 and Supplementary Figure 1). This analysis showed that mean GFI1 and TNFRSF11A mRNA expression levels within carcinoma cells were significantly higher compared to other cell types (F = 14.86, P = 1.89E-08 and F = 10.27, P = 1.11E-06), including normal epithelial cells, stromal fibroblasts and lymphocytes (Figure 3 and Table 5). The mean expression levels for GFI1 in carcinoma cells was 4.7-fold higher than surrounding cell types (0.33 vs 0.07 signals/cell; CI 0.08 – 0.44, P = 0.009). The mean expression levels for TNFRSF11A in carcinoma cells was 7-fold higher than surrounding cell types (0.35 vs 0.05 signals/cell; CI 0.09 – 0.51, P = 0.009). No statistical significance was observed for differences in mean mRNA expression when comparing amongst other cell types.
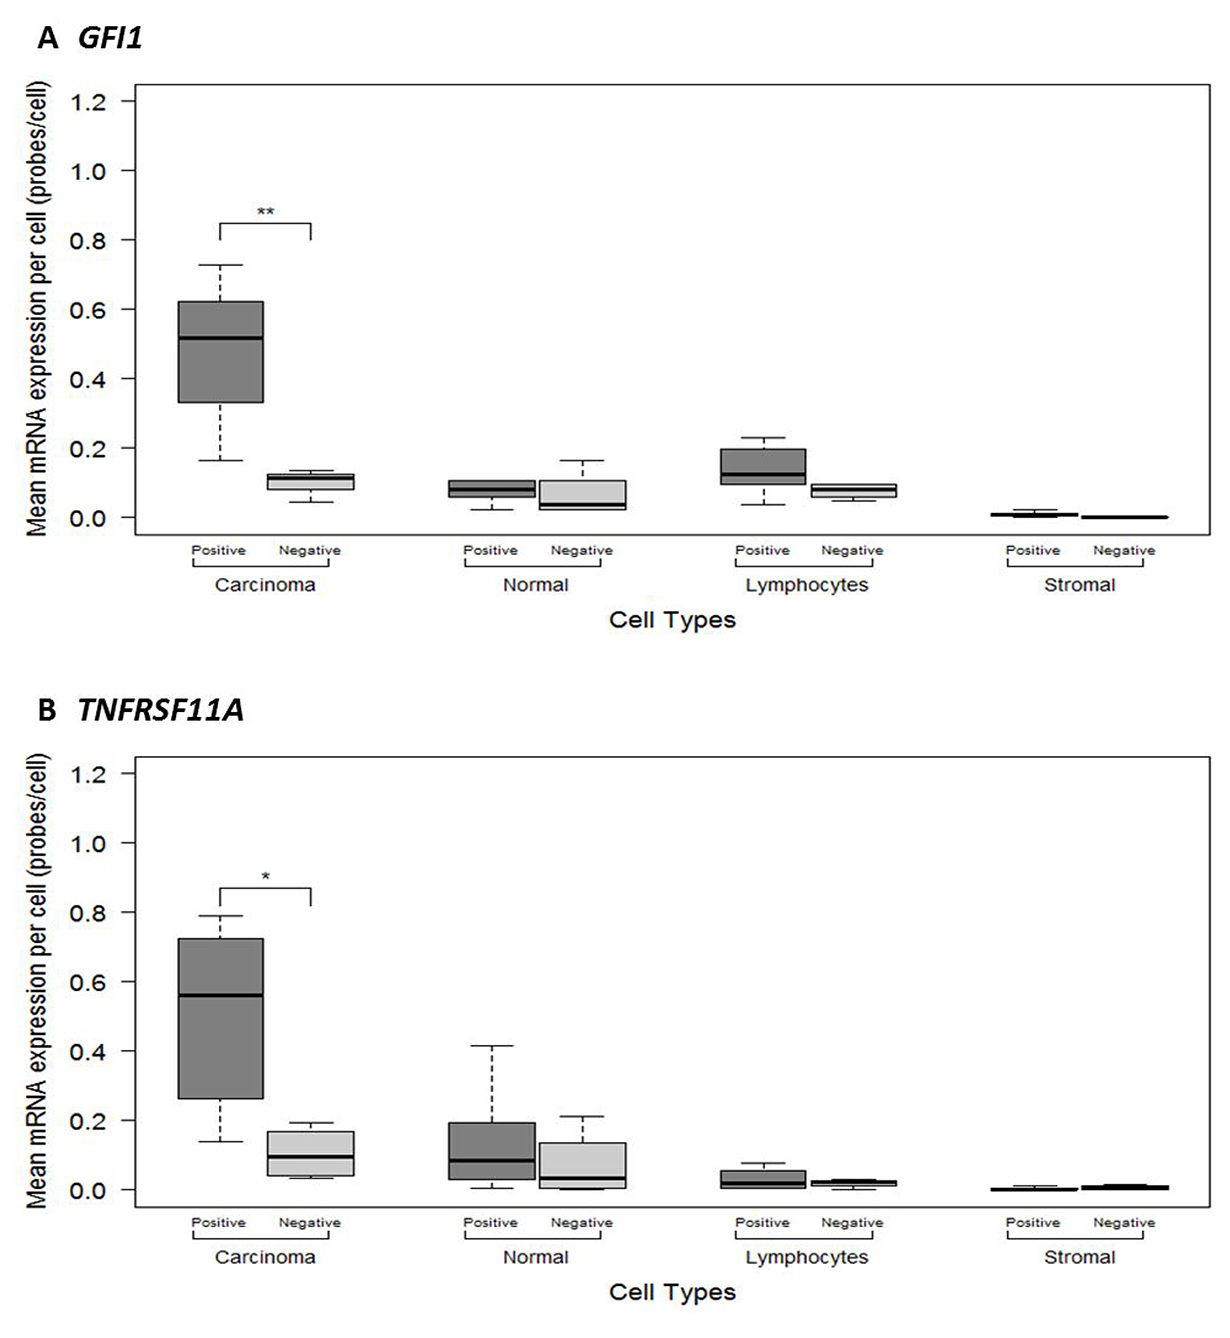
Figure 3: ImageJ manual method quantitative measurements of mRNA expression levels in different cells types between the 10 colorectal cancer FFPE histological sections categorised as showing Negative or Positive mRNA expression for (A) GFI1 (B) TNFRSF11A. Significant p-values are: <0.001 = ***, <0.01 = **, <0.05 = *.
Table 5: Comparison of the mean GFI1 and TNFRSF11A mRNA expression levels on a per cell basis between different cell types
Gene |
Cell type |
mean mRNA signals/cell |
95% CI |
p-value |
ANOVA |
ANOVA p-value |
|---|---|---|---|---|---|---|
GFI1 |
Carcinoma vs All Cell Types |
0.33 vs 0.07 |
0.08, 0.44 |
0.009 |
14.86 |
1.89E-08 |
Carcinoma vs Normal |
0.33 vs 0.09 |
0.08, 0.41 |
0.001 |
|||
Carcinoma vs Lymphocytes |
0.33 vs 0.11 |
0.06, 0.38 |
0.004 |
|||
Carcinoma vs Stromal |
0.33 vs 0.01 |
0.16, 0.49 |
2.25E-05 |
|||
Normal vs Lymphocytes |
0.09 vs 0.11 |
−0.19, 0.14 |
0.971 |
|||
Normal vs Stromal |
0.09 vs 0.01 |
−0.24, 0.08 |
0.538 |
|||
Stromal vs Lymphocytes |
0.01 vs 0.11 |
−0.27, 0.05 |
0.296 |
|||
TNFRSF11A |
Carcinoma vs All Cell Types |
0.35 vs 0.05 |
0.09,0.51 |
0.009 |
10.27 |
1.11E-06 |
Carcinoma vs Normal |
0.35 vs 0.11 |
0.05, 0.43 |
0.001 |
|||
Carcinoma vs Lymphocytes |
0.35 vs 0.03 |
0.13, 0.32 |
3.63E-04 |
|||
Carcinoma vs Stromal |
0.35 vs 0.01 |
0.15, 0.34 |
1.49E-04 |
|||
Normal vs Lymphocytes |
0.11 vs 0.03 |
−0.11, 0.08 |
0.641 |
|||
Normal vs Stromal |
0.11 vs 0.01 |
−0.30, −0.11 |
0.459 |
|||
Stromal vs Lymphocytes |
0.01 vs 0.03 |
−0.21, −0.02 |
0.991 |
Abbreviations: CI, (Confidence Intervals); HSD (honest significant difference). Carcinoma tested against All cell types with a 2 sample t-test, all other tests were Tukey’s HSD tests.
DISCUSSION
Candidate markers from large expression profiling studies have made little clinical impact to date, possibly due to the confounding effect of heterogeneous tumour samples. RNA in situ hybridisation can overcome these limitations by measuring mRNA expression at the single cell level.
This study successfully established RNA in situ hybridisation (RNAscope®) as a method for assessing mRNA expression on archival FFPE material in a similar manner to immunohistochemistry for assessing protein expression. This study then utilized RNAscope® to quantify mRNA expression of candidate prognostic markers GFI1 and TNFRSF11A, and analysed their association with clinicopathological features from FFPE colorectal tumour tissue. Furthermore, this study quantified intra-tumoural expression of GFI and TNFRSF11A in different cell types present within the colorectal tumour tissue.
MLH1 immunohistochemistry is used, in conjunction with other genes, as a diagnostic assay to ascertain whether a colorectal cancer patient has a deficient mismatch repair system (microsatellite instability) [4]. Comparing RNAscope® data with immunohistochemistry showed a correlation between RNA and protein levels for MLH1 demonstrating the utility of RNAscope® against an established diagnostic tool. However, despite the use of a positive control gene to ensure RNA integrity in each core, some discrepancies between detection of mRNA and protein expression were encountered. Possible explanations include variable immunohistochemical staining intensities being misinterpreted; the likelihood that not all MLH1 mRNA is translated into protein due to post-translational modifications, or that protein degradation is occurring. Additionally, tumour stage-related changes may also affect mRNA expression levels during tumour progression [7]. Interestingly, previous studies did not find strong correlation between MLH1 mRNA and protein expression in colorectal tumours either [26, 27].
Having established RNAscope® as a technical comparable method to immunohistochemistry, this study successfully utilized RNA in situ hybridisation (RNAscope®) to quantify mRNA expression of candidate prognostic markers GFI1 and TNFRSF11A from FFPE colorectal tumour tissue. Data from RNAscope® showed associations for reduced GFI1 and TNFRSF11A mRNA expression to poor prognostic features, similar to those identified using microarray expression data from a large TCGA study [7].
Reduced expression of GFI1 was significantly associated with left sided and rectal (primary site) tumours. This is in contrast to the observation that left-sided colorectal cases have a better prognosis than right-sided tumours, even when adjusting for possible differences in screening practices and treatment [28]. Our results could be identifying a subset of distal tumours that have poor prognostic outcomes, reflecting differences in tumour biology. This would help contribute to the understanding of molecular subtypes of colorectal cancer and possible prognostic implications. Further studies are required to confirm these findings.
Our RNAscope® data also showed good agreement with the TCGA study [7] for reduced expression of TNFRSF11A and tumour features consistent with poor prognosis, including high nodal stage and metastatic disease. The role of TNFRSF11A in colorectal cancer tumorigenesis remains to be elucidated. There are limited studies reporting TNFRSF11A mRNA expression in colorectal cancer cases [29]. Santini et al., reported TNFRSF11A overexpression in primary tumours of colorectal cancer cases and their associated metastases to the bone [29]. In contrast, our results and those of the previous TCGA study [7], show reduced TNFRSF11A mRNA expression is associated with poor prognosis. A possible explanation is that reduced TNFRSF11A mRNA expression alters the TNFRSF11A /TNFSF11/TNFRSF11B signalling axis in cells. Reduced TNFRSF11A expression leads to reduced availability of TNFSF11, promoting more TNFRSF11B to be available. TNFRSF11B acts as a decoy receptor for TRAIL resulting in decreased TRAIL induced apoptosis, thus allowing cells to survive for longer and proliferate [30]. Furthermore, cells are able to secrete cytokines into the tumour microenvironment to promote an inflammatory state to recruit tumour associated macrophages that support continued tumour cell growth and progression [31]. Alternatively, reduced TNFRSF11A mRNA expression may be associated with a specific molecular subtype(s) of colorectal cancer. A limitation with this study is that molecular subtyping information of cases was not available. Further work is required to determine the role of TNFRSF11A in colorectal tumorigenesis.
Unlike the TCGA study [7], we did not observe an association between GFI1 and lymphatic invasion, fraction of positive lymph nodes (nodal involvement), tumour stage and distant metastasis. Additionally, we did not observe an association between TNFRSF11A and tumour stage or distant metastasis. These differences may be due to the level of power associated with the smaller cohort used in this study. This limitation affected our ability to perform multivariate analysis due to the small proportion of cases within certain categories.
Differences between RNAscope® and the TCGA study [7] may also reflect the selection criteria for the genes used in this study. GFI1 was selected for its high statistical significance ranking for mRNA expression levels and association with prognostic features. Similarly, TNFRSF11A was selected for its high statistical significance ranking of mRNA expression and importantly for the first gene to be known to be affected by CNA status. Analysis of the data downloaded from the cBioPortal demonstrated a statistically significant association between negative mRNA expression and gene copy number loss for both GFI1 and TNFRSF11A gene. These results suggest that copy number loss may explain the reduced expression of these genes seen in some TCGA tumours. Reduced CNA status may be driving reduced expression within our study, especially for TNFRSF11A which was selected based on this premise. Future application of DNA targeted in situ technologies will complement RNAscope® for profiling gene copy number and expression at the single cell level.
Assessment of intra-tumoural heterogeneity within our study was achieved by combining an image analysis tool with RNAscope® to provide a standardised, objective method to quantify mRNA expression levels (mRNA signals/cell) for GFI1 and TNFRSF11A. Our data showed GFI1 and TNFRSF11A were expressed at a significantly higher level in carcinoma cells compared to non-carcinoma cells (lymphocytes, stromal cells and normal cells). Thus, by analysing tumours at the cellular level we were able to demonstrate that reduced mRNA expression levels measured in patients with poorer prognosis were specifically due to carcinoma cells within the tumour and not due to contamination of tumour samples with non-carcinoma cells. It is therefore possible that reduced expression of these genes in patients with poor prognosis found by the TCGA study [7] was due in-part to over-representation of non-carcinoma cells in the analysed samples.
Limitations with using RNA in situ hybridisation include potential issues surrounding RNA recovery and degradation in FFPE material, which have been well documented and encompass pre-analytical variables of specimen fixation, processing and storage prior to TMA construction [32–34]. These factors are known to influence the quality and abundance of RNA within FFPE samples [33]. However, the RNAscope® probes are specifically designed to overcome these issues [15].
In our study, archival FFPE material ranging between 10–15 years old was used. Despite the age of FFPE material, quality mRNA was present in the majority of the TMA cores. However, negative or low expression for positive control mRNA did exist in a minority of cases indicating sub-quality, lowly abundant RNA. No information regarding pre-analytical variables (e.g. tissue handling; tissue fixation times; tissue processing procedures) was available that could help account for these observations.
In conclusion, this study shows the advantages of an mRNA in situ hybridisation technique (RNAscope®) for validating potential gene expression biomarkers from published studies, circumventing the potential limitations associated with qPCR and immunohistochemistry. This study demonstrates RNAscope® as a promising method to visualise and quantify mRNA expression of candidate biomarkers on archival FFPE colorectal cancer cases. This will allow researchers to carry-out retrospective studies on archival FFPE material, which have a wealth of pathological, clinical and follow-up information available, to investigate and validate candidate biomarkers. Our selection of candidate biomarkers using copy number changes provides a level of standardisation that can be implemented across different patient cohorts when investigating biomarkers to overcome the impacts of tumour heterogeneity in gene expression studies. This study found significant associations for altered mRNA expression for the genes, GFI1 and TNFRSF11A, with a selection of poor prognostic features that were consistent with those identified by a large TCGA study. To our knowledge, this is the first study to assess the intercellular expression patterns of these candidate prognostic markers in colorectal tumours. Quantitative data generated by RNAscope® overcame potential affects from tumour heterogeneity, permitting direct association of carcinoma specific mRNA expression level changes with clinicopathological outcomes. Future larger studies are required to confirm the link between GFI1 and TNFRSF11A and patient outcome, and to determine the role of these genes in colorectal cancer development.
MATERIALS AND METHODS
Patient samples
A cohort of 112 primary colorectal adenocarcinoma cases of varying histology, grade, age and gender were obtained from the Christchurch Cancer Society Tissue Bank (Ethics approval #16STH92) [35]. Before obtaining tissue samples, informed consent was obtained from each patient. A detailed description of patient clinicopathological features is shown in Table 6. Two tissue microarrays (TMA) were utilised in this study. The TMAs were made from 102 cases and consisted of duplicate 1mm cores mined from FFPE tumour samples that were representative of the tumour stage at diagnosis. An additional ten cases used in the study were represented by whole histological sections from formalin fixed paraffin embedded (FFPE) tissue.
Table 6: Summary of the clinicopathological features of the 112 colorectal patient samples
Clinicopathological Features |
Number |
|---|---|
Patients (n) |
112 |
Mean age (years ± SD) |
68.97 ± 12.13 |
Gender |
|
Male |
69 |
Female |
41 |
ND |
2 |
Histology |
|
Adenoma |
10 |
Adenocarcinoma |
99 |
Carcinoma |
1 |
ND |
2 |
Mean tumour size, mm ± SD |
45.31 ± 16.00 |
Metastasis Present |
|
Yes |
35 |
No |
72 |
ND |
5 |
Site |
|
Left (Distal) |
61 |
Right (Proximal) |
49 |
ND |
2 |
Primary Site |
|
Ascending |
42 |
Caecum |
5 |
Transverse |
1 |
Descending |
12 |
Sigmoid |
21 |
Rectum |
28 |
ND |
3 |
Tumour Grade |
|
1 |
5 |
2 |
72 |
3 |
17 |
Adenoma |
10 |
ND |
8 |
AJCC Pathologic Tumour Stage |
|
T0 |
9 |
T1 |
5 |
T2 |
22 |
T3 |
64 |
T4 |
9 |
ND |
3 |
AJCC Nodal Stage |
|
N0 |
72 |
N1 |
21 |
N2 |
16 |
ND |
1 |
AJCC Metastatic Stage |
|
M0 |
2 |
M1 |
5 |
MX |
98 |
ND |
5 |
AJCC Tumour Stage Group |
|
0 |
9 |
1 |
21 |
2 |
42 |
3 |
33 |
4 |
4 |
ND |
3 |
Abbreviations: n, Number of; SD, standard deviation; ND, No Data; AJCC, American Joint Committee on Cancer
Identification of prognostic gene markers using published TCGA data
The Cancer Genome Atlas (TCGA) Network published a comprehensive study of gene expression and genomic changes in a series of colon and rectal tumours [12]. This analysis revealed the expression of 1313 genes associated with prognostic features, such as tumour stage, lymphatic invasion, metastasis, lymph node involvement, and histology. We selected two genes, GFI1 and TNFRSF11A, from this study that were highly ranked (1st and 12th, respectively) among the genes associated with tumour aggressiveness, respectively (see Table 7).
Table 7: GFI1 and TNFRSF11A mRNA expression and associations with clinicopathological features from colorectal cancer cases in the TCGA
Gene |
GFI1 |
TNFRSF11A |
|---|---|---|
Tumour Aggressiveness Direction |
−1 |
−1 |
Compound p-value |
1.00E-16 |
8.18E-11 |
Lymphatic Invasion |
0.0475 |
0.149 |
Histological Type |
1.91E-10 |
1.06E-05 |
Vascular Invasion |
0.207 |
0.593 |
Fraction Positive Lymph Nodes |
1.54E-05 |
2.12E-06 |
Tumor Stage |
6.96E-07 |
1.27E-05 |
Distant Metastasis |
3.86E-06 |
6.03E-04 |
GFI1 is a transcription repressor previously associated with intestinal epithelial cell differentiation [36]. TNFRSF11A is a member of the TNF receptor super family, and plays a major role in bone remodelling and immunity [30]. In addition, TNFRSF11A was selected based on the observation that both reduced copy number (18q deletion) and reduced expression were associated with aggressive tumours. Candidate prognostic gene markers showing a correlation between copy number alterations (CNA) and expression are more likely to be evident across a significant proportion of the tumour, and thus circumvent potential non-reproducibility associated with tumour heterogeneity [8]. Therefore, our hypothesis was that detection of CNA, especially DNA copy loss, is less likely if only present in a small proportion of tumour cells.
Public array datasets
Expression data, DNA copy number data and clinicopathological data for 218 colorectal adenocarcinoma patients was downloaded from The Cancer Genome Atlas (TCGA) network (https://cancergenome.nih.gov/; Download: 10 August 2016) and analysed. We also downloaded and compiled microarray expression data for GFI1 and TNFRSF11A, and putative copy number calls for GFI1 and TNFRSF11A, using the cBioPortal for Cancer Genomics (http://www.cbioportal.org; Download: 10 August 2016) [37, 38]. Tests for association with clinicopathological parameters were carried out using the statistical programme R [39].
RNA in-situ hybridisation (RNAscope®)
The mRNA expression levels for GFI1, TNFRSF11A and MLH1 were investigated using the RNAscope® 2.0 Assay (Advanced Cell Diagnostics, Inc. (Hayward, CA)[15]. The probes for GFI1, TNFRSF11A and MLH1 were selected from the ACD RNAscope® probe catalogue for human species. The assay was optimized and performed according to manufacturer’s instructions. Briefly, for both individual tissue and TMA specimens, sections were cut at 4μm thickness and placed on SuperFrost Plus glass slides, before deparaffinising in a series of xylene and 100% ethanol steps. Each section was then subjected to a series of pre-treatment steps before progressing onto hybridisation with target probes for their respective gene. Hybridisation involved placing 4–6 drops from a Ready-To-Use bottle (approximately 150 μL) of the individual target probes onto the slide, enough to cover tissue sections. Positive (PPIB) and negative (DAB) control probes were hybridised to additional sections. Slides were then covered in a HybEZ™ Humidity Control Tray and placed in the HybEZ™ Oven and incubated at 40° C for 2 hours. After this time, a horseradish peroxidase-based signal amplification system was applied to consecutively hybridise pre-amplifier and several amplifiers to the target probes before colour development using diaminobenzedine (DAB). Slides were then counterstained with Gill’s Haematoxylin, dehydrated and cleared before being mounted, coverslipped and assessed microscopically. Slides were determined to be positive for mRNA expression if brown punctuate dots could be seen within cells.
Immunohistochemistry for MLH1
Immunohistochemistry was performed using the Roche VENTANA BenchMark ULTRA System (Ventana Medical Systems, Inc, Tucson, Arizona, USA). For both individual tissue and TMA specimens, 4 μm sections were cut, placed onto SuperFrost Plus glass slides, deparaffinised in xylene and placed in 100% ethanol. Slides were loaded onto the BenchMark ULTRA System and subjected to heat induced epitope retrieval using “Cell Conditioner 1” at 95° C for 64 minutes, followed by incubation with one drop of the VENTANA pre-dilute MLH1 (M1) mouse monoclonal primary antibody (final concentration 1.4 μg/mL) for 16 minutes at 36° C. Detection was achieved with the ultraView Universal DAB Detection Kit, before each section was counterstained with haematoxylin, coverslipped, and assessed microscopically.
Image acquisition
Images were captured using a Zeiss Apotome Microscope and associated software (AxioVersion 4.5. Apotome software, Carl Zeiss Microscopy, LLC, Thornwood, New York, USA). Three representative images of carcinoma cells, normal epithelial cells, lymphocytes and stromal fibroblasts were captured for each tumour case for each individual probe at 40x resolution.
Microscopic assessment of immunohistochemistry and RNAscope® assays
The mRNA expression levels for all three probes were visually assessed by a cytologist (AM-B) and a pathologist (MRW), blinded to clinicopathological data. Slides exhibiting positive mRNA expression were semi-quantitatively and manually assessed for the number of probe signals per cell for each case using the manufacturers scoring system [15]. The scores ranged between 0–4 (0 = Negative; 1 = 1–3 probes per cell at 40x magnification; 2 = 4–6 probes per cell at 40× magnification; 3 = >10 probes per cell at 40x magnification; 4 = >10 probes per cell occupying >10% of slide or at 20x magnification). An RNAscope® score of >2 for the positive control gene (PPIB) is indicative of abundant, good quality RNA. Assessment and scoring of MLH1 immunohistochemistry staining in specimens was carried out by a pathologist (MRW). Positive staining for MLH1 was considered when carcinoma cell nuclei displayed any traces of brown positive staining. A negative staining was considered when carcinoma cell nuclei were negative while other types of cell nuclei were positive. ImageJ software [40] was utilised for quantifying hybridisation signals in different tumour cell types across the whole tissue sections from 10 cases. For each case, 3 × 100 cells per cell type (carcinoma, normal epithelial, lymphocytes and stromal fibroblasts) were counted. Therefore, approximately 3000 cells per cell type were counted for the 10 cases for each gene.
Statistical analysis
The two-sample t-test with Satterthwaite’s adjustment for unequal variances was used to test for differences in means between gene copy number and mRNA mean expression levels. Fisher’s exact test was used to test homogeneity between RNAscope® and immunohistochemistry. Logistic regression was used to test for associations between semi quantitative gene expression levels and clinicopathological features for RNAscope® data. All tests were two sided with a p-value of ≤ 0.05 considered to be significant. ANOVA with Tukey post-hoc t-tests was used to investigate differences in mean mRNA expression levels and cell types. Analysis was performed in R 3.3.1 (Vienna, Austria).
CONFLICTS OF INTEREST
The authors declare they have no conflicts of interest.
REFERENCES
1. Brenner H, Kloor M, Pox CP. Colorectal cancer. Lancet. 2014; 383:1490–502. https://doi.org/10.1016/S0140-6736(13)61649-9.
2. O’Connell JB, Maggard MA, Ko CY. Colon cancer survival rates with the new American Joint Committee on Cancer sixth edition staging. J Natl Cancer Inst. 2004; 96:1420–5. https://doi.org/10.1093/jnci/djh275.
3. Sjo OH, Lunde OC, Nygaard K, Sandvik L, Nesbakken A. Tumour location is a prognostic factor for survival in colonic cancer patients. Colorectal Dis. 2008; 10:33–40. https://doi.org/10.1111/j.1463-1318.2007.01302.x.
4. Morley-Bunker A, Walker LC, Currie MJ, Pearson J, Eglinton T. Translating colorectal cancer genetics into clinically useful biomarkers. Colorectal Dis. 2016; 18:749–62. https://doi.org/10.1111/codi.13334.
5. Guan YF, Li GR, Wang RJ, Yi YT, Yang L, Jiang D, Zhang XP, Peng Y. Application of next-generation sequencing in clinical oncology to advance personalized treatment of cancer. Chin J Cancer. 2012; 31:463–70. https://doi.org/10.5732/cjc.012.10216.
6. Kelley RK, Venook AP. Prognostic and predictive markers in stage II colon cancer: is there a role for gene expression profiling? Clin Colorectal Cancer. 2011; 10:73–80. https://doi.org/10.1016/j.clcc.2011.03.001.
7. Cancer Genome Atlas Network. Comprehensive molecular characterization of human colon and rectal cancer. Nature. 2012; 487:330–7. https://doi.org/10.1038/nature11252.
8. De Sousa E Melo F, Wang X, Jansen M, Fessler E, Trinh A, de Rooij LP, de Jong JH, de Boer OJ, van Leersum R, Bijlsma MF, Rodermond H, van der Heijden M, van Noesel CJ, et al. Poor-prognosis colon cancer is defined by a molecularly distinct subtype and develops from serrated precursor lesions. Nat Med. 2013; 19:614–8. https://doi.org/10.1038/nm.3174.
9. Taylor CR, Levenson RM. Quantification of immunohistochemistry - issues concerning methods, utility and semiquantitative assessment II. Histopathology. 2006; 49:411–24. https://doi.org/10.1111/j.1365-2559.2006.02513.x.
10. Chen G, Gharib TG, Huang CC, Taylor JM, Misek DE, Kardia SL, Giordano TJ, Iannettoni MD, Orringer MB, Hanash SM, Beer DG. Discordant protein and mRNA expression in lung adenocarcinomas. Mol Cell Proteomics. 2002; 1:304–13. Available from http://www.ncbi.nlm.nih.gov/pubmed/12096112.
11. Diagnostics AC. The RNA revolution. 2012.
12. Ozaki K, Nagasaka T, Notohara K, Kambara T, Takeda M, Sasamoto H, Jass JR, Tanaka N, Matsubara N. Heterogeneous microsatellite instability observed within epithelium of ulcerative colitis. Int J Cancer. 2006; 119:2513–9. https://doi.org/10.1002/ijc.22095.
13. Xu BJ. Combining laser capture microdissection and proteomics: Methodologies and clinical applications. Proteomics Clin Appl. 2010; 4:116–23. https://doi.org/10.1002/prca.200900138.
14. Ye X, Luke BT, Wei BR, Kaczmarczyk JA, Loncarek J, Dwyer JE, Johann DJ, Saul RG, Nissley DV, McCormick F, Whiteley GR, Blonder J. Direct molecular dissection of tumor parenchyma from tumor stroma in tumor xenograft using mass spectrometry-based glycoproteomics. Oncotarget. 2018; 9:26431–52. https://doi.org/10.18632/oncotarget.25449.
15. Wang F, Flanagan J, Su N, Wang LC, Bui S, Nielson A, Wu X, Vo HT, Ma XJ, Luo Y. RNAscope: a novel in situ RNA analysis platform for formalin-fixed, paraffin-embedded tissues. J Mol Diagn. 2012; 14:22–9. https://doi.org/10.1016/j.jmoldx.2011.08.002.
16. Scoazec JY. The RNA revolution. Ann Pathol. 2006; 26:275–80.
17. Ukpo OC, Flanagan JJ, Ma XJ, Luo Y, Thorstad WL, Lewis Jr JS. High-risk human papillomavirus E6/E7 mRNA detection by a novel in situ hybridization assay strongly correlates with p16 expression and patient outcomes in oropharyngeal squamous cell carcinoma. Am J Surg Pathol. 2011; 35:1343–50. https://doi.org/10.1097/PAS.0b013e318220e59d.
18. Bishop JA, Ma XJ, Wang H, Luo Y, Illei PB, Begum S, Taube JM, Koch WM, Westra WH. Detection of transcriptionally active high-risk HPV in patients with head and neck squamous cell carcinoma as visualized by a novel E6/E7 mRNA in situ hybridization method. Am J Surg Pathol. 2012; 36:1874–82. https://doi.org/10.1097/PAS.0b013e318265fb2b.
19. Schache AG, Liloglou T, Risk JM, Jones TM, Ma XJ, Wang H, Bui S, Luo Y, Sloan P, Shaw RJ, Robinson M. Validation of a novel diagnostic standard in HPV-positive oropharyngeal squamous cell carcinoma. Br J Cancer. 2013; 108:1332–9. https://doi.org/10.1038/bjc.2013.63.
20. Ziskin JL, Dunlap D, Yaylaoglu M, Fodor IK, Forrest WF, Patel R, Ge N, Hutchins GG, Pine JK, Quirke P, Koeppen H, Jubb AM. In situ validation of an intestinal stem cell signature in colorectal cancer. Gut. 2013; 62:1012–23. https://doi.org/10.1136/gutjnl-2011-301195.
21. Barry ER, Morikawa T, Butler BL, Shrestha K, de la Rosa R, Yan KS, Fuchs CS, Magness ST, Smits R, Ogino S, Kuo CJ, Camargo FD. Restriction of intestinal stem cell expansion and the regenerative response by YAP. Nature. 2013; 493:106–10. https://doi.org/10.1038/nature11693.
22. Jang BG, Lee BL, Kim WH. Distribution of LGR5+ cells and associated implications during the early stage of gastric tumorigenesis. PLoS One. 2013; 8:e82390. https://doi.org/10.1371/journal.pone.0082390.
23. Payne RE, Wang F, Su N, Krell J, Zebrowski A, Yague E, Ma XJ, Luo Y, Coombes RC. Viable circulating tumour cell detection using multiplex RNA in situ hybridisation predicts progression-free survival in metastatic breast cancer patients. Br J Cancer. 2012; 106:1790–7. https://doi.org/10.1038/bjc.2012.137.
24. Yu M, Bardia A, Wittner BS, Stott SL, Smas ME, Ting DT, Isakoff SJ, Ciciliano JC, Wells MN, Shah AM, Concannon KF, Donaldson MC, Sequist LV, et al. Circulating breast tumor cells exhibit dynamic changes in epithelial and mesenchymal composition. Science. 2013; 339:580–4. https://doi.org/10.1126/science.1228522.
25. Wang Z, Portier BP, Gruver AM, Bui S, Wang H, Su N, Vo HT, Ma XJ, Luo Y, Budd GT, Tubbs RR. Automated quantitative RNA in situ hybridization for resolution of equivocal and heterogeneous ERBB2 (HER2) status in invasive breast carcinoma. J Mol Diagn. 2013; 15:210–9. https://doi.org/10.1016/j.jmoldx.2012.10.003.
26. Furukawa T, Konishi F, Masubuchi S, Shitoh K, Nagai H, Tsukamoto T. Densely methylated MLH1 promoter correlates with decreased mRNA expression in sporadic colorectal cancers. Genes Chromosomes Cancer. 2002; 35: 1–10. https://doi.org/10.1002/gcc.10100.
27. Jensen LH, Rasmussen AA, Byriel L, Kuramochi H, Crüger DG, Lindebjerg J, Danenberg PV, Jakobsen A, Danenberg K. Regulation of MLH1 mRNA and protein expression by promoter methylation in primary colorectal cancer: A descriptive and prognostic cancer marker study. Cell Oncol. 2013; 36:411–9. https://doi.org/10.1007/s13402-013-0148-2.
28. Wong R. Proximal tumors are associated with greater mortality in colon cancer. J Gen Intern Med. 2010; 25:1157–63. https://doi.org/10.1007/s11606-010-1460-4.
29. Santini D, Perrone G, Roato I, Godio L, Pantano F, Grasso D, Russo A, Vincenzi B, Fratto ME, Sabbatini R, Della Pepa C, Porta C, Del Conte A, et al. Expression pattern of receptor activator of NFκB (RANK) in a series of primary solid tumors and related bone metastases. J Cell Physiol. 2011; 226:780–4. https://doi.org/10.1002/jcp.22402.
30. Renema N, Navet B, Heymann MF, Lezot F, Heymann D. RANK-RANKL signalling in cancer. Biosci Rep. 2016; 36. https://doi.org/10.1042/BSR20160150.
31. Kianercy A, Pienta KJ. Positive feedback loops between inflammatory, bone and cancer cells during metastatatic niche construction. Adv Exp Med Biol. 2016; 936:137–48. https://doi.org/10.1007/978-3-319-25601-6.
32. Hewitt SM, Lewis FA, Cao Y, Conrad RC, Cronin M, Danenberg KD, Goralski TJ, Langmore JP, Raja RG, Williams PM, Palma JF, Warrington JA. Tissue handling and specimen preparation in surgical pathology: issues concerning the recovery of nucleic acids from formalin-fixed, paraffin-embedded tissue. Arch Pathol Lab Med. 2008; 132:1929–35.
33. Landolt L, Marti HP, Beisland C, Flatberg A, Eikrem OS. RNA extraction for RNA sequencing of archival renal tissues. Scand J Clin Lab Invest. 2016; 5513:1–9. https://doi.org/10.1080/00365513.2016.1177660.
34. Hara K, Watanabe A, Matsumoto S, Matsuda Y, Kuwata T, Kan H, Yamada T, Koizumi M, Shinji S, Yamagishi A, Ishiwata T, Naito Z, Shimada T, et al. Surgical Specimens of Colorectal Cancer Fixed with PAXgene Tissue System Preserve High-Quality RNA. Biopreserv Biobank. 2015; 13:325–34. https://doi.org/10.1089/bio.2014.0101.
35. Morrin H, Gunningham S, Currie M, Dachs G, Fox S, Robinson B. The Christchurch Tissue Bank to support cancer research. N Z Med J. 2005; 118:1–13.
36. Shroyer NF, Wallis D, Venken KJ, Bellen HJ, Zoghbi HY. Gfi1 functions downstream of Math1 to control intestinal secretory cell subtype allocation and differentiation. Genes Dev. 2005; 19:2412–7. https://doi.org/10.1101/gad.1353905.
37. Cerami E, Gao J, Dogrusoz U, Gross BE, Sumer SO, Aksoy BA, Jacobsen A, Byrne CJ, Heuer ML, Larsson E, Antipin Y, Reva B, Goldberg AP, et al. The cBio Cancer Genomics Portal: An open platform for exploring multidimensional cancer genomics data. Cancer Discov. 2012; 2:401–4. https://doi.org/10.1158/2159-8290.CD-12-0095.
38. Gao J, Aksoy B, Dogrusoz U, Dresdner G. Integrative analysis of complex cancer genomics and clinical profiles using the cBioPortal. Science. 2013; 6:1–20. Available from http://www.ncbi.nlm.nih.gov/pmc/articles/PMC4160307/.
39. R Development Core Team. R: A language and environment for statistical computing. R Foundation for Statistical Computing, Vienna, Austria. URL http://www.R-project.org/. R Foundation for Statistical Computing, Vienna, Austria. 2013.
40. Schindelin J, Rueden CT, Hiner MC, Eliceiri KW. The ImageJ ecosystem: An open platform for biomedical image analysis. Mol Reprod Dev. 2015; 82:518–529. https://doi.org/10.1002/mrd.22489.