
INTRODUCTION
The biogenesis of microRNAs (miRNAs) occurs in the nucleus and in the cytoplasm. In the nucleus, the microprocessor complex, composed by the ribonuclease DROSHA and by the RNA binding protein DGCR8 (DGCR8, microprocessor complex subunit), cleaves the primary transcripts of miRNAs (pri-miRNAs) in pre-miRNAs of about 70 nucleotides. Pre-miRNAs exit the nucleus by exportin 5 (XPO5), and in the cytoplasm they undergo further processing by the ribonuclease DICER1 and the RNA binding protein TARBP2 (TARBP2, RISC loading complex RNA binding subunit) [1]. This step produces mature miRNAs that will be assembled in the RNA-induced silencing complex in order to silence the expression of specific targets by translational repression, mRNA deadenylation and decay [2].
The alteration of this machinery has been reported in several human cancers; however, the extent of this dysregulation is controversial. In fact, the effect of the up- or down-regulation of the miRNA processing genes seems to be tissue-specific [1, 3]. For instance, in some tumors like acute myeloid leukaemia, prostate and oral cancers, DICER1 is overexpressed both at the mRNA and the protein level. On the contrary, in other tumors such as lung, skin and breast cancers, low levels of DICER1 mRNA or protein are associated with malignant lesions and poor prognosis [1].
Alongside expression alterations, mutations in the genes involved in the processing of miRNAs have been reported both at the somatic and germline levels [1, 3–5]. In particular, germline mutations in DICER1 predispose individuals to multiple tumors, benign and malignant alike, including pleuropulmonary blastoma, cystic nefroma, embryonal rhabdomyosarcoma and multinodular goiter [1, 6]. As regards thyroid disorders, germline mutations in DICER1 are associated with a higher risk to develop not only benign conditions but also well-differentiated carcinomas [7]. Furthermore, somatic mutations, especially in the RNase IIIb domain, are potential driver events in well-differentiated thyroid cancer [8–10], probably leading to an imbalance in miRNA processing and in particular to a consistent loss of mature 5p miRNAs [11].
In this complex and variable scenario, we investigated the presence of mutations in the hot spot regions of genes involved in miRNA processing in follicular-patterned thyroid tumors. In detail, we focused on crucial regions considering both the functional domains and the presence of somatic mutations described in the literature. We also tested the presence of mutations in the most commonly affected genes in thyroid cancer. Finally, we evaluated the mRNA expression levels of DICER1, DROSHA, TARBP2, DGCR8 and XPO5, and the miRNA expression profile.
RESULTS
Clinico-pathological features
Among the 41 follicular patterned thyroid lesions, there were 19 follicular adenomas (FAs) and 22 follicular variant of papillary thyroid carcinomas (FVPTCs). None of the cases presented oncocytic aspects. Among the 22 FVPTCs, nine were encapsulated non-invasive, eight encapsulated invasive, and five infiltrative. None of the encapsulated non-invasive lesions met the diagnostic criteria of non-invasive follicular thyroid neoplasms with papillary-like nuclear features [12, 13]. Overall, there were nine males and 32 females, the mean age was 44.4 ± 15.5 years and the mean size was 36 ± 16 mm. There were no differences between FAs and FVPTCs in terms of gender, age and size.
Mutational status and mutation prediction
Overall, 14 somatic and four germline mutations were found in heterozygosis. Briefly, eight out of 14 somatic mutations were NRAS, four HRAS and two DICER1. No PAX8-PPARG rearrangements were detected, and no mutations were found in BRAF, KRAS, DGCR8 and TARBP2. Both DICER1 mutations were detected in FAs. All germline mutations were synonymous DROSHA variants, two were p.S981S and two were p.Y1199Y. Two DROSHA germline mutant carriers also harbored RAS mutations. Three out of 14 somatic mutations were found in FAs, whereas 11 were detected in FVPTCs. Germline mutations were equally split between FAs and FVPTCs. Details are shown in Table 1. Germline DROSHA mutations were already reported as single nucleotide variants, rs17485810 (p.S981S) and rs61748189 (p.Y1199Y). However, the minor allele frequencies on Exome Aggregation Consortium (ExAC) [14] and 1000 Genomes [15] were 0.0032 and 0.0028 for rs17485810, and 0.0080 and 0.0038 for rs61748189, respectively. Both variants were predicted to be disease causing by Mutation Taster (without amino acid exchange model, prob=1); in detail, p.S981S affects a splicing site, whereas p.Y1199Y involves a CG-rich region, potentially affecting Histone 3 Lysine 36 Tri-Methylation. Patients carrying DROSHA germline mutations were younger than the others, but the p value was not significant (p=0.0633).
Table 1: Mutational status
Histology |
NRAS |
HRAS |
DICER1 |
DROSHA |
|---|---|---|---|---|
FAs (n=19) |
1 p.Q61R |
- |
1 p.D1810V |
1 p.S981S |
FVPTCs (n=22) |
7 p.Q61R |
4 p.Q61R |
1 p.S981S |
FAs follicular adenomas; FVPTCs follicular variant of papillary thyroid carcinomas.
miRNA expression analyses
A total of 143 miRNAs were considered after normalization. The principal component analysis (PCA) produced 41 principal components; the first two accounted for 41.7% of variance and were used for plotting. As illustrated in Figure 1, FA8 and FA19, both harboring DICER1 mutations, mostly contributed to the variance. Hierarchical clustering showed that the miRNA profiles of the two DICER1 mutated cases were highly correlated (Figure 2). 5p and 3p percentages were defined as the proportion of cumulative 5p and 3p miRNA normalized counts on the total of normalized miRNA counts per sample, respectively. All samples had a predominance of 5p miRNAs, except for the two DICER1-mutant FAs (Figure 3).
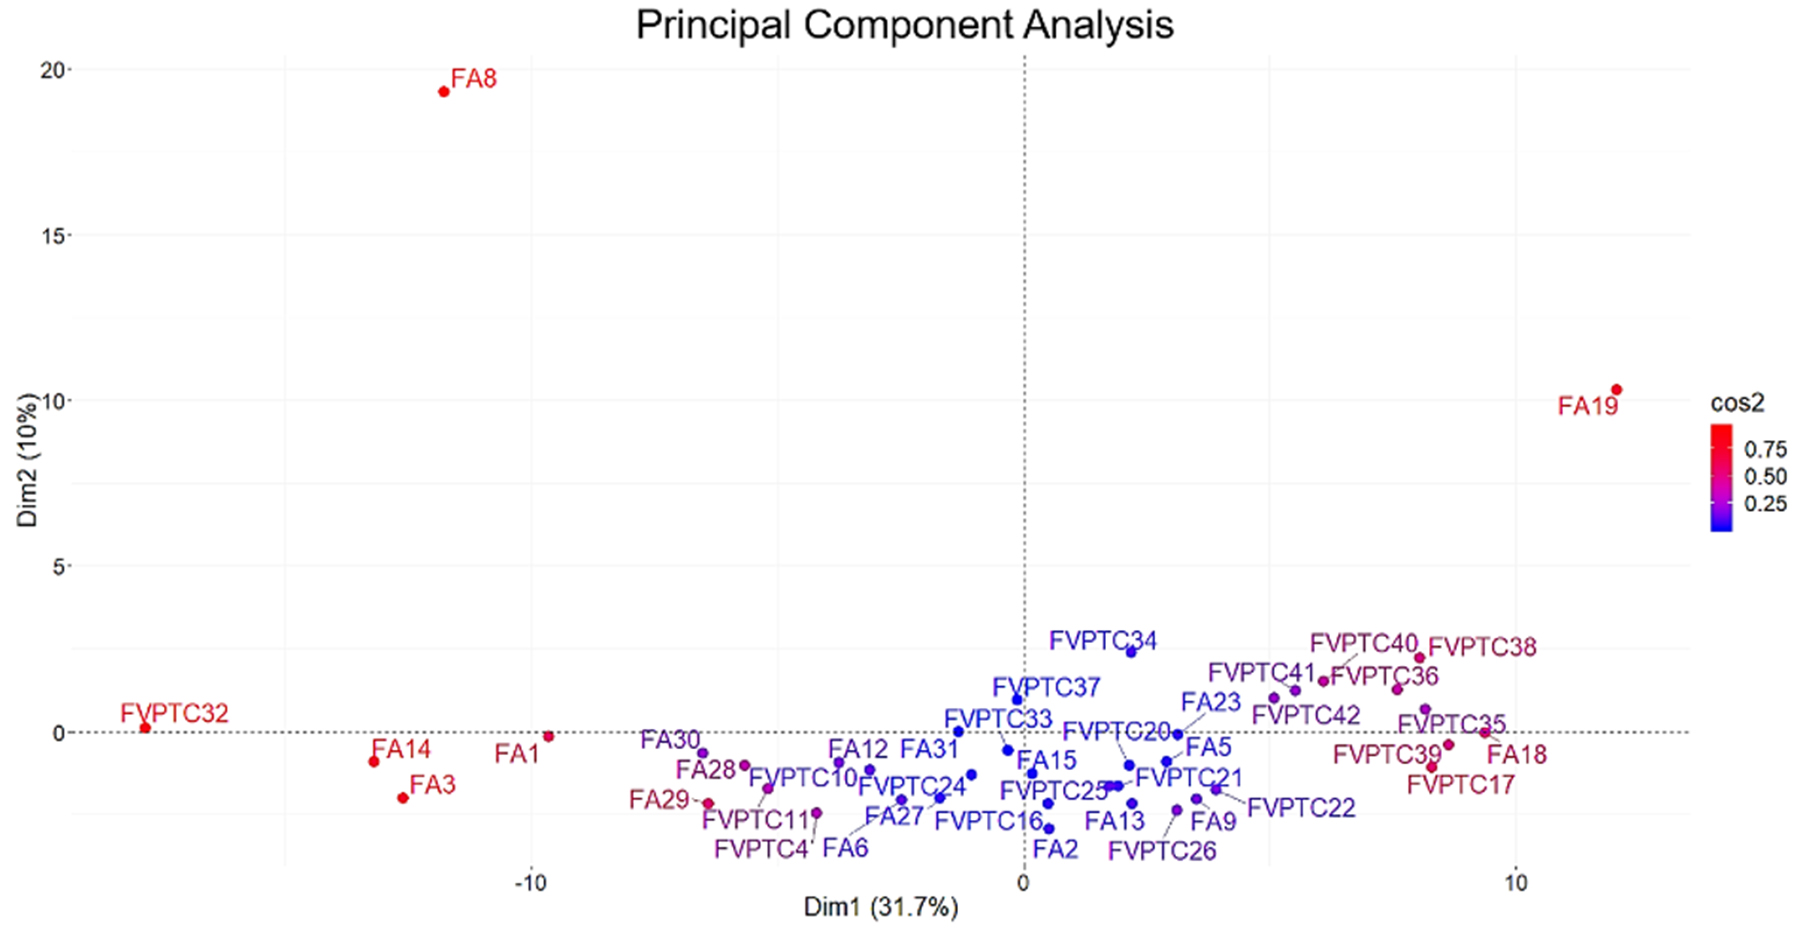
Figure 1: Principal component analysis. All the 143 miRNAs considered were used in the analysis. Principal components 1 and 2 accounted for 41.7% of variability and were used for plotting. DICER1 mutated cases (FA8 and FA19) mostly contributed to the variance as highlighted by squared cosine (cos2).
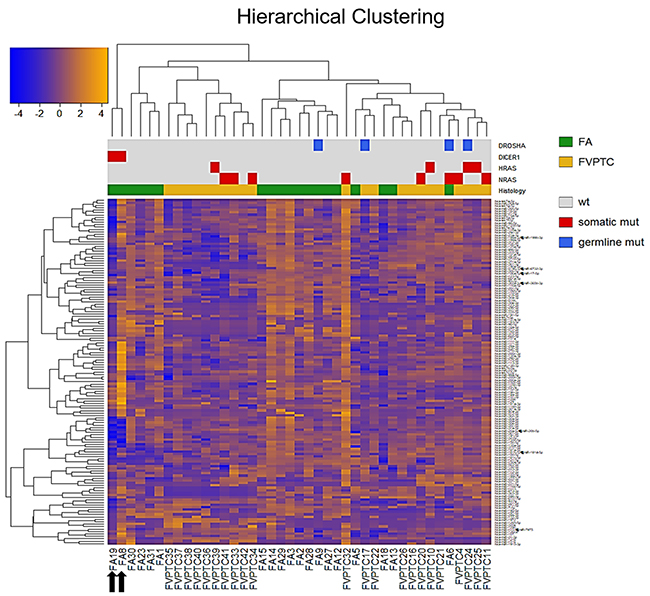
Figure 2: Hierarchical clustering. All the 143 miRNAs (rows) and samples (columns) were independently clustered using Pearson’s correlation. Sidebars show the histological class and the mutational status. Black arrows emphasize the two DICER1 mutant FAs. FA follicular adenoma, FVPTC follicular variant of papillary thyroid carcinoma.
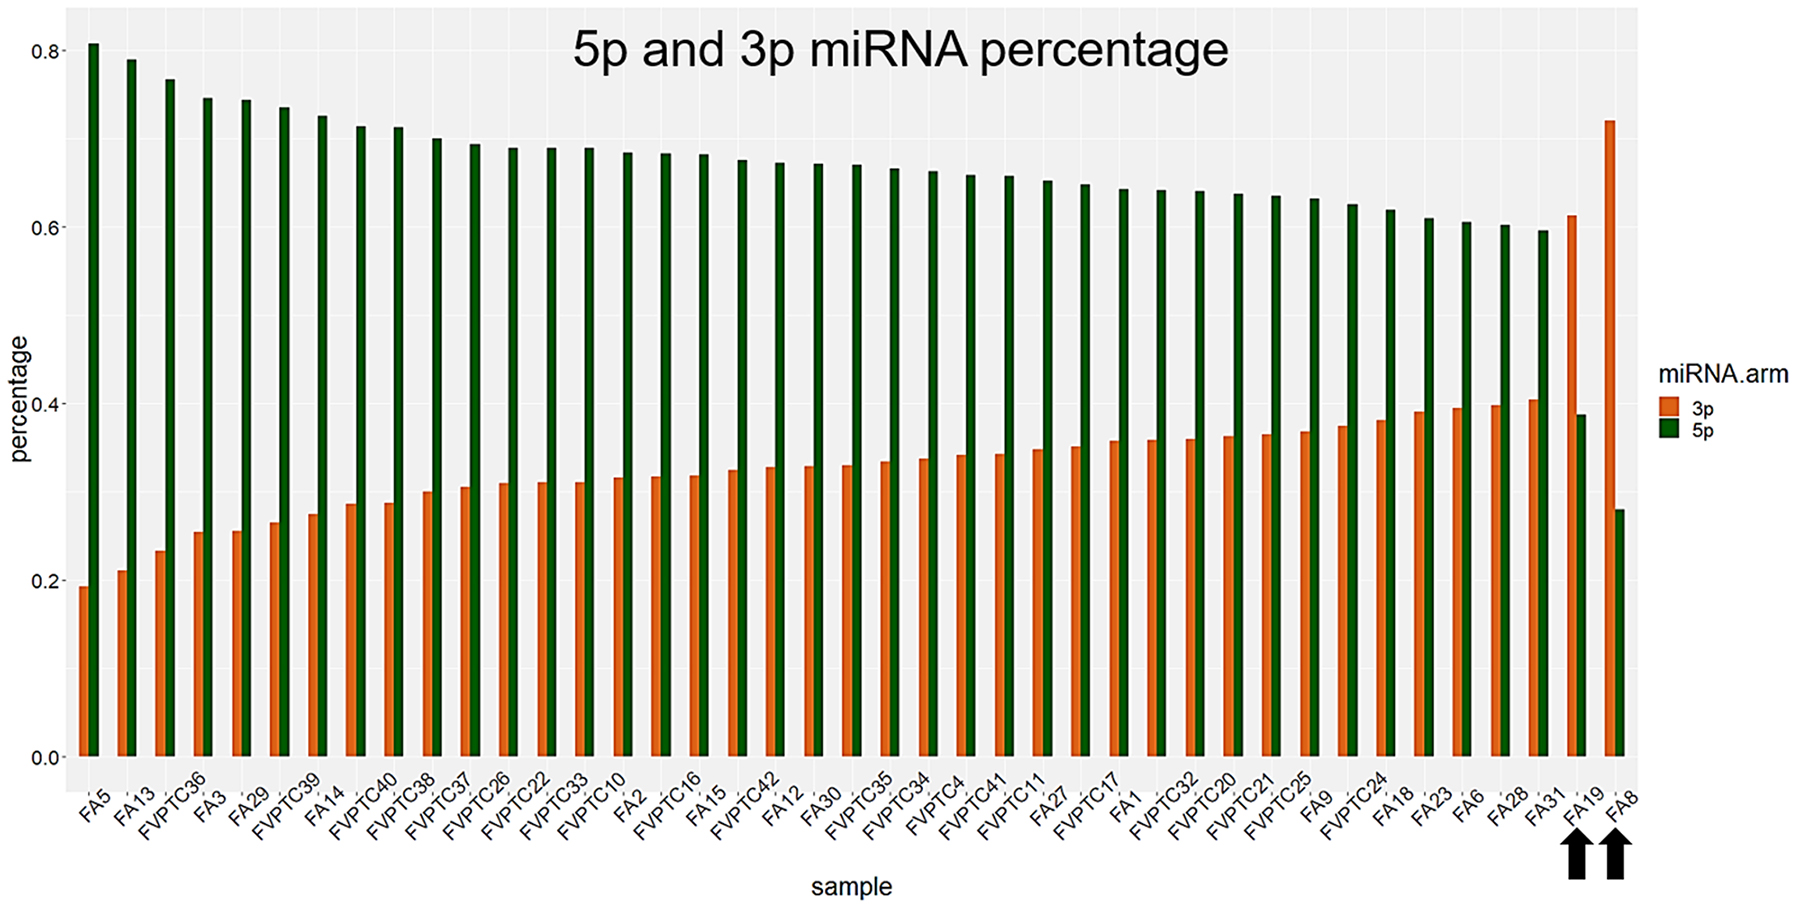
Figure 3: 3p and 5p percentages. Percentages were defined as the amount of 3p and 5p miRNAs out of the total. DICER1 mutated cases, highlighted by black arrows, had a remarkable reduction of 5p miRNAs.
Twenty-two, 29 and 28 miRNAs were differentially expressed by contrasting FAs versus DICER1-mutant FAs, FVPTCs versus DICER1-mutant FAs and FAs versus FVTPCs, respectively. Some of these miRNAs were differently expressed in more than one comparison, but 17 were specifically deregulated in FVPTCs compared to FAs. Finally, 15 miRNAs were deregulated in DICER1-mutant FAs versus both DICER1-negative FVPTCs and FAs (Figure 4 and Table 2). These 15 miRNAs were then tested for pathway enrichment analysis to highlight pathways deregulated in DICER1-mutant lesions. Twenty-four pathways were enriched, and fatty acids synthesis and metabolism were among those with the highest confidence. In addition, crucial pathways in cancer such as Hippo, p53 and TGF-beta signalling were also enriched (Figure 5).
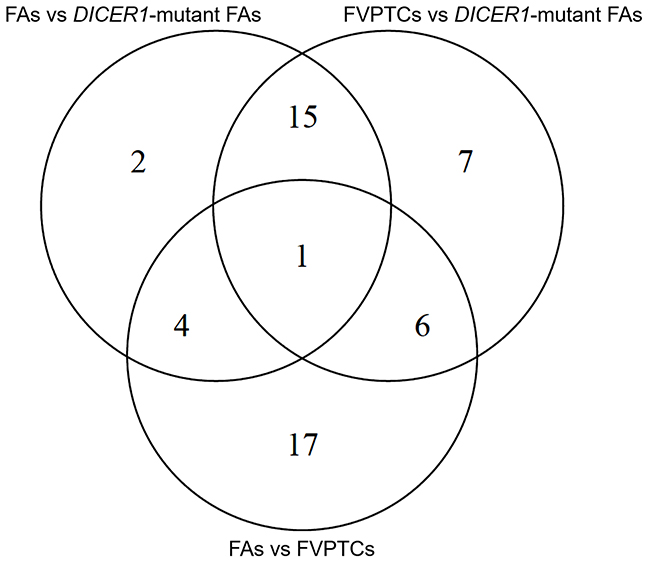
Figure 4: Venn diagram of differentially expressed miRNAs.
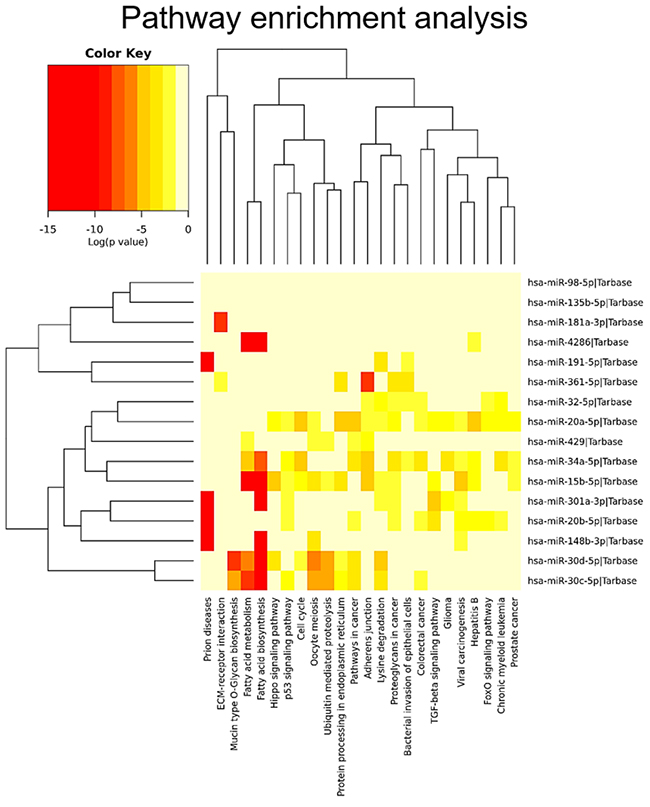
Figure 5: Pathway enrichment analysis. The 15 DICER1-specific miRNAs were used in the analysis to predict the pathways that could be affected.
Table 2: miRNA differential expression analysis
FAs vs DICER1-mutant FAs |
FVPTCs vs DICER1-mutant FAs |
FAs vs FVPTCs |
||||
|---|---|---|---|---|---|---|
miRNA |
log FC |
FDR |
log FC |
FDR |
log FC |
FDR |
hsa-miR-106a-5p + hsa-miR-17-5p |
-3.32 |
0.0009 |
||||
hsa-miR-106b-5p |
-4.47 |
0.0079 |
-2.07 |
0.0281 |
||
hsa-miR-126-3p |
2.57 |
0.0100 |
-0.81 |
0.0343 |
||
hsa-miR-135a-5p |
-2.65 |
0.0076 |
||||
hsa-miR-135b-5p |
-5.61 |
0.0002 |
-4.86 |
0.0007 |
||
hsa-miR-146b-5p |
3.29 |
0.0322 |
||||
hsa-miR-148b-3p |
2.92 |
0.0144 |
3.65 |
0.0029 |
||
hsa-miR-151a-5p |
-4.89 |
0.0041 |
||||
hsa-miR-152-3p |
7.62 |
<0.0001 |
-2.61 |
0.0130 |
||
hsa-miR-15b-5p |
-3.45 |
0.0076 |
-2.70 |
0.0273 |
||
hsa-miR-181a-3p |
5.57 |
0.0012 |
5.36 |
0.0010 |
||
hsa-miR-181a-5p |
-1.96 |
0.0487 |
||||
hsa-miR-185-5p |
-2.10 |
0.0199 |
||||
hsa-miR-191-5p |
-2.92 |
0.0009 |
-2.56 |
0.0025 |
||
hsa-miR-195-5p |
-2.70 |
0.0281 |
||||
hsa-miR-19a-3p |
6.80 |
0.0034 |
-2.12 |
0.0482 |
||
hsa-miR-19b-3p |
3.75 |
0.0100 |
-1.06 |
0.0495 |
||
hsa-miR-200c-3p |
2.69 |
0.0218 |
||||
hsa-miR-204-5p |
-2.87 |
0.0465 |
||||
hsa-miR-221-3p |
3.80 |
0.0343 |
||||
hsa-miR-222-3p |
2.46 |
0.0192 |
||||
hsa-miR-20a-5p + hsa-miR-20b-5p |
-3.08 |
0.0222 |
-3.29 |
0.0030 |
||
hsa-miR-25-3p |
2.12 |
0.0487 |
||||
hsa-miR-28-5p |
-2.61 |
0.0123 |
-1.72 |
0.0394 |
||
hsa-miR-296-5p |
-2.40 |
0.0130 |
||||
hsa-miR-301a-3p |
4.18 |
0.0136 |
5.55 |
0.0273 |
||
hsa-miR-30c-5p |
-6.18 |
0.0003 |
-5.22 |
0.0004 |
||
hsa-miR-30d-5p |
-2.92 |
0.0123 |
-2.78 |
0.0025 |
||
hsa-miR-30e-3p |
5.61 |
0.0281 |
-2.97 |
0.0130 |
||
hsa-miR-30e-5p |
-3.90 |
0.0037 |
-3.00 |
0.0042 |
-0.90 |
0.0495 |
hsa-miR-3151-5p |
-3.63 |
0.0025 |
||||
hsa-miR-32-5p |
-6.61 |
0.0002 |
-5.93 |
0.0011 |
||
hsa-miR-331-3p |
-2.30 |
0.0322 |
||||
hsa-miR-340-5p |
-2.25 |
0.0458 |
||||
hsa-miR-34a-5p |
-4.40 |
0.0006 |
-4.55 |
<0.0001 |
||
hsa-miR-361-3p |
-2.59 |
0.0192 |
||||
hsa-miR-361-5p |
-5.47 |
0.0076 |
-5.38 |
0.0001 |
||
hsa-miR-363-3p |
-2.20 |
0.0488 |
||||
hsa-miR-365a-3p + hsa-miR-365b-3p |
-2.51 |
0.0343 |
||||
hsa-miR-374b-5p |
-4.54 |
0.0158 |
-1.80 |
0.0495 |
||
hsa-miR-423-3p |
-5.21 |
0.0002 |
-2.55 |
0.0130 |
||
hsa-miR-424-5p |
-4.66 |
0.0025 |
||||
hsa-miR-4286 |
4.02 |
0.0173 |
3.89 |
0.0218 |
||
hsa-miR-429 |
8.65 |
0.0006 |
8.46 |
0.0010 |
||
log FC |
FDR |
log FC |
FDR |
log FC |
FDR |
|
hsa-miR-4454 + hsa-miR-7975 |
1.28 |
0.0343 |
||||
hsa-miR-4516 |
2.33 |
0.0480 |
||||
hsa-miR-451a |
2.37 |
0.0218 |
||||
hsa-miR-454-3p |
5.50 |
0.0174 |
-2.36 |
0.0281 |
||
hsa-miR-518b |
-3.24 |
0.0130 |
||||
hsa-miR-5196-3p + hsa-miR-6732-3p |
-2.83 |
0.0192 |
||||
hsa-miR-660-5p |
-2.30 |
0.0385 |
||||
hsa-miR-98-5p |
-2.20 |
0.0135 |
-1.88 |
0.0218 |
||
Abbreviations: FAs, follicular adenomas; FVPTCs, follicular variant of papillary thyroid carcinomas; FC, fold change; FDR, false discovery rate.
mRNA expression levels
The expression levels of DGCR8, DICER1, DROSHA, TARBP2 and XPO5 were not significantly different between FAs and FVPTCs. However, the two DICER1 mutated FAs had high mRNA levels of DICER1 (Figure 6A). Likewise, the two lesions harboring DROSHA p.Y1199Y variant had high levels of DROSHA mRNA (Figure 6B).
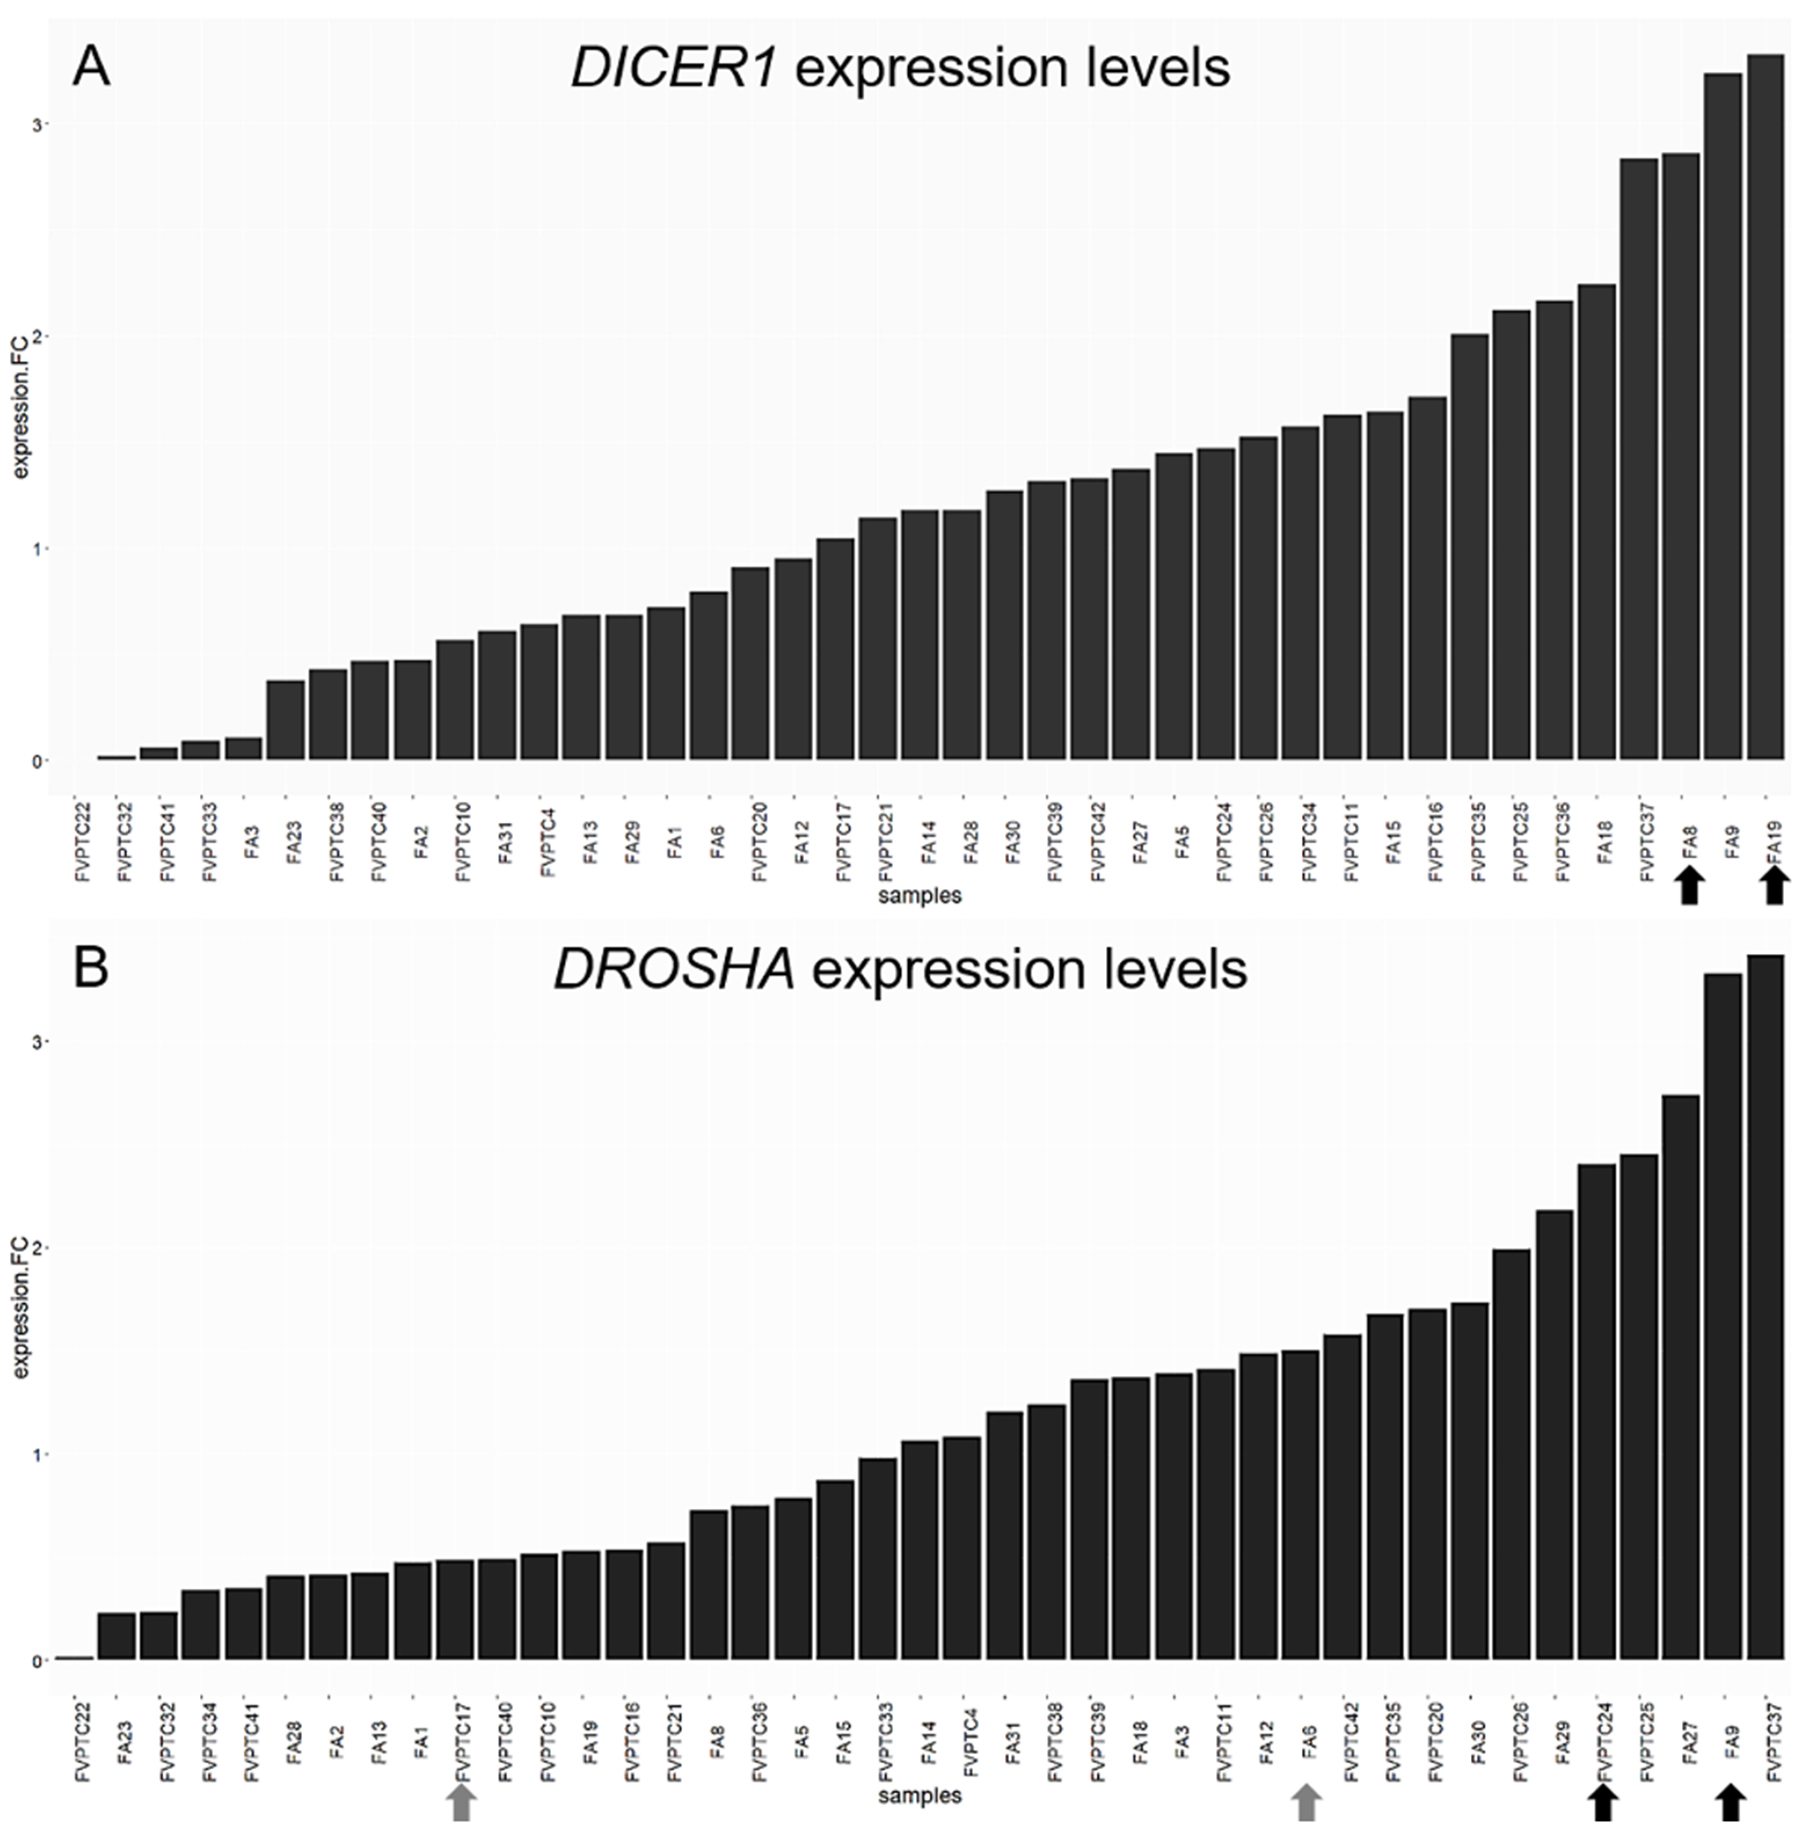
Figure 6: DICER1 and DROSHA expression levels. Histograms represent the log-fold change expression of DICER1 (A) and DROSHA (B) mRNA calculated by the ΔΔCt method. The two DICER1 mutants (A) and DROSHA p.Y1199Y (B) carriers are emphasized by black arrows. Grey arrows highlight DROSHA p.S981S carriers.
TCGA data analysis
Three TCGA cases harbored DICER1 mutations (0.6%); two of these cases were in the RNase IIIb domain (one p.E1813G and one p.D1810H) and one in the double strand RNA-binding domain (p.R1906S). The mutations in the RNase IIIb domain did not coexist with RAS or BRAF mutations, whereas the case harboring DICER1 p.R1906S had a concomitant NRAS p.Q61R. Further details are reported in Table 3. Two cases (0.5%) harbored mutations in the double strand RNA-binding domain of DGCR8 (two p.E518K), but they both had a concomitant NRAS mutation. One of the two cases harboring DGCR8 p.E518Kshowed no consistent loss of 5p miRNAs.
Table 3: TCGA data analysis of DICER1 mutant cases
ID |
TCGA-EL-A3D5 |
TCGA-EL-A3GO |
TCGA-EM-A2CT |
|||
|---|---|---|---|---|---|---|
Histology |
CVPTC |
CVPTC |
FVPTC |
|||
DICER1 mutation |
E1813G |
D1810H |
R1906S |
|||
DICER1 mutation domain |
RNase IIIb |
RNase IIIb |
double-stranded RNA binding |
|||
Other mutations |
TP53 |
E343Afs*3 |
SHQ1 |
D13H |
NRAS |
Q61R |
Copy number alteration |
PDE3A |
AMP |
PTPRT |
AMP |
DUSP22 |
AMP |
Putative driver |
DICER1 E1813G |
DICER1 D1810H |
NRAS Q61R |
|||
DICER1 mRNA expression percentile |
99.18 |
99.59 |
60.29 |
|||
5p miRNA percentage percentile |
0.18 |
0.53 |
7.03 |
|||
Abbreviations: CVPTC, classic variant of papillary thyroid carcinoma; FVPTC, follicular variant of papillary thyroid carcinoma; AMP, amplification; DEL, deletion.
DISCUSSION
In the deep sequencing era, there is an urgent need for the discovered mutations to be contextualized so that they may be helpful in the clinical practice. Thyroid cancer is a paradigm for the use of molecular information in the clinical field, especially for diagnostic purposes. Follicular-patterned lesions are the major challenge in the pre-surgical diagnosis of thyroid nodules; for this reason, they are frequently sequenced in order to find mutations that could help to distinguish benign from malignant lesions [8–10]. This deep sequencing unearthed several somatic mutations previously unknown. Among these, DICER1 mutations were formerly known as germline mutations, which are associated with the so-called DICER1-syndrome and predispose carriers not only to multinodular goiter but also to pleuropulmonary blastoma, cystic nefroma and embryonal rhabdomyosarcoma. Although somatic DICER1 mutations have not been extensively studied in thyroid cancer, it is accepted that they are driver events [6, 7]. However, their potential usefulness in the clinical practice is still questionable, also because they are shared by both benign and malignant lesions [9]. In this scenario, we sought to contextualize genetic alterations in DICER1 and in the other miRNA processing genes concerning the molecular dysregulations they produce, in order to provide important information for clinical decisions in presence of lesions harboring these alterations.
Our series confirmed that somatic DICER1 mutations have never coexisted with the most common driver mutations in thyroid cancer. However, the two DICER1 mutated cases were FAs: despite the benign nature of these lesions, PCA highlighted the entity of miRNA dysregulation (Figure 1), and the miRNA profile of the two lesions harboring DICER1 p.D1810V and p.E1813K was very similar (Figure 2). The dysregulation mainly affected 5p miRNAs (Figure 3), as previously reported in other cancer models [11]. In spite of the low number of DICER1-mutants and the consequent low statistical power, several miRNAs were deregulated when contrasting FAs harboring DICER1 mutations with both FVPTCs and FAs (Table 2). Consistently with the previous analysis, all differently expressed 5p miRNAs were downregulated in DICER1-mutant group with respect to FAs as well as FVPTCs. Interestingly, there was very little overlap between miRNAs deregulated in FVPTCs and in DICER1-mutants versus FAs (Figure 4). Moreover, 15 miRNAs were specifically deregulated in DICER1-mutants. These miRNAs were then tested for pathway enrichment analysis to identify pathways affected by such a deregulation. The analysis showed that these miRNAs are crucial in several pathways (Figure 5), and not only metabolic ones or pathway fitting benign conditions such as fatty acids metabolism, but they also regulate pathways with a pivotal role in cancer, such as Hippo, p53 and TGF-beta [16, 17]. In addition, adherens junction and proteoglycan pathways also seem to be affected, and they are known to be involved in the malignant transformation due to the gaining of an invasive potential [18, 19].
As concerns DROSHA germline mutations, p.S981S and p.Y1199Y have been previously described in both ExAC and 1000 Genomes, in which individuals with evident diseases have been removed. However, the frequencies of these variants were considerably lower than the 0.01 cut-off value for polymorphisms, but were much higher in our series. This difference could be due to chance, but there was also an interesting trend for these DROSHA germline mutant carriers to be younger than the other patients were.
Indeed, our study suffers from some limitations such as low number of samples, especially DICER1 mutants. Although we did not perform a functional analysis of DICER1 mutations, our results are consistent with the findings of Anglesio et al. regarding engineered mice embryonal stem cells, in which mutations affecting the heme-binding residues in the RNase IIIb domain of DICER1 resulted in a loss of mature 5p miRNAs [11]. Moreover, we confirmed our findings with TCGA data, in which cases harboring DICER1 mutations in the RNase IIIb domain never coexisted with other well-known driver mutations in thyroid cancer. Although these cases had a high expression level of DICER1 mRNA, they had a remarkable reduction in mature 5p miRNAs (Table 3).
To sum up, our study provided further evidences of the involvement of the miRNA processing genes and of miRNA dysregulation in thyroid cancer. There are some points that need to be highlighted: a) DROSHA rs17485810 and rs61748189 germline variants could be predisposing, but not sufficient factors for thyroid tumors, as demonstrated by the co-occurrence of RAS mutations; b) DICER1 somatic mutations are not specific markers for malignancy, and further studies providing sufficient follow-up data, real frequencies and, most importantly, the risk of malignancy associated with them are needed; c) DICER1 somatic mutations in the RNase IIIb domain strongly impair miRNA processing; d) the deregulation of miRNAs in DICER1-mutants is peculiar and different from that in FVPTCs. When detected preoperatively, DICER1 mutations could then suggest a surgical approach to these lesions, since tumors harboring DICER1 mutations are very different from wild-type ones, regardless of their benign or malignant nature, and similarly to RAS mutants they conceal deep molecular alterations with the potential of evolving in malignant forms (Figure 7).
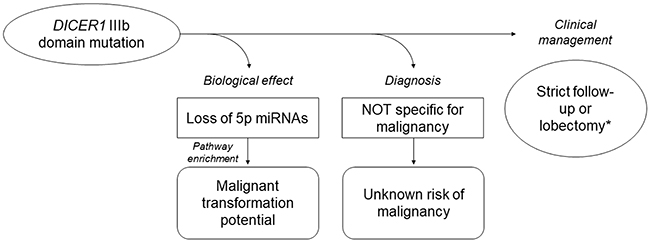
Figure 7: Current knowledge of DICER1 IIIb somatic mutations in thyroid tumors based on the present study results and on the literature data. Owing to the lack of data, the impact of these mutations on prognosis is unknown. *based on the clinical context.
In conclusion, although sufficient follow-up data of DICER1-mutant lesions is necessary to provide a definitive answer to this issue, the remarkable molecular alterations caused by these mutations should be taken into account in clinical decision-making.
MATERIALS AND METHODS
Study population
The study included 41 samples retrospectively collected from the archives of the section of Pathology of the University Hospital of Pisa. Only the most common follicular-patterned lesions were selected—i.e., FA and FVPTC. Hematoxylin and eosin stained sections were independently reviewed by two pathologists (F.B. and L.T.). The lesions were diagnosed according to the World Health Organization 2017 diagnostic criteria [20]. FAs were submitted in toto to exclude the presence of vascular or capsular invasion. The study conformed to the principles of the Helsinki Declaration of 1975, it was conducted anonymously, and no sensitive data was used.
Nucleic acids purification and mutational analyses
For each sample, four unstained 10μm- and 5μm-thick formalin-fixed and paraffin-embedded (FFPE) sections were used for DNA and RNA purification, respectively. Unstained sections were deparaffinized in xylene and then rehydrated in ethanol solutions. After manual macro-dissection, DNA and total RNA were isolated by the QIAamp DNA Mini Kit (Qiagen Inc, Hilden, Germany) and the miRNeasy FFPE Kit (Qiagen Inc, Hilden, Germany) respectively, according to the manufacturer’s protocols. Quantity and quality of nucleic acids were assessed by spectrophotometry (Xpose Trinean, Gentbrugge, Belgium).
The mutational status of BRAF (exon 15), the RAS genes (exons 2–3), DICER1 (exons 24–25), DROSHA (exons 23–24,29–30), DGCR8 (exon 7) and TARBP2 (exons 7–8) were analysed by direct sequencing (3130 Genetic Analyzer, Applied Biosystems, Foster City, CA, USA), according to standard procedures [21]. Primers used for sequencing miRNA processing genes are reported in Table 4. In addition, the presence of PAX8-PPARG rearrangements (exons 7 and 9) was investigated, as previously described [22]. The paired normal tissues from the contralateral lobe or the normal collateral parenchyma of lesions harboring mutations in the miRNA processing genes were used to confirm the germline or somatic nature of the variants according to current guidelines [23]. To ensure that the tissue was normal, without tumor foci, sections above and below those used for nucleic acids isolation were stained with hematoxylin and eosin and independently reviewed by two pathologists.
Table 4: Primers used for sequencing selected exons of the miRNA processing genes
Gene |
Transcript ID |
Exon |
Functional domain |
Primers |
|---|---|---|---|---|
DICER1 |
ENST00000343455.7 |
24 |
RNase IIIb |
F: AAGCTTACGGTTCCACTTCG |
R: ACCACTATGCCGTCAGAACT |
||||
25 |
F1: AGAATAATAAATGGGGTGGGGAT |
|||
R1: GTACACCTGCCAGACTGTCT |
||||
F2: AACTACATCTGTGGACTGCC |
||||
R2: TCAAGCAATTCTCGCACAGG |
||||
DROSHA |
ENST00000511367.6 |
23 |
RNase IIIa |
F: TGTGTTCTTTTCTTGCGGGG |
R: ACACGGTGTATCAATGCCTT |
||||
24 |
F: TCAGAGCCACAGACAGAATGT |
|||
R: ACCGCAGAAGAGCATGTCA |
||||
29 |
RNase IIIb |
F: TCAATCGAGGGGCCTTAGG |
||
R: TGGAGGAAGTGATTTAACCAACT |
||||
30 |
F: TGTTCTCAATGTACCGCCAT |
|||
R: AGGAGGAGGACAAATACGGT |
||||
DGCR8 |
ENST00000351989.7 |
7 |
heme- and pri-miRNA binding |
F: GTGGCACTGCTTCACACTTG |
R: GCCCTGACCAAAGTTACACC |
||||
TARBP2 |
ENST00000266987.6 |
7 |
DICER1- and pre-miRNA binding |
F: GGTCTGTGGGGAATCATAACC |
R: CAGAAGCAGACCTAGGGCC |
||||
8 |
F: TCGCTTCATCTTTCTCACTGT |
|||
R: CCCTTCTACTTGCTCCGGTC |
Expression analyses
The expression profiling of 798 miRNAs was carried out by the nCounter human v3 miRNA expression assay (NanoString Technologies, Seattle, WA, USA), as previously described [24].
The expression levels of DICER1, DROSHA, TARBP2, DGCR8 and XPO5 were evaluated by RT-PCR using the QuantiTect Primer Assay (Qiagen Inc, Hilden, Germany), and following the manufacturer’s instructions. In detail, the retrotranscription step was performed using the RevertAid First Strand cDNA Synthesis Kit (Thermo Scientific, Waltham, MA, USA), as previously reported [22]. Fifty ng of cDNA were then used in a reaction volume of 25 μL with the Rotor-Gene SYBR Green PCR Master Mix (Qiagen Inc, Hilden, Germany), and with specific primers. Amplification was performed in 40 cycles (denaturation at 95°C for 5 sec, annealing and elongation at 60°C for 10 sec). Actin beta (ACTB) and glyceraldehyde-3-phosphate dehydrogenase (GAPDH) were used as housekeeping genes, and thyroglobulin (TG) was used as specificity control. Each sample was amplified in double copy. The ΔΔCt method was used to assess the relative quantification of the targets [25].
Statistical analyses
miRNA expression counts were normalized according to the manufacturer’s instructions. In detail, background thresholding was applied to raw counts by using the max value of the negative control counts as threshold. In addition, only miRNAs with counts above the threshold in more than 60% of samples were considered for further analyses. PCA was used to summarize the variation pattern of the dataset. Hierarchical clustering was performed using Pearson’s correlation and average as distance and clustering functions, respectively. The moderated t-statistics was used to evaluate the miRNA differential expression. After normal distribution assessment by the Shapiro-Wilk’s test, continuous variables were tested by the two-tailed Student’s t test. Fisher’s exact test was used to analyse categorical variables. miRNA pathway analysis was performed by the mirPath v.3 web server [26]; for the analysis, KEGG and TarBase v.7.0 were used as pathway and miRNA reference databases, respectively. In addition, the analysis was performed using the a posteriori method “pathway union” by a modified Fisher’s exact test. All p values were adjusted with the Benjamini-Hochberg’s correction, and FDR of 0.05 was set as significance level. The prediction of the effect of uncommon mutations was conducted by Mutation Taster [27]. The mutational status of DGCR8, DICER1, DROSHA and TARBP2 of thyroid cancer TCGA cases was explored by using the cBioportal (http://www.cbioportal.org); level 3 miRNA expression data was downloaded from FireHose (http://gdac.broadinstitute.org). All statistical analyses were performed in R environment (http://www.R-project.org).
Abbreviations
ExAC, Exome Aggregation Consortium; FA, follicular adenoma; FDR, false discovery rate; FFPE, formalin-fixed and paraffin-embedded; FVPTC, follicular variant of papillary thyroid carcinoma; KEGG, Kyoto Encyclopedia of Genes and Genomes; PCA, principal component analysis; TCGA, The Cancer Genome Atlas; FA, follicular adenoma; FDR, false discovery rate; FFPE, formalin-fixed and paraffin-embedded; FVPTC, follicular variant of papillary thyroid carcinoma; KEGG, Kyoto Encyclopedia of Genes and Genomes; PCA, principal component analysis; TCGA, The Cancer Genome Atlas.
Author contributions
AMP, VC, RE, PV and FB designed the study; RE, PV and FB supervised the study; LT and FB selected and reviewed the cases; AMP, VC and MD performed the experiments; AMP analysed the data; AMP, VC, LT and FB interpreted the results; AMP, VC and FB wrote the manuscript; all authors reviewed and approved the manuscript.
CONFLICTS OF INTEREST
The authors have no disclosure to declare.
FUNDING
This study was supported by PRA (PRA_2016_19) and PRIN (2015HPMLFY).
REFERENCES
1. Foulkes WD, Priest JR, Duchaine TF. DICER1: mutations, microRNAs and mechanisms. Nat Rev Cancer. 2014; 14: 662–7.
2. Wilson RC, Doudna JA. Molecular mechanisms of RNA interference. Annu Rev Biophys. 2013; 42: 217–39.
3. Yu X, Li Z. The role of TARBP2 in the development and progression of cancers. Tumour Biol. 2016; 37:57–60. https://doi.org/10.1007/s13277-015-4273-6.
4. Walz AL, Ooms A, Gadd S, Gerhard DS, Smith MA, Guidry Auvil JM, Meerzaman D, Chen QR, Hsu CH, Yan C, Nguyen C, Hu Y, Bowlby R, et al. Recurrent DGCR8, DROSHA, and SIX homeodomain mutations in favorable histology Wilms tumors. Cancer Cell. 2015; 27: 286–97.
5. Torrezan GT, Ferreira EN, Nakahata AM, Barros BDF, Castro MTM, Correa BR, Krepischi ACV, Olivieri EHR, Cunha IW, Tabori U, Grundy PE, Costa CML, de Camargo B, et al. Recurrent somatic mutation in DROSHA induces microRNA profile changes in Wilms tumour. Nat Commun. 2014; 5: 4039.
6. Robertson JC, Jorcyk CL, Oxford JT. DICER1 Syndrome: DICER1 Mutations in Rare Cancers. Cancers (Basel). 2018; 10:10. https://doi.org/10.3390/cancers10050143.
7. Solarski M, Rotondo F, Foulkes WD, Priest JR, Syro LV, Butz H, Cusimano MD, Kovacs K. DICER1 gene mutations in endocrine tumors. Endocr Relat Cancer. 2018; 25:R197–208.
8. Agrawal N, Akbani R, Aksoy BA, Ally A, Arachchi H, Asa SL, Auman JT, Balasundaram M, Balu S, Baylin SB, Behera M, Bernard B, Beroukhim R, et al, and Cancer Genome Atlas Research Network. Integrated genomic characterization of papillary thyroid carcinoma. Cell. 2014; 159:676–90. https://doi.org/10.1016/j.cell.2014.09.050.
9. Yoo SK, Lee S, Kim SJ, Jee HG, Kim BA, Cho H, Song YS, Cho SW, Won JK, Shin JY, Park DJ, Kim JI, Lee KE, et al. Comprehensive Analysis of the transcriptional and mutational landscape of follicular and papillary thyroid cancers. PLoS Genet. 2016; 12: e1006239.
10. Nikiforova MN, Mercurio S, Wald AI, Barbi de Moura M, Callenberg K, Santana-Santos L, Gooding WE, Yip L, Ferris RL, Nikiforov YE. Analytical performance of the ThyroSeq v3 genomic classifier for cancer diagnosis in thyroid nodules. Cancer. 2018; 124: 1682–90.
11. Anglesio MS, Wang Y, Yang W, Senz J, Wan A, Heravi-Moussavi A, Salamanca C, Maines-Bandiera S, Huntsman DG, Morin GB. Cancer-associated somatic DICER1 hotspot mutations cause defective miRNA processing and reverse-strand expression bias to predominantly mature 3p strands through loss of 5p strand cleavage. J Pathol. 2013; 229: 400–9.
12. Nikiforov YE, Seethala RR, Tallini G, Baloch ZW, Basolo F, Thompson LDR, Barletta JA, Wenig BM, Al Ghuzlan A, Kakudo K, Giordano TJ, Alves VA, Khanafshar E, et al. Nomenclature revision for encapsulated follicular variant of papillary thyroid carcinoma: a paradigm shift to reduce overtreatment of indolent tumors. JAMA Oncol. 2016; 2: 1023–9.
13. Nikiforov YE, Baloch ZW, Hodak SP, Giordano TJ, Lloyd RV, Seethala RR, Wenig BM. Change in diagnostic criteria for noninvasive follicular thyroid neoplasm with papillarylike nuclear features. JAMA Oncol. 2018; 4:1125-1126.
14. Lek M, Karczewski KJ, Minikel EV, Samocha KE, Banks E, Fennell T, O’Donnell-Luria AH, Ware JS, Hill AJ, Cummings BB, Tukiainen T, Birnbaum DP, Kosmicki JA, et al, and Exome Aggregation Consortium. Analysis of protein-coding genetic variation in 60,706 humans. Nature. 2016; 536:285–91. https://doi.org/10.1038/nature19057.
15. Auton A, Brooks LD, Durbin RM, Garrison EP, Kang HM, Korbel JO, Marchini JL, McCarthy S, McVean GA, Abecasis GR; 1000 Genomes Project Consortium. A global reference for human genetic variation. Nature. 2015; 526: 68–74.
16. Yu FX, Zhao B, Guan KL. Hippo pathway in organ size control, tissue homeostasis, and cancer. Cell. 2015; 163: 811–28.
17. Rivlin N, Koifman G, Rotter V. p53 orchestrates between normal differentiation and cancer. Semin Cancer Biol. 2015; 32: 10–7.
18. Mendonsa AM, Na TY, Gumbiner BM. E-cadherin in contact inhibition and cancer. Oncogene. 2018; 37:4769–80. https://doi.org/10.1038/s41388-018-0304-2.
19. Nagarajan A, Malvi P, Wajapeyee N. Heparan sulfate and heparan sulfate proteoglycans in cancer initiation and progression. Front Endocrinol (Lausanne). 2018; 9:483. https://doi.org/10.3389/fendo.2018.00483.
20. WHO classification of tumours of endocrine organs. 4th ed. Lyon: IARC; 2017.
21. Nikiforov YE, Steward DL, Robinson-Smith TM, Haugen BR, Klopper JP, Zhu Z, Fagin JA, Falciglia M, Weber K, Nikiforova MN. Molecular testing for mutations in improving the fine-needle aspiration diagnosis of thyroid nodules. J Clin Endocrinol Metab. 2009; 94: 2092–8.
22. Poma AM, Giannini R, Piaggi P, Ugolini C, Materazzi G, Miccoli P, Vitti P, Basolo F. A six-gene panel to label follicular adenoma, low- and high-risk follicular thyroid carcinoma. Endocr Connect. 2018; 7: 124–32.
23. Li MM, Datto M, Duncavage EJ, Kulkarni S, Lindeman NI, Roy S, Tsimberidou AM, Vnencak-Jones CL, Wolff DJ, Younes A, Nikiforova MN. Standards and guidelines for the interpretation and reporting of sequence variants in cancer: a joint consensus recommendation of the association for molecular pathology, american society of clinical oncology, and college of american pathologists. J Mol Diagn. 2017; 19:4–23. https://doi.org/10.1016/j.jmoldx.2016.10.002.
24. Denaro M, Ugolini C, Poma AM, Borrelli N, Materazzi G, Piaggi P, Chiarugi M, Miccoli P, Vitti P, Basolo F. Differences in miRNA expression profiles between wild-type and mutated NIFTPs. Endocr Relat Cancer. 2017; 24: 543–53.
25. Zhang JD, Biczok R, Ruschhaupt M. (2018). ddCt: The ddCt Algorithm for the Analysis of Quantitative Real-Time PCR (qRT-PCR). R package version 1.38.0.
26. Vlachos IS, Zagganas K, Paraskevopoulou MD, Georgakilas G, Karagkouni D, Vergoulis T, Dalamagas T, Hatzigeorgiou AG. DIANA-miRPath v3.0: deciphering microRNA function with experimental support. Nucleic Acids Res. 2015; 43: W460-466.
27. Schwarz JM, Cooper DN, Schuelke M, Seelow D. MutationTaster2: mutation prediction for the deep-sequencing age. Nat Methods. 2014; 11: 361–2.