
INTRODUCTION
Oxalate (Ox) is a regular by-product of metabolism and the small amounts produced are generally harmlessly excreted in the urine. Nevertheless, increased urinary excretion of oxalate (Ox) as the result of either genetic (primary hyperoxaluria) and environmental factors (Idiopathic hyperoxaluria), oxalate-rich foods ingestion (secondary hyperoxaluria), fat malabsorption due to jejunal bypass surgery and modern gastric bypass (enteric hyperoxaluria) [1, 2] can lead to urolithiasis, nephrocalcinosis, pyelonephritis, hydronephrosis, fibrosis and renal failure [3, 4].
Manifold animal models have been developed to investigate hyperoxaluria and its consequences. In the ethylene glycol [5] and HPL [3] induced hyperoxaluria animal model, it was found serious damage to the tubulointerstitial area. These lesions were characterized by tubular epithelial cell necrosis, calcium oxalate crystal deposits in tubular lumens, and inflammatory infiltrates, lipid peroxidation and proliferation of resident interstitial cells, such as fibroblasts and also, by an increase in extracellular matrix components including collagens fibers [1, 6–8].
Oxalate has been shown to be toxic in renal epithelial cells of cortical origin [9–13]. However, inner medullary collecting duct (IMCD) cells that are physiologically exposed to higher concentrations of oxalate can behave differently. These cells survive in a unique environment within the organism, commonly exposed otherwise lethal extremes of osmolality, pH, and toxins. Maroni et al. [14], demonstrated that porcine proximal tubular cells (LLC-PK1) and human renal proximal tubular cells (HK-2) were significant injuried at lower sodium oxalate concentrations compared with IMCD cells. Additionally, Brady et al. [15], suggested that HK-2 cells are more sensitive than IMCD cells to cisplatin cytotoxicity in vitro, confirming the idea that IMCD cells are relatively more resistant to toxicity. Nevertheless, IMCD cells may not be inert to oxalate effects and could participate in nephrolithiasis through of phenotype transitions and osteogenic acquiring characteristics, as recently shown in hyperoxaluric mice in vivo [16].
Another study of our group demonstrated that oxalate ions exposition to human proximal tubular epithelial cells (HK-2) stimulated the type 2 epithelial to mesenchymal transition (EMT) [17].
The type 1 EMT occurs during normal organogenesis. Type 2 EMT is associated with wound healing, tissue regeneration, and organ fibrosis. Type 3 EMT is related to neoplastic cells can migrate into surrounding tissues and invade at metastasis sites [18–20].
The type 2 EMT is an essential manifestation of epithelial cell plasticity during tissue regeneration, and organ fibrosis, it is associated with tissue repair responses such as fibrosis to underlying injuries in organs. In renal fibrosis if the injury is mild and acute, the healing process is regarded as reparative fibrosis; on the contrary, in ongoing chronic inflammation, abnormal formation of myofibroblasts, characterized by increased motility, extracellular matrix protein synthesis, proliferation, and invasiveness [18–20].
Losses of epithelial cell markers expression occur concomitantly with, and as a driver of, these changes. The architecture and permanent of epithelial cells, in sealing of tight junctions, depend on cell-cell contacts containing E-cadherin. Besides supporting cell-cell adhesion, cadherins can affect a wide range of cellular functions that include activation of cell signaling pathways, regulation of the cytoskeleton and control of cell polarity [18–20].
Transdifferentiated epithelial cells lose their defined cell-cell-basement membrane contacts and their structural/functional polarity to become spindle-shaped and morphologically similar to activated fibroblasts, there are mesenchymal markers expressed in type 2 EMT, as α-SMA which is a microfilament considered a marker of myofibroblast. Another mesenchymal marker shown is Vimentin, an intermediate filament whose expression is directly linked to cellular phenotypic changes [18–20].
Type 2 EMT is believed to occur in response to some stressful environmental stimulus as mechanical stretch [21], toxicity by cyclosporine treatment [22], exposure to advanced glycation end products (AGE-consequence of hyperglycemia) [23], and oxidative stress [24].
Some soluble growth factors, cytokines, and extracellular proteins have been shown to affect type 2 EMT and to influence renal disease progression. Transforming growth factor beta (TGF-β1), however, appears to play a prominent role, with an increase in expression almost universally in progressive forms of renal disease [25, 26]. In fact, TGF-β1 can induce a genetic program of cell plasticity that involves key pathways and regulators of epithelial dedifferentiation, cytoskeletal reorganization, and proliferation. TGF-β1 induces expression of fibrotic genes and mediates glomerular and tubular cell apoptosis, the mechanism by which tubular epithelial cells may acquire a myofibroblastic phenotype essential for the pathogenesis of fibrosis [27–29].
The type 2 EMT has already been demonstrated in IMCD cells in vitro, through exposure with epidermal growth factor receptor [30], Bestrophin-1 [31], TGF-β1 [32], insulin-like growth factors [32], and growth differentiation factor-11 [27]. In vivo experiments showed that the congenital urinary tract obstruction in humans [33] and animals [34] in collector duct epithelial cell injury and type 2 EMT. However, the oxalate induction of type 2 EMT in the medullary collecting duct, which is not originated from mesenchymal metanephric but from ureteric bud, was not demonstrated.
Hyperoxaluric rats increased mesenchymal markers and osteogenic marker genes both in kidney cortex and medulla [16]. Thus, this study suggest that oxalate ions can induce type 2 TEM in IMCD cells and that these transformed cells could be stimulated to express osteogenic markers in vitro. The effects of oxalate in vivo on the renal medulla of mice will also be evaluated.
RESULTS
To determine whether IMCD cells exposed to Ox and TGF-β1 had become more active in invasion than control cells, we evaluated this characteristic of mesenchymal cell using the transwell chamber assay.
As shown in Figure 1A, IMCD cells exposed to Ox 0.5 mM (0.246 ± 0.003 DO) and TGF-β1 20 ng/mL (0.285 ± 0.006 DO) invaded through the pores faster than control cells (0.132 ± 0.005 DO). The acquisition of cellular invasion capacity is a characteristic of type 2 TEM. The Ox (0.5 mM) group acquire this ability, as well as the TGF-β1 stimulated group (positive control), which is considered the main mediator of type 2 TEM [35, 36]. Taking it into account, these groups remained in our study model.
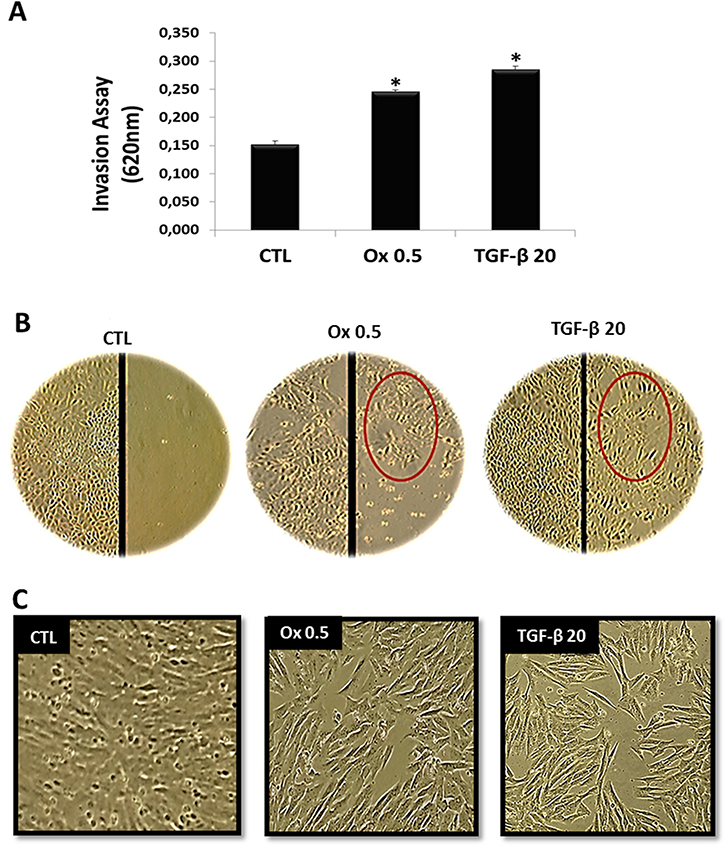
Figure 1: Characteristics of epithelial to mesenchymal transition in vitro. (A) The invasion ability of IMCD cells exposed to culture medium (control), Ox (0.5 mM), and TGF-β1 (20 ng/mL) were examined as described in methods. (B) Representative light microscopic images show increased migration into a wound line of IMCD exposed Ox (0.5 mM) and TGF-β1 (20 ng/mL) in comparison to control cells. Epithelial cell culture showing monolayer growth with clear and rounded delimitations. Inversely, mesenchymal cells lose cellular adhesion and present long, tuned and scattered morphology (red circle). (C) Representative light microscopic images show morphological changes of IMCD cells; these cells stimulated with Ox and TGF-β1 are fusiform and much longer than control. Data are presented as means ± standard errors. (*) significant different when compared to the control group at p < 0.05. (ANOVA followed by a post hoc Tukey’s test).
Cellular migration ability is another characteristic of type 2 TEM [18, 19]. Epithelial cells in vitro grow till confluence to form a monolayer relatively static because the contact with neighboring cells inhibits migratory signals. The wound healing assay can be used experimentally to visualize the migratory ability of the cells through scratching a track through the monolayer. Cells at the edge of the incision become migratory and move. IMCD cells exposed to Ox (0.5 mM) and TGF-β1 (20 ng/mL) were seen to migrate through the incision in greater numbers than control cells (Figure 1B).
Figure 1C shows the phenotypic changes in IMCD cells exposed to Ox (0.5 mM) and TGF-β1 (20 ng/mL) in comparison to the control situation. IMCD cells exposed to Ox changed its morphological features notoriously. Control cells have a very clear and round boundary, individual cells abutting on each other in a uniform array. Additionally, there are regularly spaced cell to cell junctions and adhesions between neighboring cells. Very differently, IMCD cells exposed to Ox 0.5 (mM) and TGF-β1 (20 ng/mL) have a much longer and irregularly scattered cell shape, varying in density like mesenchymal cells.
TGF-β1 acts as a potent driver of induction of Type 2 EMT [35, 36], and their endogenous synthesis is increased in chronic kidney diseases [25, 26]. There was a significant increase in expression of TGF-β1. The Figure 2A and 2B show the protein synthesis and quantitative analyses of immunoblot images (CTL: 0.53 ± 0.01 ratio, Ox 0.5 mM: 0.85 ± 0.01 ratio and TGF-β1 20 ng/mL: 1.02 ± 0.05 ratio), respectively. Figure 2C shows the gene expression (CTL: 0.80 ± 0.05 arbitrary units, Ox 0.5 mM: 1.15 ± 0.07 arbitrary units and TGF-β1 20 ng/mL: 2.72 ± 0.13 arbitrary units). Additionally, it is interesting to note that in our experimental conditions exogenous TGF-β1 was able to stimulate its endogenous gene expression and protein synthesis, amplifying its signal in a "positive feedback" loop.
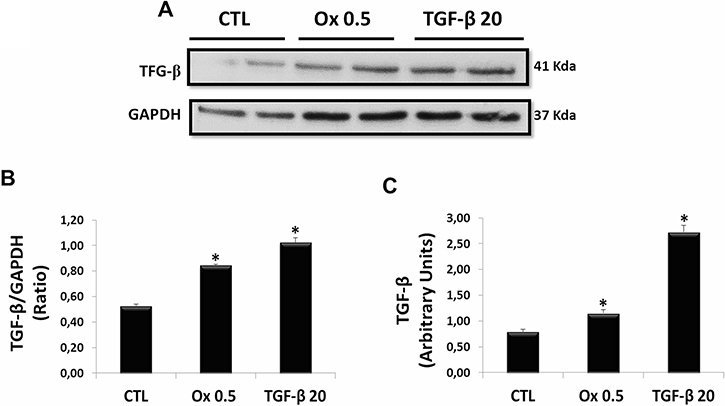
Figure 2: Evaluation of main mediator of epithelial to mesenchymal transition: endogenous synthesis of TGF-β1 in vitro. (A) Western blot analyses in IMCD cells exposed to Ox (0.5 mM) and TGF-β1 (20 ng/mL) for expression of TGF-β1. (B) Quantitative analyses of immunoblot images were obtained by ImageJ software. (C) Real-time PCR showing the mRNA levels in IMCD using Syber Green assays for TGF-β1. Data are presented as means ± standard errors. (*) significant different when compared to the control group at p < 0.05. (ANOVA followed by a post hoc Tukey’s test).
Figure 3A and 3B show the gene expression of mesenchymal cells markers. There was a significant increase in mesenchymal markers in IMCD cells stimulated with Ox (0.5 mM) including α-SMA (1.72 ± 0.31 arbitrary units), and Vimentin (2.31 ± 0.61 arbitrary units) compared to the control situation for α-SMA (1.06 ± 0.11 arbitrary units) and Vimentin (1.11 ± 0.13 arbitrary units). The stimulation with TGF-β1 (20 ng/mL) also induced a significant increase in α-SMA (8.40 ± 2.95 arbitrary units) and Vimentin (2.06 ± 0.41 arbitrary units) expression.
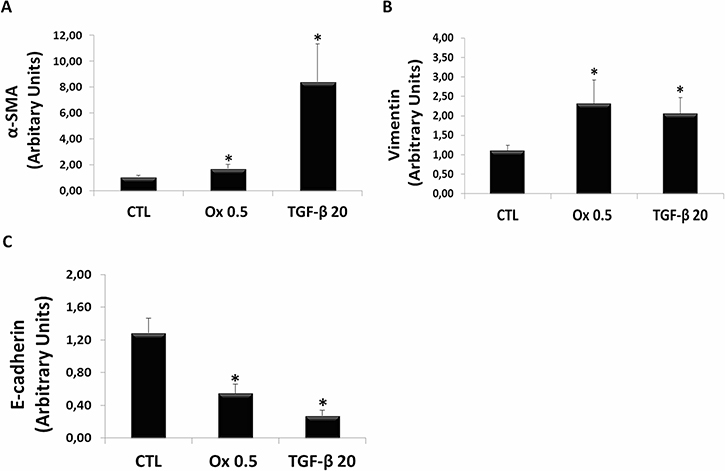
Figure 3: Markers of epithelial to mesenchymal transition in vitro. Real-time PCR showing the mRNA levels in IMCD exposed to control situation, Ox (0.5 mM) and TGF-β1 (20 ng/mL) using Syber Green assays for α-SMA (A), Vimentin (B), and E-cadherin (C). Data are presented as means ± standard errors. (*) significant different when compared to the control group at p < 0.05. (ANOVA followed by a post hoc Tukey’s test).
Figure 3C shows the gene expression of epithelial cell marker. There was a significant decrease in epithelial marker E-cadherin in IMCD cells stimulated with Ox (0.5 mM) (0.55 ± 0.11 arbitrary units), compared to the control situation for E-cadherin (1.28 ± 0.18 arbitrary units). The stimulatio with TGF-β1 (20 ng/mL) also induced a significant decrease in E-cadherin expression (0.27 ± 0.07 arbitrary units).
Figure 4A shows the protein synthesis (immunofluorescence assay) for mesenchymal and epithelial markers. Ox (0.5 mM) and TGF-β1 (20 ng/mL) exposition for 48 h increased mesenchymal markers as α-SMA, Vimentin and decreased epithelial marker as E-cadherin in IMCD cells when compared to control situation. The Figure 4B shows the immunofluorescence quantification for α-SMA (CTL: 59.60 ± 0.41%, Ox 0.5 mM: 229.07 ± 0.35% and TGF-β1 20 ng/mL: 162,10 ± 0.35%), Vimentin (CTL: 39.18 ± 0.50%, Ox 0.5 mM: 139.78 ± 0.51% and TGF-β1 20 ng/mL: 228.82 ± 0.50%), E-cadherin (CTL: 493.52 ± 0.41%, Ox 0.5 mM: 25.26 ± 0.35% and TGF-β1 20 ng/mL: 50.28 ± 0.50%). The protein synthesis results corroborate our findings in gene expression. Nevertheless, the same effects were not observed after 48 h exposure to oxalate (1.0 mM) (Supplementary Figure 1), mainly because higher concentration of oxalate is toxic to IMCD cells.
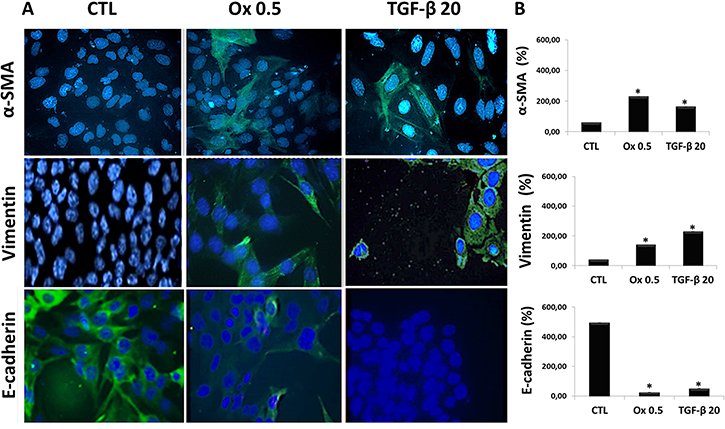
Figure 4: Markers of epithelial to mesenchymal transition in vitro. (A) Immunofluorescence images (FITC: green fluorescence and blue: nuclei) showing α-SMA, Vimentin and E-cadherin immunostaining in IMCD cells exposed to Ox (0.5 mM) and TGF-β1 (20 ng/mL). (B) Quantitative analyses of immunoflorescence staining were obtained by ImageJ software. Data are presented as percentage. (*) significant different when compared to the control group at p < 0.05. (ANOVA followed by a post hoc Tukey’s test).
ROS is reported to be involved in cell injury and tight junction disruption [12]. The Figure 5 shows a significant increase in levels of lipid peroxidation (A) in IMCD cells stimulated with Ox (0.5 mM: 1.63 ± 0.05 μM/mg). Although TGF-β1 (20 ng/mL) seems to increase it, the difference was not significant (1.46 ± 0.12 μM/mg) in comparison to the CTL (1.38 ± 0.04 μM/mg) group. Conversely, cells that were stimulated with Ox or TGF-β1 and concomitantly treated with N-acetyl-L-cysteine (NAC) did not show increase in ROS.
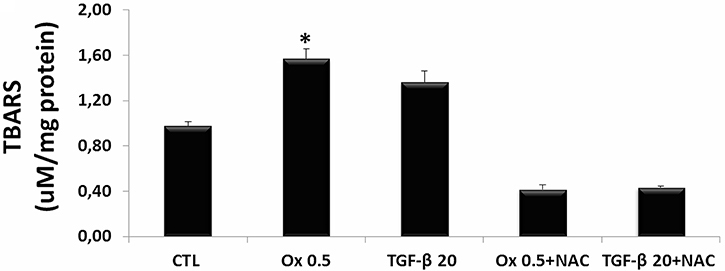
Figure 5: Evaluation of reactive oxygen species in vitro. Quantitative analyses of thiobarbituric reactive substances (TBARS) in IMCD cells exposed to Ox (0.5 mM) and TGF-β1 (20 ng/mL) in the presence or absence of NAC (10 mM). Data are presented as means ± standard errors. (*) significant different when compared to the control group at p < 0.05. (ANOVA followed by a post hoc Tukey’s test).
Effects of NAC on TGF-β1- and oxalate-induced EMT were assessed by changes in cell morphology and expression of mesenchymal and epithelial markers. Control cells maintained in culture conditions without stimulation exhibited a rounded cobblestone appearance. After stimulation with Ox and TGF-β1, IMCD cells displayed increase in overall size, loss of cell-cell contacts, and assumed a fibroblast-like morphology. Cells treated with NAC in the presence of Ox and TGF-β1 retained their rounded shape and cobblestone appearance consistent with retention of the epithelial phenotype (Figure 6A). Interesting, TGF-β1 seems to stimulate IMCD transition more effectively in comparison to Ox.
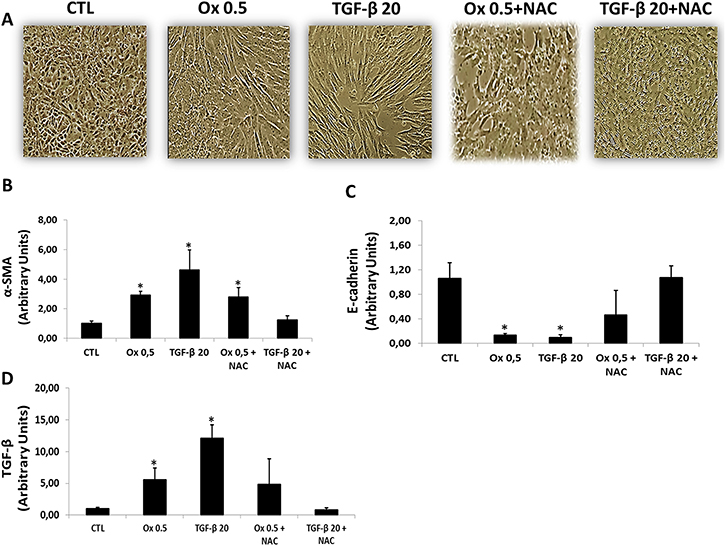
Figure 6: Effects of NAC on TGF-β1 and oxalate-induced EMT. Representative light microscopic images show morphological changes of IMCD cells (A). Real-time PCR showing the mRNA in IMCD cells exposed to Ox (0.5 mM) and TGF-β1 (20 ng/mL) in the presence or the absence of NAC (10 mM) using Syber Green assays for α-SMA (B), E-cadherin (C), and TGF-β1 (D). Data are presented as means ± standard errors. (*) significant different when compared to the control group at p < 0.05. (ANOVA followed by a post hoc Tukey’s test).
The NAC effect on EMT markers in IMCD cells stimulated with Ox and TGF-β1 is presented in Figure 6B.
IMCD cells treated concomitantly with TGF-β1 and NAC did not present decrease in epithelial marker E-cadherin (1.07 ± 0.19 arbitrary units) and did not increase the mesenchymal marker α-SMA (1.13 ± 0.17 arbitrary units) in comparison to control group (E-cadherin: 1.06 ± 0.25 arbitrary units; α-SMA: 1.02 ± 0.15 arbitrary units). Interestingly, in response to NAC treatment, there was no significant difference in epithelial marker E-cadherin after Ox exposition (0.47 ± 0.40 arbitrary units) when compared to the CTL group (1.06 ± 0.25 arbitrary units). However, the mesenchymal marker α-SMA increased significantly (2.79 ± 0.54 arbitrary units) after Ox exposition when compared to the CTL group (1.02 ± 0.15 arbitrary units). Our results suggest that NAC was more effective in inhibiting TEM induced by TGF-β1 than by Ox.
In response to NAC treatment, the stimulation with Ox increased endogenous TGF-β1 (4.86 ± 3.99 arbitrary units), although it was not significantly different when compared to the CTL group (1.01 ± 0.22 arbitrary units). Nevertheless, the endogenous synthesis of TGF-β1 was dramatically reduced in cells exposed concomitantly with NAC and stimulated with the exogenous transforming growth factor (0.82 ± 0.30 arbitrary units). This result corroborates the epithelial and mesenchymal markers expression (Figure 6C).
Interestingly, NAC seems to blunt TGF-β1-induced EMT while only partially change oxalate-induced EMT.
To proper analyze the participation of oxalate induced EMT in osteogenic genes expression, we submitted IMCD cells to oxalate and TGF-β1 followed by exposition to osteogenic differentiation medium during 15 days.
The expression of osteogenic markers RUNX-2 (Figure 7A) and Alkaline Phosphatase (Figure 7B) were analyzed. For RUNX-2, Ox (0.5 mM) (3.99 ± 0.50 arbitrary units), significantly increased RUNX-2 expression in IMCD cells, while TGF-β1 (20 ng/mL) also increased but it was not significantly different (2.49 ± 0.18 arbitrary units) when compared to control (1.40 ± 0.74 arbitrary units). For Alkaline Phosphatase, both TGF-β1 (20 ng/mL) (4.48 ± 0.54 arbitrary units) and Ox (0.5 mM) (4.52 ± 0.67 arbitrary units) increased the osteogenic marker when compared to control situation (1.88 ± 0.65 arbitrary units). Figure 7C shows the osteocyte labeling (red) mainly in Ox and TGF-β1 groups.
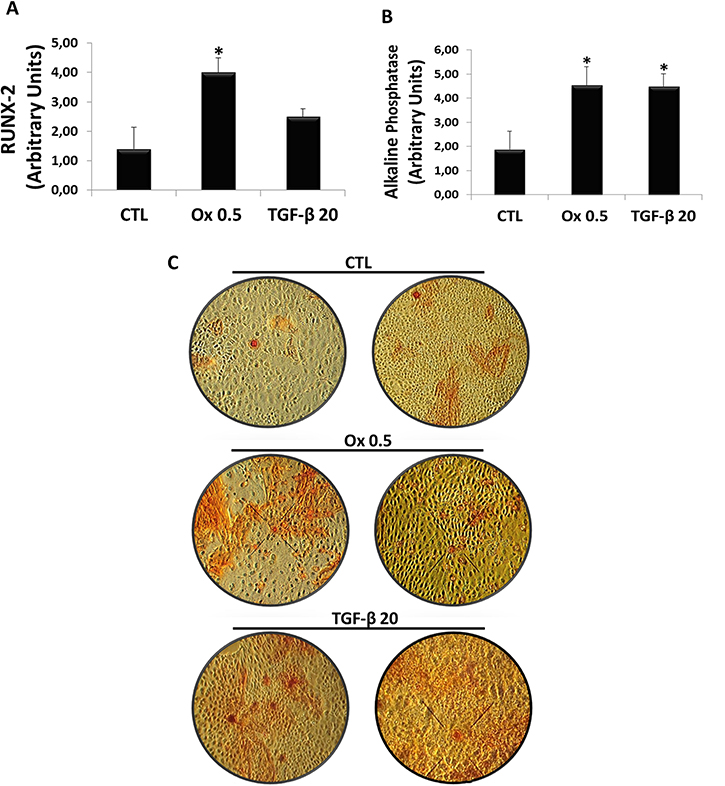
Figure 7: Evaluation of osteogenic genes expression in vitro. Real-time PCR showing the mRNA levels in IMCD exposed to control situation, Ox (0.5 mM) and TGF-β1 (20 ng/mL) using Syber Green assays for RUNX-2 (A) and Alkaline Phosphatase (B). Image shows culture plates stained for extracellular matrix dye (red) in all groups (C). Data are presented as means ± standard errors. (*) significant different when compared to the control group at p < 0.05. (ANOVA followed by a post hoc Tukey’s test).
Hyperoxaluria can be induced by the administration of an agent such as HLP [3]. The results of our in vivo hyperoxaluric models are shown in Figure 8. Animals fed with HPL after 60 days had an increased excretion of Ox (Figure 8A) and presented calcium oxalate (CaOx) crystals in their urine (Figure 8B). Light microscopy images showed calcium oxalate crystals, mostly CaOx dihydrate crystals, observed in the urine of hyperoxaluric animals (Figure 8C).
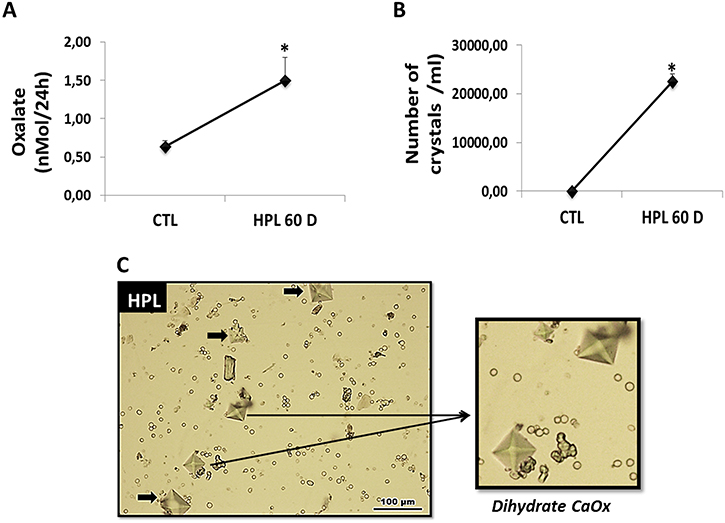
Figure 8: Evaluation of hyperoxaluria in vivo. Animals fed with hydroxyproline (HPL) during 60 days (60 D) increased urinary oxalate excretion (A) and showed increase in urinary crystals number (B). Light microscopy images showing calcium oxalate crystals, with characteristics of CaOx dihydrate, observed in the urine of hyperoxaluric animals (C). Data are presented as means ± standard errors. (*) significant different when compared to the control group at p < 0.05. (ANOVA followed by a post hoc Tukey’s test).
Figure 9A and 9B show immunostaining for endogenous synthesis of TGF-β1 in vivo at 60 days in renal medulla. We observed an increase in the labeling for TGF-β1 in the HPL group compared to the CTL group. The Figure 9C shows the quantification of immunostaining for TGF-β1 (CTL: 769.45 ± 0.65%, HPL: 1829.00 ± 0.50%), the main mediator of kidney fibrosis.
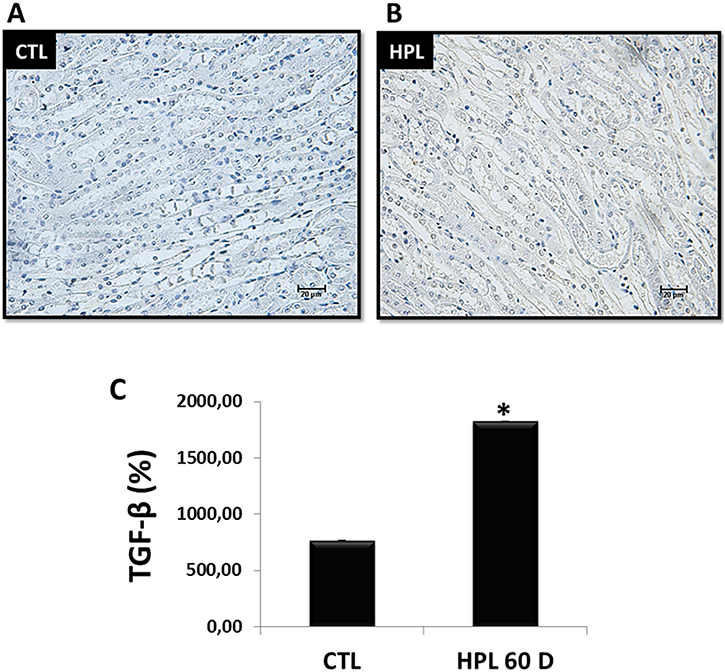
Figure 9: Evaluation of endogenous synthesis of TGF-β1 in vivo. (A–B) The stimulation with hydroxyproline during 60 days (HPL 60 D) increased the expression of TGF-β1 according to immunohistochemistry image (grey tone). (C) Quantitative analyses of TGF-β1 were obtained by ImageJ software. Data are presented as means ± standard errors. (*) significant different when compared to the control group at p < 0.05. (ANOVA followed by a post hoc Tukey’s test).
Corroborating the above result, hyperoxaluric mice treated with HPL increased the deposition of collagen fibers at 60 days (type I yellow to red tone and type III greenish tone) (Figure 10A) in the kidney medulla. The Figure 10B shows the graphical quantification for collagen (CTL: 88.68 ± 1.00%, HPL: 195.72 ± 1.49%).
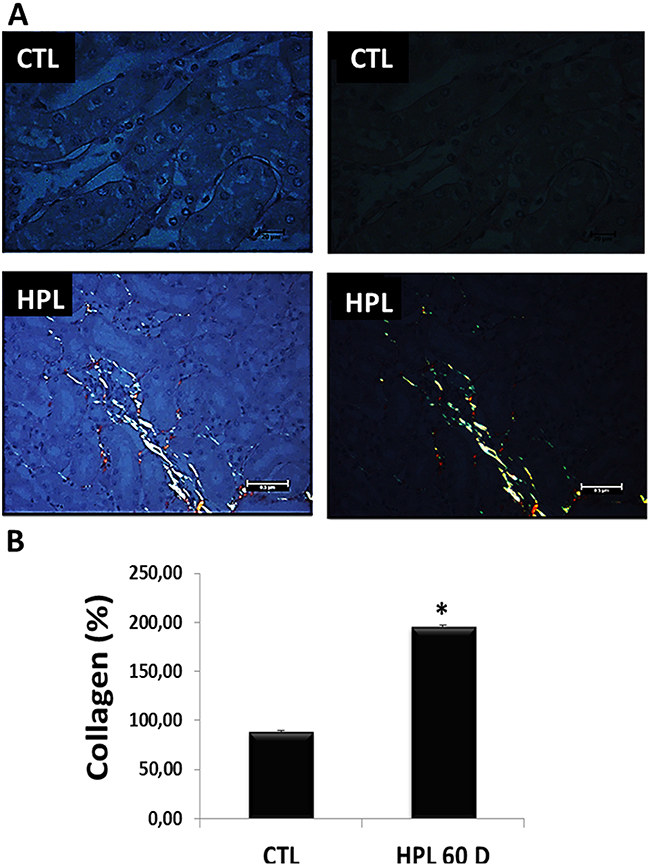
Figure 10: Evaluation of fibrotic marker in vivo. (A) Animals fed with hydroxyproline during 60 days (HPL 60 D) increased the production of collagen type I (yellow to red tone) and collagen type III (greenish tone), showed by picrosirius staining. (B) Quantitative analyses of picrosirius staining were obtained by ImageJ software. Data are presented as means ± standard errors. (*) significant different when compared to the control group at p < 0.05. (ANOVA followed by a post hoc Tukey’s test).
Finally, we evaluated the participation of oxalate induced EMT in osteogenic genes expression in renal medulla. Hyperoxaluric mice treated with HPL for 60 days increased the expression of osteogenic genes in vivo. The expression of osteogenic markers RUNX-2 (Figure 11A) and Alkaline Phosphatase (Figure 11B) were analyzed. HPL (2.19 ± 0.18 arbitrary units) significantly increased RUNX-2 expression in comparison to control (0.94 ± 0.06 arbitrary units). For Alkaline Phosphatase, HPL (4.28 ± 0.74 arbitrary units) increased the osteogenic marker when compared to the control situation (1.47 ± 0.44 arbitrary units).
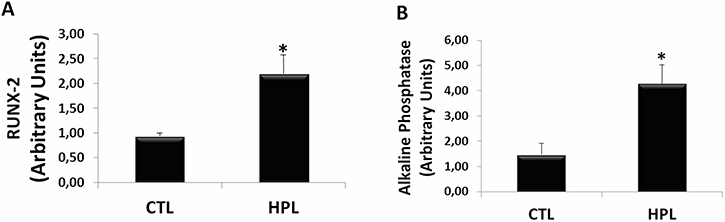
Figure 11: Evaluation of osteogenic gene expression in vivo. Real-time PCR showing the mRNA levels of RUNX-2 (A) and Alkaline Phosphatase (B) in kidney medulla of animals fed with hydroxyproline (HPL) during 60 days (60 D). Data are presented as means ± standard errors. (*) significant different when compared to the control group at p < 0.05. (ANOVA followed by a post hoc Tukey’s test).
DISCUSSION
In the present study, we demonstrate that inner medullary collecting duct (IMCD) cells stimulated with oxalate in comparison with TGF-β1, used as in vitro positive control, showed morphological changes, gaining migratory mesenchymal qualities, accompanied by a shift in the expression of epithelial genes to a mesenchymal gene repertoire, which is characteristic of cells undergoing Type 2 EMT [37, 38]. The type 2 EMT has already been demonstrated in IMCD cells in vitro, through exposure with TGF-β1 [29]. However, according to our knowledge, the oxalate induction was not demonstrated in literature.
The use of Ox stimulated endogenous synthesis of TGF-β1. Additionally, the exogenous stimulation with TGF-β1 in IMCD cells induced its own synthesis in a manner similar to a positive feedback loop, as reported by others [39–42, 62], confirming that TGF-β1 acts as a potent inductor of Type 2 EMT [35, 36]. Its synthesis is increased many experimental models of chronic kidney disease [25, 26], including our experimental conditions.
Based on changes in cell morphology, expression of a panel of mesenchymal and epithelial markers, and also through the endogenous synthesis of the major mediator of TEM, the TGF-β1, our findings suggest that NAC blunted TGF-β1-induced EMT. ROS production can act as second messengers to mediate the Type 2 EMT, but also inducing TGF-β1. This growth factor increases reactive oxygen species production and suppresses antioxidant enzymes, leading to a redox imbalance. Reactive oxygen species, in turn, induce TGF-β1 to mediate many its fibrogenic effects, forming a perverse vicious cycle for fibrosis [43].
Oxalate exposition is accompanied by the generation of hydrogen peroxide in renal cells [11, 12, 44], in agreement with our findings. In addition, hydrogen peroxide produced by mitochondria is the major member of ROS that is involved in tight junction disruption [45–47]. Other authors showed that the concomitant exposure to exogenous antioxidants N-acetylcysteine (NAC) attenuate the adverse effects of oxalate [12, 44] and TGF-β1 [48].
Nevertheless, in our conditions NAC only partially inhibited oxalate-induced EMT, suggesting that other mediators than ROS are involved in oxalate-induced EMT.
It is important to point out that our study has some limitations in understanding the effect of NAC in oxalate-induced EMT. Higher concentrations of NAC should be used since oxalate-induced EMT was more resistant to NAC effect than induced by TGF-β1. Other stimuli than ROS can be inducing TGF-β1, so further studies are necessary to clarify NAC effect in oxalate-induced EMT.
Other studies showed the relationship between TGF-β1 and transformation to osteogenic phenotype. Additionally, RUNX-2 and ALP are also common targets of TGF-β1 [49–51]. Since we observed that oxalate induced TEM and increased TGF-β1 in IMCD, to further test if type 2 EMT derived cells could differentiate into functional cell capable of producing mineral deposits, they were grown in osteogenic differentiation media for 15 days. Our data indicate that IMCD cells were able to express osteogenic gene like ALP, RUNX-2 and there was osteocyte staining as proven by Alizarin Red, which stain calcium deposits.
Different steps of osteogenic differentiation process including proliferation phase, extracellular matrix synthesis, and mineralization are detected by the expression of specific genes. The primary function of differentiated osteoblasts is the synthesis of type I collagen, the major constituent of extracellular matrix [16, 52], also involved in calcification [16, 53].
So, collagen is an early specific gene that increases in proliferative and in matrix maturation phases of osteogenesis. RUNX-2, called “a master gene,” is an essential transcription factor for the initiation of osteogenesis [54]. Several osteoblastic gene expressions, including type I collagen, are regulated by RUNX-2 at the early stages of osteoblast differentiation.
Alkaline phosphatase (ALP) is considered one of the most commonly accessible markers of osteoblast differentiation responsible for the mineralization of the extracellular matrix. The final stage results in production and release of aggregates containing calcium phosphate (CaP), also called hydroxylapatite [55–57].
The mixed CaP or hydroxylapatite and calcium oxalate (CaOx) represent approximately 80% of kidney stones [58]. However its pathogenesis is not fully understood. The most recent mechanism suggests that in some patients, stone formation probably involves the formation of Randall’s plaque. Supersaturation of tubular fluid in collecting duct stimulates calcium oxalate crystallization. The renal papilla mineralizes through a mechanism not well understood, and a subepithelial plaque is established. The papillary surface epithelium is disrupted, the plaque rupture, attracting the deposition of CaOx crystals on the CaP base [59, 60].
In view of this, it is reasonable to suggest that oxalate induced Type 2 EMT and osteogenic transformation in vitro could be involved in nephrolithiasis.
Typically, in our conditions in vitro, osteogenic factors are introduced directly into the culture medium to drive the cells toward osteogenic differentiation. However, it is unlikely that these same factors (ascorbic acid, dexamethasone, and β-glycerol phosphate) are present within the natural environment in vivo, hence the need to expand the protocol for in vivo conditions.
Joshi et al. [16] showed that administration in rats with HPL for 28 days promoted up regulation of gene encoding for RUNX-2 during hyperoxaluric conditions and further increased after crystal deposition or nephrolithiasis, with down regulated of gene encoding for ALP. In view of this, we decided to double the period of hyperoxaluric stimulation with HPL in mice for 60 days.
In these conditions, we observed in renal medulla of hyperoxaluric mice the increase in type III collagen fiber deposition. It is associated with a higher degree of fibrosis [49], and is involved in pathogenesis of nephrolithiasis. The urine of hyperoxaluric mice also showed pyramid-shaped calcium oxalate dehydrate crystals (CaOx) and increase in Ox excretion, according to other publications [3, 61].
Additionally, we observed that the renal medulla acquired an osteogenic phenotype with upregulation of RUNX-2, ALP and collagen type I deposition. Our results suggest that endogenous synthesis of TGF-β1 in vivo induced by hyperoxaluria can also be involved in oxalate effect, as observed in vitro.
In conclusion, the study of phenotypic transitions improve our understanding of cell transformation involved in pathological processes such as renal fibrosis and nephrolithiasis. According to our knowledge, it is the first study showing that oxalate induce type 2 epithelial to mesenchymal transition in inner medullary collecting duct cells. The dedifferentiated cell under appropriated condition expressed osteogenic genes and positive osteocyte staining. Renal medulla of hyperoxaluric mice demonstrated upregulation of osteogenic genes and proteins involved in calcification as type I collagen, these upregulations suggesting the formation of calcium phosphate crystals that can serve as nidus to CaOx crystals growth. Oxalate in vitro and in vivo stimulates endogenous synthesis of TGF-β1 which is also involved in type 2 epithelial to mesenchymal transition and osteogenic differentiation, reflecting its pathogenic role in renal medulla, in our experimental conditions. Therefore, new studies are needed to clarify the numerous mechanisms involved in oxalate induced-EMT and its implication in nephrolothiasis.
MATERIALS AND METHODS
Cell culture
IMCD derived from mouse and presenting inner medullar collect duct phenotype was obtained from the American Type Culture Collection and grown in Dulbecco’s modified Eagle’s medium (DMEM, Sigma Chemicals, St. Louis, MO, USA) supplemented with 5% fetal bovine serum (FBS, Gibco, Carlsbad, CA, USA), 24 mM of NaHCO3, 10 mM of N’-2-hydroxyethylpiperazine-N’-2-ethanesulfonic acid, and 10,000 U/L of penicillin/streptomycin. Cells were grown to semiconfluence at 37°C in a humidified atmosphere containing 5% carbon dioxide. After this period, 0.5% trypsin (Cultilab, Campinas, Brazil) was then used to detach them from the flasks. The cells were subsequently centrifuged, resuspended in DMEM, and subcultured in 25-cm2 plastic culture flasks or 6 well plates for the experimental procedures.
Preparation of oxalate ions
Solutions of dipotassium oxalate (0.4 M, 100 mL) (Merck, Darmstadt, Germany) were added to 300 mL of distilled, deionized water at a constant drip rate of 1 mL/min for 2 h. This suspension was stirred continuously for 5 h at 75°C and then washed with deionized water to remove the potassium chloride. Oxalate (10 mM) was added to phosphate-buffered saline (PBS- free calcium), sterilized in 0.22 μM filter and used in the respective protocols at the concentration of 0.5 mM (48 h). In the Supplementary Figure 1, the cells were exposed to 1.0 Mm (48 h), however, was not used in our study.
Exposure of IMCD immortalized cells to oxalate ions (0.5 mM), exogenous TGF-β1 (20 ng/mL), and NAC (10 mM)
Before the experiments, immortalized cells (American type culture collection (ATCC)), were maintained under the culture conditions for 2 days. At confluence, IMCD were exposed for 48 hours to either DMEM (5% FBS, control), DMEM containing oxalate (0.5 mM), TGF-β1 (20 ng/mL, Peprotech, NJ, US), used as positive control of type 2 TEM, and N-acetylcysteine (10 Mm, Sigma, St. Louis, MO, USA). The experimental protocol was repeated at least 3 times at different periods. N = 5 for each group.
Invasion assay
IMCD invasion was analyzed by trans-well assay; 105 cells were added to the top chambers of 6-well trans-well plates (8 μm size, Millipore Corporation, Bilerica, MA, USA) and media containing 5% FBS with Ox and TGF-β1 was added to the bottom chambers for 48 h. Top (non-invasive) cells were removed, bottom (invasive) cells were fixed in formaldehyde 3.7%, stained with Trypan Blue, solubilized in sodium dodecyl sulfate (2%) and absorbance was recorded at 620 nm. All of these assays were done in triplicate.
Immunofluorescence
IMCD cells were grown on Labtek II glass slides with 8 wells, then washed with PBS, fixed (3.7% fresh paraformaldehyde in PBS for 20 minutes at room temperature), permeabilized (0.5% Triton X-100 for 5 minutes), blocked with 5% albumin/phosphate buffered saline (BSA/PBS) for 60 min. Following blocking, primary rat monoclonal antibodies (Santa Cruz). 1:50 to E-cadherin, α-SMA and Vimentin were added overnight at 4oC in 0.5% BSA/PBS. The FITC-labeled secondary anti-rat IgG and anti-mouse IgG (1:100) (Santa Cruz) was added for 2 h at room temperature in 0.5% BSA/PBS and cells were incubated with DAPI (4′6-diamidino-2-phenylindole, Sigma) 10 μg/mL. Coverslips were mounted on glass slides with buffered glycerin and analyzed using Nikon fluorescence microscopy. The microscope images obtained were quantified using ImageJ software. The data are reported as percentage of positively fluorescence intensity per area [62].
Migration assay
Wound healing assay is commonly used for assessing the effect of pro and anti-migratory agents on cultured cells [63]. Briefly, cells were grown to confluence in culture plastic dishes to a density of approximately 5×10⁶ cells/well. After 24 h of quiescence, the cells were denuded by dragging a rubber policeman through the center of the plate. Cultures were rinsed with PBS and replaced with fresh medium containing 5% FBS (control situation) and medium containing 5% FBS has added Ox (0.5 mM) and TGF-β1 (20 ng/mL), following which the IMCD cells were incubated at 37°C for 48 h and photographed.
Real-time polymerase chain reaction (Real-time PCR)
Total Ribonucleic acid (RNA) was purified (IMCD cells and medulla renal of mice) by phenol and guanidine isothiocyanate-cesium chloride method using an appropriate kit (Trizol, Life Technologies, USA). 2 micrograms of total RNA were treated with DNase (RQ1 RNase-Free DNase, Promega) to prevent genomic deoxyribonucleic acid contamination. The RNA pellet was resuspended in RNase-free water. Reverse transcribed into cDNA by the addition of a mix containing 0.5 mg/mL oligo d (T), 10 mM DTT, 0.5 mM dNTPs (Pharmacia Biotech), and 200 U of reverse transcriptase enzyme (SuperScript RT, Gibco-BRL). Real-time amplification was obtained using a GeneAmp 7700 Sequence Detection System (SDS, ABI Prism 7700, Applied Biosystems) and monitored using the SYBR Green I intercalating dye (Applied Biosystems). PCR was performed with selective primers (Supplementary Table 1). Results were reported as a relative expression normalized with the β-actin housekeeping gene. The fold variation was determined using the 2-(ΔΔCt) method according to previously published protocol [64].
Osteoinduction assay
IMCD cells were exposed for 48 hours to either DMEM (5% FBS, control), DMEM containing oxalate (0.5 mM) and TGF-β1 (20 ng/mL). After this period, cells were exposed in an osteogenic conditioned medium including α-MEM with 5% FBS, 50 μg/mL ascorbic acid (Gibco), 10 mM b-glycerol-phosphate (Gibco), and 10 nM dexamethasone (Sigma), for 15 days culture with daily change of osteogenic conditioned medium. Total RNA (Real-Time PCR) was extracted to detect the expression of osteogenic markers Runt-related transcription factor 2 (RUNX-2) and Alkaline Phosphatase (ALP). On day 15 was added the extracellular matrix dye (Alizarin Red S) on the plates in culture, and the images were photographed in all groups.
In vitro peroxidation assay (Thiobarbituric acid reactive substances – TBARS)
The malondialdehyde (MDA) combines with thiobarbituric acid (TBA) forming a red compound, whose concentration was assessed by spectrophotometry with reading at 535 nm [65]. Culture medium without phenol and cell homogenate samples of cell cultures were stimulated with oxalate (0.5 mM) and TGF-β1 (20 ng/mL) in the absence and presence the NAC (10 mM) for 48 h. The supplementation with NAC provides sulphthiol group of L-cysteine and also exerts antioxidant effect by directly scavenging free radicals. Cellular homogenates were obtained by scrapping cells from the flasks with PBS. Samples were added to a solution of 0.375% TBA, 15% trichloroacetic acid, and 0.25 HCl (Sigma Chemicals), kept in continual agitation, heated in 95ºC for 20 min and subsequently cooled to room temperature. The protein concentration was verified by the method of Lowry [66]. Positive control was obtained by incubating the cell samples with H2O2 at 1% for 1 h before the assay. The results were corrected through the protein and were expressed as μM/mg.
Western blotting
The protein concentration was verified by the method of Lowry [66]. IMCD cells were lysed with a 200-μL RIPA lysis buffer per plate (100 mm2). The lysates were centrifuged at 12,000 g for 5 min at 4°C, and the supernatants were stored at −80°C. Proteins (30 μg) were separated by 10% polyacrylamide gel electrophoresis and transferred to polyvinylidene fluoride membranes using a Mini Trans-Blot Electrophoretic Transfer Cell (BioRad). Nonspecific binding sites were blocked with 5% BSA (v/v) in a TBS buffer. The immunoblots were incubated overnight at 4°C with the TGF-β1 and GAPDH primary antibodies (1:1000, Santa Cruz Biotechnology, Dallas, TX, USA). After washing three times with TBS-T, the membranes were incubated for 1 h at 4°C in HRP-conjugated secondary antibodies (1:30000; Cell Signalling). Immunoreactive protein bands were visualized using Pierce ECL Plus Chemiluminescent substrate detecting reagents (Thermo Fisher, USA). Images were obtained and analyzed with an Alliance 7 Chemiluminescence documentation system (UVItec, Cambridge, UK). The immunoblot band intensities were quantified using ImageJ software and expressed as the TGF-β1/GAPDH ratio.
In vivo experimental groups
The experimental protocol was approved by the Ethics Committee of the Federal University of São Paulo (protocol number CEP 1098/10), also in agreement with the Brazilian guidelines for scientific animal care and use [67, 68]. The C57Bl/6 mice were divided into the following groups: a control group receiving water ad libitum for 60 days; an HPL group that received 5% HPL for 60 days ad libitum. At the end of the experimental protocol in 60 days, the mices were kept for 24 hours in metabolic cages for urine collection and were then sacrificed using a toxic dose of anesthetic (ketamine and xylazine). The kidneys were removed for histological analysis. The urine volume was measured to analyze of oxalate excretion. The experimental protocol was repeated 3 times at different moments with N = 5 for each group.
Urine oxalate
Was analyzed with an oxalate oxidase kit (Trinity Biotech, Co. Wicklow, Ireland) following the manufacturer’s protocol. The results were corrected through the urine volume and were expressed as mMol/24 h.
Urine crystals
Urine sediment was obtained by centrifugation (2,300 rpm/min for 5 minutes) and counted in a Neubauer chamber following the formula: (final volume × number de crystals)/(initial volume × 0.0001) and was photographed. The results were expressed as urinary crystals/mL.
Histochemistry assay
Paraffin sections were subjected to xylene and alcohol gradient solutions, antigen retrieval recovery, protein block, and incubation with primary rabbit anti-TGF-β1 (1:100, Santa Cruz, USA) overnight at 4°C. After this period, the sections were incubated with a dextran polymer conjugated to peroxidase antibody for 30 minutes (DAKO Envision kit, Dako, Denmark). Marking was detected by exposing the sections using a chromogenic substrate. The primary antibody was omitted as a negative control, and the sections were counterstained with hematoxylin and analyzed under a light microscope the Olympus BX 60 model at 20x or 40x magnification. The paraffin section of the kidney was also stained with picrosirius red and quantified under a polarized light microscope (Olympus BX 60) to evaluate the production of collagen types (type I yellow to red tone and type III greenish tone). The obtained microscope images were quantified using ImageJ software and expressed as a % of the stained area.
Statistical analysis
The results were expressed as mean ± SEM. The statistical analysis was performed using one-way analysis of variance (ANOVA) followed by a post-hoc Tukey’s test, p-values < 0.05 were considered statistically significant.
Abbreviations
AGE: advanced glycation end products; ALP: alkaline phosphatase; a-SMA: alpha-smooth muscle actin; CaOx: calcium oxalate; DMEM: dulbecco’s modified eagle’s medium; EMT: epithelial to mesenchymal transition; FBS: fetal bovine serum; HK-2: human renal proximal tubular cells; HPL: trans-4-hydroxy-L-proline; IMCD: inner medullary collecting duct cells; LLC-PK1: porcine proximal tubular cells; MDA: malondialdehyde; MDCK: madin-darby canine kidney; NAC: N-acetyl-L-cysteine; Ox: oxalate ions; PBS: phosphate-buffered saline; RNA: ribonucleic acid; ROS: oxidative stress; RUNX-2: runt-related transcription factor 2; TBARS: thiobarbituric acid reactive substances; TGF-β1: transforming growth factor beta-1.
Author contributions
MBC and EAP conducted the experiments; MBC and FTB designed the experimental protocol. MBC and FTB wrote the manuscript; NS critically evaluated the results and revised the manuscript. All authors read and approved the final manuscript.
CONFLICTS OF INTEREST
We have no direct or indirect commercial financial incentive associated with publishing this article. Additionally, the authors have no conflicts of interest, and the source of extra-institutional funding is indicated in the manuscript.
FUNDING
This work was supported by grants from Conselho Nacional de Desenvolvimento Científico Tecnológico (CNPq), Financiadora de Estudos e Projetos (FINEP), Fundação Oswaldo Ramos (FOR), Fundação de Amparo à Pesquisa do Estado de São Paulo (FAPESP 2010/51883-1) and Coordenação de Aperfeiçoamento de Pessoal de Nível Superior (CAPES).
REFERENCES
1. Joshi S, Wang W, Khan SR. Transcriptional study of hyperoxaluria and calcium oxalate nephrolithiasis in male rats: inflammatory changes are mainly associated with crystal deposition. PLoS One. 2017; 12:e0185009. https://doi.org/10.1371/journal.pone.0185009.
2. Canales BK, Reyes L, Reinhard MK, Khan SR, Goncalves CG, Meguid MM. Renal glomerular and tubular injury after gastric bypass in obese rats. Nutrition. 2012; 28:76–80. https://doi.org/10.1016/j.nut.2011.03.003.
3. Khan SR, Glenton PA, Byer KJ. Modeling of hyperoxaluric calcium oxalate nephrolithiasis: experimental induction of hyperoxaluria by hydroxy-L-proline. Kidney Int. 2006; 70:914–23. https://doi.org/10.1038/sj.ki.5001699.
4. Hatch M. Oxalate status in stone-formers. Two distinct hyperoxaluric entities. Urol Res. 1993; 21:55–59. https://doi.org/10.1007/BF00295194.
5. de Water R, Boevé ER, van Miert PP, Deng G, Cao LC, Stijnen T, de Bruijn WC, Schröder FH. Experimental nephrolithiasis in rats: the effect of ethylene glycol and vitamin D3 on the induction of renal calcium oxalate crystals. Scanning Microsc. 1996; 10:591–601.
6. Khan SR. Animal models of kidney stone formation: an analysis. World J Urol. 1997; 15:236–43. https://doi.org/10.1007/BF01367661.
7. Toblli JE, Stella I, de Cavanagh E, Angerosa M, Inserra F, Ferder L. Enalapril prevents tubulointerstitial lesions by hyperoxaluria. Hypertension. 1999; 33:225–31. https://doi.org/10.1161/01.HYP.33.1.225.
8. Thamilselvan S, Hackett RL, Khan SR. Lipid peroxidation in ethylene glycol induced hyperoxaluria and calcium oxalate nephrolithiasis. J Urol. 1997; 157:1059–63. https://doi.org/10.1016/S0022-5347(01)65141-3.
9. Jeong BC, Kwak C, Cho KS, Kim BS, Hong SK, Kim JI, Lee C, Kim HH. Apoptosis induced by oxalate in human renal tubular epithelial HK-2 cells. Urol Res. 2005; 33:87–92. https://doi.org/10.1007/s00240-004-0451-5.
10. Huang MY, Chaturvedi LS, Koul S, Koul HK. Oxalate stimulates IL-6 production in HK-2 cells, a line of human renal proximal tubular epithelial cells. Kidney Int. 2005; 68:497–503. https://doi.org/10.1111/j.1523-1755.2005.00427.x.
11. Scheid C, Koul H, Hill WA, Luber-Narod J, Kennington L, Honeyman T, Jonassen J, Menon M. Oxalate toxicity in LLC-PK1 cells: role of free radicals. Kidney Int. 1996; 49:413–19. https://doi.org/10.1038/ki.1996.60.
12. Thamilselvan S, Khan SR, Menon M. Oxalate and calcium oxalate mediated free radical toxicity in renal epithelial cells: effect of antioxidants. Urol Res. 2003; 31:3–9.
13. Schepers MS, van Ballegooijen ES, Bangma CH, Verkoelen CF. Oxalate is toxic to renal tubular cells only at supraphysiologic concentrations. Kidney Int. 2005; 68:1660–69. https://doi.org/10.1111/j.1523-1755.2005.00576.x.
14. Maroni PD, Koul S, Meacham RB, Chandhoke PS, Koul HK. Effects of oxalate on IMCD cells: a line of mouse inner medullary collecting duct cells. Ann N Y Acad Sci. 2004; 1030:144–49. https://doi.org/10.1196/annals.1329.018.
15. Brady HR, Zeidel ML, Kone BC, Giebisch G, Gullans SR. Differential actions of cisplatin on renal proximal tubule and inner medullary collecting duct cells. J Pharmacol Exp Ther. 1993; 265:1421–28.
16. Joshi S, Clapp WL, Wang W, Khan SR. Osteogenic changes in kidneys of hyperoxaluric rats. Biochim Biophys Acta. 2015; 1852:2000–12. https://doi.org/10.1016/j.bbadis.2015.06.020.
17. Convento MB, Pessoa EA, Cruz E, da Glória MA, Schor N, Borges FT. Calcium oxalate crystals and oxalate induce an epithelial-to-mesenchymal transition in the proximal tubular epithelial cells: contribution to oxalate kidney injury. Sci Rep. 2017; 7:45740. https://doi.org/10.1038/srep45740.
18. Kalluri R, Neilson EG. Epithelial-mesenchymal transition and its implications for fibrosis. J Clin Invest. 2003; 112:1776–84. https://doi.org/10.1172/JCI200320530.
19. Liu Y. Epithelial to mesenchymal transition in renal fibrogenesis: pathologic significance, molecular mechanism, and therapeutic intervention. J Am Soc Nephrol. 2004; 15:1–12. https://doi.org/10.1097/01.ASN.0000106015.29070.E7.
20. Zeisberg M, Kalluri R. The role of epithelial-to-mesenchymal transition in renal fibrosis. J Mol Med (Berl). 2004; 82:175–81. https://doi.org/10.1007/s00109-003-0517-9.
21. Sato M, Muragaki Y, Saika S, Roberts AB, Ooshima A. Targeted disruption of TGF-β1/Smad3 signaling protects against renal tubulointerstitial fibrosis induced by unilateral ureteral obstruction. J Clin Invest. 2003; 112:1486–94. https://doi.org/10.1172/JCI200319270.
22. McMorrow T, Gaffney MM, Slattery C, Campbell E, Ryan MP. Cyclosporine A induced epithelial-mesenchymal transition in human renal proximal tubular epithelial cells. Nephrol Dial Transplant. 2005; 20:2215–25. https://doi.org/10.1093/ndt/gfh967.
23. Li JH, Wang W, Huang XR, Oldfield M, Schmidt AM, Cooper ME, Lan HY. Advanced glycation end products induce tubular epithelial-myofibroblast transition through the RAGE-ERK1/2 MAP kinase signaling pathway. Am J Pathol. 2004; 164:1389–97. https://doi.org/10.1016/S0002-9440(10)63225-7.
24. Rhyu DY, Yang Y, Ha H, Lee GT, Song JS, Uh ST, Lee HB. Role of reactive oxygen species in TGF-β1-induced mitogen-activated protein kinase activation and epithelial-mesenchymal transition in renal tubular epithelial cells. J Am Soc Nephrol. 2005; 16:667–75. https://doi.org/10.1681/ASN.2004050425.
25. Böttinger EP. TGF-beta in renal injury and disease. Semin Nephrol. 2007; 27:309–20. https://doi.org/10.1016/j.semnephrol.2007.02.009.
26. Schnaper HW, Jandeska S, Runyan CE, Hubchak SC, Basu RK, Curley JF, Smith RD, Hayashida T. TGF-beta signal transduction in chronic kidney disease. Front Biosci. 2009; 14:2448–65. https://doi.org/10.2741/3389.
27. Pons M, Koniaris LG, Moe SM, Gutierrez JC, Esquela-Kerscher A, Zimmers TA. GDF11 induces kidney fibrosis, renal cell epithelial-to-mesenchymal transition, and kidney dysfunction and failure. Surgery. 2018; 164:262–73. https://doi.org/10.1016/j.surg.2018.03.008.
28. Zavadil J, Bitzer M, Liang D, Yang YC, Massimi A, Kneitz S, Piek E, Bottinger EP. Genetic programs of epithelial cell plasticity directed by transforming growth factor-beta. Proc Natl Acad Sci USA. 2001; 98:6686–91. https://doi.org/10.1073/pnas.111614398.
29. Liu W, Li X, Zhao Y, Meng XM, Wan C, Yang B, Lan HY, Lin HY, Xia Y. Dragon (repulsive guidance molecule RGMb) inhibits E-cadherin expression and induces apoptosis in renal tubular epithelial cells. J Biol Chem. 2013; 288:31528–39. https://doi.org/10.1074/jbc.M113.517573.
30. Smith JP, Pozzi A, Dhawan P, Singh AB, Harris RC. Soluble HB-EGF induces epithelial-to-mesenchymal transition in inner medullary collecting duct cells by upregulating Snail-2. Am J Physiol Renal Physiol. 2009; 296:F957–65. https://doi.org/10.1152/ajprenal.90490.2008.
31. Aldehni F, Spitzner M, Martins JR, Barro-Soria R, Schreiber R, Kunzelmann K. Bestrophin 1 promotes epithelial-to-mesenchymal transition of renal collecting duct cells. J Am Soc Nephrol. 2009; 20:1556–64. https://doi.org/10.1681/ASN.2008090987.
32. Ivanova L, Butt MJ, Matsell DG. Mesenchymal transition in kidney collecting duct epithelial cells. Am J Physiol Renal Physiol. 2008; 294:F1238–48. https://doi.org/10.1152/ajprenal.00326.2007.
33. Trnka P, Hiatt MJ, Ivanova L, Tarantal AF, Matsell DG. Phenotypic transition of the collecting duct epithelium in congenital urinary tract obstruction. J Biomed Biotechnol. 2010; 2010:696034. https://doi.org/10.1155/2010/696034.
34. Butt MJ, Tarantal AF, Jimenez DF, Matsell DG. Collecting duct epithelial-mesenchymal transition in fetal urinary tract obstruction. Kidney Int. 2007; 72:936–44. https://doi.org/10.1038/sj.ki.5002457.
35. Abhishek A, Benita S, Kumari M, Ganesan D, Paul E, Sasikumar P, Mahesh A, Yuvaraj S, Ramprasath T, Selvam GS. Molecular analysis of oxalate-induced endoplasmic reticulum stress mediated apoptosis in the pathogenesis of kidney stone disease. J Physiol Biochem. 2017; 73:561–73. https://doi.org/10.1007/s13105-017-0587-8.
36. Valcourt U, Kowanetz M, Niimi H, Heldin CH, Moustakas A. TGF-β and the Smad signaling pathway support transcriptomic reprogramming during epithelial-mesenchymal cell transition. Mol Biol Cell. 2005; 16:1987–2002. https://doi.org/10.1091/mbc.e04-08-0658.
37. Tennakoon AH, Izawa T, Kuwamura M, Yamate J. Pathogenesis of Type 2 Epithelial to Mesenchymal Transition (EMT) in Renal and Hepatic Fibrosis. J Clin Med. 2015; 5:4. https://doi.org/10.3390/jcm5010004.
38. Xu XF, Dai HP. Type 2 epithelial mesenchymal transition in vivo: truth or pitfalls? Chin Med J (Engl). 2012; 125:3312–17.
39. Yan X, Xiong X, Chen YG. Feedback regulation of TGF-β signaling. Acta Biochim Biophys Sin (Shanghai). 2018; 50:37–50. https://doi.org/10.1093/abbs/gmx129.
40. Wegner K, Bachmann A, Schad JU, Lucarelli P, Sahle S, Nickel P, Meyer C, Klingmüller U, Dooley S, Kummer U. Dynamics and feedback loops in the transforming growth factor β signaling pathway. Biophys Chem. 2012; 162:22–34. https://doi.org/10.1016/j.bpc.2011.12.003.
41. Bu P, Wang L, Chen KY, Rakhilin N, Sun J, Closa A, Tung KL, King S, Kristine Varanko A, Xu Y, Huan Chen J, Zessin AS, Shealy J, et al. miR-1269 promotes metastasis and forms a positive feedback loop with TGF-β. Nat Commun. 2015; 6:6879. https://doi.org/10.1038/ncomms7879.
42. Miyazono K. Positive and negative regulation of TGF-beta signaling. J Cell Sci. 2000; 113:1101–09.
43. Liu RM, Desai LP. Reciprocal regulation of TGF-β and reactive oxygen species: A perverse cycle for fibrosis. Redox Biol. 2015; 6:565–77. https://doi.org/10.1016/j.redox.2015.09.009.
44. Khand FD, Gordge MP, Robertson WG, Noronha-Dutra AA, Hothersall JS. Mitochondrial superoxide production during oxalate-mediated oxidative stress in renal epithelial cells. Free Radic Biol Med. 2002; 32:1339–50. https://doi.org/10.1016/S0891-5849(02)00846-8.
45. Gangwar R, Meena AS, Shukla PK, Nagaraja AS, Dorniak PL, Pallikuth S, Waters CM, Sood A, Rao R. Calcium-mediated oxidative stress: a common mechanism in tight junction disruption by different types of cellular stress. Biochem J. 2017; 474:731–49. https://doi.org/10.1042/BCJ20160679.
46. Rao RK, Li L, Baker RD, Baker SS, Gupta A. Glutathione oxidation and PTPase inhibition by hydrogen peroxide in Caco-2 cell monolayer. Am J Physiol Gastrointest Liver Physiol. 2000; 279:G332–40. https://doi.org/10.1152/ajpgi.2000.279.2.G332.
47. Rao R. Oxidative stress-induced disruption of epithelial and endothelial tight junctions. Front Biosci. 2008; 13:7210–26. https://doi.org/10.2741/3223.
48. Sugiura H, Ichikawa T, Liu X, Kobayashi T, Wang XQ, Kawasaki S, Togo S, Kamio K, Mao L, Ann Y, Ichinose M, Rennard SI. N-acetyl-L-cysteine inhibits TGF-beta1-induced profibrotic responses in fibroblasts. Pulm Pharmacol Ther. 2009; 22:487–91. https://doi.org/10.1016/j.pupt.2009.04.002.
49. Lee KS, Kim HJ, Li QL, Chi XZ, Ueta C, Komori T, Wozney JM, Kim EG, Choi JY, Ryoo HM, Bae SC. Runx2 is a common target of transforming growth factor beta1 and bone morphogenetic protein 2, and cooperation between Runx2 and Smad5 induces osteoblast-specific gene expression in the pluripotent mesenchymal precursor cell line C2C12. Mol Cell Biol. 2000; 20:8783–92. https://doi.org/10.1128/MCB.20.23.8783-8792.2000.
50. Noda M, Rodan GA. Type beta transforming growth factor (TGF beta) regulation of alkaline phosphatase expression and other phenotype-related mRNAs in osteoblastic rat osteosarcoma cells. J Cell Physiol. 1987; 133:426–37. https://doi.org/10.1002/jcp.1041330303.
51. Zhao L, Jiang S, Hantash BM. Transforming growth factor beta1 induces osteogenic differentiation of murine bone marrow stromal cells. Tissue Eng Part A. 2010; 16:725–33. https://doi.org/10.1089/ten.tea.2009.0495.
52. Habibovic P, Bassett DC, Doillon CJ, Gerard C, McKee MD, Barralet JE. Collagen biomineralization in vivo by sustained release of inorganic phosphate ions. Adv Mater. 2010; 22:1858–62. https://doi.org/10.1002/adma.200902778.
53. Murshed M, McKee MD. Molecular determinants of extracellular matrix mineralization in bone and blood vessels. Curr Opin Nephrol Hypertens. 2010; 19:359–65. https://doi.org/10.1097/MNH.0b013e3283393a2b.
54. Valenti MT, Serafini P, Innamorati G, Gili A, Cheri S, Bassi C, Dalle Carbonare L. Runx2 expression: A mesenchymal stem marker for cancer. Oncol Lett. 2016; 12:4167–72. https://doi.org/10.3892/ol.2016.5182.
55. Birmingham E, Niebur GL, McHugh PE, Shaw G, Barry FP, McNamara LM. Osteogenic differentiation of mesenchymal stem cells is regulated by osteocyte and osteoblast cells in a simplified bone niche. Eur Cell Mater. 2012; 23:13–27. https://doi.org/10.22203/eCM.v023a02.
56. Aubin JE. Regulation of osteoblast formation and function. Rev Endocr Metab Disord. 2001; 2:81–94. https://doi.org/10.1023/A:1010011209064.
57. Lian JB, Stein GS, Stein JL, van Wijnen AJ. Osteocalcin gene promoter: unlocking the secrets for regulation of osteoblast growth and differentiation. J Cell Biochem Suppl. 1998; 30-31:62–72.
58. Khan SR, Pearle SM, Robertson WG, Gambaro G, Canales BK, Doizi S, Traxer O, Tiselius HG. Kidney stones. Nat Rev Dis Primers. 2016; 2:16008. https://doi.org/10.1038/nrdp.2016.8.
59. Evan AP. Physiopathology and etiology of stone formation in the kidney and the urinary tract. Pediatr Nephrol. 2010; 25:831–41. https://doi.org/10.1007/s00467-009-1116-y.
60. Evan AP, Lingeman JE, Coe FL, Parks JH, Bledsoe SB, Shao Y, Sommer AJ, Paterson RF, Kuo RL, Grynpas M. Randall’s plaque of patients with nephrolithiasis begins in basement membranes of thin loops of Henle. J Clin Invest. 2003; 111:607–16. https://doi.org/10.1172/JCI17038.
61. Tawashi R, Cousineau M, Sharkawi M. Calcium oxalate crystal formation in the kidneys of rats injected with 4-hydroxy-L-proline. Urol Res. 1980; 8:121–27. https://doi.org/10.1007/BF00271440.
62. Fedchenko N, Reifenrath J. Different approaches for interpretation and reporting of immunohistochemistry analysis results in the bone tissue - a review. Diagn Pathol. 2014; 9:221. https://doi.org/10.1186/s13000-014-0221-9.
63. Raftopoulou M, Etienne-Manneville S, Self A, Nicholls S, Hall A. Regulation of cell migration by the C2 domain of the tumor suppressor PTEN. Science. 2004; 303:1179–81. https://doi.org/10.1126/science.1092089.
64. Livak KJ, Schmittgen TD. Analysis of relative gene expression data using real-time quantitative PCR and the 2(-Δ Δ C(T)) Method. Methods. 2001; 25:402–08. https://doi.org/10.1006/meth.2001.1262.
65. Beuge JA, Aust S. The thiobarbituric acid assay. Methods Enzymol. 1978; 52:306–07.
66. Lowry OH, Rosebrough NJ, Farr AL, Randall RJ. Protein measurement with the Folin phenol reagent. J Biol Chem. 1951; 193:265–75.
67. Diretriz brasileira para o cuidado e a utilização de animais para fins científicos e didáticos. (Concea) CNDCDEA/MDCTEI. [Internet]. 2013. Available from: http://pages.cnpem.br/ceua/wp-content/uploads/sites/56/2015/06/DBCA.pdf. (Accessed 16 May 2018).
68. Diretriz Brasileira para o Cuidado e a Utilização de Animais em Atividades de Ensino ou de Pesquisa Científica – DBCA. Resolução Normativa. MCTI. Brazil, CM. 2016.