
INTRODUCTION
Serum am4yloid A (SAA), an acute phase protein (APP), is mainly produced in the liver, while its extrahepatic synthesis has been reported in skin [1], in atherosclerotic lesions [2], in synovial tissues [3], in adipocytes and smooth muscle cells [4, 5]. The human SAA acute phase protein family contains four different isoforms namely, SAA1, SAA2, SAA3 and SAA4. Both SAA1 and SAA2 show high degree of homology in the mRNA and the protein sequences which are hard to be identified [6]. SAA3 is a pseudogene categorized as a non-coding RNA [7], while SAA4 is constitutively expressed as a non-inducible protein [8, 9]. On the other hand, the synthesis of SAA1 and SAA2 is inducible under inflammatory conditions [9], such as inflammation, trauma and infection, increasing to several hundredfold [10, 11].
SAA is a family of apolipoproteins associated with high-density lipoprotein, playing a role in AA-type amyloidosis and cholesterol metabolism and transport [12, 13]. Emerging studies of SAA have been implicated in promoting cellular migration [14, 15], augmenting cytokines and chemokines expression [16–18], stimulating angiogenesis [19, 20], inducing the transcription factor nuclear factor (NF)-κB, and activating signaling pathways, such as ERK1/2, p38 and JNK [17, 20–23]. Cumulative studies have shown that SAA is upregulated in a wide range of malignancies, such as lung [24–26], ovarian [23, 27], pancreatic [28, 29], prostate [30], uterine serous papillary [31] and renal cell [32] carcinomas. We have reported that SAA is preferentially localized to ovarian epithelial cells and the thecal-interstitial layers compared to granulosal cell layers in a mouse ovary [33], and ovarian carcinoma show tumor necrosis factor α (TNF)-induced SAA production [23]. However, expression of SAA in breast cancer (BC) is poorly understood.
BC is the most frequently diagnosed cancer and the second most common cause of cancer deaths in women in the US [34]. One probable reason for this is that we lack a complete picture of the biologic heterogeneity of this disease. BC is divided into 4 intrinsic subtypes with a molecular basis as follows: luminal A (LA), luminal B (LB), human epidermal growth factor receptor 2 (HER2)-enriched, and basal-like (BL) BC [35–38]. Triple negative breast cancer (TNBC), lacking estrogen receptor (ER), progesterone receptor (PR) and HER2, is known to be the most heterogeneous and comprises largely of the basal-like subtype [39]. LA-BC is characterized by ER or PR positive but HER2 negative, while LB-BC presents with ER or PR and HER2 positive [40]. The HER2-enriched subtype is characterized by HER2 positive, both ER and PR negative, and high expression of proliferation-related genes [40]. The BL subtype includes plenty of TNBC and high expression of EGFR and proliferation-related genes [36, 41]. Furthermore, TNBC, the most heterogeneous BC, were defined into several subtypes namely, basal-like 1 and 2 (BL1, BL2), mesenchymal-like (ML) and luminal androgen (LAR) [42]. BL-TNBC subtype is characterized by highly activated cell cycle and DNA [43]. ML-TNBC is associated with poor prognosis due to enhanced epithelial-to-mesenchymal transition (EMT) [43] and elevated expression of genes involved in growth factor pathways [42, 44]. LAR-TNBC expresses differentially the estrogen/androgen metabolism pathways and is driven by androgen signaling [43, 45]. BL-BC representing TNBC is of particular interest because of aggressiveness, early pattern of metastasis, greater size of tumor, and lack of well-defined therapeutic target sites due to ER-/PR-/HER2-negative status [39, 46]. Most patients with TNBC have experienced higher rate of distant recurrence compared to patients with other BC subtypes, requiring identification of molecular drivers for TNBC.
To date, the signature profile of APPs in BC is not well defined. Here, we analyzed the signature profiles of APPs, interleukin (IL) family and TNF superfamily using publicly available datasets of breast tumor samples and cell lines. Based on the results analyzed, we found SAA as a main factor for proinflammatory predisposition in TNBC and proposed IL-1-induced SAA via NF-κB-mediated signaling as a molecular driver for the aggressiveness of TNBC.
RESULTS
SAA1 and SAA2 APPs are predominantly expressed in human BL-BC subtype and TNBC cells
We investigated the APP signature in human breast tumor tissues and cell lines. We used The Human Cancer Genome Atlas (TCGA)-based dataset for human BC tissues to define the APP signature in breast tumor heterogeneity. Analysis of TCGA-based dataset by Gitools 2.3.1 revealed the following dominant APP signature: BL-BC subtype representing TNBC highly expressed SAA1, SAA2, SAA4 and TF. Both BL and HER2 subtypes highly expressed ORM1 and CP (Figure 1A and 1B), while LA subtype highly expressed SERPINA1 and SERPINA2 (Figure 1A and 1B). In addition, the analysis of the National Center for Biotechnology Information (NCBI) Gene Expression Omnibus (GEO) dataset on 51 human BC cell lines revealed the following signature of APP: SAA1/2 was highly expressed in both BL- and ML-TNBC; C3 and FN1 were predominantly expressed in BL-and ML-TNBC cells, respectively (Figure 1C and Supplementary Figure 1). Based on the intersection of APP signature between human BC tissues and cell lines (Figure 1D) to exclude the tumor heterogeneity, SAA1 and SAA2 were highly expressed both TNBC tissues and cell lines (Figure 1D).
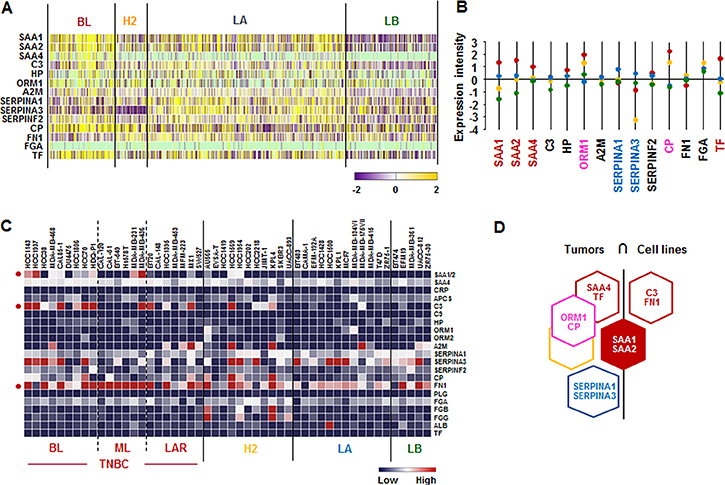
Figure 1: Acute-phase protein signatures in BC tissues and cell lines. (A) Heatmap for APP expression profiles in human BC tissues from TCGA-based dataset using Gitools 2.3.1. (B) Statistical analysis of APP expression intensity in human BC tissues. (C) Heatmap for RNA expression levels of APPs based on analysis of GEO dataset (Accession: GSE12777) with 51 human BC cell lines using Gitools 2.3.1. (D) Intersection of APP signature between human BC tissues and cell lines. Red, yellow, blue and green dots specify high expression levels in BL-, HER2 (H2)-, LA- and LB-BC subtypes, respectively. Pink letters specify high expression levels in both BL- and HER2-BC subtypes. ML; mesenchymal-like, LAR; luminal androgen receptor and TNBC; triple-negative breast cancer.
IL1A, IL1B, IL8/CXCL8 and IL32 are highly expressed in human BL-BC subtype and TNBC cells
We analyzed the IL superfamily signature in human breast tumor tissues and cell lines. We also used TCGA-based dataset for human BC tissues and NCBI-GEO dataset for 51 human BC cell lines. Particularly, BL-BC subtype representing TNBC highly expressed IL1A, IL1B, IL23A, IL32 and IL34 (Figure 2A and 2B). Both BL- and HER2-BC subtypes predominantly expressed IL7 and IL8, while LA-BC subtype highly expressed IL33 (Figure 2A and 2B). In addition, both BL- and ML-TNBC human cell lines highly expressed IL1A, IL1B, IL6, IL8/CXCL8 and IL32, BL-TNBC cell lines highly expressed IL18, and LA cell lines dominantly expressed IL20 (Figure 2C and Supplementary Figure 2). Based on the intersection of interleukin superfamily signature between human BC tissues and cell lines (Figure 2D) to exclude the tumor heterogeneity, both TNBC tissues and cell lines dominantly expressed IL1A, IL1B, IL8, and IL32 (Figure 2D).
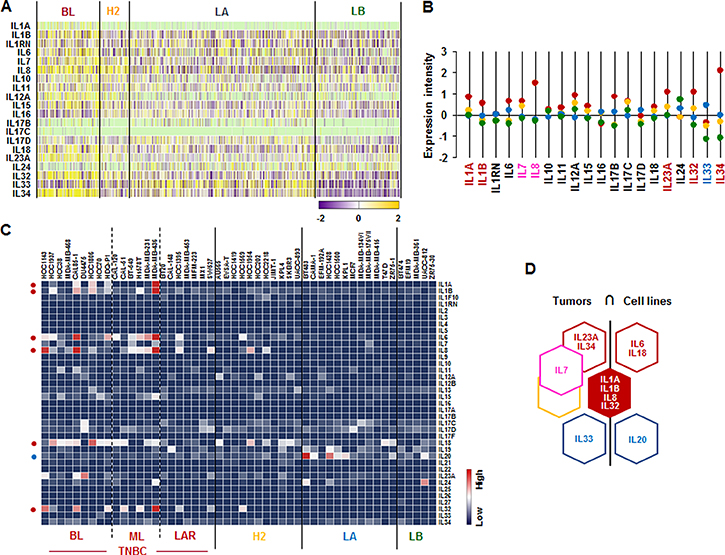
Figure 2: Interleukin superfamily signatures in BC tissues and cell lines. (A) Heatmap for IL superfamily expression profiles in human BC tissues from TCGA-based dataset using Gitools 2.3.1. (B) Statistical analysis of IL superfamily expression intensity in human BC tissues. (C) Heatmap for RNA expression levels of IL superfamily based on analysis of GEO dataset (Accession: GSE12777) with 51 human BC cell lines using Gitools 2.3.1. (D) Intersection of IL superfamily signature between human BC tissues and cell lines. Red, yellow, blue and green dots specify high expression levels in BL-, HER2 (H2)-, LA- and LB-BC subtypes, respectively. Pink letters specify high expression levels in both BL- and HER2-BC subtypes. ML; mesenchymal-like, LAR; luminal androgen receptor and TNBC; triple-negative breast cancer.
IL27RA is predominantly expressed in human BL-BC subtype and TNBC cells
We also assessed the IL receptor superfamily signature in human breast tumor tissues and cell lines. Analysis based on TCGA-based dataset for human BC tissues revealed that BL-BC subtype representing TNBC highly expressed the following receptors: IL1R2, IL1RAP, IL1RL2, IL12RB2, IL15RA, IL17RD, IL18R1, IL20RB, IL22RA1, IL22RA2, and IL27RA (Figure 3A and 3B). HER2-BC subtype highly expressed IL13RA1 and LA-BC subtype highly expressed IL6ST (Figure 3A and 3B). Both BL- and HER2-BC subtypes highly expressed the following receptors: IL2RA, IL2RB, IL2R6, IL12RB1, IL18RAP and IL21R (Figure 3A and 3B). However, only IL7R (BL- and ML-TNBC) and IL27RA (BL-TNBC) are highly expressed on human cell lines (Figure 3C and Supplementary Figure 2). Based on the intersection of interleukin receptor superfamily signature between human BC tissues and cell lines (Figure 3D) to exclude the tumor heterogeneity, IL27RA was predominantly expressed in both TNBC tissues and cell lines (Figure 3D).
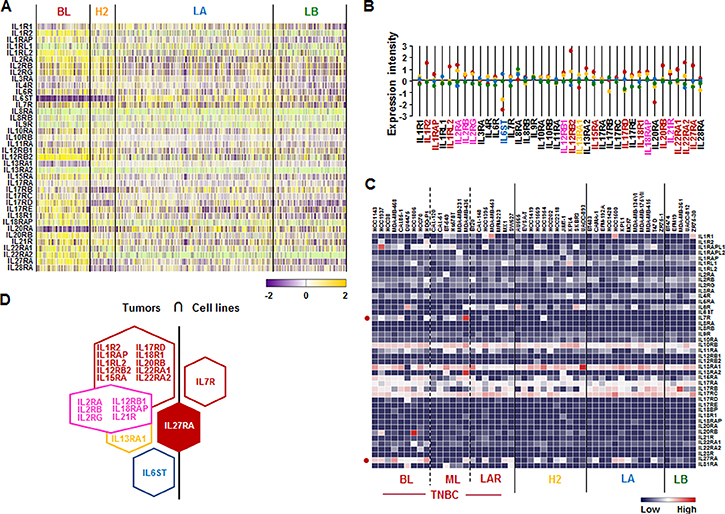
Figure 3: Interleukin receptor superfamily signatures in BC tissues and cell lines. (A) Heatmap for IL receptor superfamily expression profiles in human BC tissues from TCGA-based dataset using Gitools 2.3.1. (B) Statistical analysis of IL receptor superfamily expression intensity in human BC tissues. (C) Heatmap for RNA expression levels of IL receptor superfamily based on analysis of GEO dataset (Accession: GSE12777) with 51 human BC cell lines using Gitools 2.3.1. (D) Intersection of IL receptor superfamily signature between human BC tissues and cell lines. Red, yellow, blue and green dots specify high expression levels in BL-, HER2 (H2)-, LA- and LB-BC subtypes, respectively. Pink letters specify high expression levels in both BL- and HER2-BC subtypes. ML; mesenchymal-like, LAR; luminal androgen receptor and TNBC; triple-negative breast cancer.
CD70 and TNFSF9 are predominantly expressed in human BL-BC subtype and TNBC cells
We checked the signature of TNF superfamily in human breast tumor tissues and cells lines. According to the analysis on TCGA-based dataset for human BC tissues, CD70 and TNF are highly expressed in BL-BC representing TNBC, while TNFSF12 is highly expressed in LA-BC subtype (Figure 4A and 4B). Both BL- and HER2-BC subtypes highly expressed FASLG, LTA and LTB (Figure 4A and 4B). Moreover, BL- and ML-TNBC human cell lines highly expressed CD70 and TNFSF9 (Figure 4C and Supplementary Figure 3). Based on the intersection of TNF superfamily signature between human BC tissues and cell lines (Figure 4D) to exclude the tumor heterogeneity, both TNBC tissues and cell lines dominantly expressed CD70 and TNFSF9 (Figure 4D).
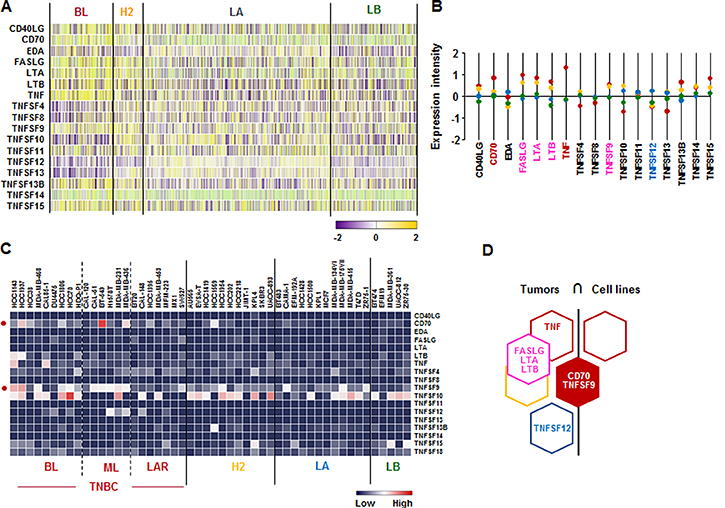
Figure 4: TNF superfamily signatures in BC tissues and cell lines. (A) Heatmap for TNF superfamily expression profiles in human BC tissues from TCGA-based dataset using Gitools 2.3.1. (B) Statistical analysis of TNF superfamily expression intensity in human BC tissues. (C) Heatmap for RNA expression levels of TNF superfamily based on analysis of GEO dataset (Accession: GSE12777) with 51 human BC cell lines using Gitools 2.3.1. (D) Intersection of TNF superfamily signature between human BC tissues and cell lines. Red, yellow, blue and green dots specify high expression levels in BL-, HER2 (H2)-, LA- and LB-BC subtypes, respectively. Pink letters specify high expression levels in both BL- and HER2-BC subtypes. ML; mesenchymal-like, LAR; luminal androgen receptor and TNBC; triple-negative breast cancer.
TNFRSF21 is mainly expressed in human BL-BC subtype and TNBC cells
We further assessed the TNF receptor superfamily signature in human breast tumor tissues and cells lines. Analysis on TCGA-based dataset for human BC tissues showed that BL-BC subtype representing TNBC highly expressed FAS, LTBR, TNFRSF10B, TNFRSF10D, TNFRSF11A, TNFRSF13B, TNFRSF21, and TNFRSF25 (Figure 5A and 5B). LA-BC subtype highly expressed NGFR, TNFRSF10C, TNFRSF14 and TNFRSF19 (Figure 5A and 5B). Both BL- and HER2-BC subtypes highly expressed TNFRSF4, TNFRSF8, TNFRSF9, TNFRSF10A, TNFRSF12A and TNFRSF17 (Figure 5A and 5B). However, our analysis of NCBI GEO dataset on 51 human BC cell lines showed that only TNFRSF21 is highly expressed in BL- and ML-TNBC cells (Figure 5C and Supplementary Figure 3). Based on the intersection of TNF receptor superfamily signature between human BC tissues and cell lines (Figure 5D) to exclude the tumor heterogeneity, both TNBC tissues and cell lines dominantly expressed TNFRSF21 (Figure 5D).
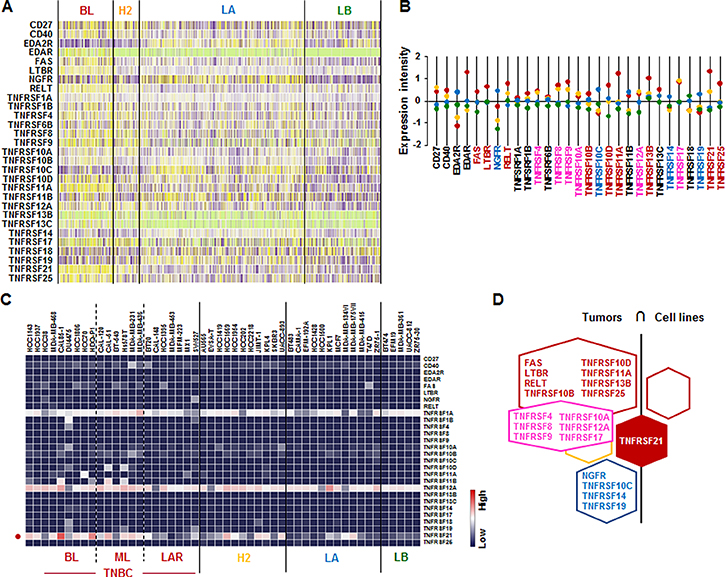
Figure 5: TNF receptor superfamily signatures in BC tissues and cell lines. (A) Heatmap for TNF receptor superfamily expression profiles in human BC tissues from TCGA-based dataset using Gitools 2.3.1. (B) Statistical analysis of TNF receptor superfamily expression intensity in human BC tissues. (C) Heatmap for RNA expression levels of TNF receptor superfamily based on analysis of GEO dataset (Accession: GSE12777) with 51 human BC cell lines using Gitools 2.3.1. (D) Intersection of TNF receptor superfamily signature between human BC tissues and cell lines. Red, yellow, blue and green dots specify high expression levels in BL-, HER2 (H2)-, LA- and LB-BC subtypes, respectively. Pink letters specify high expression levels in both BL- and HER2-BC subtypes. ML; mesenchymal-like, LAR; luminal androgen receptor and TNBC; triple-negative breast cancer.
TLR1 and TLR2 are predominantly expressed in human BL-BC subtype and TNBC cells
We investigated the SAA receptor and TLR family signature in human breast tumor tissues and cell lines. SAA has multiple receptors, including the FPR2, the TLRs TLR2 and TLR4, the scavenger receptor SR-BI, and the ATP receptor P2X7 [47]. Analysis on TCGA-based dataset for human BC tissues revealed that the BL-BC subtype representing TNBC highly expressed SCARB1, TLR1, TLR2, and TLR6, while LA-BC subtype dominantly expressed TLR3 (Figure 6A and 6B). Both BL and HER2-subtypes highly expressed TLR8 and TLR9 (Figure 6A and 6B). In addition, the analysis of NCBI GEO dataset on human BC cell lines revealed that TLR1 and TLR3 were highly expressed in BL-TNBC, while TLR2 was highly expressed in BL- and ML-TNBC and HER2 subtype (Figure 6C and Supplementary Figure 3). Based on the intersection of SAA receptors and TLR superfamily signature between human BC tissues and cell lines (Figure 6D) to exclude the tumor heterogeneity, TLR1 and TLR2 were highly expressed in both TNBC tissues and cell lines (Figure 6D).
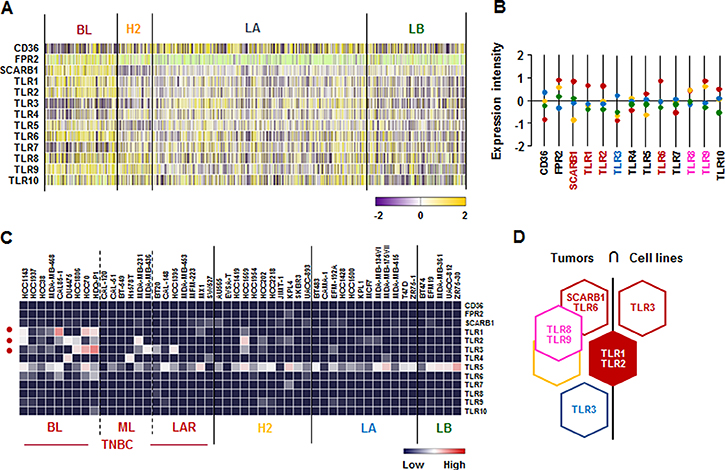
Figure 6: SAA receptor and TLR family signatures in BC tissues and cell lines. (A) Heatmap for SAA receptor and TLR family expression profiles in human BC tissues from TCGA-based dataset using Gitools 2.3.1. (B) Statistical analysis of SAA receptor and TLR family expression intensity in human BC tissues. (C) Heatmap for RNA expression levels of SAA receptor and TLR family based on analysis of GEO dataset (Accession: GSE12777) with 51 human BC cell lines using Gitools 2.3.1. (D) Intersection of SAA receptor and TLR family signature between human BC tissues and cell lines. Red, yellow, blue and green dots specify high expression levels in BL-, HER2 (H2)-, LA- and LB-BC subtypes, respectively. Pink letters specify high expression levels in both BL- and HER2-BC subtypes. ML; mesenchymal-like, LAR; luminal androgen receptor and TNBC; triple-negative breast cancer.
IL-1β augments SAA1 promoter activity via both NF-κB like and consensus sites
We utilized the Align Sequences Nucleotide and Protein BLAST (https://blast.ncbi.nlm.nih.gov) to check the identities of promoters, mRNAs and proteins of SAA1 and SAA2. The identity of SAA1 and SAA2 is 88% with the same NF-κB like (-287/-278) and consensus (-95/-86) sites (Figure 7A). The identities of mRNAs and proteins for SAA1 and SAA2α are 97% and 95%, SAA1 and SAA2β are 97% and 95%, while the identities of SAA2α and SAA2β are 99% and 99%, respectively (Figure 7A). SAA is restrictedly regulated by NF-κB signaling [21–23] and TNBC cells highly express IL1A and IL1B (Figure 2) which lead to production of IL-1α and IL-1β. We confirmed IL-1β-induced SAA1 promoter activity in TNBC cells to validate a high level of SAA1/2 in TNBC cells. SAA1-P401, SAA1-P319 and SAA1-P139 deletions were induced by IL-1β, whereas SAA1-P85 without κB sites was not induced (Figure 7B). The SAA1-P401 and SAA1-P319 containing κB-like and consensus sites have a similar induction level, while SAA1-P139 containing only the κB-consensus site has a lower induction level (Figure 7B). This result suggests that both κB-like and consensus sites is critical in regulating IL-1β-induced SAA1 promoter activity in TNBC cells. Based on SAA1-P319LUC (−319/+43) promoter generated previously [23], we further mutated each κB-site in the promoter to investigate which NF-κB sites could be critical in regulating IL-1β-induced SAA1 promoter activity. IL-1β fully induced SAA1-P319 promoter activity, while all of mutants abrogated IL-1β-induced effects (Figure 7C). The mutation of κB-like site at -279/-288 region abrogated IL-1β-induced SAA1 promoter activity without decreasing the basal activity, while the mutation of κB-consensus site at -97/-87 region abrogated both basal and IL-1β-induced activity (Figure 7C). The κB-consensus site at the proximal region -97/-87 appeared to be more critical site in regulating SAA1 even by eliminating IL-1β-induced SAA1 promoter activity, compared to the distal κB-like site (Figure 7C).
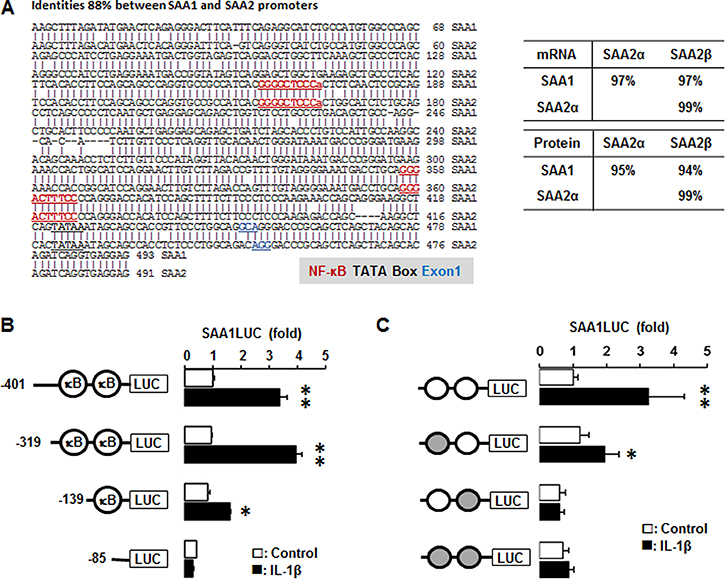
Figure 7: IL-1β increases human SAA1 promoter activity via NF-κB signaling. (A) DNA sequence and homology of the human SAA1 and SAA2 promoters. (B) Effects of IL-1β on luciferase activity in deletion constructs of the SAA1 promoter. After transfection with deletion constructs of SAA1 (SAA1-P401, SAA1-P319, SAA1-P139 and SAA1-P85) luciferase vectors in MDA-MB231 TNBC cells overnight, a luciferase promoter activity assay was performed at post-treatment of IL-1β (10 ng/ml) for 6 h. (C) Effects of IL-1β on luciferase activity in NF-κB mutated constructs of the SAA1 promoter. Site-directed mutants were generated from the SAA1-P319LUC using primers with mutant κB-like sites (-287/-278) and κB-consensus site (-95/-86). After transfection with SAA1-P319LUC and its mutant κB-site luciferase vectors in MDA-MB231 TNBC cells overnight, a luciferase promoter activity assay was performed at post-treatment of IL-1β (10 ng/ml) for 6 h. Results were normalized to the protein level and expressed as a fold increase compared to non-treated control. Gray circles indicate κB site mutants. *, ** indicate significant (p < 0.05) increase compared to each control, when a Student’s-t test was analyzed. Also, significant (p < 0.05) change exists between * and ** groups. Representative results are shown from triplicated experiments.
TLR1/2-mediated signaling is involved in regulating IL-1β-induced SAA and SAA1-induced CXCL8 promoter activity in TNBC cells
Because both TLR1 and TLR2 among the SAA receptors are highly expressed in TNBC cells (Figure 6), we utilized Cu-CPT22, antagonist of both TLR1 and TLR2, to confirm the involvement of TLR1/2 in IL-1β-induced SAA1 promoter activity. Cu-CPT22 significantly reduced IL-1β-induced SAA1 promoter activity in MDA-MB231 cells (Figure 8A). IL-8/CXCL8, a well-known proinflammatory chemokine [48], were highly expressed in human BL-BC tissues and TNBC cells (Figure 2). Using the previously generated CXCL8 promoter [48], we investigated if SAA1 could induce CXCL8 promoter activity. SAA1 fully induced the CXCL8 promoter activity in MDA-MB231 cells (Figure 8B). Furthermore, Cu-CPT22 partially reduced SAA1-induced CXCL8 promoter activity (Figure 8B). In addition, we analyzed coefficient of determination (R2) between SAA1/2 and TNBC-dominant IL and TNF subfamilies in 51 human BC cell lines as follows: R2 = 0.86 with IL1A, R2 = 0.88 with IL1B, R2 = 0.59 with CXCL8, R2 = 0.62 with IL32, R2 = 0.08 with IL27RA, R2 = 0.017 with CD70, R2 = 0.11 with TNFSF9, R2 = 0.027 with TNFRSF21, R2 = 0.002 with TLR1, and R2 = 0.002 with TLR2 (Supplementary Figure 4). Furthermore, we evaluated Kaplan-Meier overall survival (OS) for SAA1/2, TLR2 and IL8/CXCL8 which were highly expressed in ML-TNBC. The high expression levels of SAA1/2 (HR: 2.29, 95% CI: 1.04–5.04), TLR2 (HR: 2.78, 95% CI: 1.25–6.18) and IL8/CXCL8 (HR: 2.88, 95% CI: 1.31–6.36) were associated with poor OS in ML-TNBC patients (Figure 8C).
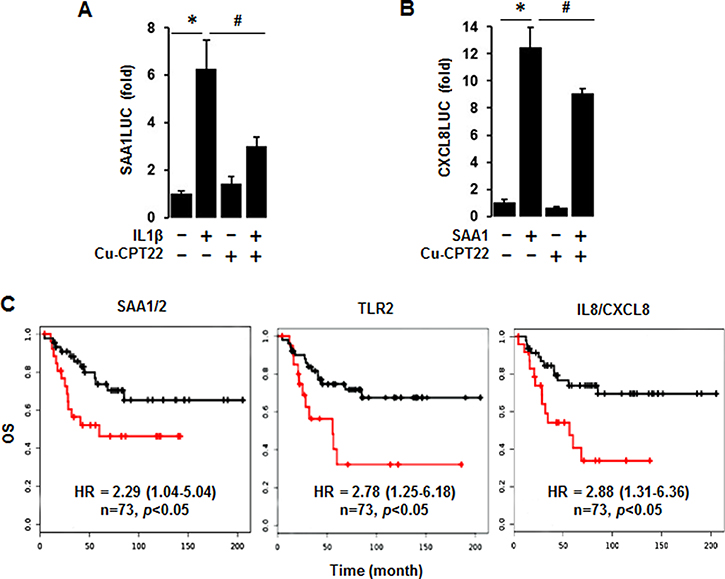
Figure 8: Abrogated effects of Cu-CPT22, a TLR1/2 inhibitor, on IL-1β-induced SAA1 and SAA1-induced CXCL8 promoter activities and overall survival (OS) of SAA1/2, TLR2 and CXCL8 expression levels. (A) Effect of Cu-CPT22, a TLR1/2 inhibitor, on IL-1β-induced SAA1 promoter activity. After transfection with SAA1-P319 luciferase vectors in MDA-MB231 TNBC cells overnight, a luciferase promoter activity assay was performed at post-treatment of IL-1β (10 ng/ml) for 6 h with a pre-treatment of Cu-CPT22 (1 μM) for 0.5 h. (B) Effect of Cu-CPT22, a TLR1/2 inhibitor, on SAA1-induced CXCL8/IL8 promoter activity. After transfection with human CXCL8 promoter (-322/+10) luciferase vectors in MDA-MB231 TNBC cells overnight, a luciferase promoter activity assay was performed at post-treatment of recombinant human SAA1 (500 ng/mL) for 6 h with a pre-treatment of Cu-CPT22 (1 μM) for 0.5 h. Results were normalized to the protein level and expressed as a fold increase compared to non-treated control. *, # indicate significant (p ≤ 0.05) increase and decrease, respectively, when ANOVA test was analyzed. Representative results are shown from triplicated experiments. (C) Kaplan-Meier OS for SAA1/2, TLR2 and CXCL8 in ML-TNBC patients (n = 73). The black and red lines indicate low and high expression levels, respectively.
DISCUSSION
A main finding in this study is that interaction of SAA and proinflammatory cytokines is potentiated in TNBC compared to other BC subtypes, probably leading to inflammatory tumor environment followed by cancer progression and a high mortality. Among expression profiles of APPs, SAA1/2 is emerging as a novel biomarker in TNBC. SAA is an acute-phase protein known to mediate proinflammatory response and generated primarily in the liver. Serum of healthy donors expresses SAA at relatively low levels [49]. SAA protein levels were higher in patients with ER-negative breast tumors compared to those with ER-positive [50], supporting our findings of higher levels of SAA1/2 in TNBC (Figure 1 and Supplementary Figure 1). High levels of SAA were related to survival time of patients less than one year with breast invasive ductal carcinoma as a useful marker in BC recurrence [51]. Elevated SAA was associated with reduced OS in BC [52]. On the other hand, SAA was linked to poor recurrence-free survival in BC but not OS [53]. Our results indicate that SAA is associated with poor OS in ML-TNBC subtype (Figure 8C) but not all of BC. Interestingly, elevated SAA in tumor-associated macrophage and breast tumor cells was associated with both lymphovascular invasion and lymph node metastasis [53]. In a BC mouse model, ectopic expression of SAA1 or SAA3 in tumor cells potently promoted widespread metastasis [54]. SAA in stages II, III and IV BC patients had a higher value compared to those of the healthy, benign and stage I groups. Also, BC patients with lymph node metastasis or distant metastasis were found to have significantly higher SAA levels [55]. These findings indicate a metastatic effect of SAA in BC, probably contributing to aggressiveness of TNBC which highly expresses SAA (Figure 1 and Supplementary Figure 1). The expression of SAA is restrictedly regulated by proinflammatory cytokines, such as IL-1, IL-6 and TNF [21–23, 56]. Because IL1A, IL1B, IL8/CXCL8, and IL32 are highly expressed in TNBC (Figure 2 and Supplementary Figure 2), these cytokines can be directly involved in upregulating SAA in TNBC. TNBC tumor irradiation in a mouse model significantly increased the plasma level of IL-1β, which was associated with lung metastases [57]. The basal levels of IL-1β were higher in TNBC cells compared with non-TNBC cells and IL-1β increased invasiveness of TNBC cells [58]. IL-1β also significantly increases IL-8/CXCL8 in TNBC cells [59]. IL-1β was found to induce SAA1 promoter activity in an NF-κB-dependent manner in TNBC cells (Figure 7) and SAA was able to induce IL8/CXCL8 promoter activity (Figure 8B), indicating that interaction of SAA and proinflammatory cytokines could enhance inflammatory burden in TNBC. IL-8/CXCL8 is a blood biomarker for TNBC, significantly increased in TNBC cells compared to non-TNBC, and increase the invasiveness and growth of TNBC cells [60–62]. IL-8/CXCL8 was associated with short disease-free survival and OS in TNBC [60, 63], supporting poor OS to high levels of IL8 in ML-TNBC subtype (Figure 8C). IL-32 increased migration and invasion capacities of TNBC cells [64] and promoted TNBC cell growth [65]. In addition, IL-32 is a potential immunotherapy target antigen in HLA-A2-positive TNBC [66]. Based on these results, a high level of IL32 in TNBC (Figure 2) may be involved in aggressiveness of TNBC despite unclear direct relationship between SAA and IL32. Although IL27RA is found to be predominantly expressed in BL-TNBC (Figure 3 and Supplementary Figure 2), a functional role of IL27RA in BC is poorly understood at this point. CD70 expression levels were significantly higher in BL-BC compared to LA [67], supporting our findings of high levels of CD70 in TNBC (Figure 4 and Supplementary Figure 3). A functional role of CD70 in BC is poorly understood at this point. TNFSF9 (4-1BB/CD137) antibody favored the propagation of CD8+ tumor-infiltrating lymphocytes (TILs) from TNBC tumors, being capable of cytotoxic functions [68]. This indicates that high levels of TNFSF9 in TNBC (Figure 4 and Supplementary Figure 3) might inhibit CD8+TILs to reduce cytotoxicity, leading to enhanced aggressiveness of TNBC. TNFRSF21 (DR6) level is known to be increased in a grade-dependent manner in BC [69], although the functional role of TNFRSF21 in TNBC is still unclear.
Based on the correlations of APPs with both dominant IL and TNF superfamily in TNBC found by the present studies and other studies, the interrelationship between SAA, IL-1 and IL8/CXCL8 appears to be a main driver in aggressiveness of TNBC. IL-1β-induced SAA1 promoter activity is critically involved in NF-κB-mediated pathway (Figure 7A and 7B) which upregulates IL8/CXCL8 [48]. IL-8/CXCL8 secretion by SAA correlates with NF-κB activation through FPRL1/LXA4R, a G protein-coupled receptor, in neutrophils [70]. SAA induced IL-8 in monocytes and dendritic cells [71] and peripheral blood mononuclear cells (PBMCs) [72]. SAA1 induced IL-8/CXCL8 via TLR4-mediated NF-κB signaling in human bone marrow-derived mesenchymal stem cells (hMSCs) [73]. In addition, SAA released TNF, IL-1β and IL-8 in neutrophils [16]. Although TLR2 among multiple receptors of SAA cells are highly expressed in TNBC (Figure 6), the interrelation between TLR2 and TNBC is poorly understood. We demonstrate that IL-1β-induced SAA1 and SAA1-induced CXCL8 promoter activities are partially mediated by TLR2 signaling in MDA-MB231 cells (Figure 8A and 8B). Other studies have also shown that SAA could activate NF-κB via TLR2-mediated pathway in HeLa cells and mouse macrophages [72, 73]. TLR2 is expressed in normal mammary epithelia and inhibition of TLR2 reduces growth of human BC cells [74]. Expression of TLR2 was increased in circulating tumor cell-positive patients [75]. TLR2 was highly expressed by two-fold in mammary cancer stem cells and inhibition of TLR2 signaling impaired in vitro mammosphere generation in MDA-MB-231 cells [76]. TLR2 mediates invasion by activating NF-κB in MDA-MB-231 cells [77]. Based on these findings, high levels of TLR2 in TNBC (Figure 6) might be closely involved in aggressiveness of TNBC, presenting poor OS to TLR2 in ML-TNBC (Figure 8C). Furthermore, SAA is known to activate the NF-κB signaling pathway in TLR2-dependent manner in other model systems [78–85]. Coefficient of determination indicates that SAA1/2 are associated with proinflammatory cytokines such as IL1 and IL8/CXCL8 in human BC cell lines (Supplementary Figure 4).
In conclusion, IL-1-induced SAA could predispose proinflammatory tumor microenvironment in TNBC, leading to aggressiveness of TNBC followed by a higher mortality.
MATERIALS AND METHODS
Reagents
Recombinant human (rh) proteins and inhibitors were purchased as follows: IL-1β from Life Technologies (Carlsbad, CA, USA) and Apo-SAA1 from Peprotech Inc. (Rocky Hill, NJ, USA) and Cu-CPT22 (TLR1 and TLR2 inhibitor) from MilliporeSigma (St. Louis, MO, USA). Antisense and sense oligonucleotides were obtained from Eurofins MWG Operon (Huntsville, AL, USA). Lipofectamine 2000 and all liquid culture media were acquired from Invitrogen (Grand Island, NY, USA). The Luciferase Reporter Assay System was obtained from Promega (Madison, WI, USA).
Data analysis from GEO and the TCGA datasets
Data analysis was performed using publicly available microarray data sets deposited in NCBI-GEO (http://www.ncbi.nlm.nih.gov/geo/) database under accession number GSE12777. Raw microarray data for APPs, IL family and TNF superfamily were RNA expression levels prepared from 51 human breast cancer cell lines. The basal acute-phase proteins, cytokines and their receptors expression levels were determined by global gene expression profiling of BC cell lines, while molecular subtyping was determined using gene expression and HER2 status by fluorescent in situ hybridization. We utilized Gitools 2.3.1 (http://www.gitools.org) based on Oracle Java 7, an open-source tool to perform Genomic Data Analysis and Visualization as interactive heat-maps [86]. Breast invasive carcinoma dataset for TCGA individual projects was used for BC subtypes as follows: n = 140 for BL-BC, n = 67 for HER2-BC, n = 419 for LA-BC and n = 192 for LB-BC patients (http://www.gitools.org/datasets/tcga).
Construction of the SAA1 promoter, its deletion constructs and the SAA1 κB-site mutants
Human SAA1 (−490/+43) promoter was generated as described previously [23]. The following primers were designed: 5′-GGG ATT ATA GGA GTG AGC CAC-3′ for sense and 5′-CTC CTC ACC TGA TCT GTG CTG-3′ for antisense. The PCR was performed for 35 cycles at 94°C for 1 min, 58°C for 1 min and 74°C for 1 min, followed by a final extension at 74°C for 10 min. The amplified SAA1 DNA fragment was then subcloned into pGEM-T easy vector (Promega, Madison, WI). Deletion constructs of pGL4.12 Luciferase Reporter Vector were produced from the SAA1 DNA fragment inserted in pGEM-T Easy Vector under the same PCR conditions using the following primers containing the XhoI and Hind III sites: : 5′-TAA CTC GAG ATC TGC CAT GTG GCC CAG CAG-3′ for SAA1-P401, 5′-TAA CTC GAG ACA CCT TCC AGC AGC CCA GGT-3′ for SAA1-P319, 5′-GCA CTC GAG CCA GGA ACT TGT CTT AGA CCG-3′ for SAA1-P139, and 5′-TAC CTC GAG CCA GGG ACC ACA TCC AGC TTT-3′ for SAA1-P85.
We found two κB sites in SAA1 promoter and generated mutant constructs by mutating each κB site. Primers for mutation of κB-consensus site (lowercase) were designed as follows: 5′-TGA CCT GCA aGG ACT TTC tCC AGG GAC CAC-3′ for -104/-74 and κB-like site; 5′-TGC CGC CAT CAC aGG GCT CCt ACT CTC AAC-3′ for -299/-269. The mutation of κB sites was performed by PCR-based mutagenesis using a site-directed mutagenesis kit according to manufacturer's instructions (Stratagene, La Jolla, CA). The mutant constructs of the SAA1 promoter were confirmed by DNA sequencing analysis. Human CXCL8 promoter (-322/+10) was generated as described previously [48].
Transient transfection and luciferase assay
TNBC MDA-MB231 cells at approximately 50% confluency in 24-well plates were washed once with fresh media without additives and then transiently transfected with SAA1 constructs and κB-site mutants for 24 h at 37°C using Lipofectamine solution. Transfected cells were treated as outlined in Results and incubated for 6 h. After rinsing cells with cold 1X PBS and adding lysis buffer (Promega, Madison, WI), cell lysates mixed with Bright-GloTM Assay Reagent (Promega, Madison, WI) were used for determination of luciferase activity using a microplate luminometer. Luciferase activity, expressed as relative light units, was normalized to measured protein levels.
Overall survival analysis
Kaplan-Meier plotter database was utilized to assess overall survival (OS) using proportional hazards regression to estimate Hazard Ratio (HR) and 95% Confidence Interval (CI) with auto computed cutoff value based on the gene expression levels of SAA1/2, TLR2 and IL8/CXCL8 from 73 ML-TNBC patients downloaded from GEO (Affymetrix HGU133A and HGU133+2 microarrays) [87].
Statistics
Data were analyzed by coefficient of determination (R2), the paired Student’s t-test and one-way analysis of variance (ANOVA) as appropriate. If statistical significance (p ≤ 0.05) was determined by ANOVA, the data were further analyzed by Tukey’s pairwise comparisons to detect specific differences between treatments.
Abbreviations
ANOVA, one-way analysis of variance; APPs, acute-phase proteins; BC: breast cancer; BL, basal-like; CI, Confidence Interval; EMT, epithelial-to-mesenchymal transition; ER, estrogen receptor; GEO: gene expression omnibus; HER2, epidermal growth factor receptor 2; hMSCs, human bone marrow-derived mesenchymal stem cells; HR, Hazard Ratio; IL, interleukin; LA, luminal A; LAR, luminal androgen; LB, luminal B; ML, mesenchymal-like; NCBI: National Center for Biotechnology Information; NF, nuclear factor; OS, overall survival; PBMCs, peripheral blood mononuclear cells; PR, progesterone receptor; SAA, serum amyloid A; TCGA: The Cancer Genome Atlas; TILs, tumor-infiltrating lymphocytes; TNBC, triple negative breast cancer; TNF, tumor necrosis factor.
Author contributions
SK, EL, SA, DS: Conceived and designed the experiments; RI, DS: Performed the experiments; RI, SK, EL, DS: Analyzed the data; RI, CG, SK, EL, SA, DS: Wrote the paper.
CONFLICTS OF INTEREST
The authors declare no conflicts of interest in this work.
GRANT SUPPORT
This research was supported by National Institutes of Health through the following grants: R01ES024756 (E.L.), NIMHD U54MD007593 (S.E.A), U54CA16306 (S.E.A), NIAID SC1AI089073 (D.S.) and NCI SC1CA200519 (D.S.). Its contents are solely the responsibility of the authors and do not necessarily represent the official views of NIH. S.K was supported by the National Research Foundation of Korea (NRF-2015R1A2A2A01003472, NRF-2014M3A6A4075058, NRF-2015R1A2A1A15051472) as BK21 plus project fund.
REFERENCES
1. Couderc E, Morel F, Levillain P, Buffiere-Morgado A, Camus M, Paquier C, Bodet C, Jegou JF, Pohin M, Favot L, Garcia M, Huguier V, McHeik J, et al. Interleukin-17A-induced production of acute serum amyloid A by keratinocytes contributes to psoriasis pathogenesis. PLoS One. 2017; 12:e0181486. https://doi.org/10.1371/journal.pone.0181486.
2. Meek RL, Urieli-Shoval S, Benditt EP. Expression of apolipoprotein serum amyloid A mRNA in human atherosclerotic lesions and cultured vascular cells: implications for serum amyloid A function. Proc Natl Acad Sci U S A. 1994; 91:3186–90.
3. Kumon Y, Suehiro T, Hashimoto K, Nakatani K, Sipe JD. Local expression of acute phase serum amyloid A mRNA in rheumatoid arthritis synovial tissue and cells. J Rheumatol. 1999; 26:785–90.
4. Urieli-Shoval S, Cohen P, Eisenberg S, Matzner Y. Widespread expression of serum amyloid A in histologically normal human tissues. Predominant localization to the epithelium. J Histochem Cytochem. 1998; 46:1377–84. https://doi.org/10.1177/002215549804601206.
5. Urieli-Shoval S, Finci-Yeheskel Z, Dishon S, Galinsky D, Linke RP, Ariel I, Levin M, Ben-Shachar I, Prus D. Expression of serum amyloid a in human ovarian epithelial tumors: implication for a role in ovarian tumorigenesis. J Histochem Cytochem. 2010; 58:1015–23. https://doi.org/10.1369/jhc.2010.956821.
6. Yamamoto K, Migita S. Complete primary structures of two major murine serum amyloid A proteins deduced from cDNA sequences. Proc Natl Acad Sci U S A. 1985; 82:2915–9.
7. Kluve-Beckerman B, Drumm ML, Benson MD. Nonexpression of the human serum amyloid A three (SAA3) gene. DNA Cell Biol. 1991; 10:651–61. https://doi.org/10.1089/dna.1991.10.651.
8. Steel DM, Sellar GC, Uhlar CM, Simon S, DeBeer FC, Whitehead AS. A constitutively expressed serum amyloid A protein gene (SAA4) is closely linked to, and shares structural similarities with, an acute-phase serum amyloid A protein gene (SAA2). Genomics. 1993; 16:447–54. https://doi.org/10.1006/geno.1993.1209.
9. Uhlar CM, Whitehead AS. Serum amyloid A, the major vertebrate acute-phase reactant. Eur J Biochem. 1999; 265:501–23.
10. Urieli-Shoval S, Linke RP, Matzner Y. Expression and function of serum amyloid A, a major acute-phase protein, in normal and disease states. Curr Opin Hematol. 2000; 7:64–9.
11. Chiba T, Han CY, Vaisar T, Shimokado K, Kargi A, Chen MH, Wang S, McDonald TO, O’Brien KD, Heinecke JW, Chait A. Serum amyloid A3 does not contribute to circulating SAA levels. J Lipid Res. 2009; 50:1353–62. https://doi.org/10.1194/jlr.M900089-JLR200.
12. Marhaug G, Dowton SB. Serum amyloid A: an acute phase apolipoprotein and precursor of AA amyloid. Baillieres Clin Rheumatol. 1994; 8:553–73.
13. Artl A, Marsche G, Lestavel S, Sattler W, Malle E. Role of serum amyloid A during metabolism of acute-phase HDL by macrophages. Arterioscler Thromb Vasc Biol. 2000; 20:763–72.
14. Badolato R, Wang JM, Murphy WJ, Lloyd AR, Michiel DF, Bausserman LL, Kelvin DJ, Oppenheim JJ. Serum amyloid A is a chemoattractant: induction of migration, adhesion, and tissue infiltration of monocytes and polymorphonuclear leukocytes. J Exp Med. 1994; 180:203–9.
15. Xu L, Badolato R, Murphy WJ, Longo DL, Anver M, Hale S, Oppenheim JJ, Wang JM. A novel biologic function of serum amyloid A. Induction of T lymphocyte migration and adhesion. J Immunol. 1995; 155:1184–90.
16. Furlaneto CJ, Campa A. A novel function of serum amyloid A: a potent stimulus for the release of tumor necrosis factor-alpha, interleukin-1beta, and interleukin-8 by human blood neutrophil. Biochem Biophys Res Commun. 2000; 268:405–8. https://doi.org/10.1006/bbrc.2000.2143.
17. Jijon HB, Madsen KL, Walker JW, Allard B, Jobin C. Serum amyloid A activates NF-kappaB and proinflammatory gene expression in human and murine intestinal epithelial cells. Eur J Immunol. 2005; 35:718–26. https://doi.org/10.1002/eji.200425688.
18. Koga T, Torigoshi T, Motokawa S, Miyashita T, Maeda Y, Nakamura M, Komori A, Aiba Y, Uemura T, Yatsuhashi H, Ishibashi H, Eguchi K, Migita K. Serum amyloid A-induced IL-6 production by rheumatoid synoviocytes. FEBS Lett. 2008; 582:579–85. https://doi.org/10.1016/j.febslet.2008.01.022.
19. Lee MS, Yoo SA, Cho CS, Suh PG, Kim WU, Ryu SH. Serum amyloid A binding to formyl peptide receptor-like 1 induces synovial hyperplasia and angiogenesis. J Immunol. 2006; 177:5585–94.
20. Mullan RH, Bresnihan B, Golden-Mason L, Markham T, O’Hara R, FitzGerald O, Veale DJ, Fearon U. Acute-phase serum amyloid A stimulation of angiogenesis, leukocyte recruitment, and matrix degradation in rheumatoid arthritis through an NF-kappaB-dependent signal transduction pathway. Arthritis Rheum. 2006; 54:105–14. https://doi.org/10.1002/art.21518.
21. Son DS, Roby KF, Terranova PF. Tumor necrosis factor-alpha induces serum amyloid A3 in mouse granulosa cells. Endocrinology. 2004; 145:2245–52. https://doi.org/10.1210/en.2003-1261.
22. Son DS, Terranova PF, Roby KF. Interaction of adenosine 3’,5’-cyclic monophosphate and tumor necrosis factor-alpha on serum amyloid A3 expression in mouse granulosa cells: dependence on CCAAT-enhancing binding protein-beta isoform. Endocrinology. 2010; 151:3407–19. https://doi.org/10.1210/en.2009-1321.
23. Choi H, Ignacio RMC, Lee ES, Wilson AJ, Khabele D, Son DS. Augmented Serum Amyloid A1/2 Mediated by TNF-induced NF-kappaB in Human Serous Ovarian Epithelial Tumors. Immune Netw. 2017; 17:121–7. https://doi.org/10.4110/in.2017.17.2.121.
24. Howard BA, Wang MZ, Campa MJ, Corro C, Fitzgerald MC, Patz EF Jr. Identification and validation of a potential lung cancer serum biomarker detected by matrix-assisted laser desorption/ionization-time of flight spectra analysis. Proteomics. 2003; 3:1720–4. https://doi.org/10.1002/pmic.200300514.
25. Gao WM, Kuick R, Orchekowski RP, Misek DE, Qiu J, Greenberg AK, Rom WN, Brenner DE, Omenn GS, Haab BB, Hanash SM. Distinctive serum protein profiles involving abundant proteins in lung cancer patients based upon antibody microarray analysis. BMC Cancer. 2005; 5:110. https://doi.org/10.1186/1471-2407-5-110.
26. Liu DH, Wang XM, Zhang LJ, Dai SW, Liu LY, Liu JF, Wu SS, Yang SY, Fu S, Xiao XY, He DC. Serum amyloid A protein: a potential biomarker correlated with clinical stage of lung cancer. Biomed Environ Sci. 2007; 20:33–40.
27. Moshkovskii SA, Serebryakova MV, Kuteykin-Teplyakov KB, Tikhonova OV, Goufman EI, Zgoda VG, Taranets IN, Makarov OV, Archakov AI. Ovarian cancer marker of 11.7 kDa detected by proteomics is a serum amyloid A1. Proteomics. 2005; 5:3790–7. https://doi.org/10.1002/pmic.200401205.
28. Yokoi K, Shih LC, Kobayashi R, Koomen J, Hawke D, Li D, Hamilton SR, Abbruzzese JL, Coombes KR, Fidler IJ. Serum amyloid A as a tumor marker in sera of nude mice with orthotopic human pancreatic cancer and in plasma of patients with pancreatic cancer. Int J Oncol. 2005; 27:1361–9.
29. Koomen JM, Shih LN, Coombes KR, Li D, Xiao LC, Fidler IJ, Abbruzzese JL, Kobayashi R. Plasma protein profiling for diagnosis of pancreatic cancer reveals the presence of host response proteins. Clin Cancer Res. 2005; 11:1110–8.
30. Le L, Chi K, Tyldesley S, Flibotte S, Diamond DL, Kuzyk MA, Sadar MD. Identification of serum amyloid A as a biomarker to distinguish prostate cancer patients with bone lesions. Clin Chem. 2005; 51:695–707. https://doi.org/10.1373/clinchem.2004.041087.
31. Cocco E, Bellone S, El-Sahwi K, Cargnelutti M, Casagrande F, Buza N, Tavassoli FA, Siegel ER, Visintin I, Ratner E, Silasi DA, Azodi M, Schwartz PE, et al. Serum amyloid A (SAA): a novel biomarker for uterine serous papillary cancer. Br J Cancer. 2009; 101:335–41. https://doi.org/10.1038/sj.bjc.6605129.
32. Paret C, Schon Z, Szponar A, Kovacs G. Inflammatory protein serum amyloid A1 marks a subset of conventional renal cell carcinomas with fatal outcome. Eur Urol. 2010; 57:859–66. https://doi.org/10.1016/j.eururo.2009.08.014.
33. Choi H, Ignacio RMC, Lee ES, Roby KF, Terranova PF, Son DS. Localization of Serum Amyloid A3 in the Mouse Ovary. Immune Netw. 2017; 17:261–8. https://doi.org/10.4110/in.2017.17.4.261.
34. Siegel RL, Miller KD, Jemal A. Cancer Statistics, 2017. CA Cancer J Clin. 2017; 67:7–30. https://doi.org/10.3322/caac.21387.
35. Hon JD, Singh B, Sahin A, Du G, Wang J, Wang VY, Deng FM, Zhang DY, Monaco ME, Lee P. Breast cancer molecular subtypes: from TNBC to QNBC. Am J Cancer Res. 2016; 6:1864–72.
36. Perou CM, Sorlie T, Eisen MB, van de Rijn M, Jeffrey SS, Rees CA, Pollack JR, Ross DT, Johnsen H, Akslen LA, Fluge O, Pergamenschikov A, Williams C, et al. Molecular portraits of human breast tumours. Nature. 2000; 406:747–52. https://doi.org/10.1038/35021093.
37. Sorlie T, Tibshirani R, Parker J, Hastie T, Marron JS, Nobel A, Deng S, Johnsen H, Pesich R, Geisler S, Demeter J, Perou CM, Lonning PE, et al. Repeated observation of breast tumor subtypes in independent gene expression data sets. Proc Natl Acad Sci U S A. 2003; 100:8418–23. https://doi.org/10.1073/pnas.0932692100.
38. Goldhirsch A, Wood WC, Coates AS, Gelber RD, Thurlimann B, Senn HJ. Strategies for subtypes--dealing with the diversity of breast cancer: highlights of the St. Gallen International Expert Consensus on the Primary Therapy of Early Breast Cancer 2011. Ann Oncol. 2011; 22:1736–47. https://doi.org/10.1093/annonc/mdr304.
39. Dai X, Li T, Bai Z, Yang Y, Liu X, Zhan J, Shi B. Breast cancer intrinsic subtype classification, clinical use and future trends. Am J Cancer Res. 2015; 5:2929–43.
40. Vallejos CS, Gomez HL, Cruz WR, Pinto JA, Dyer RR, Velarde R, Suazo JF, Neciosup SP, Leon M, de la Cruz MA, Vigil CE. Breast cancer classification according to immunohistochemistry markers: subtypes and association with clinicopathologic variables in a peruvian hospital database. Clin Breast Cancer. 2010; 10:294–300. https://doi.org/10.3816/CBC.2010.n.038.
41. Sotiriou C, Neo SY, McShane LM, Korn EL, Long PM, Jazaeri A, Martiat P, Fox SB, Harris AL, Liu ET. Breast cancer classification and prognosis based on gene expression profiles from a population-based study. Proc Natl Acad Sci U S A. 2003; 100:10393–8. https://doi.org/10.1073/pnas.1732912100.
42. Lehmann BD, Jovanovic B, Chen X, Estrada MV, Johnson KN, Shyr Y, Moses HL, Sanders ME, Pietenpol JA. Refinement of Triple-Negative Breast Cancer Molecular Subtypes: Implications for Neoadjuvant Chemotherapy Selection. PLoS One. 2016; 11:e0157368. https://doi.org/10.1371/journal.pone.0157368.
43. Lehmann BD, Bauer JA, Chen X, Sanders ME, Chakravarthy AB, Shyr Y, Pietenpol JA. Identification of human triple-negative breast cancer subtypes and preclinical models for selection of targeted therapies. J Clin Invest. 2011; 121:2750–67. https://doi.org/10.1172/jci45014.
44. Yu KD, Zhu R, Zhan M, Rodriguez AA, Yang W, Wong S, Makris A, Lehmann BD, Chen X, Mayer I, Pietenpol JA, Shao ZM, Symmans WF, et al. Identification of prognosis-relevant subgroups in patients with chemoresistant triple-negative breast cancer. Clin Cancer Res. 2013; 19:2723–33. https://doi.org/10.1158/1078-0432.ccr-12-2986.
45. Ahn SG, Kim SJ, Kim C, Jeong J. Molecular Classification of Triple-Negative Breast Cancer. J Breast Cancer. 2016; 19:223–30. https://doi.org/10.4048/jbc.2016.19.3.223.
46. Anders CK, Carey LA. Biology, metastatic patterns, and treatment of patients with triple-negative breast cancer. Clin Breast Cancer. 2009 (Suppl 2); 9:S73–81. https://doi.org/10.3816/CBC.2009.s.008.
47. Ye RD, Sun L. Emerging functions of serum amyloid A in inflammation. J Leukoc Biol. 2015; 98:923–9. https://doi.org/10.1189/jlb.3VMR0315-080R.
48. Son DS, Kabir SM, Dong Y, Lee E, Adunyah SE. Characteristics of chemokine signatures elicited by EGF and TNF in ovarian cancer cells. J Inflamm (Lond). 2013; 10:25. https://doi.org/10.1186/1476-9255-10-25.
49. d’Eril GM, Anesi A, Maggiore M, Leoni V. Biological variation of serum amyloid A in healthy subjects. Clin Chem. 2001; 47:1498–9.
50. Santana AB, Gurgel MS, de Oliveira Montanari JF, Bonini FM, de Barros-Mazon S. Serum amyloid a is associated with obesity and estrogen receptor-negative tumors in postmenopausal women with breast cancer. Cancer Epidemiol Biomarkers Prev. 2013; 22:270–4. https://doi.org/10.1158/1055-9965.epi-12-1020.
51. Bobin-Dubigeon C, Lefrancois A, Classe JM, Joalland MP, Bard JM. Paired measurement of serum amyloid A (SAA) and paraoxonase 1 (PON1) as useful markers in breast cancer recurrence. Clin Biochem. 2015; 48:1181–3. https://doi.org/10.1016/j.clinbiochem.2015.07.020.
52. Pierce BL, Ballard-Barbash R, Bernstein L, Baumgartner RN, Neuhouser ML, Wener MH, Baumgartner KB, Gilliland FD, Sorensen BE, McTiernan A, Ulrich CM. Elevated biomarkers of inflammation are associated with reduced survival among breast cancer patients. J Clin Oncol. 2009; 27:3437–44. https://doi.org/10.1200/jco.2008.18.9068.
53. Yang M, Liu F, Higuchi K, Sawashita J, Fu X, Zhang L, Zhang L, Fu L, Tong Z, Higuchi K. Serum amyloid A expression in the breast cancer tissue is associated with poor prognosis. Oncotarget. 2016; 7:35843–52. https://doi.org/10.18632/oncotarget.8561.
54. Hansen MT, Forst B, Cremers N, Quagliata L, Ambartsumian N, Grum-Schwensen B, Klingelhofer J, Abdul-Al A, Herrmann P, Osterland M, Stein U, Nielsen GH, Scherer PE, et al. A link between inflammation and metastasis: serum amyloid A1 and A3 induce metastasis, and are targets of metastasis-inducing S100A4. Oncogene. 2015; 34:424–35. https://doi.org/10.1038/onc.2013.568.
55. Zhang G, Sun X, Lv H, Yang X, Kang X. Serum amyloid A: A new potential serum marker correlated with the stage of breast cancer. Oncol Lett. 2012; 3:940–4. https://doi.org/10.3892/ol.2012.584.
56. Malle E, Sodin-Semrl S, Kovacevic A. Serum amyloid A: an acute-phase protein involved in tumour pathogenesis. Cell Mol Life Sci. 2009; 66:9–26. https://doi.org/10.1007/s00018-008-8321-x.
57. Bouchard G, Therriault H, Bujold R, Saucier C, Paquette B. Induction of interleukin-1beta by mouse mammary tumor irradiation promotes triple negative breast cancer cells invasion and metastasis development. Int J Radiat Biol. 2017; 93:507–16. https://doi.org/10.1080/09553002.2017.1270471.
58. Jeon M, Han J, Nam SJ, Lee JE, Kim S. Elevated IL-1beta expression induces invasiveness of triple negative breast cancer cells and is suppressed by zerumbone. Chem Biol Interact. 2016; 258:126–33. https://doi.org/10.1016/j.cbi.2016.08.021.
59. Han J, Bae SY, Oh SJ, Lee J, Lee JH, Lee HC, Lee SK, Kil WH, Kim SW, Nam SJ, Kim S, Lee JE. Zerumbone suppresses IL-1beta-induced cell migration and invasion by inhibiting IL-8 and MMP-3 expression in human triple-negative breast cancer cells. Phytother Res. 2014; 28:1654–60. https://doi.org/10.1002/ptr.5178.
60. Hartman ZC, Poage GM, den Hollander P, Tsimelzon A, Hill J, Panupinthu N, Zhang Y, Mazumdar A, Hilsenbeck SG, Mills GB, Brown PH. Growth of triple-negative breast cancer cells relies upon coordinate autocrine expression of the proinflammatory cytokines IL-6 and IL-8. Cancer Res. 2013; 73:3470–80. https://doi.org/10.1158/0008-5472.can-12-4524-t.
61. Fleisher B, Clarke C, Ait-Oudhia S. Current advances in biomarkers for targeted therapy in triple-negative breast cancer. Breast Cancer (Dove Med Press). 2016; 8:183–97. https://doi.org/10.2147/bctt.s114659.
62. Kim S, Lee J, Jeon M, Lee JE, Nam SJ. MEK-dependent IL-8 induction regulates the invasiveness of triple-negative breast cancer cells. Tumour Biol. 2016; 37:4991–9. https://doi.org/10.1007/s13277-015-4345-7.
63. Kim S, Kim DH, Jung WH, Koo JS. Clinicopathologic characteristics of STAT1 positive/interleukin-8 negative subgroup in triple negative breast cancer defined by surrogate immunohistochemistry. Histol Histopathol. 2013; 28:1461–71. https://doi.org/10.14670/hh-28.1461.
64. Park JS, Choi SY, Lee JH, Lee M, Nam ES, Jeong AL, Lee S, Han S, Lee MS, Lim JS, Yoon DY, Kwon Y, Yang Y. Interleukin-32beta stimulates migration of MDA-MB-231 and MCF-7cells via the VEGF-STAT3 signaling pathway. Cell Oncol (Dordr). 2013; 36:493–503. https://doi.org/10.1007/s13402-013-0154-4.
65. Wang S, Chen F, Tang L. IL-32 promotes breast cancer cell growth and invasiveness. Oncol Lett. 2015; 9:305–7. https://doi.org/10.3892/ol.2014.2641.
66. Ternette N, Olde Nordkamp MJM, Muller J, Anderson AP, Nicastri A, Hill AVS, Kessler BM, Li D. Immunopeptidomic Profiling of HLA-A2-Positive Triple Negative Breast Cancer Identifies Potential Immunotherapy Target Antigens. Proteomics. 2018; 18:e1700465. https://doi.org/10.1002/pmic.201700465.
67. Petrau C, Cornic M, Bertrand P, Maingonnat C, Marchand V, Picquenot JM, Jardin F, Clatot F. CD70: A Potential Target in Breast Cancer? J Cancer. 2014; 5:761–4. https://doi.org/10.7150/jca.10360.
68. Harao M, Forget MA, Roszik J, Gao H, Babiera GV, Krishnamurthy S, Chacon JA, Li S, Mittendorf EA, DeSnyder SM, Rockwood KF, Bernatchez C, Ueno NT, et al. 4-1BB-Enhanced Expansion of CD8(+) TIL from Triple-Negative Breast Cancer Unveils Mutation-Specific CD8(+) T Cells. Cancer Immunol Res. 2017; 5:439–45. https://doi.org/10.1158/2326-6066.cir-16-0364.
69. Bilecova-Rabajdova M, Urban P, Gregova K, Varga J, Fialkovicova V, Kruzliak P, Marekova M. Breast carcinoma progression and tumour vascular markers related to apoptotic mechanisms. Dis Markers. 2014; 2014:156034. https://doi.org/10.1155/2014/156034.
70. He R, Sang H, Ye RD. Serum amyloid A induces IL-8 secretion through a G protein-coupled receptor, FPRL1/LXA4R. Blood. 2003; 101:1572–81. https://doi.org/10.1182/blood-2002-05-1431.
71. Gouwy M, De Buck M, Portner N, Opdenakker G, Proost P, Struyf S, Van Damme J. Serum amyloid A chemoattracts immature dendritic cells and indirectly provokes monocyte chemotaxis by induction of cooperating CC and CXC chemokines. Eur J Immunol. 2015; 45:101–12. https://doi.org/10.1002/eji.201444818.
72. O’Neill L, Rooney P, Molloy D, Connolly M, McCormick J, McCarthy G, Veale DJ, Murphy CC, Fearon U, Molloy E. Regulation of Inflammation and Angiogenesis in Giant Cell Arteritis by Acute-Phase Serum Amyloid A. Arthritis Rheumatol. 2015; 67:2447–56. https://doi.org/10.1002/art.39217.
73. Ebert R, Benisch P, Krug M, Zeck S, Meissner-Weigl J, Steinert A, Rauner M, Hofbauer L, Jakob F. Acute phase serum amyloid A induces proinflammatory cytokines and mineralization via toll-like receptor 4 in mesenchymal stem cells. Stem Cell Res. 2015; 15:231–9. https://doi.org/10.1016/j.scr.2015.06.008.
74. Scheeren FA, Kuo AH, van Weele LJ, Cai S, Glykofridis I, Sikandar SS, Zabala M, Qian D, Lam JS, Johnston D, Volkmer JP, Sahoo D, van de Rijn M, et al. A cell-intrinsic role for TLR2-MYD88 in intestinal and breast epithelia and oncogenesis. Nat Cell Biol. 2014; 16:1238–48. https://doi.org/10.1038/ncb3058.
75. Green TL, Santos MF, Ejaeidi AA, Craft BS, Lewis RE, Cruse JM. Toll-like receptor (TLR) expression of immune system cells from metastatic breast cancer patients with circulating tumor cells. Exp Mol Pathol. 2014; 97:44–8. https://doi.org/10.1016/j.yexmp.2014.05.003.
76. Conti L, Lanzardo S, Arigoni M, Antonazzo R, Radaelli E, Cantarella D, Calogero RA, Cavallo F. The noninflammatory role of high mobility group box 1/Toll-like receptor 2 axis in the self-renewal of mammary cancer stem cells. FASEB J. 2013; 27:4731–44. https://doi.org/10.1096/fj.13-230201.
77. Xie W, Wang Y, Huang Y, Yang H, Wang J, Hu Z. Toll-like receptor 2 mediates invasion via activating NF-kappaB in MDA-MB-231 breast cancer cells. Biochem Biophys Res Commun. 2009; 379:1027–32. https://doi.org/10.1016/j.bbrc.2009.01.009.
78. Cheng N, He R, Tian J, Ye PP, Ye RD. Cutting edge: TLR2 is a functional receptor for acute-phase serum amyloid A. J Immunol. 2008; 181:22–6.
79. He RL, Zhou J, Hanson CZ, Chen J, Cheng N, Ye RD. Serum amyloid A induces G-CSF expression and neutrophilia via Toll-like receptor 2. Blood. 2009; 113:429–37. https://doi.org/10.1182/blood-2008-03-139923.
80. O’Reilly S, Cant R, Ciechomska M, Finnigan J, Oakley F, Hambleton S, van Laar JM. Serum amyloid A induces interleukin-6 in dermal fibroblasts via Toll-like receptor 2, interleukin-1 receptor-associated kinase 4 and nuclear factor-kappaB. Immunology. 2014; 143:331–40. https://doi.org/10.1111/imm.12260.
81. Chami B, Barrie N, Cai X, Wang X, Paul M, Morton-Chandra R, Sharland A, Dennis JM, Freedman SB, Witting PK. Serum amyloid A receptor blockade and incorporation into high-density lipoprotein modulates its pro-inflammatory and pro-thrombotic activities on vascular endothelial cells. Int J Mol Sci. 2015; 16:11101–24. https://doi.org/10.3390/ijms160511101.
82. Yu N, Liu S, Yi X, Zhang S, Ding Y. Serum amyloid A induces interleukin-1beta secretion from keratinocytes via the NACHT, LRR and PYD domains-containing protein 3 inflammasome. Clin Exp Immunol. 2015; 179:344–53. https://doi.org/10.1111/cei.12458.
83. Connolly M, Rooney PR, McGarry T, Maratha AX, McCormick J, Miggin SM, Veale DJ, Fearon U. Acute serum amyloid A is an endogenous TLR2 ligand that mediates inflammatory and angiogenic mechanisms. Ann Rheum Dis. 2016; 75:1392–8. https://doi.org/10.1136/annrheumdis-2015-207655.
84. Seidl SE, Pessolano LG Jr, Bishop CA, Best M, Rich CB, Stone PJ, Schreiber BM. Toll-like receptor 2 activation and serum amyloid A regulate smooth muscle cell extracellular matrix. PLoS One. 2017; 12:e0171711. https://doi.org/10.1371/journal.pone.0171711.
85. Morizane S, Kajita A, Mizuno K, Takiguchi T, Iwatsuki K. Toll-like receptor signalling induces the expression of serum amyloid A in epidermal keratinocytes and dermal fibroblasts. Clin Exp Dermatol. 2019; 44:40–46. https://doi.org/10.1111/ced.13604.
86. Perez-Llamas C, Lopez-Bigas N. Gitools: analysis and visualisation of genomic data using interactive heat-maps. PLoS One. 2011; 6:e19541. https://doi.org/10.1371/journal.pone.0019541.
87. Gyorffy B, Lanczky A, Eklund AC, Denkert C, Budczies J, Li Q, Szallasi Z. An online survival analysis tool to rapidly assess the effect of 22,277 genes on breast cancer prognosis using microarray data of 1,809 patients. Breast Cancer Res Treat. 2010; 123:725–31. https://doi.org/10.1007/s10549-009-0674-9.