
INTRODUCTION
Epidemiological studies have reported that prostate cancer (PCa) remains the most commonly diagnosed, non-cutaneous cancer in males [1] and is the second leading cause of death after lung cancer in western populations of men. The first line of treatment for PCa is androgen deprivation therapy (ADT); however, with the advancement of the disease, almost all patients eventually progress towards castration resistant prostate cancer (CRPC) [2]. It is noteworthy, that in the majority of cases, disease progression to CRPC relies on a functional androgen receptor (AR) signaling cascade [3].
Over a decade of research demonstrates the positive influence of biguanide drugs on the prevention and treatment of a wide range of cancer types, including PCa. Metformin (1,1-dimethylbiguanide hydrochloride) is the most commonly used insulin sensitizer that belongs to the biguanide oral hypoglycemic family [4, 5]. Clinical records mark metformin as a safe drug with limited toxicity, wherein 90% of metformin is eliminated through the renal system. A cohort study of 8,000 type 2 diabetes patients demonstrated that individuals not taking metformin showed 4.3% higher diagnosed cancer cases compared to metformin users [6]. Based on a population study, Margel et al. demonstrated an association between metformin usage and improvement in survival among older men with diabetes and PCa [7]. One of the measurable effects of metformin involves the activation of the tumor suppressor gene liver kinase B1 (LKB1), a known regulator of AMP-activated protein kinase (AMPK) [8]. The activation of LKB1 and AMPK ultimately lead to the inhibition of the mammalian target of rapamycin (mTOR) pathway [9] that mediates anti-tumor activity of metformin. Recent reports have established c-MYC, enhancer of zeste homolg 2 (EZH2) and androgen receptor (AR) as targets of metformin [10–12].
Androgen receptor (AR) is critical to the molecular etiology of prostate cancer progression [13]. AR belongs to the nuclear receptor family that when inactive are sequestered in the cytoplasm. Upon androgen stimulation, AR undergoes conformational changes leading to its homodimerization, translocation to the nucleus, and binding to DNA androgen response elements (ARE), thereby regulating downstream gene expression [14]. Additionally, activated ARs recruit co-activator proteins such as SNF2-related CBP activator protein (SCRAP), a chromatin remodeling complex that is responsible for incorporation of H2A.Z-H2B heterodimers into chromatin [15, 16].
H2A.Z is a histone variant found in association with gene regulatory regions including promoters and enhancers [17, 18], and regulates cell proliferation [19]. Our group previously reported the identification of two H2A.Z isoforms: H2A.Z.1 and H2A.Z.2 [20] and described the association of H2A.Z.1 with androgen receptor dependent prostate cancer progression [21]. MYC is a transcription factor involved in cell cycle regulation which is dysregulated in many cancers [20] and the H2A.Z.1 gene promoter contains several MYC transcription factor binding sites [22] implicating c-MYC binding as a possible mechanism to facilitate increased cell levels of H2A.Z.1 deposition.
EZH2 is a master epigenetic transcriptional regulator of many cancers [23] including PCa [24, 25] and is an integral component of the Polycomb Repressive Complex 2 (PRC-2). As with histone H2A.Z [26], EZH2 gene expression is stimulated by MYC [22]. EZH2 catalyzes the addition of methyl groups to histone H3 at lysine 27, a histone PTM usually associated with chromatin condensation [27] and gene repression. At advanced stages of prostate cancer progression, EZH2 can acquire an oncogenic function which is independent of its polycomb-associated transcriptional repressor activity [23] as in CRPC cells [25]. In such instances, EZH2 works instead as a co-activator in conjunction with transcription factors such as AR [25].
The involvement of H2AZ and EZH2 in prostate cancer and the reported down regulation of AR gene [11] by metformin prompted us to further analyze the role of this drug in these two important epigenetic components. We demonstrate that androgen dependent prostate cancer lymph node carcinoma of the prostate (LNCaP) cells show an increase in H2A.Z both at the protein and transcript levels upon treatment with metformin. In addition, ChIP-qPCR showed an increased occupancy of H2A.Z at several regions of the AR and prostate specific antigen (PSA) genes. This enhanced interaction of H2A.Z with AR resulted in a dysregulation of its expression and of AR cellular levels, which were lowered, as confirmed by H2A.Z knockdown experiments (Figure 5). These results reveal a novel role of metformin at the epigenetic level and open up important questions as to the detailed molecular mechanisms involved. This information will provide an essential foundation to establish and understand the mechanisms of how metformin potentiates the effects of specific gene targets, which can then be used to explore its potential use for an effective approach in diagnosis and treatment of prostate cancer.
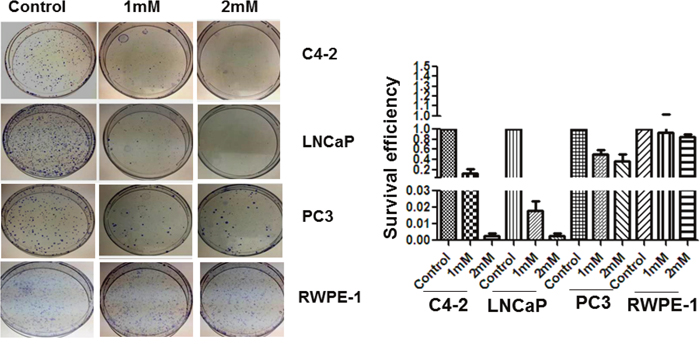
Figure 1: Colony formation assay. Colony formation of C4-2, LNCaP, PC3 and RWPE-1 cells after 1mM and 2mM of metformin treatment. Cells were seeded into 100 mm plates at 500-2000 cells per plate and were then treated with different doses of metformin for 24 hr. Cell survival was determined by colony formation assay. The data is a representation of three independent experiments that were quantified using image J software.
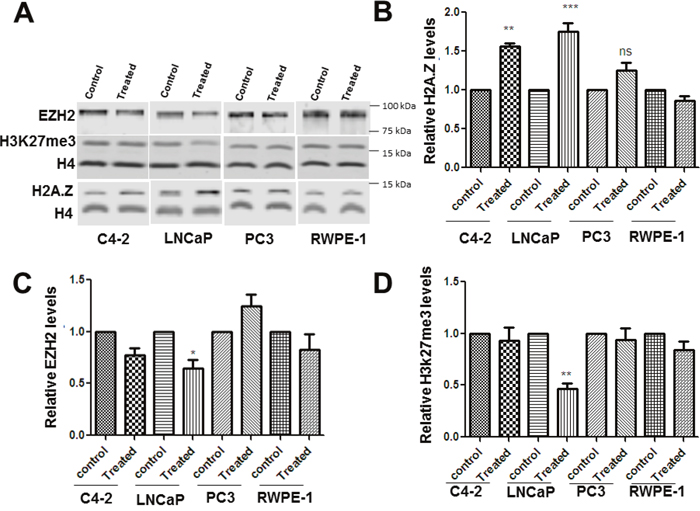
Figure 2: Metformin exposure alters the levels of H2A.Z, EZH2 and H3K27me3 levels in PCa cells. Four prostate cell lines (C4-2, LNCap, Pc-3 and RWPE-1) were treated with 2 mM metformin for 24hrs. (A) Representative western blot analyses for H2A.Z, EZH2, H4 and H3K27me3 obtained from cell protein lysates of metformin treated and untreated (control) cells. (B, C and D) Bar-plot representation of the western blot data obtained from four independent experiments normalized using H4. Student’s t- tests were used to calculate significance; P value, * P < 0.05, **P < 0.01, ***P < 0.001.
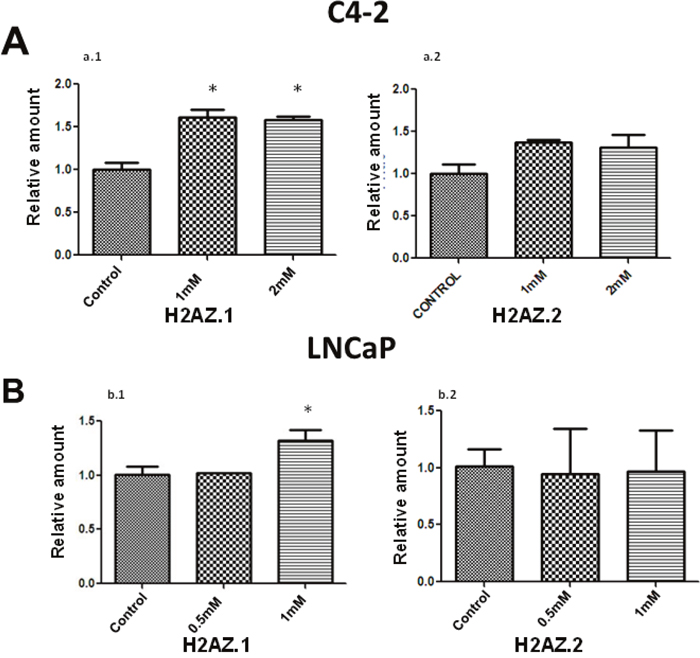
Figure 3: Metformin treatment preferentially increases the expression of H2AZ. 1.RT-PCR analyses of the expression of H2A.Z.1 and H2A.Z.2 upon metformin treatment of C4-2 (A) and LNCaP (B) PCa cells. The data was obtained from three independent experiments. GAPDH was used as a normalizer for these analyses. Student’s t- test was used for statistical analysis and to calculate the significance; * P < 0.05.
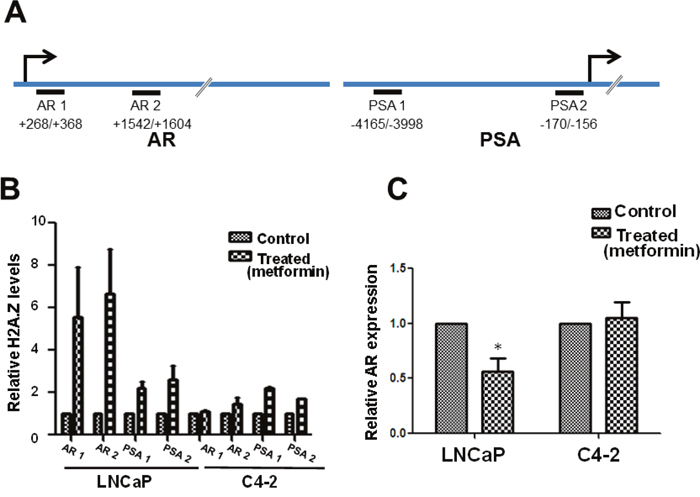
Figure 4: Metformin treatment alters H2A.Z gene occupancy and AR expression. (A) Schematic representation of the AR and PSA genes indicating the regions used for the reparation of the primers used in the analyses. (B) H2A.Z occupancy at different regions (AR 1, AR 2, PSA 1 and PSA 2) of the AR and PSA genes in LNCaP and C4-2 cells as determined by ChIP-RT-PCR analyses. Histone H3 contents was used as a normalizer for occupancy. (C) Graphical representation of the levels of androgen receptor expression determined by q-RT-PCR analyses of metformin treated and untreated (control) C4-2 and LNCaP cells using GAPDH as a normalizer. The data is a representation of three independent experiments. Student’s t- tests were used to calculate significance; P value, * P < 0.05, **P < 0.01, ***P < 0.001.
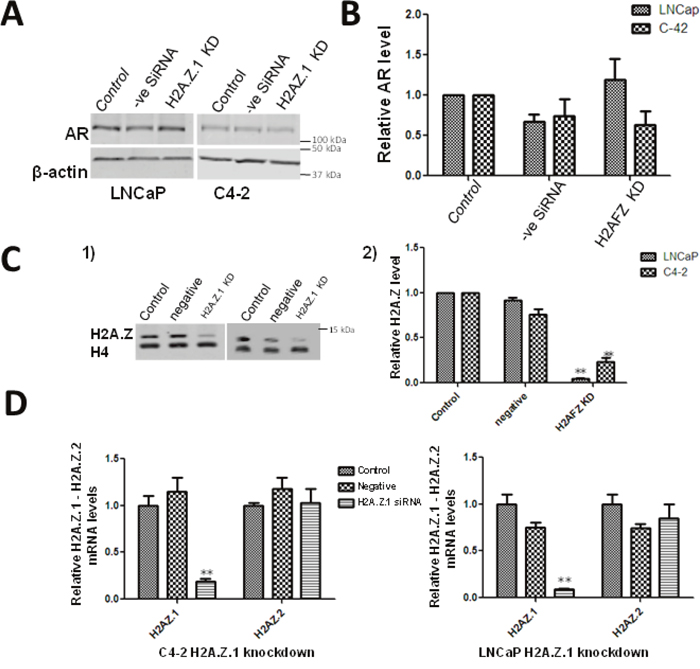
Figure 5: Effect of H2A.Z.1 (H2AFZ) knock down on the levels of AR. (A) Western blot analyses of siRNA-mediated knockdown of H2A.Z.1 (H2AFZ) in LNCaP and C4-2 cells. The change in levels of AR and H2A.Z were normalized using β-actin. (B) The data from 3 independent experiments is graphically represented using GraphPad Prism version 5 software. Student’s t- tests were used to calculate significance; P value, * P < 0.05, **P < 0.01, ***P < 0.001. Starting cells: (control), cells transfected with a scrambled non-targeted siRNA: (negative siRNA) and H2A.Z.1 siRNA (H2A.Z.1 KD). (C) Western blot analysisof protein lysates obtained from starting LNCaP/C4-2 (control), cells transfected with a scrambled siRNA (negative) and cells transfected with H2A.Z.1 siRNA. (C-1) Image of a representative blot. (C-2) Quantitative analysis using histone H4 as a normalizer. The figure shows the average of three independent experiments. Student’s t- tests were used to calculate significance; P value, * P < 0.05, **P < 0.01, ***P < 0.001. (D) qRT-PCR analysis of H2A.Z.1 knock down efficiency and specificity in C4-2 and LNCaP cells.
RESULTS
Effects of metformin on cell clonogenicity
Colony formation assays were performed in plates of LNCaP (AR positive, androgen dependent), RWPE-1 (non-cancerous), PC-3 (AR negative) and C4-2 (AR positive, androgen independent) in response to metformin treatment (1 mM and 2 mM). Clonogenic assays revealed that RWPE-1 and PC-3 retained a high level of clonogenicity after 1 mM and 2 mM metformin treatment, whereas LNCaP and C4-2 cells had greatly reduced clonogenicity under the same conditions (Figure 1). When seeded at 2,000 cells/plate and treated with 1mM metformin, the survival efficiency of LNCaP cells was 10-fold less than C4-2 and PC-3; however, at the higher dose of 2 mM, LNCaP and C4-2 cells showed significant decrease of 80-90-fold in their survival efficiency compared to the untreated controls (Figure 1). Moreover, the effect of metformin treatment was minimal on RWPE-1 and PC-3 prostate cancer cells indicating that lack of AR protein in normal and negative AR cells negates the effects of metformin on cell death. These results indicate that the metformin-mediated inhibitory effect on clonogenicity is high in LNCaP and C4-2 with LNCaP cells being the most sensitive at 1 mM concentration when compared to the three other three cell lines.
Metformin alters the levels of H2A.Z, EZH2 and H3K27me3
The effect of metformin treatment on the levels of H2A.Z, EZH2 and H3K27me3 in prostate cancer cells (LNCaP, C4-2, and PC-3) and in normal (RWPE-1) cells was examined by western blotting. The data (Figure 2A-2B) shows a significant increase in the levels of H2A.Z upon metformin treatment in LNCaP and C4-2 cell lines. In PC-3 and RWPE-1 cells there was not much change observed in the levels of H2A.Z. By contrast, EZH2 and H3K27me3 levels (Figure 2C and Figure 2D) were decreased upon metformin treatment in LNCaP cells with no significant changes observed in the other three cell types. Based on these results, we suggest that the metformin-induced alteration in levels of these three proteins preferentially affects the AR-positive, androgen dependent LNCaP cells.
Metformin treatment leads to a differential expression of H2A.Z isoforms
The H2A.Z variant has two isoforms; H2A.Z.1 and H2A.Z.2 [20, 31] and remarkably, both have their own functional importance [32, 33]. The increase observed in H2A.Z levels upon treatment with metformin in LNCaP and C4-2 cells prompted us to determine whether the expression of both isoforms was altered. RT-PCR performed on control and metformin-treated LNCaP and C4-2 cells (Figure 3A and 3B) shows an increase in the expression of H2A.Z.1 upon metformin treatment. However, no significant alteration was observed in the levels of H2A.Z.2 transcripts. The data strongly indicates that the alteration of H2A.Z.1 isoform expression is responsible for the overall increase in the level of H2A.Z which is observed in these two cell lines as a result of metformin treatment.
Metformin affects H2A.Z gene occupancy
The increase of H2A.Z observed in LNCaP (androgen dependent) and C4-2 (androgen independent) PCa cells led us to investigate the effect(s) of metformin on the total H2A.Z gene occupancy in these cell types. The AR-responsive AR (androgen receptor) and PSA genes were chosen because of their direct and indirect involvement in PCa progression respectively. AR regulates transcription of these genes by binding to their androgen response elements (AREs), as is exemplified by PSA [34, 35]. Moreover, information is already available for the H2A.Z occupancy of PSA in the absence of metformin treatment [21]. Select regions within these two genes were chosen for ChIP-qPCR analysis (Figure 4A). The AR gene is 90 kb long and encodes a 110 kDa AR protein that has three major functional domains: The N-terminal domain, DNA-binding domain, and androgen-binding domain. It contains six exons of which exon-1 codes for the entire N-terminal domain that encompasses the activation functiona1 element which is crucial for transcriptional activation [36] and for the regulation of androgen dependent prostate cancer development [37]. Hence, we chose to analyze H2A.Z localization on different regions (AR1: +268/+236, AR2: +1542/+1604) of exon-1 in this gene. For the PSA gene the already established H2A.Z-containing nucleosome regions at an ARE within the enhancer (PSA1: -4165/-3998) and within the proximal promoter (PSA 2: -170/-156), corresponding respectively to PSA B and PSA D regions previously identified [21] were used (see Figure 4A and Table 1 for the primers utilized).
Table 1:
Gene name |
Primer sequence |
|---|---|
Primers for reverse transcriptase PCR |
|
H2AZ.1 |
F: TCCGGAAAGGCCAAGACAA |
H2AZ.2 |
F: CCGCATCCACAGACACTTGA |
GAPDH |
F: AAGGTCATCCCTGAGCTGAACGGG |
PP1 |
F:GGTGACTTCACACGCCATAA |
AR |
F: AGCAGGGTGAGGATGGTTCT |
Primers for ChIP qPCR |
|
PSA 1 |
F: ACTGGGACAACTTGCAAACC |
PSA 2 |
F: CTGCCTTTGTCCCCTAGATG |
AR 1 |
F: AGCAGGGTGAGGATGGTTCT |
AR 2 |
F: CCCAGTCCCACTTGTGTCAA |
The ChIP-qPCR data (Figure 4B) show that in metformin-treated LNCaP cells, H2A.Z occupancy increased 4-5 fold upon metformin treatment compared to a slight increase in C4-2 cells on the two selected AR regions. A similar enrichment of H2A.Z was observed, albeit to a much lower extent, at the PSA (PSA1 and PSA2) regions of both LNCaP and C4-2 cell lines. Based on this, we suggest that there is significant enrichment of H2A.Z at different regions of androgen regulated genes after metformin treatment, which is more prevalent in androgen dependent LNCaP cells.
The effect of metformin on AR expression under the conditions used for the ChIP-qPCR approach was analyzed next and the data showed a decrease in its expression (Figure 4C). These results are in agreement with an earlier report [11].
H2AZ.1 knockdown affects AR expression
Our results show a significant impact of metformin treatment on the deposition of H2A.Z at the AR gene. This treatment also results in an overall increase in H2A.Z (Figure 2B) which is due to H2A.Z.1 isoform (Figure 3). Therefore, we analyze if these changes could affect the AR expression by performing H2A.Z.1 knockdown. The efficiency of the knockdown was confirmed both at the protein and RNA levels (Figure 5). The western blot data of the H2AZ.1 knockdown carried out in LNCaP cells shows an increase in the levels of AR in these cells when compared to the untransfected cell control or to a vehicle control of cells transfected with a non-specific siRNA (Figure 5). No significant change was observed in AR expression when the same approach was carried out in C4-2 cells. This led us to suggest that the decrease in H2A.Z.1 levels occurs concomitantly with increased expression of the AR gene in metformin-treated androgen dependent LNCaP cells.
Inhibition of EZH2 modulates the metformin-mediated H2A.Z increase
Since both H2A.Z and EZH2 are chromatin-associated transcriptional regulators whose expression is affected by metformin (Figure 2), we tested if there was a functional link between the two. We performed an assay using GSK126, a well-known inhibitor of EZH2. LNCaP cells were treated with GSK126 and levels of H2A.Z and H3K27me3 were monitored using western blots (Figure 6A-1). The efficiency of the inhibition was confirmed by the decrease in H3K27me3 on both GSK126 treated cell lines.
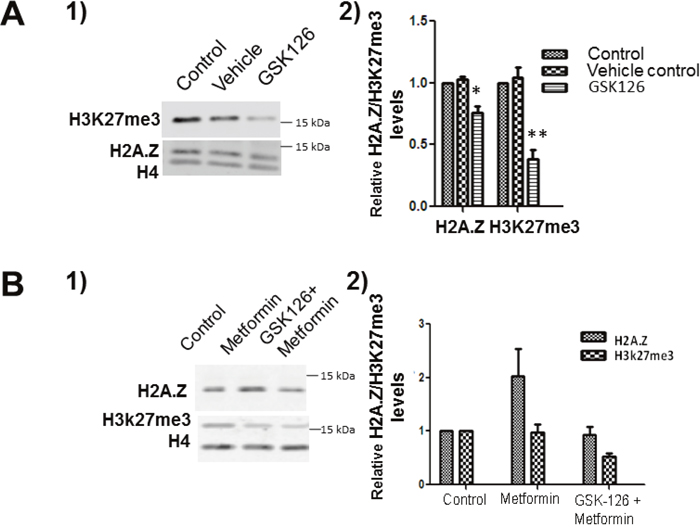
Figure 6: EZH2 inhibition decreases the levels of H2A.Z. (A) Western blot analyses of control, vehicle and GSK126 treated LNCaP cells immunoblotted using EZH2, H3K27me3 and H2A.Z antibodies. (A-1) Representative image. (A-2) Graphical representation of the western blot data shown in (A-1). The data is a representation of three independent experiments normalized using H4. (B) LNCaP cells were exposed to GSK126 and subsequently treated with metformin. Protein lysates obtained from control, metformin and a combination of GSK126 and metformin treated cells were analysed by western blot using H3K27me3 and H2A.Z antibodies. (B-1) Representative western blot image. (B-2) Graphical representation of the western blot data from 3 independent experiments. Student’s t- tests were used to calculate significance; P value, * P < 0.05, **P < 0.01, ***P < 0.001. H4 was used as a normalizer. Control: Starting LNCaP/C4-2 cells; Vehicle: DMSO; GSK 126: GSK 126 treated cells.
To further investigate the influence of EZH2 inhibition on metformin, western blot analysis was carried out on protein extracts isolated from LNCaP cells following 24 hour GSK126 treatment, and subsequent 24 hour metformin treatment. As seen in Figure (6B-1)-(6B-2) EZH2 inhibition resulted in a loss of H2A.Z induction in the presence of metformin, when compared to untreated control and in response to metformin alone. This data is surprising and we suggest an involvement of EZH2 in the regulation of H2A.Z levels in androgen dependent PCa cells. However, this represents very preliminary data and further studies will be needed in order to validate of the association of these two proteins.
DISCUSSION
Metformin decreases the viability of LNCaP and C4-2 PCa cell lines
In agreement with previous reports [12, 29, 38–43], treatment of AR positive cell lines LNCaP and C4-2 with metformin restricted their growth. We found the androgen dependent LNCap cells to be more sensitive than the androgen independent C4-2 cells in the 1-2 mM range of concentration (Figure 1). The more aggressive AR negative PC3 cell type exhibited only a slight decrease in clonogenicity, whereas in RWPE-1 cells metformin treatment had minimal effect. Hence, the metformin inhibitory effect observed with these cell lines, which presumably involves the stimulation of cell cycle arrest and apoptosis, is specific to cancerous cells with a functional AR signaling axis [12].
Metformin alters the levels of histone variant H2A.Z.1 in prostate cancer cells
Metformin has been reported to have a regulatory role in controlling the progression of PCa from androgen dependence to androgen independence by targeting the AR [11], however, the intricate molecular details behind this observation remain to be determined. Metformin has been reported to activate the AMPK (AMP-activated protein kinase) pathway and modulate glucose and fat synthesis that are essential for tumor growth [44, 45]. Nevertheless, how this trickles down to chromatin to regulate gene expression is not well understood. We took advantage of the previous knowledge generated by our group which indicated that alterations in the levels of H2A.Z participate in PCa progression [21, 26], to analyze whether the levels of this histone variant could also be affected by metformin. Histone variant H2A.Z is an important chromatin transcriptional regulator which can epigenetically affect gene expression [46]. Upon exposure of AR positive PCa cells (LNCaP and C4-2) to metformin, we observed an increase in H2A.Z both at protein and RNA levels (Figures 2-3). Importantly, such increase can be attributed to the H2A.Z.1 isoform of H2A.Z (Figure 3 and Figure 5) which has been shown to be particularly involved in PCa [21].
The effect of metformin on the levels of H2A.Z within the context of PCa is not surprising as histone variants have been shown to play a very important role in the progression of many types of cancer. For instance, the levels of macroH2A.1.1 and macroH2A.2 can be used as predictors for the risk of lung cancer recurrence [47] and increased expression of macroH2A1.1 correlates with poor prognosis of triple negative breast cancer. Also, histone H3.3 promotes lung cancer cell migration [48]. Histone H2A.Z and its isoforms H2AZ.1 and H2AZ.2 alterations have been shown to be involved in melanoma [49], breast [50] and prostate cancers [21]. However, what remains to be elucidated is how metformin can alter the levels of H2A.Z and how this can impacts PCa biology.
A potential molecular mechanism for the metformin-mediated increase in H2A.Z
Sirtuin 1 (Sirt1) is an NAD+ dependent histone deacetylase which has been shown to play a very important role in the initiation and progression of many cancers [51] including PCa [52, 53]. This is mediated through the critical role it plays in oxidative stress and cellular redox balance and metformin has been shown to down-regulate the Sirt1/Pgc-1α/Nrf2 (sirtuin 1/peroxisome proliferator-activated receptor γ co-activator 1α/nuclear erythroid related factor 2) pathway. This in turn leads to the increased susceptibility of p53 positive cancer cells (such as LNCaP and C4-2) to oxidative stress and therapeutic agents [54]. Interestingly, SIRT1 and H2A.Z deregulation in PCa have been shown to be reciprocally related [55]. Hence, the overall increase in H2A.Z observed by us upon metformin treatment of LNCaP and C4-2 would be in agreement (Figure 7A) and could provide an explanation for our observations (Figure 7A).
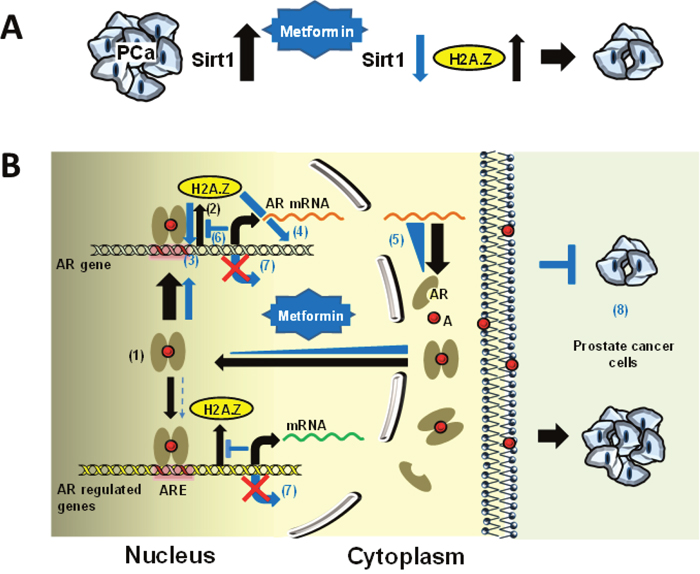
Figure 7: Schematic representation of the potential molecular mechanism behind metformin mediated increase in H2A.Z and dynamics in PCa. (A) SIRT1 is overexpressed in PCa [52] (black thick arrow). Metformin treatment down-regulates the Sirt1/Pgc-1α/Nrf2 [54] and hence the levels of SIRT1 (blue arrow) which results in an increase in H2A.Z (black arrow)[55] and a restriction in tumor growth. (B) Androgen receptor (AR) is overexpressed in prostate cancer cells and up-regulates the expression of AR-dependent genes (1). During the process histone variant H2A.Z is released from promoters and enhancer regions (2) [21]. Upon metformin treatment, the occupancy of H2A.Z observed at the promoter regions and in different regions of these genes increases (3-4) and results in a reduction of their expression (5). The increase in H2A.Z particularly observed at promoter regions (3) is surprising and we suggest that this is the result of an antagonistic mechanism with androgen (6) which represses the expression of these genes (7). Hence, H2A.Z plays an important role in restricting tumor growth (8). The black arrows indicate the pathway involved in AR response and the blue arrows and triangles denote the alterations resulting from metformin treatment. Abbreviations: A, androgen; ARE, androgen responsive element.
Regardless of the cause responsible for the metformin-mediated H2A.Z increase observed in LNCaP and C4-2 cells, an important remaining question has to do with the potential molecular mechanism(s) by which such increase mediates the observed metformin effects on LNCaP and C4-2 cell growth suppression (Figure 1 and Figure 7A).
Metformin alters the H2A.Z nucleosome occupancy and expression of AR regulated genes
Histone variants affect the dynamics with which histones interact with gene regulatory regions (promoters, enhancers) and alter gene expression [21, 49, 56]. For instance the position occupied by H2A.Z at the +1 or -2 nucleosome flanking the transcription starting site (TSS) of gene promoters can respectively correlate with their repressive or activating nature [57]. Hence, alterations in the genome occupancy of histone variants can affect the functionality of the targeted chromatin domains. Therefore, the overall increase observed in the levels of H2A.Z in LNCaP and C4-2 cells upon metformin treatment may have important functional implications in terms of gene occupancy and dynamics as will be described next.
We questioned whether the metformin-mediated increase in the levels of H2A.Z also resulted in the larger presence of this histone variant in the nucleosomes of the AR targeted genes. To address this, ChIP-qPCR was performed and occupancy of H2A.Z at androgen receptor and PSA gene promoters, two key players in PCa progression, were analyzed (Figure 4B). It had previously been shown that, in the case of the PSA gene, histone H2A.Z is present at the enhancer and promoter regions of the gene where the AREs are located. Moreover, it has now been shown that the levels of H2A.Z decrease dramatically upon androgen induction [21] (Figure 7B: (2)). Coupling between loss of H2A.Z at gene regulatory sites and transcriptional activation has been well documented [58, 59]. Hence, it is possible that the increase in H2A.Z occupancy observed in different regions of the AR responsive genes, including AR itself (Figure 7B: (3)-(4)), results in the reduction of their expression as a consequence of their repressed chromatin architecture (Figure 7B: (5)-(7)). In this regard the lack of expression observed in the case of the AR gene in LNCaP cells would not be that surprising (Figure 4C).
In addition to all this, the metformin-mediated increase in H2A.Z could also be accounted for by the well-known effect of metformin in the induction of the DNA damage repair (DDR) pathway [60]; a process in which H2A.Z has also been shown to be involved [61].
Further epigenetic complexity of metformin treatment
Figures 2C-2D show that in addition to increasing the levels of H2A.Z (Figure 2B), metformin also decreases the levels of EZH2 and consequently decreases H3K27me3 particularly in LNCaP cells. Hence, as will be briefly discussed next, the epigenetic changes imparted by metformin are more complex and dynamic in regulating the chromatin landscape than originally anticipated. While the increase in the levels of H2A.Z appears to have a repressive activity on AR responsive genes as described above, the decrease observed in both EZH2 and H3K27me3 in LNCaP cells upon metformin treatment would indicate an opposite effect, which is most likely affecting a different set of genes. In fact, EZH2 may operate through a completely different mechanism(s) and the effect of metformin on this enzymatic transcriptional regulator may involve the conventional metabolic AMPK pathway [62]. In support of this, it has been shown that EZH2 phosphorylation by AMPK acts as a suppressor of polycomb repressive methyltransferase activity and oncogenic function [63].
Our preliminary experiments (Figure 6) using GSK126, a well-known inhibitor of EZH2 methyltransferase activity [64], hint at the possibility that the effects of metformin observed on LNCaP cells might involve the synergistic action of the transcriptional enzymatic (EZH2) and structural (H2A.Z) regulators.
Concluding remarks
As mentioned earlier, the relevance of histone variant H2A.Z to PCa has been quite extensively studied [21, 56, 58, 59, 65, 66]. The work described in this paper is the first report establishing role of a histone variant mediating the effects of metformin in PCa. The androgen responsive AR positive LNCaP cells appear to be predominantly targeted. This hints at a prevalent impact of the drug in the early stages of PCa progression before becoming androgen non-responsive on par with its more modest clinical relevance with metastatic castration-resistant activity [67]. In this regard it would be of interest in the future to analyze the combined effects of this drug with other drugs such as enzalutamide [68].
MATERIALS AND METHODS
Cell culture and reagents
The human prostate cancer cells: PC3, LNCaP, RWPE-1 and C4-2 cells were kindly provided by Dr. Rennie’s lab at the Vancouver Prostate Centre. LNCaP and C4-2 cells were maintained in Roswell Park Memorial Institute (RPMI) 1640 medium (Gibco), PC3 cells were maintained in Dulbecco’s modified essential medium (DMEM) (Gibco) supplemented with 10% Bovine Growth Serum (BGS) (VWR), 1% penicillin/streptomycin (Sigma-Aldrich) and 1X Gibco GlutaMAX (ThermoFisher Scientific). RWPE-1 cells were maintained in Keratinocyte Serum Free Medium (K-SFM) supplemented with bovine pituitary extract (BPE) and human recombinant epidermal growth factor (EGF) (Gibco) with 10% BGS and 1% penicillin/streptomycin. Cells were cultured at 37°C in a humidified atmosphere of 5% CO2.
Metformin (Sigma-Aldrich) was dissolved in sterile water at a 100 mM concentration stock. Based on the cell type sensitivity in colony formation assay, LNCaP cells were treated at a concentration of 0.5 mM and 1 mM, and C4-2 cells were treated at a concentration of 1 mM and 2 mM for 24 hrs. Cells were treated at the aforementioned concentrations [28, 29] based on the cell type sensitivities to each dosage for 24 hrs. GSK 126 (Cayman chemicals) was dissolved in DMSO at a 1 mM concentration stock. The cells were treated with a drug concentration of 2 μM or vehicle control (DMSO) for 48 hrs. The similar concentrations of metformin and GSK126 were used in combination as well as for studying the effect of EZH2 inhibition on H2A.Z levels post metformin treatment.
Colony formation assay
The confluent cells were trypsinized and plated at densities ranging from 500 to 2000 cells per 10 cm petri dish, based on the doubling time of each cell line [30]. Cells were allowed to adhere and undergo one cycle of cell division before metformin treatment (1-2 mM) was done for 24 hrs. The cell culture media was changed every 3-4 days. Colonies developed after 10-15 days, then were fixed by acetic acid: methanol solution (1:7) for 5 minutes at room temperature. For visualization, the colonies were stained with 0.5% crystal violet for 2 hours at room temperature, rinsed, air-dried and quantified using ImageJ software. Each experimental replicate was internally controlled using untreated cells. The relative plating efficiencies were expressed as percentages relative to the plating efficiency of untreated cells.
Immunoblotting
Protein lysates were prepared by mixing a volume of cell suspension with an equal volume of 2X Laemmli buffer (2% SDS, 10% glycerol, 0.002% bromophenol blue and 62.5mMTris-HCl pH 6.8). Protein content was then determined by the Lowry method (Bio-Rad Hercules). Immediately after, 3% β-mercaptoethanol was added; three to six μg of protein lysate was separated by sodium dodecyl sulfate polyacrylamide gel electrophoresis (SDS-PAGE), and transferred onto nitrocellulose membranes (GE Healthcare). Nonspecific binding was blocked by incubation in 5% skim milk in phosphate buffered-saline pH 7.2 with 0.1% Tween 20. Membranes were incubated with specific antibodies, either overnight at 4°C or for 1 hour at room temperature. The membranes were probed with different primary antibodies: H2A.Z 1:2,000 (Abcam, cat#ab4174), EZH2 1:2000 (Cell signaling cat#D2c9), H3K27me3 1:3,000 (Milliporecat#07-449), AR 1:500 (Santacruz,cat#Sc-7305), β-actin 1:20,000 (A2228, Sigma) and H4 1:20,000 (rabbit serum produced in-house), followed by incubation with a secondary antibody conjugated to fluorescent dye, IRDye 800 Anti-rabbit IgG 1:10,000 (Rockland Antibodies, cat#611-132-122). Immunoblots were visualized using Li-Cor Odyssey (LI-COR Biosciences). Images were analyzed using Li-Cor Image Studio version 5.2 software.
Real time polymerase chain reaction (RT-PCR) analysis
Total RNA was extracted from metformin treated and untreated cell lines using Trizol (Invitrogen) following the manufacturer’s protocol. To study the expression of H2A.Z.1 and H2A.Z.2, 2 μg RNA was reverse-transcribed using High-Capacity cDNA Reverse Transcription Kit (Applied Biosystems). The cDNA was diluted 20-fold for analysis with the specific primer sets (Table 1). The transcript levels were analyzed by SYBR Green incorporation using a Stratagene MX3005P QPCR system and MXPro software. Each 10 μL PCR reaction mixture consisted of 2 μL of diluted cDNA, 2.5 pmol of each primer and 5 μL of Platinum SYBR Green qPCR SuperMix (Invitrogen). Thermocycling conditions for all primer sets were: 9 min 95° C followed by 40 cycles of 15 s 95°C, 30 s 60°C and 45 s 72°C. Relative mRNA levels were calculated using the comparative Ct method (ΔΔCt), considering PCR efficiency. Fold change is equal to 10 ΔΔCt/m, where m is the average slope of the calibration curves for the gene of interest and the endogenous control (GAPDH and PP1). The expression of H2A.Z.1 and H2A.Z.2 transcripts for each sample is represented as fold change relative to this standard.
Chromatin immunoprecipitation assay (ChIP)
Samples for ChIP were prepared by fixing the cells with 1% formaldehyde for 5 minutes at room temperature; excess formaldehyde was quenched with 125 mM glycine. Cells were washed twice with iced cold Phosphate Buffer Saline (PBS) (pH 7.4). Following washes, cells were pelleted at 600 X g for 5 min at 4°C and cell pellet was resuspended in cell lysis buffer [10 mM HEPES-KOH (pH 7.9), 1.5 mM MgCl2, 10 mM KCl, 0.5 mM DDT, 0.1% NP-40 and complete protease inhibitor (Roche Molecular Biochemicals) was added at each step at dilution of 1:100)] and incubated on ice for 20 minutes. The nuclei pellet obtained post centrifugation was resuspended in 6 volumes of 1X radioimmunoprecipitation assay (RIPA) buffer [50mM Tris-HCl (pH 8.0), 150 mM NaCl, 0.1% SDS, 0.5% sodium deoxycholate, 1% Triton X-100, and protease inhibitors]. The resulting nuclei were sonicated to shear the DNA to fragment lengths of 200 to 500 base pairs using bath sonication (Diagenode bioruptor) for 20 minutes with 15 seconds on/off cycles. 5 % of the diluted lysate was reserved as the input and the remainder was pre-cleared with 25 μL of protein G Beads (Dynabeads, Invitrogen Life Technologies). Chromatin was immunoprecipitated (IP) overnight at 4°C with pre-cleared chromatin samples in 1X RIPA buffer containing 0.01% SDS concentration against 3 μg IgG (CST), 3 μg H2A.Z antibody, 2 μg EZH2 and 1μg H3 antibodies, respectively. 25 μL of magnetic beads were added to each IP sample and incubated 4 hours for bead binding at 4°C. Bead: antibody complexes were captured by placing the tubes on a horizontal bar magnet followed by washing of beads twice with low salt buffer [Tris-HCl 50 mM (pH 8.0), NaCl 150 mM, SDS 0.1%, NP-40 1%, EDTA 1 mM, Sodium deoxycholate 0.5%], high salt buffer [Tris-HCl 50 mM (pH 8.0), NaCl 500 mM, SDS 0.1%, NP-40 1%, EDTA 1mM, Sodium deoxycholate 0.5%], LiCl buffer [Tris-HCl 50 mM (pH 8.0), LiCl 250 mM, SDS 0.1%, NP-40 1%, EDTA 1 mM, Sodium deoxycholate 0.5%] and TE buffer [Tris-HCl 10 mM (pH 8.0), EDTA 0.25 mM]. The samples were reverse crosslinked in elution buffer (100 mM NaHCO3 and 1% SDS) at 65°C overnight and then incubated with Proteinase K (10 μg/ml final) for 1 hour at 42°C. The DNA was purified using a DNA purification kit (Qiagen) and subjected to qPCR using the primer sequences mentioned in Table 1. Enrichment of DNA fragments after ChIP were normalized to input DNA and to the values obtained with normal rabbit IgG. In addition, immunoprecipitation using H2A.Z was further normalized against H3.
si-RNA mediated knock down
LNCaP cells were transfected with predesigned small interfering RNA (siRNA) reagents against H2A.Z.1 (H2AFZ) and non-targeted (negative) siRNA (Sigma) according to the manufacturer’s protocol. Briefly, 1 × 10⁵ cells/well were plated in six-well plates and grown in RPMI 1640 media supplemented with 10% BGS, 1% penicillin/streptomycin and 1X Gibco GlutaMAX. Cells were transfected with the siRNA duplexes at a final concentration of 30 nM using Lipofectamine reagent (Invitrogen) according to the manufacturer's instructions. After transfection, cells were grown for 24 hours and then treated with the 1mM metformin for an additional 24 hours with no change in media. Cells were harvested and processed for RNA and protein extractions to verify knockdown efficiency.
Graphic representation and statistical analysis
Graphic (bar plot) representation of the western blot and RT-PCR analyses was carried out using GraphPad Prism version 5. Data is presented as mean +/- standard error. Student’s t-test was used to analyse the significance of difference. All tests were two sided and p < 0.05 was considered significant.
Author contributions
MT designed, performed, analyzed the experiments and drafted the manuscript. MSC provided experimental support. DD and CHE provided advice and conceptual support, and JA conceived and wrote the manuscript.
ACKNOWLEDGMENTS
We are very thankful to Melissa E. Freeman and Katrina V. Good for careful proofreading of the manuscript. This research was supported by a Prostate Cancer Canada (PCC) Discovery Grant D2014-9 to JA.
CONFLICTS OF INTEREST
All authors declare non-competing financial interests.
REFERENCES
1. Jemal A. Global burden of cancer: opportunities for prevention. Lancet. 2012; 380:1797–99. https://doi.org/10.1016/S0140-6736(12)61688-2.
2. Siegel RL, Miller KD, Jemal A. Cancer Statistics, 2017. CA Cancer J Clin. 2017; 67:7–30. https://doi.org/10.3322/caac.21387.
3. Chen CD, Welsbie DS, Tran C, Baek SH, Chen R, Vessella R, Rosenfeld MG, Sawyers CL. Molecular determinants of resistance to antiandrogen therapy. Nat Med. 2004; 10:33–39. https://doi.org/10.1038/nm972.
4. Ben Sahra I, Laurent K, Giuliano S, Larbret F, Ponzio G, Gounon P, Le Marchand-Brustel Y, Giorgetti-Peraldi S, Cormont M, Bertolotto C, Deckert M, Auberger P, Tanti JF, Bost F. Targeting cancer cell metabolism: the combination of metformin and 2-deoxyglucose induces p53-dependent apoptosis in prostate cancer cells. Cancer Res. 2010; 70:2465–75. https://doi.org/10.1158/0008-5472.CAN-09-2782.
5. Ben Sahra I, Tanti JF, Bost F. The combination of metformin and 2 deoxyglucose inhibits autophagy and induces AMPK-dependent apoptosis in prostate cancer cells. Autophagy. 2010; 6:670–71. https://doi.org/10.4161/auto.6.5.12434.
6. Libby G, Donnelly LA, Donnan PT, Alessi DR, Morris AD, Evans JM. New users of metformin are at low risk of incident cancer: a cohort study among people with type 2 diabetes. Diabetes Care. 2009; 32:1620–25. https://doi.org/10.2337/dc08-2175.
7. Margel D, Urbach DR, Lipscombe LL, Bell CM, Kulkarni G, Austin PC, Fleshner N. Metformin use and all-cause and prostate cancer-specific mortality among men with diabetes. J Clin Oncol. 2013; 31:3069–75. https://doi.org/10.1200/JCO.2012.46.7043.
8. Shaw RJ, Lamia KA, Vasquez D, Koo SH, Bardeesy N, Depinho RA, Montminy M, Cantley LC. The kinase LKB1 mediates glucose homeostasis in liver and therapeutic effects of metformin. Science. 2005; 310:1642–46. https://doi.org/10.1126/science.1120781.
9. Shaw RJ, Bardeesy N, Manning BD, Lopez L, Kosmatka M, DePinho RA, Cantley LC. The LKB1 tumor suppressor negatively regulates mTOR signaling. Cancer Cell. 2004; 6:91–99. https://doi.org/10.1016/j.ccr.2004.06.007.
10. Bao B, Wang Z, Ali S, Ahmad A, Azmi AS, Sarkar SH, Banerjee S, Kong D, Li Y, Thakur S, Sarkar FH. Metformin inhibits cell proliferation, migration and invasion by attenuating CSC function mediated by deregulating miRNAs in pancreatic cancer cells. Cancer Prev Res (Phila). 2012; 5:355–64. https://doi.org/10.1158/1940-6207.CAPR-11-0299.
11. Wang Y, Liu G, Tong D, Parmar H, Hasenmayer D, Yuan W, Zhang D, Jiang J. Metformin represses androgen-dependent and androgen-independent prostate cancers by targeting androgen receptor. Prostate. 2015; 75:1187–96. https://doi.org/10.1002/pros.23000.
12. Akinyeke T, Matsumura S, Wang X, Wu Y, Schalfer ED, Saxena A, Yan W, Logan SK, Li X. Metformin targets c-MYC oncogene to prevent prostate cancer. Carcinogenesis. 2013; 34:2823–32. https://doi.org/10.1093/carcin/bgt307.
13. Heinlein CA, Chang C. Androgen receptor (AR) coregulators: an overview. Endocr Rev. 2002; 23:175–200. https://doi.org/10.1210/edrv.23.2.0460.
14. Devlin HL, Mudryj M. Progression of prostate cancer: multiple pathways to androgen independence. Cancer Lett. 2009; 274:177–86. https://doi.org/10.1016/j.canlet.2008.06.007.
15. Mizuguchi G, Shen X, Landry J, Wu WH, Sen S, Wu C. ATP-driven exchange of histone H2AZ variant catalyzed by SWR1 chromatin remodeling complex. Science. 2004; 303:343–48. https://doi.org/10.1126/science.1090701.
16. Wong MM, Cox LK, Chrivia JC. The chromatin remodeling protein, SRCAP, is critical for deposition of the histone variant H2A.Z at promoters. J Biol Chem. 2007; 282:26132–39. https://doi.org/10.1074/jbc.M703418200.
17. Barski A, Cuddapah S, Cui K, Roh TY, Schones DE, Wang Z, Wei G, Chepelev I, Zhao K. High-resolution profiling of histone methylations in the human genome. Cell. 2007; 129:823–37. https://doi.org/10.1016/j.cell.2007.05.009.
18. Bruce K, Myers FA, Mantouvalou E, Lefevre P, Greaves I, Bonifer C, Tremethick DJ, Thorne AW, Crane-Robinson C. The replacement histone H2A.Z in a hyperacetylated form is a feature of active genes in the chicken. Nucleic Acids Res. 2005; 33:5633–39. https://doi.org/10.1093/nar/gki874.
19. Svotelis A, Gévry N, Gaudreau L. Regulation of gene expression and cellular proliferation by histone H2A.Z. Biochem Cell Biol. 2009; 87:179–88. https://doi.org/10.1139/O08-138.
20. Dryhurst D, Ishibashi T, Rose KL, Eirín-López JM, McDonald D, Silva-Moreno B, Veldhoen N, Helbing CC, Hendzel MJ, Shabanowitz J, Hunt DF, Ausió J. Characterization of the histone H2A.Z-1 and H2A.Z-2 isoforms in vertebrates. BMC Biol. 2009; 7:86. https://doi.org/10.1186/1741-7007-7-86.
21. Dryhurst D, McMullen B, Fazli L, Rennie PS, Ausió J. Histone H2A.Z prepares the prostate specific antigen (PSA) gene for androgen receptor-mediated transcription and is upregulated in a model of prostate cancer progression. Cancer Lett. 2012; 315:38–47. https://doi.org/10.1016/j.canlet.2011.10.003.
22. Koh CM, Iwata T, Zheng Q, Bethel C, Yegnasubramanian S, De Marzo AM. Myc enforces overexpression of EZH2 in early prostatic neoplasia via transcriptional and post-transcriptional mechanisms. Oncotarget. 2011; 2:669–83. https://doi.org/10.18632/oncotarget.327.
23. Kim KH, Roberts CW. Targeting EZH2 in cancer. Nat Med. 2016; 22:128–34. https://doi.org/10.1038/nm.4036.
24. Varambally S, Dhanasekaran SM, Zhou M, Barrette TR, Kumar-Sinha C, Sanda MG, Ghosh D, Pienta KJ, Sewalt RG, Otte AP, Rubin MA, Chinnaiyan AM. The polycomb group protein EZH2 is involved in progression of prostate cancer. Nature. 2002; 419:624–29. https://doi.org/10.1038/nature01075.
25. Xu K, Wu ZJ, Groner AC, He HH, Cai C, Lis RT, Wu X, Stack EC, Loda M, Liu T, Xu H, Cato L, Thornton JE, et al. EZH2 oncogenic activity in castration-resistant prostate cancer cells is Polycomb-independent. Science. 2012; 338:1465–69. https://doi.org/10.1126/science.1227604.
26. Dryhurst D, Ausió J. Histone H2A.Z deregulation in prostate cancer. Cause or effect? Cancer Metastasis Rev. 2014; 33:429–39. https://doi.org/10.1007/s10555-013-9486-9.
27. Cao R, Wang L, Wang H, Xia L, Erdjument-Bromage H, Tempst P, Jones RS, Zhang Y. Role of histone H3 lysine 27 methylation in Polycomb-group silencing. Science. 2002; 298:1039–43. https://doi.org/10.1126/science.1076997.
28. Colquhoun AJ, Venier NA, Vandersluis AD, Besla R, Sugar LM, Kiss A, Fleshner NE, Pollak M, Klotz LH, Venkateswaran V. Metformin enhances the antiproliferative and apoptotic effect of bicalutamide in prostate cancer. Prostate Cancer Prostatic Dis. 2012; 15:346–52. https://doi.org/10.1038/pcan.2012.16.
29. Chen X, Li C, He T, Mao J, Li C, Lyu J, Meng QH. Metformin inhibits prostate cancer cell proliferation, migration, and tumor growth through upregulation of PEDF expression. Cancer Biol Ther. 2016; 17:507–14. https://doi.org/10.1080/15384047.2016.1156273.
30. Cunningham D, You Z. In vitro and in vivo model systems used in prostate cancer research. J Biol Methods. 2015; 2:e17. https://doi.org/10.14440/jbm.2015.63.
31. Coon JJ, Ueberheide B, Syka JE, Dryhurst DD, Ausio J, Shabanowitz J, Hunt DF. Protein identification using sequential ion/ion reactions and tandem mass spectrometry. Proc Natl Acad Sci USA. 2005; 102:9463–68. https://doi.org/10.1073/pnas.0503189102.
32. Matsuda R, Hori T, Kitamura H, Takeuchi K, Fukagawa T, Harata M. Identification and characterization of the two isoforms of the vertebrate H2A.Z histone variant. Nucleic Acids Res. 2010; 38:4263–73. https://doi.org/10.1093/nar/gkq171.
33. Dunn CJ, Sarkar P, Bailey ER, Farris S, Zhao M, Ward JM, Dudek SM, Saha RN. Histone Hypervariants H2A.Z.1 and H2A.Z.2 Play Independent and Context-Specific Roles in Neuronal Activity-Induced Transcription of Arc/Arg3.1 and Other Immediate Early Genes. eNeuro. 2017; 4:ENEURO.0040-17.2017. https://doi.org/10.1523/ENEURO.0040-17.2017.
34. Kim J, Coetzee GA. Prostate specific antigen gene regulation by androgen receptor. J Cell Biochem. 2004; 93:233–41. https://doi.org/10.1002/jcb.20228.
35. Lee DK, Chang C. Molecular communication between androgen receptor and general transcription machinery. J Steroid Biochem Mol Biol. 2003; 84:41–49. https://doi.org/10.1016/S0960-0760(03)00005-0.
36. De Mol E, Szulc E, Di Sanza C, Martinez-Cristobal P, Bertoncini CW, Fenwick RB, Frigole-Vivas M, Masin M, Hunter I, Buzon V, Brun-Heath I, Garcia J, De Fabritiis G, et al. Regulation of Androgen Receptor Activity by Transient Interactions of Its Transactivation Domain with General Transcription Regulators. Structure. 2018; 26:145–52.e3. https://doi.org/10.1016/j.str.2017.11.007.
37. Linja MJ, Visakorpi T. Alterations of androgen receptor in prostate cancer. J Steroid Biochem Mol Biol. 2004; 92:255–64. https://doi.org/10.1016/j.jsbmb.2004.10.012.
38. Chien SW, Kuo DY, Liao JM, Wang PS, Yu CH. Growth Modulation of Diabetic Factors and Antidiabetic Drugs on Prostate Cancer Cell Lines. Chin J Physiol. 2016; 59:109–18. https://doi.org/10.4077/CJP.2016.BAE368.
39. Tran LN, Kichenadasse G, Butler LM, Centenera MM, Morel KL, Ormsby RJ, Michael MZ, Lower KM, Sykes PJ. The Combination of Metformin and Valproic Acid Induces Synergistic Apoptosis in the Presence of p53 and Androgen Signaling in Prostate Cancer. Mol Cancer Ther. 2017; 16:2689–700. https://doi.org/10.1158/1535-7163.MCT-17-0074.
40. Pennanen P, Syvälä H, Bläuer M, Savinainen K, Ylikomi T, Tammela TL, Murtola TJ. The effects of metformin and simvastatin on the growth of LNCaP and RWPE-1 prostate epithelial cell lines. Eur J Pharmacol. 2016; 788:160–67. https://doi.org/10.1016/j.ejphar.2016.06.036.
41. Chen L, Ahmad N, Liu X. Combining p53 stabilizers with metformin induces synergistic apoptosis through regulation of energy metabolism in castration-resistant prostate cancer. Cell Cycle. 2016; 15:840–49. https://doi.org/10.1080/15384101.2016.1151582.
42. Griss T, Vincent EE, Egnatchik R, Chen J, Ma EH, Faubert B, Viollet B, DeBerardinis RJ, Jones RG. Metformin Antagonizes Cancer Cell Proliferation by Suppressing Mitochondrial-Dependent Biosynthesis. PLoS Biol. 2015; 13:e1002309. https://doi.org/10.1371/journal.pbio.1002309.
43. Xie W, Wang L, Sheng H, Qiu J, Zhang D, Zhang L, Yang F, Tang D, Zhang K. Metformin Induces Growth Inhibition and Cell Cycle Arrest by Upregulating MicroRNA34a in Renal Cancer Cells. Med Sci Monit. 2017; 23:29–37. https://doi.org/10.12659/MSM.898710.
44. Gong L, Goswami S, Giacomini KM, Altman RB, Klein TE. Metformin pathways: pharmacokinetics and pharmacodynamics. Pharmacogenet Genomics. 2012; 22:820–27. https://doi.org/10.1097/FPC.0b013e3283559b22.
45. Tokubuchi I, Tajiri Y, Iwata S, Hara K, Wada N, Hashinaga T, Nakayama H, Mifune H, Yamada K. Beneficial effects of metformin on energy metabolism and visceral fat volume through a possible mechanism of fatty acid oxidation in human subjects and rats. PLoS One. 2017; 12:e0171293. https://doi.org/10.1371/journal.pone.0171293.
46. Cheema MS, Ausió J. The Structural Determinants behind the Epigenetic Role of Histone Variants. Genes (Basel). 2015; 6:685–713. https://doi.org/10.3390/genes6030685.
47. Sporn JC, Kustatscher G, Hothorn T, Collado M, Serrano M, Muley T, Schnabel P, Ladurner AG. Histone macroH2A isoforms predict the risk of lung cancer recurrence. Oncogene. 2009; 28:3423–28. https://doi.org/10.1038/onc.2009.26.
48. Park SM, Choi EY, Bae M, Kim S, Park JB, Yoo H, Choi JK, Kim YJ, Lee SH, Kim IH. Histone variant H3F3A promotes lung cancer cell migration through intronic regulation. Nat Commun. 2016; 7:12914. https://doi.org/10.1038/ncomms12914.
49. Vardabasso C, Gaspar-Maia A, Hasson D, Pünzeler S, Valle-Garcia D, Straub T, Keilhauer EC, Strub T, Dong J, Panda T, Chung CY, Yao JL, Singh R, et al. Histone Variant H2A.Z.2 Mediates Proliferation and Drug Sensitivity of Malignant Melanoma. Mol Cell. 2015; 59:75–88. https://doi.org/10.1016/j.molcel.2015.05.009.
50. Svotelis A, Gévry N, Grondin G, Gaudreau L. H2A.Z overexpression promotes cellular proliferation of breast cancer cells. Cell Cycle. 2010; 9:364–70. https://doi.org/10.4161/cc.9.2.10465.
51. Brooks CL, Gu W. How does SIRT1 affect metabolism, senescence and cancer? Nat Rev Cancer. 2009; 9:123–28. https://doi.org/10.1038/nrc2562.
52. Huffman DM, Grizzle WE, Bamman MM, Kim JS, Eltoum IA, Elgavish A, Nagy TR. SIRT1 is significantly elevated in mouse and human prostate cancer. Cancer Res. 2007; 67:6612–18. https://doi.org/10.1158/0008-5472.CAN-07-0085.
53. Jung-Hynes B, Nihal M, Zhong W, Ahmad N. Role of sirtuin histone deacetylase SIRT1 in prostate cancer. A target for prostate cancer management via its inhibition? J Biol Chem. 2009; 284:3823–32. https://doi.org/10.1074/jbc.M807869200.
54. Do MT, Kim HG, Choi JH, Jeong HG. Metformin induces microRNA-34a to downregulate the Sirt1/Pgc-1α/Nrf2 pathway, leading to increased susceptibility of wild-type p53 cancer cells to oxidative stress and therapeutic agents. Free Radic Biol Med. 2014; 74:21–34. https://doi.org/10.1016/j.freeradbiomed.2014.06.010.
55. Baptista T, Graça I, Sousa EJ, Oliveira AI, Costa NR, Costa-Pinheiro P, Amado F, Henrique R, Jerónimo C. Regulation of histone H2A.Z expression is mediated by sirtuin 1 in prostate cancer. Oncotarget. 2013; 4:1673–85. https://doi.org/10.18632/oncotarget.1237.
56. Valdés-Mora F, Song JZ, Statham AL, Strbenac D, Robinson MD, Nair SS, Patterson KI, Tremethick DJ, Stirzaker C, Clark SJ. Acetylation of H2A.Z is a key epigenetic modification associated with gene deregulation and epigenetic remodeling in cancer. Genome Res. 2012; 22:307–21. https://doi.org/10.1101/gr.118919.110.
57. Domaschenz R, Kurscheid S, Nekrasov M, Han S, Tremethick DJ. The Histone Variant H2A.Z Is a Master Regulator of the Epithelial-Mesenchymal Transition. Cell Reports. 2017; 21:943–52. https://doi.org/10.1016/j.celrep.2017.09.086.
58. Slupianek A, Yerrum S, Safadi FF, Monroy MA. The chromatin remodeling factor SRCAP modulates expression of prostate specific antigen and cellular proliferation in prostate cancer cells. J Cell Physiol. 2010; 224:369–75. https://doi.org/10.1002/jcp.22132.
59. Draker R, Sarcinella E, Cheung P. USP10 deubiquitylates the histone variant H2A.Z and both are required for androgen receptor-mediated gene activation. Nucleic Acids Res. 2011; 39:3529–42. https://doi.org/10.1093/nar/gkq1352.
60. Menendez JA, Cufí S, Oliveras-Ferraros C, Martin-Castillo B, Joven J, Vellon L, Vazquez-Martin A. Metformin and the ATM DNA damage response (DDR): accelerating the onset of stress-induced senescence to boost protection against cancer. Aging (Albany NY). 2011; 3:1063–77. https://doi.org/10.18632/aging.100407.
61. Xu Y, Ayrapetov MK, Xu C, Gursoy-Yuzugullu O, Hu Y, Price BD. Histone H2A.Z controls a critical chromatin remodeling step required for DNA double-strand break repair. Mol Cell. 2012; 48:723–33. https://doi.org/10.1016/j.molcel.2012.09.026.
62. Bridgeman SC, Ellison GC, Melton PE, Newsholme P, Mamotte CD. Epigenetic effects of metformin: from molecular mechanisms to clinical implications. Diabetes Obes Metab. 2018; 20:1553–62. https://doi.org/10.1111/dom.13262.
63. Wan L, Xu K, Wei Y, Zhang J, Han T, Fry C, Zhang Z, Wang YV, Huang L, Yuan M, Xia W, Chang WC, Huang WC, et al. Phosphorylation of EZH2 by AMPK Suppresses PRC2 Methyltransferase Activity and Oncogenic Function. Mol Cell. 2018; 69:279-91.e5. https://doi.org/10.1016/j.molcel.2017.12.024.
64. Lin W, Chen Y, Zeng L, Ying R, Zhu F. [Effect of a novel EZH2 inhibitor GSK126 on prostate cancer cells]. Zhejiang Da Xue Xue Bao Yi Xue Ban. 2016; 45:356–63. Effect of a novel EZH2 inhibitor GSK126 on prostate cancer cells.
65. Yang HD, Kim PJ, Eun JW, Shen Q, Kim HS, Shin WC, Ahn YM, Park WS, Lee JY, Nam SW. Oncogenic potential of histone-variant H2A.Z.1 and its regulatory role in cell cycle and epithelial-mesenchymal transition in liver cancer. Oncotarget. 2016; 7:11412–23. https://doi.org/10.18632/oncotarget.7194.
66. Valdés-Mora F, Gould CM, Colino-Sanguino Y, Qu W, Song JZ, Taylor KM, Buske FA, Statham AL, Nair SS, Armstrong NJ, Kench JG, Lee KM, Horvath LG, et al. Acetylated histone variant H2A.Z is involved in the activation of neo-enhancers in prostate cancer. Nat Commun. 2017; 8:1346. https://doi.org/10.1038/s41467-017-01393-8.
67. Hankinson SJ, Fam M, Patel NN. A review for clinicians: prostate cancer and the antineoplastic properties of metformin. Urol Oncol. 2017; 35:21–29. https://doi.org/10.1016/j.urolonc.2016.10.009.
68. Liu Q, Tong D, Liu G, Xu J, Do K, Geary K, Zhang D, Zhang J, Zhang Y, Li Y, Bi G, Lan W, Jiang J. Metformin reverses prostate cancer resistance to enzalutamide by targeting TGF-β1/STAT3 axis-regulated EMT. Cell Death Dis. 2017; 8:e3007. https://doi.org/10.1038/cddis.2017.417.