
INTRODUCTION
The assessment of liver function is essential for determining the prognosis and clinical management of patients with chronic liver disease and for patients undergoing liver surgery [1, 2].
Several tests have been proposed or are used in daily clinical practice to assess liver function, ranging from tests based on laboratory values to metabolic tests. A widely used assessment is the Model for End-Stage Liver Disease (MELD) score. The MELD score combines several biochemical values (serum bilirubin, serum creatinine, and the international normalized ratio for prothrombin time) to determine liver function, serving as an indicator for patient treatment [3]. The most common metabolic test is the indocyanine green (ICG) clearance test, which uses an optical measurement technique to determine the blood clearance rate of intravenously injected ICG [4, 5]. New non-invasive technics are rising to analyze liver fibrosis, for example, Afdhal et al. showed that FibroScan (vibration-controlled transient elastography) provides an accurate assessment of liver fibrosis in patients with hepatitis B or C in comparison to histology [6]. These tests are suitable for measurement of global liver function; however, heterogeneous liver function with areas of regional dysfunction or hepatic compensation of local defects can only be assessed non-invasively with imaging techniques.
Abdominal ultrasound is useful for image-based diagnosis of liver function. Ultrasound elastography (US-RTE) can be used to measure liver stiffness, thus allowing an indirect assessment of liver function [7, 8]. However, the diagnostic value of US-RTE is restricted by limited reproducibility and the examiner-dependence of the method [9].
In addition to ultrasound imaging, MRI of the liver currently represents the gold standard of diagnostic methods. Several studies have demonstrated a correlation between hepatic gadolinium ethoxybenzyl-diethylenetriaminepentaacetic acid (Gd-EOB-DTP) uptake and liver function. A common analysis is the measurement of the signal intensity (SI) of T1-weighted volumetric interpolated breathhold examination- (VIBE-) sequences. Regarding SI-based measurements after Gd-EOB-DTPA administration, various SI ratios, such as the relative enhancement of the liver corrected by the spleen or muscle, have been used to assess liver function [10–15]. The evaluation of T1 relaxation time is an alternative approach to the direct measurement of SI and has recently gained attention [12, 16–19]. Haimerl et al. recently compared different SI and T1 relaxometry scores to detect the most relevant parameter derived from Gd-EOB-DTPA-enhanced MRI for assessment of liver function [20]. Scores based on T1 relaxometry were superior to SI-based indices for the assessment of liver function.
In addition to T1-weighted sequence analysis, some authors have reported the benefit of diffusion-weighted MRI in analyzing liver function [21–24]. The use of other MRI sequences such as T2-weighted images has not been analyzed.
The purpose of this study was to evaluate the diagnostic performance of multiparametric Gd-EOB-DTPA-enhanced MRI for the estimation of liver classified by the MELD score. Instead of focusing on a single MRI sequence, we examined the full range of available MRI sequences to estimate liver function in a multivariable analysis.
RESULTS
Patient characteristics stratified by the MELD score are summarized in Table 1. Patients were subdivided into two groups: normal liver function (NLF) and impaired liver function group (ILF). The mean MELD score was 7.7 (± 1.3) for NLF and 14.9 (± 3.7) for the ILF.
Table 1: Patient characteristics
All (n = 199) |
NLF (n = 142) |
ILF (n = 57) |
|
|---|---|---|---|
Age (years) |
60.0 ± 12.9 |
59.8 ± 13.5 |
60.6 ± 11.3 |
Sex, n (%) |
|||
Male |
153 (77) |
107 (75) |
46 (81) |
Female |
46 (23) |
35 (25) |
11 (19) |
Weight (kg) |
83.1 ± 16.2 |
84.9 ± 17.7 |
83.5 ± 12.1 |
Height (m) |
1.7 ± 0.1 |
1.7 ± 0.1 |
1.8 ± 0.1 |
MELD score |
9.8 ± 4.0 |
7.7 8 ± 1.3 |
14.9 ± 3.7 |
Table 1 shows the patient characteristics for the subgroups.
Data presented as the means ± standard deviation.
NLF: Normal liver function.
ILF: Impaired liver function.
The logistic regression analysis, with the MELD score as a dependent variable, (Table 2) showed that 6 of the 13 MR sequences including all relative scores were able to classify significantly (p < 0.05) liver dysfunction (Table 2).
Table 2: Logistic regression
Independent variable |
NLF (n = 142) |
ILF (n = 57) |
OR (95%-CI) |
AUC |
p-value |
|---|---|---|---|---|---|
T1 mapping 3D |
|||||
T1 plain [ms] |
770.9 ± 130.1 |
758.1 ± 143.6 |
0.99 (0.97, 1.02)** |
0.584 |
0.544 |
T1 HBP [ms] |
345.9 ± 93.6 |
460.5 ± 129.2 |
1.09 (1.06, 1.13)** |
0.751 |
≤0.001 |
RR (plain and HBP) |
0.5 ± 0.1 |
0.4 ± 0.1 |
0.31 (0.22, 0.44)* |
0.825 |
≤0.001 |
T1 3D VIBE |
|||||
In-phase plain [a.u.] |
215.5 ± 70.7 |
218.7 ± 42.8 |
0.88 (0.81, 0.96)** |
0.605 |
0.005 |
Opposed-phase plain [a.u.] |
237.4 ± 37.6 |
222.1 ± 37.9 |
1.02 (0.97, 1.06)** |
0.574 |
0.517 |
fs plain [a.u.] |
187.6 ± 32.9 |
187.5 ± 30.6 |
1.00 (0.91, 1.10)** |
0.513 |
0.987 |
fs HBP [a.u.] |
357.8 ± 82.6 |
283.1 ± 60.5 |
0.86 (0.81, 0.91)** |
0.772 |
≤0.001 |
RE (fs plain and HBP) |
0.9 ± 0.3 |
0.5 ± 0.3 |
0.67 (0.59, 0.77)* |
0.820 |
≤0.001 |
T2 HASTE |
271.3 ± 70.8 |
240.1 ± 68.2 |
0.94 (0.89, 0.98)** |
0.622 |
0.006 |
T2 BLADE fs |
160.9 ± 55.5 |
168.3 ± 52.1 |
1.02 (0.97, 1.08)** |
0.547 |
0.390 |
ADC (mm2/s) |
1.164 × 10⁻³ ± 0.297 × 10⁻³ |
1.215 × 10⁻³ ± 0.209 × 10⁻³ |
1.07 (0.96, 1.21) |
0.545 |
0.232 |
Table 2 shows the results of the logistic regression analyses with the MELD score as a dependent variable.
NLF: Normal liver function; ILF: Impaired liver function.
OR: Odds ratio; CI: Confidence interval; AUC: Area under the curve, p: Level of significance.
*per 0.1, **per 10 units.
The MR scores and MR sequences with a significant association were included in a multiple logistic regression analysis. The result is shown in Table 3. In this analysis, only the reduction rate between the 3D T1 mapping sequence remained a significant influencing factor for the MELD score (Figure 1).
Table 3: Multiple logistic regression
Independent variable |
OR (95%-CI) |
p-value |
|---|---|---|
T1 mapping 3D HBP |
1.03 (0.98, 1.08)** |
0.307 |
RR T1 mapping 3D (plain and HBP) |
0.41 (0.21, 0.82)* |
0.012 |
T1 3D VIBE in plain |
0.92 (0.80, 1.05)** |
0.219 |
T1 3D VIBE fs HBP |
1.03 (0.93, 1.15)** |
0.555 |
RE T1 3D VIBE (fs plain and HBP) |
0.92 (0.73, 1.15)* |
0.446 |
T2 HASTE |
0.96 (0.90, 1.02)** |
0.214 |
Table 3 shows the results of the multiple logistic regression analysis with the MELD score as a dependent variable.
OR: Odds ratio; CI: Confidence interval; p: Level of significance.
*per 0.1, **per 10 units.
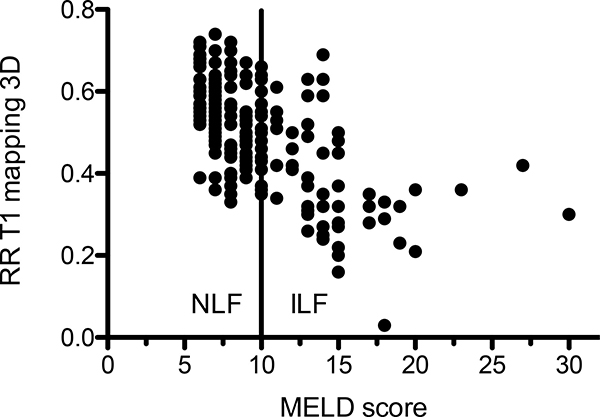
Figure 1: Scatterplot of the reduction rate between plain and contrast enhanced of T1 mapping sequences in correlation to the MELD score. The solid line indicates the cut off between normal (NLF) and impaired liver function (ILF).
DISCUSSION
Our results showed that liver dysfunction can be assessed by different methods. The logistic regression analysis revealed, that the T1- and T2-weighted images were affected by impaired liver function.
Changes in liver function are often related to liver fibrosis. Liver fibrosis is characterized by destruction of the lobular and vascular architecture and nodular regeneration of liver tissue. Fibrosis of liver tissue results in extracellular accumulation of collagen fibers, proteoglycans, and other macromolecules [25]. Diffusion weighted imaging (DWI) measures the diffusion of water molecules in biological tissues and quantifies the water diffusion processes with the apparent diffusion coefficient (ADC) [26–28]. Theoretically, extracellular collagen fibers, glucosamine, and proteoglycans could inhibit the molecular diffusion of water, resulting in reduced diffusion [26, 28–30]. However, no significant correlation was found in the ADC analysis for this patient cohort.
Notably, the plain in-phase images of the T1-weighted 3D VIBE sequence were able to classify liver dysfunction significantly, while the plain fat suppressed (fs) T1-weighted sequence showed no significant classification. This finding might be due to fat suppression, indicating an impact of fat tissue on liver function. This idea is supported by the fact that the T2-weighted half Fourier single shot turbo spinecho (HASTE) sequence (no fat suppression) also showed a significant result in classifying liver dysfunction. However, in the present study, this influence was not fully defined, and further studies are needed.
Many technical parameters, such as the radiofrequency amplifier, receiver coils, B1-field heterogeneity, repetition times (TR) and respiratory motion, influence absolute values of SI measurements [19, 31, 32].
To overcome this influence, the sequences must be corrected; we calculated the relative change in SI for plain and contrast-enhanced images to measure liver function using T1-weighted images after applying the contrast agent Gd-EOB-DTPA. The liver-specific contrast agent Gadoxetic acid (Gd-EOB-DTPA; Primovist®, Bayer Healthcare, Berlin) is an ionic complex consisting of gadolinium (III) and the ligand ethoxybenzyl-diethylenetriaminepentaacetic acid (EOB-DTPA). Gadolinium shortens the spin-lattice relaxation (T1) time in the corresponding tissue, leading to an increase in SI on T1-weighted images [33–36].
The biochemical properties allow a characteristic late phase (HBP) [33–35, 37]. The ethoxybenzyl group promotes the transport of Gd-EOB-DTPA into hepatocytes through organ-anion transporters (OATPB1/B3) located in the sinusoids [38–41], while Gd-EOB-DTPA is excreted at the canalicular membrane by ATP-dependent multidrug resistance protein 2 (MRP2) [42, 43]. Excretion of Gd-EOB-DTPA into the biliary ducts is limited, which causes a temporary enhancement in liver cells [44]. In patients with normal liver parenchyma, the hepatocyte-specific contrast agent shows specific enhancement in the liver parenchyma [37–40]. Since the accumulation of Gd-EOB-DTPA depends on the number of functioning hepatocytes, in the case of liver fibrosis and cirrhosis, the enhancement is reduced, and changes in the liver parenchyma are reflected by Gd-EOB-DTPA uptake [15, 45–48]. While the plain fs T1-weighted images showed no significant value for classifying liver dysfunction, the contrast enhancement in the HBP images showed a significant result. This correlation was even stronger when calculating the relative change in SI. However, neither the fs T1-weighted images during the HBP nor the RE remained significant influencing factors in the multiple logistic regression.
In the plain T1 maps, no significant correlation with liver dysfunction, classified by the MELD score, could be observed.
Controversy currently exists regarding the extent to which the plain T1 relaxation time of the liver is influenced by changes in the liver parenchyma. The T1 relaxation time can be prolonged in plain images in cases of tissue remodeling in liver fibrosis, characterized by inflammation and consequent edema [19, 49, 50]. In contrast, in the advanced stages of liver fibrosis, decreased T1 relaxation times have been reported [51]. This reduction in T1 relaxation time might be due to increased deposition of paramagnetic macromolecules such as collagen tissue that have a lower water content [52, 53].
In simple and multiple logistic regression, we showed that liver dysfunction can be predicted, using the reduction rate in the T1 sequences. Regarding the question of whether SI-based-scores or T1 relaxation time scores should be used, we agree with Haimerl et al. [20] - a more reliable outcome can be found using T1 mapping.
In conclusion, Gd-EOB-DTPA-enhanced MRI allowed good prediction of liver dysfunction. It may serve as an appropriate image-based tool for staging liver function before liver surgery, detecting silent disease, or revealing existing disease.
MATERIALS AND METHODS
Patient inclusion
The institutional review board approved this retrospective study. Between 03/2016 and 12/2016, 215 Gd-EOB-DTPA-enhanced MRI examinations of the liver were performed. Sixteen patients were excluded from the study due to inability to complete the full MRI protocol or the presence of severe motion artifacts as a result of poor breath-holding technique. Finally, 199 patients were included in this study; the corresponding patient characteristics are listed in Table 1.
Evaluation of liver function (using established clinical methods)
We used an established clinical scoring system, the MELD score, to assess total liver function. The MELD score is calculated using biochemical blood parameters as follows:
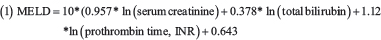
To avoid negative scores, any value less than 1 was given a value of 1 (e.g., if the serum bilirubin value was 0.6, a value of 1.0 was used).
Subsequently, the patients were divided into two groups according to their liver function as determined by the MELD score. Following the approach described previously by Verloh et al., a MELD score below ten was considered indicative of normal liver function, and a MELD score above 10 indicated impaired liver function [12]. Patients with impaired liver function (n = 57) had different diagnostic assumptions: 26 patients with ethyl-induced liver damage, 17 patients with chronic viral infection, five patients with a non-alcoholic fatty liver disease, three patients with autoimmune disease, six patients with other diseases associated with an impaired liver function such as sclerosing cholangitis.
MRI
All imaging was performed using a clinical whole body 3T system (MAGNETOM Skyra, Siemens Healthcare). A combination of body and spine array coil elements (18-channel body matrix coil, 24-channel spine matrix coil) was used for signal reception. Images were acquired using various sequences before (native) and 20 min after contrast agent administration (hepatobiliary phase, HBP). All MR sequences with their respective parameters are shown in the Supplementary Materials (Supplementary Table 1).
Gd-EOB-DTPA (Primovist; Bayer Schering Pharma AG, Berlin, Germany) was used as the liver-specific contrast agent and was administered via bolus injection (0.1 ml/kg body weight) with a flow rate of 1 ml/s and was subsequently flushed with 20 ml NaCl.
Image analysis
The mean SI values on T1-weighted images and the T1 relaxation times on T1 maps of the liver were measured using operator-defined regions of interest (ROIs).
Four circular ROIs were manually positioned by an experienced radiologist in the liver parenchyma at identical locations in all sequences (see the Supplementary Materials for details) at the level of the portal fork, three in right liver lobe, one in the left liver lobe. Visible vessels, liver lesions or imaging artifacts were excluded. The sizes of the ROIs ranged from 1.0 to 2.5 cm2, attempting to primarily take the largest diameter. Focal liver parenchyma damage was not found in any of the patients. ROIs were manually adjusted between sequences before and after Gd-EOB-DTPA administration in the case of patient movement. The mean values of these ROIs were then calculated and were considered representative for the entire liver.
Relative changes between the plain and contrast-enhanced series during the HBP were calculated as follows:
(2) Relative enhancement of SI (RE) = 
(3) Reduction rate of the T1 relaxation time (RR) = 
Statistical analysis
The statistical analysis was performed using IBM SPSS Statistics (Version 24, Chicago, IL) and R 3.2.1. All data are presented as means ± standard deviation if not specified otherwise. Logistic regression analyses of MRI sequences were used to determine their assessment of liver function as classified according to the MELD score. Then, multiple logistic regression of all significant values (inclusion criterion: p ≤ 0.05) was performed. The statistical significance level was set to 0.05 (two-sided).
Abbreviations
MELD-Score: Model for End-Stage Liver Disease Score; ICG: Indocyanine green; US-RTE: Ultrasound elastography; HBP: hepatobiliary phase; SI: Signal intensity; ROI: Region-of-interest; RE: Relative enhancement; RR: Reduction rate; NLF: Normal liver function; ILF: impaired liver function; VIBE: volumetric interpolated breathhold examination; Gd-EOB-DTPA: gadolinium ethoxybenzyl diethylenetriaminepentaacetic acid; Fs: spectrally fat suppressed; HASTE: Half-Fourier Acquisition Single-shot Turbo spin Echo imaging.
Author contributions
N.V. performed the literature search, collected and interpreted the data and drafted the manuscript. K.U. and M.E. participated in the study design, collected the data and edited the manuscript. M.H. and C.F. helped with the literature search and acquisition and interpretation of the data. F.Z. performed the statistical analysis and interpreted the data. HJS. and MM. revised the manuscript critically for important intellectual content and made substantial contributions to the data analysis. C.S. and P.W participated in the study design and coordination and helped draft the manuscript. All authors read and approved the final manuscript.
ACKNOWLEDGMENTS
We thank Siemens Healthcare and D.N. for providing the prototypical VFA T1 mapping sequence.
CONFLICTS OF INTEREST
The authors have no conflicts of interest to declare.
FUNDING
The authors received no specific funding for this work.
REFERENCES
1. Ribero D, Amisano M, Bertuzzo F, Langella S, Lo Tesoriere R, Ferrero A, Regge D, Capussotti L. Measured versus estimated total liver volume to preoperatively assess the adequacy of the future liver remnant: which method should we use? Ann Surg. 2013; 258:801–06. https://doi.org/10.1097/SLA.0000000000000213.
2. Yigitler C, Farges O, Kianmanesh R, Regimbeau JM, Abdalla EK, Belghiti J. The small remnant liver after major liver resection: how common and how relevant? Liver Transpl. 2003; 9:S18–25. https://doi.org/10.1053/jlts.2003.50194.
3. Kamath PS, Kim WR. The model for end-stage liver disease (MELD). Hepatology. 2007; 45:797–805. https://doi.org/10.1002/hep.21563.
4. Gupta S, Chawla Y, Kaur J, Saxena R, Duseja A, Dhiman RK, Choudhary NS. Indocyanine green clearance test (using spectrophotometry) and its correlation with model for end stage liver disease (MELD) score in Indian patients with cirrhosis of liver. Trop Gastroenterol. 2012; 33:129–34.
5. Tralhao JG, Hoti E, Oliveiros B, Botelho MF, Sousa FC. Study of perioperative liver function by dynamic monitoring of ICG-clearance. Hepatogastroenterology. 2012; 59:1179–83.
6. Afdhal NH, Bacon BR, Patel K, Lawitz EJ, Gordon SC, Nelson DR, Challies TL, Nasser I, Garg J, Wei LJ, McHutchison JG. Accuracy of fibroscan, compared with histology, in analysis of liver fibrosis in patients with hepatitis B or C: a United States multicenter study. Clin Gastroenterol Hepatol. 2015; 13:772–9.e1-3. https://doi.org/10.1016/j.cgh.2014.12.014.
7. Cassinotto C, Lapuyade B, Ait-Ali A, Vergniol J, Gaye D, Foucher J, Bailacq-Auder C, Chermak F, Le Bail B, de Ledinghen V. Liver fibrosis: noninvasive assessment with acoustic radiation force impulse elastography--comparison with FibroScan M and XL probes and FibroTest in patients with chronic liver disease. Radiology. 2013; 269:283–92. https://doi.org/10.1148/radiol.13122208.
8. Friedrich-Rust M, Nierhoff J, Lupsor M, Sporea I, Fierbinteanu-Braticevici C, Strobel D, Takahashi H, Yoneda M, Suda T, Zeuzem S, Herrmann E. Performance of Acoustic Radiation Force Impulse imaging for the staging of liver fibrosis: a pooled meta-analysis. J Viral Hepat. 2012; 19:e212–9. https://doi.org/10.1111/j.1365-2893.2011.01537.x.
9. Bota S, Sporea I, Sirli R, Popescu A, Danila M, Costachescu D. Intra- and interoperator reproducibility of acoustic radiation force impulse (ARFI) elastography—preliminary results. Ultrasound Med Biol. 2012; 38:1103–8. https://doi.org/10.1016/j.ultrasmedbio.2012.02.032.
10. Kamimura K, Fukukura Y, Yoneyama T, Takumi K, Tateyama A, Umanodan A, Shindo T, Kumagae Y, Ueno S, Koriyama C, Nakajo M. Quantitative evaluation of liver function with T1 relaxation time index on Gd-EOB-DTPA-enhanced MRI: comparison with signal intensity-based indices. J Magn Reson Imaging. 2014; 40:884–9. https://doi.org/10.1002/jmri.24443.
11. Motosugi U, Ichikawa T, Sou H, Sano K, Tominaga L, Kitamura T, Araki T. Liver parenchymal enhancement of hepatocyte-phase images in Gd-EOB-DTPA-enhanced MR imaging: which biological markers of the liver function affect the enhancement? J Magn Reson Imaging. 2009; 30:1042–6. https://doi.org/10.1002/jmri.21956.
12. Yoneyama T, Fukukura Y, Kamimura K, Takumi K, Umanodan A, Ueno S, Nakajo M. Efficacy of liver parenchymal enhancement and liver volume to standard liver volume ratio on Gd-EOB-DTPA-enhanced MRI for estimation of liver function. Eur Radiol. 2014; 24:857–65. https://doi.org/10.1007/s00330-013-3086-5.
13. Verloh N, Haimerl M, Zeman F, Schlabeck M, Barreiros A, Loss M, Schreyer AG, Stroszczynski C, Fellner C, Wiggermann P. Assessing liver function by liver enhancement during the hepatobiliary phase with Gd-EOB-DTPA-enhanced MRI at 3 Tesla. Eur Radiol. 2014; 24: 1013–9. https://doi.org/10.1007/s00330-014-3108-y.
14. Motosugi U, Ichikawa T, Oguri M, Sano K, Sou H, Muhi A, Matsuda M, Fujii H, Enomoto N, Araki T. Staging liver fibrosis by using liver-enhancement ratio of gadoxetic acid-enhanced MR imaging: comparison with aspartate aminotransferase-to-platelet ratio index. Magn Reson Imaging. 2011; 29:1047–52. https://doi.org/10.1016/j.mri.2011.05.007.
15. Nishie A, Asayama Y, Ishigami K, Tajima T, Kakihara D, Nakayama T, Takayama Y, Okamoto D, Taketomi A, Shirabe K, Fujita N, Obara M, Yoshimitsu K, et al. MR prediction of liver fibrosis using a liver-specific contrast agent: Superparamagnetic iron oxide versus Gd-EOB-DTPA. J Magn Reson Imaging. 2012; 36:664–71. https://doi.org/10.1002/jmri.23691.
16. Haimerl M, Verloh N, Zeman F, Fellner C, Muller-Wille R, Schreyer AG, Stroszczynski C, Wiggermann P. Assessment of Clinical Signs of Liver Cirrhosis Using T1 Mapping on Gd-EOB-DTPA-Enhanced 3T MRI. PLoS One. 2013; 8:e85658. https://doi.org/10.1371/journal.pone.0085658.
17. Haimerl M, Schlabeck M, Verloh N, Zeman F, Fellner C, Nickel D, Barreiros AP, Loss M, Stroszczynski C, Wiggermann P. Volume-assisted estimation of liver function based on Gd-EOB-DTPA-enhanced MR relaxometry. Eur Radiol. 2016; 26:1125–33. https://doi.org/10.1007/s00330-015-3919-5.
18. Haimerl M, Verloh N, Fellner C, Zeman F, Teufel A, Fichtner-Feigl S, Schreyer AG, Stroszczynski C, Wiggermann P. MRI-based estimation of liver function: Gd-EOB-DTPA-enhanced T1 relaxometry of 3T vs. the MELD score. Sci Rep. 2014; 4:5621. https://doi.org/10.1038/srep05621.
19. Katsube T, Okada M, Kumano S, Hori M, Imaoka I, Ishii K, Kudo M, Kitagaki H, Murakami T. Estimation of liver function using T1 mapping on Gd-EOB-DTPA-enhanced magnetic resonance imaging. Invest Radiol. 2011; 46: 277–83. https://doi.org/10.1097/RLI.0b013e318200f67d.
20. Haimerl M, Verloh N, Zeman F, Fellner C, Nickel D, Lang SA, Teufel A, Stroszczynski C, Wiggermann P. Gd-EOB-DTPA-enhanced MRI for evaluation of liver function: Comparison between signal-intensity-based indices and T1 relaxometry. Sci Rep. 2017; 7:43347. https://doi.org/10.1038/srep43347.
21. Taouli B, Tolia AJ, Losada M, Babb JS, Chan ES, Bannan MA, Tobias H. Diffusion-weighted MRI for quantification of liver fibrosis: preliminary experience. AJR Am J Roentgenol. 2007; 189:799–806. https://doi.org/10.2214/AJR.07.2086.
22. Soylu A, Kilickesmez O, Poturoglu S, Dolapcioglu C, Serez K, Sevindir I, Yasar N, Akyildiz M, Kumbasar B. Utility of diffusion-weighted MRI for assessing liver fibrosis in patients with chronic active hepatitis. Diagn Interv Radiol. 2010; 16:204–8. https://doi.org/10.4261/1305-3825.DIR.2810-09.1.
23. Lewin M, Poujol-Robert A, Boelle PY, Wendum D, Lasnier E, Viallon M, Guechot J, Hoeffel C, Arrive L, Tubiana JM, Poupon R. Diffusion-weighted magnetic resonance imaging for the assessment of fibrosis in chronic hepatitis C. Hepatology. 2007; 46:658–65. https://doi.org/10.1002/hep.21747.
24. Girometti R, Furlan A, Bazzocchi M, Soldano F, Isola M, Toniutto P, Bitetto D, Zuiani C. Diffusion-weighted MRI in evaluating liver fibrosis: a feasibility study in cirrhotic patients. Radiol Med. 2007; 112:394–408. https://doi.org/10.1007/s11547-007-0149-1.
25. Ishak K, Baptista A, Bianchi L, Callea F, De Groote J, Gudat F, Denk H, Desmet V, Korb G, MacSween RN, Phillips MJ, Portmann BG, Poulsen H, et al. Histological grading and staging of chronic hepatitis. J Hepatol. 1995; 22:696–9.
26. Kim T, Murakami T, Takahashi S, Hori M, Tsuda K, Nakamura H. Diffusion-weighted single-shot echoplanar MR imaging for liver disease. AJR Am J Roentgenol. 1999; 173:393–8. https://doi.org/10.2214/ajr.173.2.10430143.
27. Le Bihan D, Turner R, Douek P, Patronas N. Diffusion MR imaging: clinical applications. AJR Am J Roentgenol. 1992; 159:591–9. https://doi.org/10.2214/ajr.159.3.1503032.
28. Le Bihan D. Molecular diffusion, tissue microdynamics and microstructure. NMR Biomed. 1995; 8:375–86.
29. Aubé C, Racineux PX, Lebigot J, Oberti F, Croquet V, Argaud C, Calès P, Caron C. [Diagnosis and quantification of hepatic fibrosis with diffusion weighted MR imaging: preliminary results]. [Article in French]. J Radiol. 2004; 85:301–06.
30. Amano Y, Kumazaki T, Ishihara M. Single-shot diffusion-weighted echo-planar imaging of normal and cirrhotic livers using a phased-array multicoil. Acta Radiol. 1998; 39:440–2.
31. Jackson A. Analysis of dynamic contrast enhanced MRI. Br J Radiol. 2004; 77:S154–66. https://doi.org/10.1259/bjr/16652509.
32. Materne R, Smith AM, Peeters F, Dehoux JP, Keyeux A, Horsmans Y, Van Beers BE. Assessment of hepatic perfusion parameters with dynamic MRI. Magn Reson Med. 2002; 47:135–42.
33. Bluemke DA, Sahani D, Amendola M, Balzer T, Breuer J, Brown JJ, Casalino DD, Davis PL, Francis IR, Krinsky G, Lee FT Jr, Lu D, Paulson EK, et al. Efficacy and safety of MR imaging with liver-specific contrast agent: U.S. multicenter phase III study. Radiology. 2005; 237:89–98. https://doi.org/10.1148/radiol.2371031842.
34. Kobayashi S, Matsui O, Gabata T, Koda W, Minami T, Ryu Y, Kozaka K, Kitao A. Relationship between signal intensity on hepatobiliary phase of gadolinium ethoxybenzyl diethylenetriaminepentaacetic acid (Gd-EOB-DTPA)-enhanced MR imaging and prognosis of borderline lesions of hepatocellular carcinoma. Eur J Radiol. 2012; 81:3002–9. https://doi.org/10.1016/j.ejrad.2012.03.029.
35. Weinmann HJ, Schuhmann-Giampieri G, Schmitt-Willich H, Vogler H, Frenzel T, Gries H. A new lipophilic gadolinium chelate as a tissue-specific contrast medium for MRI. Magn Reson Med. 1991; 22:233–37. https://doi.org/10.1002/mrm.1910220214.
36. Clement O, Muhler A, Vexler V, Berthezene Y, Brasch RC. Gadolinium-ethoxybenzyl-DTPA, a new liver-specific magnetic resonance contrast agent. Kinetic and enhancement patterns in normal and cholestatic rats. Invest Radiol. 1992; 27:612–9.
37. Van Beers BE, Pastor CM, Hussain HK. Primovist, Eovist: what to expect? J Hepatol. 2012; 57:421–9. https://doi.org/10.1016/j.jhep.2012.01.031.
38. van Montfoort JE, Stieger B, Meijer DK, Weinmann HJ, Meier PJ, Fattinger KE. Hepatic uptake of the magnetic resonance imaging contrast agent gadoxetate by the organic anion transporting polypeptide Oatp1. J Pharmacol Exp Ther. 1999; 290:153–7.
39. Weinmann HJ, Bauer H, Frenzel T, Muhler A, Ebert W. Mechanism of hepatic uptake of gadoxetate disodium. Acad Radiol. 1996; 3:S232–4.
40. Pascolo L, Cupelli F, Anelli PL, Lorusso V, Visigalli M, Uggeri F, Tiribelli C. Molecular mechanisms for the hepatic uptake of magnetic resonance imaging contrast agents. Biochem Biophys Res Commun. 1999; 257:746–52. https://doi.org/10.1006/bbrc.1999.0454.
41. Nassif A, Jia J, Keiser M, Oswald S, Modess C, Nagel S, Weitschies W, Hosten N, Siegmund W, Kuhn JP. Visualization of hepatic uptake transporter function in healthy subjects by using gadoxetic acid-enhanced MR imaging. Radiology. 2012; 264:741–50. https://doi.org/10.1148/radiol.12112061.
42. Tsuda N, Matsui O. Cirrhotic rat liver: reference to transporter activity and morphologic changes in bile canaliculi--gadoxetic acid-enhanced MR imaging. Radiology. 2010; 256:767–73. https://doi.org/10.1148/radiol.10092065.
43. Tsuboyama T, Onishi H, Kim T, Akita H, Hori M, Tatsumi M, Nakamoto A, Nagano H, Matsuura N, Wakasa K, Tomoda K. Hepatocellular carcinoma: hepatocyte-selective enhancement at gadoxetic acid-enhanced MR imaging—correlation with expression of sinusoidal and canalicular transporters and bile accumulation. Radiology. 2010; 255:824–33. https://doi.org/10.1148/radiol.10091557.
44. Schuhmann-Giampieri G, Schmitt-Willich H, Frenzel T. Biliary excretion and pharmacokinetics of a gadolinium chelate used as a liver-specific contrast agent for magnetic resonance imaging in the rat. J Pharm Sci. 1993; 82:799–803.
45. Verloh N, Haimerl M, Rennert J, Muller-Wille R, Niessen C, Kirchner G, Scherer MN, Schreyer AG, Stroszczynski C, Fellner C, Wiggermann P. Impact of liver cirrhosis on liver enhancement at Gd-EOB-DTPA enhanced MRI at 3Tesla. Eur J Radiol. 2013; 82:1710–5. https://doi.org/10.1016/j.ejrad.2013.05.033.
46. Tsuda N, Okada M, Murakami T. Potential of gadolinium-ethoxybenzyl-diethylenetriamine pentaacetic acid (Gd-EOB-DTPA) for differential diagnosis of nonalcoholic steatohepatitis and fatty liver in rats using magnetic resonance imaging. Invest Radiol. 2007; 42:242–7. https://doi.org/10.1097/01.rli.0000258058.44876.a5.
47. Ryeom HK, Kim SH, Kim JY, Kim HJ, Lee JM, Chang YM, Kim YS, Kang DS. Quantitative evaluation of liver function with MRI Using Gd-EOB-DTPA. Korean J Radiol. 2004; 5:231–9.
48. Tamada T, Ito K, Higaki A, Yoshida K, Kanki A, Sato T, Higashi H, Sone T. Gd-EOB-DTPA-enhanced MR imaging: evaluation of hepatic enhancement effects in normal and cirrhotic livers. Eur J Radiol. 2011; 80:e311–6. https://doi.org/10.1016/j.ejrad.2011.01.020.
49. Heye T, Yang SR, Bock M, Brost S, Weigand K, Longerich T, Kauczor HU, Hosch W. MR relaxometry of the liver: significant elevation of T1 relaxation time in patients with liver cirrhosis. Eur Radiol. 2012; 22:1224–32. https://doi.org/10.1007/s00330-012-2378-5.
50. Thomsen C, Christoffersen P, Henriksen O, Juhl E. Prolonged T1 in patients with liver cirrhosis: an in vivo MRI study. Magn Reson Imaging. 1990; 8:599–604. https://doi.org/10.1016/0730-725X(90)90137-Q.
51. Haimerl M, Utpatel K, Verloh N, Zeman F, Fellner C, Nickel D, Teufel A, Fichtner-Feigl S, Evert M, Stroszczynski C, Wiggermann P. Gd-EOB-DTPA-enhanced MR relaxometry for the detection and staging of liver fibrosis. Sci Rep. 2017; 7:41429. https://doi.org/10.1038/srep41429.
52. Bataller R, Brenner DA. Liver fibrosis. J Clin Invest. 2005; 115:209–18. https://doi.org/10.1172/jci24282.
53. Rodriguez-Moreno F, González-Reimers E, Santolaria-Fernandez F, Galindo-Martin L, Hernandez-Torres O, Batista-Lopez N, Molina-Perez M. Zinc, copper, manganese, and iron in chronic alcoholic liver disease. Alcohol. 1997; 14:39–44. https://doi.org/10.1016/S0741-8329(96)00103-6.