

INTRODUCTION
Hypertension is the main cause of cardiovascular disease. Essential hypertension (EH) is a cardiovascular disease that affects 27% of the world population and >90% of all patients diagnosed with hypertension [1]. It is estimated that by 2025, EH will be the main risk factor for stroke, myocardial infarction and end-stage renal disease, which affect 29% adults worldwide [2]. EH is a complex genetic disease, which is influenced by the interactions between many congenital genes and various pathogenic environmental factors such as diet rich in sodium and low in potassium, excess weight and obesity, alcohol abuse, mental tension, age, and lack of physical activity [3]. Epidemiological studies suggest that hypertension is related to a combination of environmental and genetic factors [4]. Thus, it is essential to determine the susceptibility genes that contribute towards the pathophysiology of hypertension in order to devise novel strategies to prevent and treat hypertension.
Leptin (LEP) is a protein that is secreted by adipocytes, which regulates food intake, energy consumption, body energy balance and fat storage, as well as participating in hematopoietic and reproductive functions through leptin receptor (LEPR) [5]. Human LEPR gene is 5.1 kb in length, located on chromosome 1p31, and contains 20 exons and 19 introns encoding an 1165 amino acid polypeptide [6]. Leptin increases blood pressure by stimulating the sympathetic nervous system [7]. Tang-Christensen et al. showed that Rhesus monkeys injected with leptin through the ventricle showed higher catecholamine secretion and increased the output of the sympathetic nervous system and mean arterial pressure [8]. This suggested that leptin regulated blood pressure.
Many studies have correlated LEPR gene polymorphisms with EH. Matsuoka et al. sequenced exons 2–20 of the LEPR gene and found 7 mutations, namely, rs1137100 (Lys109Arg), rs1137101 (Gln223Ser), rs1805134, rs13306526 (Ser492Thr), rs1805094 (Lys656Asn), (Ala976Asp), rs1805096 (Pro1019Pro) [9]. In this case-control study, we investigated the association between the leptin receptor (LEPR) gene polymorphisms and essential hypertension (EH) in the Mongolian and Han ethnic groups from China.
RESULTS
Association of clinicopathological characteristics with EH
As shown in Table 1, clinicopathological characteristics such as age, gender (males), BMI, SBP, DBP, LDL-C, tobacco smoking and alcohol consumption correlated with EH (all P < 0.05) in both Han and Mongolian populations. However, HDL-C did not correlate with EH (P > 0.05) in both Han and Mongolian populations, TG and TC did not correlate with EH (P > 0.05) in Han populations (Table 1).
Table 1: Clinicopathological characteristics of EH patients and control subjects (M, Q)
Clinical parameters |
Han population (n = 891) |
P |
Mongolian population (n = 1061) |
P |
||
|---|---|---|---|---|---|---|
EH (n = 411) |
NBP (n = 480) |
EH (n = 658) |
NBP (n = 403) |
|||
Gender |
||||||
Male [n (%)] |
294 (72) |
182 (38) |
0.001* |
314 (48) |
159 (40) |
0.01* |
Female [n (%)] |
117 (28) |
298 (62) |
344 (52) |
244 (60) |
||
Age (years) |
60 ± 16 |
49,15 |
0.001* |
50,20 |
47,22 |
0.001* |
BMI (kg/m2) |
27.67,2.85 |
25.64,3.21 |
0.001* |
27,3 |
25,4 |
0.001* |
SBP (mm Hg) |
150.46,16.7 |
118.5,15.23 |
0.001* |
144,25 |
115,12 |
0.001* |
DBP (mm Hg) |
86.84,11.06 |
77.43,8.78 |
0.001* |
91,18 |
77,6 |
0.001* |
TG (mM) |
1.88,1.32 |
1.77,1.10 |
0.19 |
2.14,1.57 |
1.52,1.06 |
0.001* |
TC (mM) |
5.05,3.73 |
4.33,1.24 |
0.37 |
5.82,1.31 |
4.76,1.57 |
0.001* |
HDL-C (mM) |
1.40,0.61 |
1.39,0.61 |
0.95 |
1.49,0.46 |
1.48,0.47 |
0.65 |
LDL-C (mM) |
3.34,1.34 |
2.78,0.82 |
0.001* |
3.92,1.42 |
2.94,1.19 |
0.001* |
Smoking |
||||||
Yes [n (%)] |
244 (59) |
127 (26.5) |
0.001* |
319 (49) |
143 (36) |
0.003* |
Alcohol consumption |
||||||
Yes [n (%)] |
221 (54) |
168 (35) |
0.001* |
312 (47) |
132 (33) |
0.003* |
Values are expressed as M, Q (Median and quartile spacing); NBP: Normal blood pressure group, EH: Essential hypertension group; TG triglyceride, TC, HDL-C high-density lipoprotein cholesterol. LDL-C low density lipoprotein, BMI Body mass index, SBP systolic blood pressure, DBP diastolic blood pressure; Significance: *p < 0.05 according to Mann-Whitney U/Wilcoxon Rank Sum W-test (2-tailed).
Hardy-weinberg equilibrium test
We analyzed the experimentally observed and theoretical frequency of a heterozygote, Hardy-Weinberg equilibrium, sample genotyping, and minimum allele frequency using the HaploView 4.0 software. Our data showed that 11 LEPR SNPs satisfied the Hardy-Weinberg equilibrium in both EH and control subjects (P > 0.05) belonging to the Mongolian and Han ethnic groups (Table 2). However, 3 LEPR SNPs, namely, rs189253, rs7418057 and rs4655802 did not satisfy Hardy-Weinberg equilibrium.
Table 2: Results of Hardy-Weinberg equilibrium test for LEPR SNP sites in Han and Mongolian subjects
SNPs |
Allele |
Han population |
Mongolian population |
||||
|---|---|---|---|---|---|---|---|
obsHET |
PredHET |
HWpval |
obsHET |
PredHET |
HWpval |
||
Rs200466 |
G/A |
0.471 |
0.496 |
0.145 |
0.522 |
0.5 |
0.170 |
Rs4655802 |
A/G |
0.262 |
0.263 |
0.974 |
0.261 |
0.281 |
0.028 |
Rs9436740 |
A/T |
0.328 |
0.313 |
0.205 |
0.293 |
0.295 |
0.921 |
Rs12410666 |
G/A |
0.122 |
0.12 |
1.0 |
0.089 |
0.09 |
0.784 |
Rs12037879 |
G/A |
0.327 |
0.314 |
0.278 |
0.342 |
0.336 |
0.671 |
Rs7418057 |
C/T |
0.179 |
0.018 |
1.0 |
0.183 |
0.199 |
0.0196 |
Rs1137100 |
G/A |
0.298 |
0.286 |
0.209 |
0.298 |
0.305 |
0.493 |
Rs13306519 |
C/G |
0.269 |
0.282 |
0.208 |
0.27 |
0.288 |
0.069 |
Rs1137101 |
G/A |
0.215 |
0.215 |
1.0 |
0.242 |
0.242 |
1.0 |
Rs1805134 |
T/C |
0.097 |
0.095 |
0.719 |
0.128 |
0.127 |
1.0 |
Rs13306526 |
C/G |
0.001 |
0.001 |
1.0 |
0.001 |
0.004 |
1.0 |
Rs1805094 |
G/C |
0.091 |
0.097 |
0.138 |
0.126 |
0.135 |
0.066 |
Rs1892535 |
A/G |
0.359 |
0.334 |
0.037 |
0.37 |
0.393 |
0.071 |
Rs1805096 |
T/C |
0.214 |
0.2 |
0.417 |
0.219 |
0.222 |
0.811 |
obsHET, observed frequency of a heterozygote; PredHET, predicted frequency of a heterozygote, HWpval Hardy-Weinberg equilibrium P value.
The genotype and allele frequency distribution for the 11 LEPR SNPs are shown in Figures 1–4. As shown in Figures 1–2, there were no differences in genotype or model frequency of LEPR SNPs between the EH patient and control subjects of the Han population (P > 0.05). However, the frequency of rs12037879, rs1805094, rs1137100, rs1805096, rs1805134 SNPs were significantly different between the EH patients and the control subjects of the Mongolian population (P > 0.05; Figures 3 and 4). We also observed that rs12037879, rs1137100 (Lys109Arg), rs1137101, rs1805134, rs1805094, rs1805096 LEPR polymorphisms were associated with EH risk in the Mongolian population based on the dominant genetic model (Table 3).
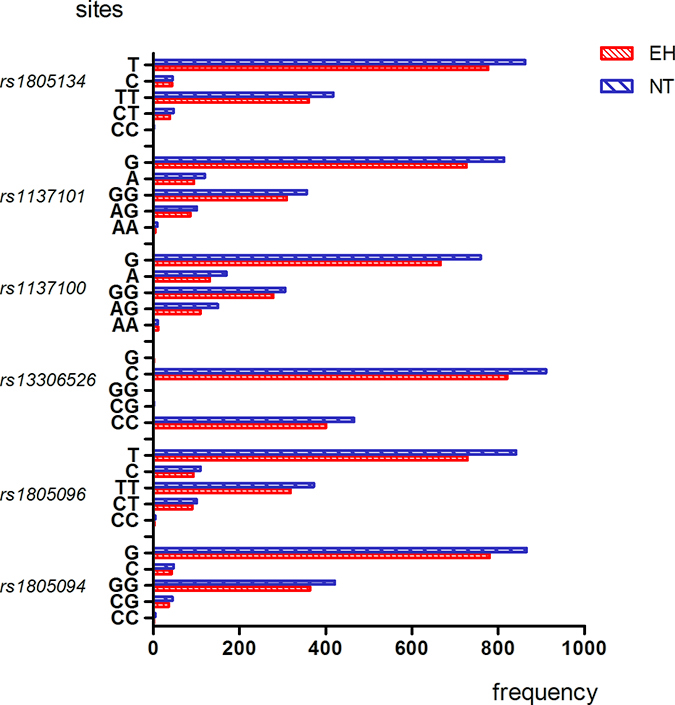
Figure 1: Genotype and allele frequencies of LEPR rs1805134, rs1137101, rs1137100, rs13306526, rs1805096, rs1805094 gene polymorphisms in EH patients and control subjects belonging to Han group. Note: AA, homozygous A allele; GA, heterozygous; GG, homozygous G allele; TT, homozygous T allele; CT, heterozygous; CC, homozygous C allele; CG, heterozygous; GG, homozygous G allele. Y axis represents allele frequencies, whereas the X axis represents the LEPR SNPs and their corresponding alleles.
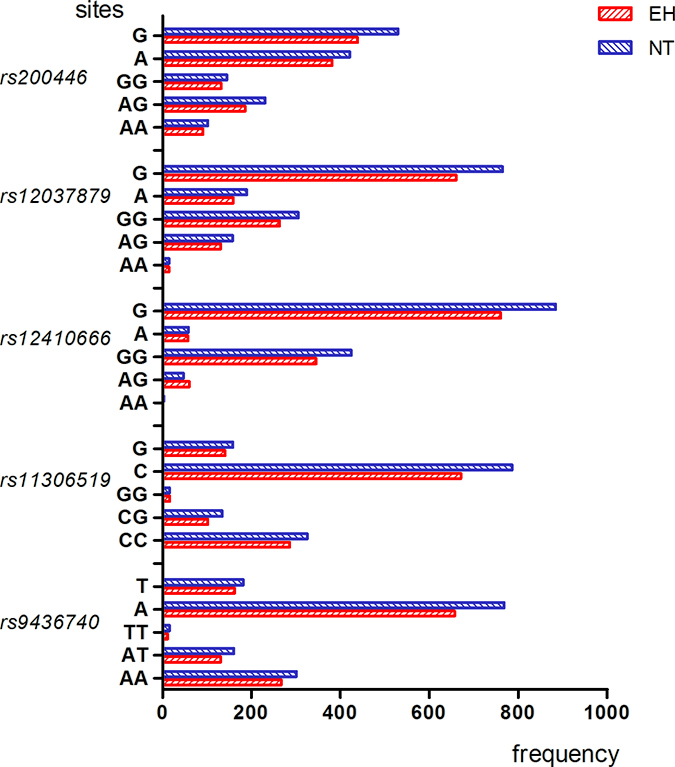
Figure 2: Genotype and allele frequencies of LEPR rs200446, rs2037879, rs12410666, rs11306519, rs9436740, gene polymorphisms in EH patients and control subjects belonging to Han group. Note: AA, homozygous A allele; GA, heterozygous; GG, homozygous G allele; TT, homozygous T allele; AT, heterozygous; AA, homozygous A allele; CC, homozygous C allele; CG, heterozygous; GG, homozygous G allele.
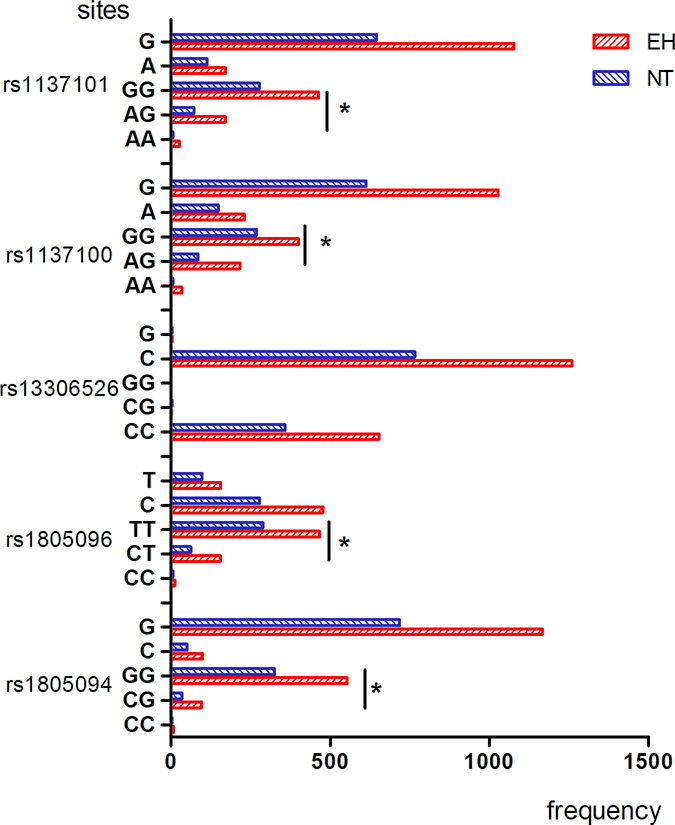
Figure 3: Genotype and allele frequencies of LEPR rs1137101, rs1137100, rs13306526, rs1805096, rs1805094 gene polymorphisms in EH patients and control subjects belonging to Mongolian group. Note: AA, homozygous A allele; GA, heterozygous; GG, homozygous G allele; TT, homozygous T allele; CT, heterozygous; CC, homozygous C allele; CC, homozygous C allele; CG, heterozygous; GG, homozygous G allele. *denotes p < 0.05 compared to controls.
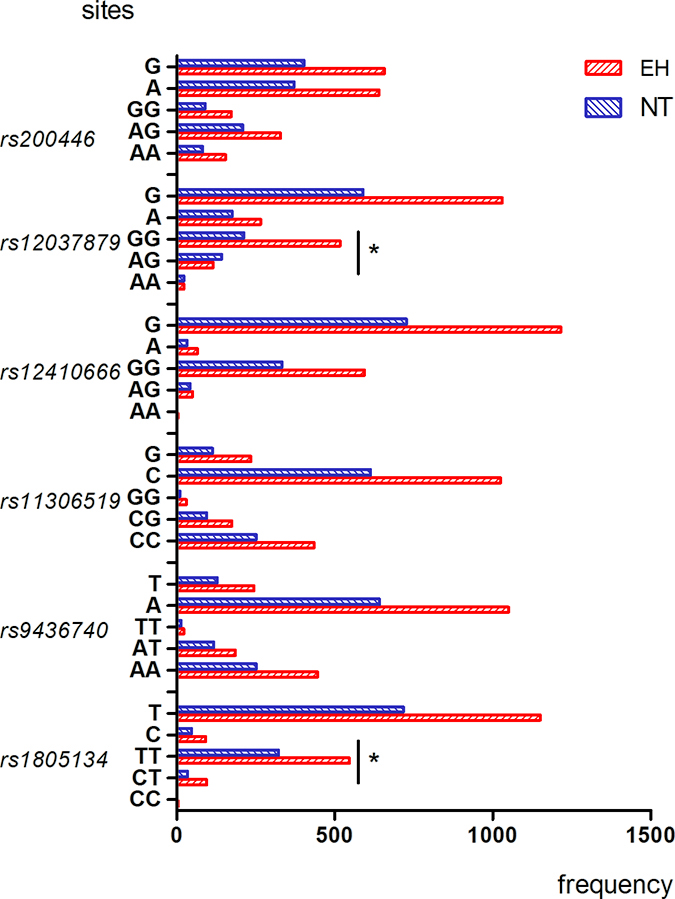
Figure 4: Genotype and allele frequencies of LEPR rs200446, rs2037879, rs12410666, rs11306519, rs9436740, rs1805134 gene polymorphisms in EH patients and control subjects belonging to Mongolian group. Note: AA, homozygous A allele; AG, heterozygous; GG, homozygous G allele; TT, homozygous T allele; AT, heterozygous; AA, homozygous A allele; CC, homozygous C allele; CG, heterozygous; GG, homozygous G allele. *denotes p < 0.05 compared to controls.
Table 3: Genetic model analysis of tagSNPs associated with EH in Han and Mongolian populations
Genetic Model |
Han population |
OR 95% CI |
Pa |
Mongolian population |
OR 95% CI |
Pa |
||
|---|---|---|---|---|---|---|---|---|
EH n (%) |
NBP n (%) |
EH n (%) |
NBP n (%) |
|||||
rs1805094 |
||||||||
CG+CC |
39 (9.50) |
45 (9.90) |
0.98 |
0.85 |
103 (15.70) |
36 (10.00) |
1.68 |
0.01* |
GG |
372 (90.50) |
411 (90.10) |
(0.77–1.24) |
553 (84.30) |
325 (90.00) |
(1.23–2.52) |
||
rs1805096 |
||||||||
CT+CC |
93 (22.60) |
103 (21.70) |
1.03 |
0.74 |
167 (26.30) |
68 (19.10) |
1.52 |
0.01* |
TT |
318 (77.40) |
372 (78.30) |
(0.87–1.22) |
467 (73.70) |
288 (80.90) |
(1.10–2.08) |
||
rs13306526 |
||||||||
CG+GG |
1 (0.20) |
0 (0) |
0.47 |
0.47 |
1 (0.20) |
3 (0.80) |
0.18 |
0.09 |
CC |
41 (99.80) |
455 (100) |
(0.44–0.51) |
653 (99.80) |
35 (99.20) |
(0.02–1.76) |
||
rs1137100 |
||||||||
AG+AA |
120 (30.20) |
159 (34.30) |
0.90 |
0.19 |
250 (38.40) |
90 (25.10) |
1.86 |
0.001* |
GG |
278 (69.80) |
305 (65.70) |
(0.76–1.06) |
401 (61.60) |
269 (74.90) |
(1.4–2.48) |
||
rs1137101 |
||||||||
AG+AA |
90 (22.60) |
110 (23.60) |
0.96 |
0.72 |
186 (28.60) |
77 (21.80) |
1.44 |
0.02* |
GG |
309 (77.40) |
356 (76.40) |
(0.82–1.15) |
464 (71.40) |
277 (78.20) |
(1.06–1.96) |
||
rs1805134 |
||||||||
CT+CC |
41 (10.00) |
45 (9.90) |
1.004 |
0.97 |
99 (15.30) |
34 (9.60) |
1.72 |
0.01* |
TT |
369 (90.00) |
408 (90.10) |
(0.79–1.27) |
546 (84.70) |
322 (90.40) |
(1.14–2.59) |
||
rs9436740 |
||||||||
AT+TT |
150 (36.60) |
167 (35.20) |
0.97 |
0.66 |
207 (31.70) |
130 (34.20) |
0.89 |
0.42 |
AA |
260 (63.40) |
308 (64.80) |
(0.84–1.12) |
445 (68.30) |
250 (65.80) |
(0.68–1.17) |
||
rs13306519 |
||||||||
CG+GG |
125 (30.80) |
142 (30.10) |
0.98 |
0.82 |
203 (31.90) |
105 (29.6) |
1.11 |
0.45 |
CC |
281 (69.20) |
330 (69.90) |
(0.84–1.14) |
434 (68.10) |
250 (70.40) |
(0.84–1.48) |
||
rs12410666 |
||||||||
AG+AA |
56 (13.70) |
55 (11.70) |
1.09 |
0.37 |
53 (8.20) |
41 (11.0) |
0.72 |
0.14 |
GG |
353 (86.30) |
416 (88.30) |
(0.9–1.34) |
593 (91.80) |
332 (89.0) |
(0.47–1.12) |
||
rs12037879 |
||||||||
AG+AA |
146 (35.60) |
171 (36.00) |
0.99 |
0.90 |
136 (20.80) |
164 (43.60) |
0.64 |
0.01* |
GG |
264 (64.40) |
304 (64.00) |
(0.85–1.15) |
517 (79.20) |
212 (56.40) |
(0.56–0.73) |
||
rs200446 |
||||||||
AG+AA |
285 (69.50) |
324 (68.20) |
1.03 |
0.68 |
483 (73.90) |
291 (76.60) |
0.86 |
0.33 |
GG |
125 (30.50) |
151 (31.80) |
(0.88–1.21) |
171 (26.10) |
89 (23.40) |
(0.64–1.16) |
||
*denotes p < 0.05; aDistribution of genotype and allele frequencies for 11 LEPR SNPs between EH patients and controls in Han and Mongolian populations as analyzed by chi-square test. NBP: Normal blood pressure group, EH: Essential hypertension group.
Logistic regression analysis with EH as a dependent variable, and age, sex, BMI, smoking, alcohol consumption and various LEPR SNPs as independent variables. We further performed logistic regression analysis after adjusting for confounding risk variables (gender, age, BMI, smoking and alcohol consumption) as shown in Tables 4 and 5. Logistic regression analysis with EH as a dependent variable, and age, sex, BMI, smoking, alcohol consumption and various LEPR SNPs as independent variables. We observed that rs1137100 GG (P = 0.01, OR = 0.60 95% CI 0.45–0.82), rs1805096 CT (P = 0.01, OR = 0.61 95% CI 0.44–0.86), rs1137101 AG (P = 0.02, OR = 0.69 95% CI 0.50–0.95), and rs1805134 CT (P = 0.01, OR = 0.55 95% CI 0.370.84) genotypes were protective factors against hypertension in the Mongolian population. Moreover, rs12037879 AA (P = 0.01, OR = 2.34 95% CI 1.25–4.36) and rs12037879 AG (P = 0.01, OR = 3.01 95% CI 2.25–4.06) genotypes were associated with EH risk. There were no significant differences in any of the LEPR polymorphisms in the Han population.
Table 4: Association of clinicopathological parameters with EH risk in Han individuals based on logistic regression analysis
Parameters |
P |
OR |
95% CI |
|---|---|---|---|
Sex |
0.001* |
3.82 |
2.74–5.33 |
Age |
0.001* |
0.97 |
0.95–0.97 |
BMI |
0.001* |
1.43 |
1.05–1.93 |
Smoking |
0.001* |
3.20 |
2.28–4.49 |
alcohol consumption |
0.001* |
1.73 |
1.24–2.41 |
Rs200466 |
0.12 |
1.19 |
0.95–1.49 |
Rs9436740 |
0.70 |
1.06 |
0.79–1.42 |
Rs12410666 |
0.71 |
1.09 |
0.69–1.73 |
Rs12037879 |
0.45 |
1.12 |
0.83–1.51 |
Rs1137100 |
0.34 |
0.85 |
0.62–1.16 |
Rs13306519 |
0.82 |
1.04 |
0.77–1.40 |
Rs1137101 |
0.33 |
0.84 |
0.59–1.19 |
Rs1805134 |
0.05 |
1.73 |
0.99–3.02 |
Rs13306526 |
1.0 |
0 |
- |
Rs1805094 |
0.29 |
0.76 |
0.46–1.26 |
Rs1805096 |
0.97 |
1.01 |
0.68–1.49 |
*denotes p < 0.05; Logistic regression analysis with EH as a dependent variable, and age, sex, BMI, smoking, alcohol consumption and various LEPR SNPs as independent variables.
Table 5: Association of clinicopathological parameters with EH risk in Mongolian individuals based on logistic regression analysis
Parameters |
P |
OR |
95% CI |
|---|---|---|---|
Sex |
0.44 |
1.12 |
0.84–1.5 |
Age |
0.02* |
0.99 |
0.98–1 |
BMI |
0.63 |
1 |
0.99–1.01 |
Smoking situation |
0.001* |
2.01 |
1.44–2.8 |
alcohol consumption |
0.26 |
1.22 |
0.87–1.71 |
Rs1805094 |
0.19 |
0.61 |
0.39–0.92 |
Rs1805096(CT) |
0.01* |
0.62 |
0.44–0.86 |
Rs13306526 |
0.17 |
4.89 |
4.83–49.45 |
Rs1137100(GG) |
0.01* |
0.60 |
0.45–0.82 |
Rs1137101(AG) |
0.02* |
0.55 |
0.36–0.84 |
Rs1805134(CT) |
0.01* |
0.69 |
0.37–1.29 |
Rs9436740 |
0.90 |
1.02 |
0.80–1.28 |
Rs12037879(AA) |
0.01* |
2.34 |
1.25–4.36 |
Rs12037879(AG) |
0.001* |
3.01 |
2.25–4.06 |
Rs200446 |
0.92 |
1.01 |
0.84–41.22 |
Rs13306519 |
0.27 |
0.87 |
0.69–1.11 |
Rs12410666 |
0.24 |
0.78 |
0.51–1.18 |
*denotes p < 0.05; Logistic regression analysis with EH as a dependent variable, and age, sex, BMI, smoking, alcohol consumption and various LEPR SNPs as independent variables.
Linkage disequilibrium and haplotype analysis
Linkage disequilibrium (LD) or allele association denotes non-random correlation between two alleles on the same chromosome. LD is defined as the probability that two alleles A and B exist in the same chromosome at the same time is greater than the probability of simultaneous occurrence due to random distribution. The interlocking strength between the two points is represented by two statistical parameters, D and r2. D represents the strength of linkage disequilibrium between the two sites, whereas r2 represents the degree of association between the two loci. Therefore, when the two values are zero, it means that the chain is fully balanced, whereas 1 indicates that the imbalanced linkage.
The HaploView software analysis demonstrated that the 14 SNPs formed 2 LD blocks (D > 0.8) in both Han and Mongolian populations. Block 1 included rs1137100 and rs13306519 and block 2 included rs1892535 and rs1805096. In the Mongolian population, only the GT haplotype of block 2 was associated with EH (P = 0.0034). The frequency of GT haplotype was higher in the EH patients (16.1%) than control subjects (11.4%) in the Mongolian population. Thus, the presence of GT haplotype (rs1892535, and rs1805096) was associated with greater EH risk in Mongolian population (Table 6, Figures 5 and 6) [10].
Table 6: Haplotype analysis of LEPR gene polymorphisms
Block |
Sites |
Han population |
Mongolian population |
||||||
|---|---|---|---|---|---|---|---|---|---|
Haplotype |
Freq |
χ2 |
P |
Haplotype |
Freq |
χ2 |
P |
||
Block1 |
GG |
0.66 |
1.24 |
0.27 |
GC |
0.64 |
0.64 |
0.43 |
|
rs1137100 |
AC |
0.17 |
1.01 |
0.31 |
AC |
0.19 |
0.44 |
0.51 |
|
rs13306519 |
GG |
0.17 |
0.16 |
0.69 |
AT |
0.18 |
2.86 |
0.09 |
|
Block2 |
rs1892535 |
AT |
0.79 |
0.57 |
0.45 |
AT |
0.73 |
3.12 |
0.07 |
rs1805096 |
GT |
0.11 |
0.03 |
0.86 |
GT |
0.16 |
8.59 |
0.01* |
|
FT |
0.10 |
1.48 |
0.22 |
GC |
0.13 |
0.39 |
0.53 |
||
*denotes p < 0.05 The frequency of GT (rs1892535 and rs1805096 sites formed Block 2) haplotype was higher in the EH patients (16.1%) than control subjects (11.4%) in the Mongolian population.
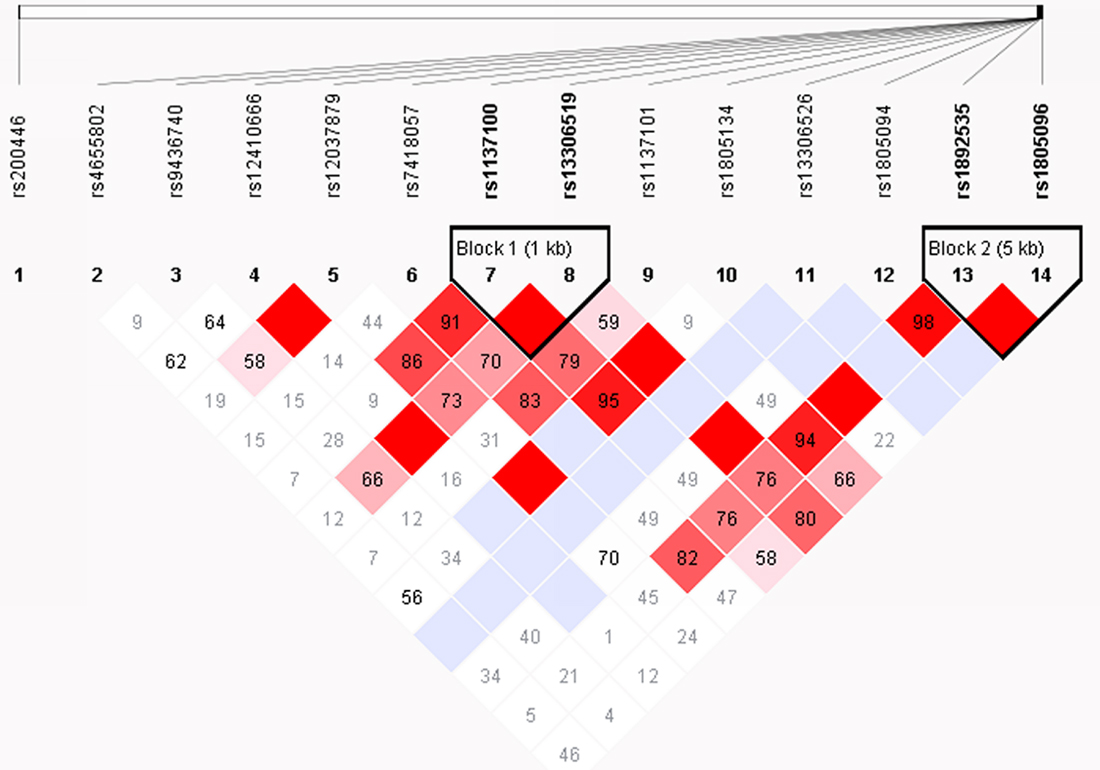
Figure 5: Linkage disequilibrium and haplotype analysis of LEPR SNPs in Han subjects. The haploview software analysis shows two haplotypes among the 14 SNPs, namely block 1 that includes rs1137100 and rs13306519 and block 2 that includes rs1892535, and rs1805096. Note: The blocks are represented by triangles. The red portions represent strong linkage, whereas the white portions represent no linkage.
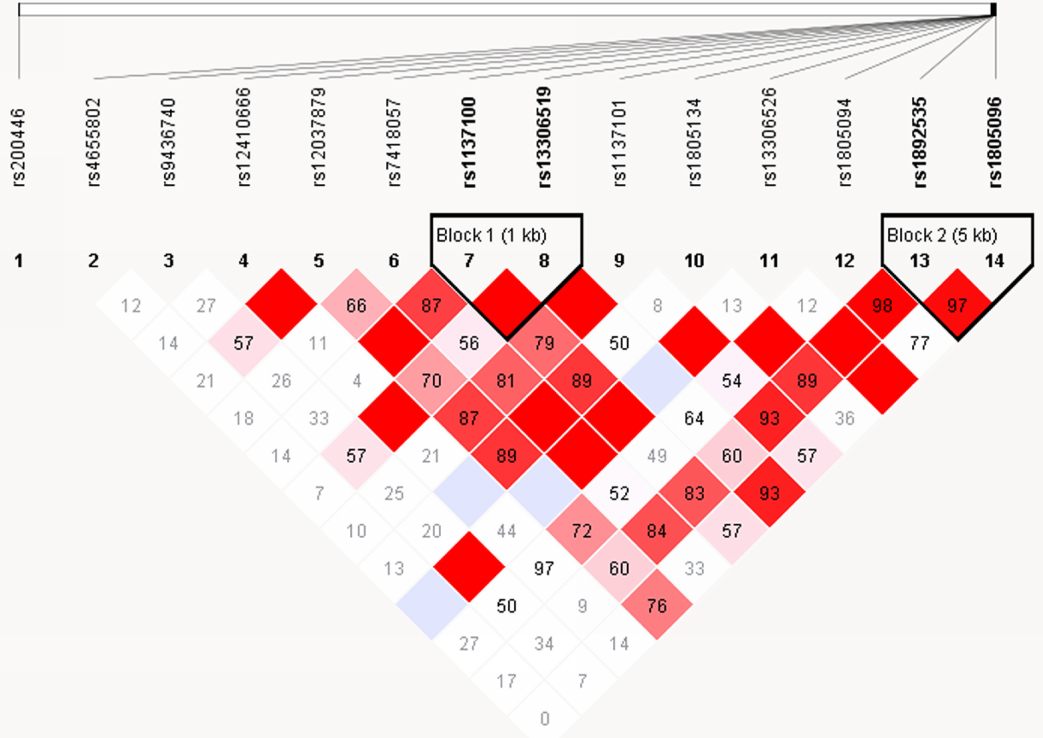
Figure 6: Linkage disequilibrium and haplotype analysis of LEPR SNPs in Mongolian subjects. The haploview software analysis shows two haplotypes among the 14 SNPs, namely block 1 that includes rs1137100 and rs13306519 and block 2 that includes rs1892535, and rs1805096. Note: The blocks are represented by triangles. The red portions represent strong linkage, whereas the white portions represent no linkage.
Association of LEPR SNPs with systolic and diastolic blood pressure
After adjusting for the confounding risk variables (gender, age, BMI, smoking, and alcohol consumption), rs1137100 GG (Lys109Arg) genotype was associated with SBP in Han population (P = 0.04). SBP decreased in G allele carriers at an average of –3.68 mmHg than the A allele individuals. For the Mongolian population, the rs1137100 (Lys109Arg) and rs1805134 polymorphisms were associated with DBP according to dominant genetic model (GG+AG vs. AA, P = 0.02; CT+TT vs. CC, P = 0.02; Table 7).
Table 7: Effects of LEPR SNP genotypes on SBP and DBP in Han and Mongolian subjects
Han population |
Mongolia population |
|||||||
|---|---|---|---|---|---|---|---|---|
SBP |
DBP |
SBP |
DBP |
|||||
SNPs |
OR (95% CI) |
Pa |
OR (95% CI) |
Pa |
OR (95% CI) |
Pa |
OR (95% CI) |
Pa |
Rs1805094 |
||||||||
CC |
1 (ref) |
1 |
1 |
1 |
||||
CG |
4.07 (–14.54–22.67) |
0.67 |
0.99 (–8.85–10.82) |
0.84 |
4.07 (–14.54–22.68) |
0.67 |
0.99 (–8.85–10.82) |
0.84 |
GG |
5.03 (–13.05–21.12) |
0.59 |
1.03 (–8.83–10.59) |
0.84 |
5.03 (–13.05–23.12) |
0.59 |
1.03 (–8.83–10.59) |
0.83 |
CG+GGVSCC |
–4.95 (–23.02–13.12) |
0.59 |
–1.03 (–10.58–8.50) |
0.83 |
–4.95 (–23.02–13.10) |
0.59 |
–1.03 (–10.58–8.52) |
0.83 |
CG+CCVSGG |
1.21 (–3.47–5.59) |
0.61 |
0.11 (–2.37–2.58) |
0.93 |
1.21 (–3.47–5.89) |
0.61 |
0.11 (–2.37 2.58) |
0.93 |
RS1805096 |
||||||||
CC |
1 |
1 |
1 |
1 |
||||
CT |
0.85 (–15.89–17.59) |
0.92 |
3.40 (–5.43–12.22) |
0.45 |
0.85 (–15.88–17.59) |
0.92 |
3.40 (–5.43–12.22) |
0.45 |
TT |
–0.58 (–17.12–15.97) |
0.95 |
4.44 (–4.04–13.41) |
0.29 |
–0.57 (–17.12–15.97) |
0.95 |
4.69 (–4.04–13.41) |
0.29 |
CT+TTVSCC |
0.28 (–16.25–16.81) |
0.97 |
–4.40 (–13.14–4.30) |
0.32 |
0.28 (–16.45–16.82) |
0.97 |
–4.23 (–13.14–4.30) |
0.32 |
CT+CCVSTT |
–1.40 (–4.66–1.86) |
0.40 |
1.40 (–0.33–3.12) |
0.11 |
–1.40 (–4.70–1.86) |
0.40 |
1.40 (–0.32–3.12) |
0.11 |
RS13306526 |
||||||||
CC |
1 |
1 |
1 |
|||||
CG |
–29.25 (–69.59–11.10) |
0.16 |
–4.02 (–25.33–17.20) |
0.71 |
–29.25 (–69.59–11.10) |
0.16 |
–4.02 (–25.33–17.30) |
0.71 |
GG |
– |
– |
– |
– |
||||
CC+CGVSGG |
1 |
1 |
||||||
CG+GGVSCC |
29.25 (–11.09–69.59) |
0.16 |
4.02 (–17.29–25.3) |
0.71 |
29.3 (–11.09–69.59) |
0.16 |
4.00 (–17.29–25.33) |
0.70 |
RS1137100 |
||||||||
AA |
1 |
1 |
1 |
1 |
||||
AG |
–6.05 (–15.20–3.09) |
0.19 |
1.55 (–3.29–6.38) |
0.53 |
–6.05 (–15.20–3.10) |
0.19 |
1.55 (–3.26–6.38) |
0.53 |
GG |
–3.68 (–12.64––5.28) |
0.04* |
2.87 (–2.45–7.02) |
0.34 |
–3.68 (–12.64–5.28) |
0.42 |
2.29 (–2.49–7.02) |
0.34 |
AG+GGVSAA |
4.41 (–4.51–13.33) |
0.33 |
–2.06 (–6.80–2.65) |
0.39 |
4.41 (–4.51–13.33) |
0.33 |
–2.06 (–6.77–2.60) |
0.02* |
AG+AAVSGG |
1.92 (–1.02–4.86) |
0.2 |
0.86 (–0.70–2.41) |
0.28 |
1.92 (–1.02–4.86) |
0.20 |
0.86 (–0.70–2.40) |
0.28 |
RS1137101 |
||||||||
AA |
1 |
1 |
1 |
1 |
||||
AG |
–1.04 (–12.99–10.21) |
0.81 |
–1.10 (–7.22–5.01) |
0.72 |
–1.39 (–12.99–10.21) |
0.81 |
–1.10 (–7.20–5.01) |
0.72 |
GG |
–1.04 (–12.36–10.28) |
0.86 |
0.35 (–5.62–6.32) |
0.91 |
–1.04 (–12.36–10.28) |
0.86 |
0.35 (–5.62–6.32) |
0.91 |
AG+GGVSAA |
1.11 (–10.18–12.10) |
0.85 |
–0.04 (–6.00–5.90) |
0.99 |
1.11 (–10.18–12.40) |
0.85 |
–0.04 (–6.00–5.90) |
0.99 |
AG+AAVSGG |
0.27 (–2.99–3.52) |
0.87 |
1.38 (–0.33–3.10) |
0.11 |
0.27 (–2.99–3.52) |
0.87 |
1.38 (–0.33–3.10) |
0.11 |
RS1805134 |
||||||||
CC |
1 |
1 |
1 |
|||||
CT |
4.64 (–35.85–45.14) |
0.91 |
–2.50 (–24.01–18.97) |
0.82 |
2.43 (–38.26–43.12) |
0.91 |
–2.53 (–24.01–18.90) |
0.92 |
TT |
4.64 (–35.85–45.14) |
0.82 |
–1.80 (–23.16–19.61) |
0.87 |
4.60 (–35.85–45.14) |
0.82 |
–1.78 (–23.1–19.60) |
0.87 |
CT+TTVSCC |
–4.35 (–44.84–36.14) |
0.83 |
1.88 (–19.50–23.00) |
0.86 |
–4.35 (–44.84–36.14) |
0.83 |
1.88 (–19.5––3.25) |
0.02* |
CT+CCVSTT |
2.25 (–2.35–6.84) |
0.34 |
0.72 (–1.72–3.16) |
0.56 |
2.25 (–2.35–6.84)) |
0.34 |
0.70 (–1.72–3.16) |
0.56 |
RS19436740 |
||||||||
AA |
1 |
1 |
1 |
|||||
AT |
–0.21 (–3.12–2.69) |
0.88 |
0.36 (–1.18–1.89) |
0.65 |
–0.21 (–3.12–2.69) |
0.89 |
0.36 (–1.18–1.89) |
0.65 |
TT |
–1.13 (–9.06–6.79) |
0.78 |
0.08 (–4.12–4.28) |
0.97 |
–1.13 (–9.06–6.80) |
0.78 |
0.08 (–4.12–4.28) |
0.97 |
AT+AAVSTT |
–1.06 (–8.93–6.80) |
0.79 |
–0.04 (–4.20–4.12) |
0.99 |
–1.06 (–8.93–6.80) |
0.79 |
–0.40 (–4.2–4.12) |
0.99 |
AT+TTVSAA |
0.29 (–2.53–3.12) |
0.84 |
–3.33 (–1.82–1.16) |
0.66 |
0.29 (–2.53–3.11) |
0.84 |
–0.33 (–1.82–1.16) |
0.66 |
RS13306519 |
||||||||
CC |
1 |
1 |
1 |
|||||
CG |
–2.48 (–5.57–0.60) |
0.14 |
–0.92 (–2.56–0.71) |
0.27 |
–2.49 (–5.57–0.60) |
0.11 |
–0.92 (–2.56–0.71) |
0.27 |
GG |
–1.15 (–8.67–6.38) |
0.77 |
2.18 (–1.80–6.16) |
0.28 |
–1.15 (–8.67–6.38) |
0.77 |
2.18 (–1.8–6.16) |
0.28 |
CG+CCVSGG |
–0.47 (–7.95–7.01) |
0.90 |
2.40 (–1.53–6.39) |
0.23 |
–0.47 (–7.95–7.01) |
0.90 |
2.40 (–1.53–6.39) |
0.23 |
CG+GGVSCC |
2.33 (–0.62–5.29) |
0.12 |
0.57 (–0.99–2.14) |
0.48 |
2.30 (–0.62–8.29) |
0.12 |
0.57 (–0.99–2.14) |
0.48 |
RS12410666 |
||||||||
AA |
1 |
1 |
1 |
1 |
||||
AG |
0.16 (–20.36–20.68) |
0.99 |
–1.30 (–12.16–9.56) |
0.81 |
–3.02 (–23.21–17.18) |
0.77 |
–1.30 (–12.16–9.56) |
0.81 |
GG |
–3.02 (–23.21–17.18) |
0.77 |
–2.86 (–13.55–7.24) |
0.60 |
0.16 (–20.36–20.68) |
0.98 |
–2.86 (13.55–7.82) |
0.60 |
AG+GGVSAA |
2.64 (–17.56–22.85) |
0.80 |
2.68 (–8.00–13.37) |
0.62 |
2.64 (–17.86–22.85) |
0.80 |
2.66 (–1.01–3.37) |
0.62 |
AG+AAVSGG |
–3.17 (–7.25–0.91) |
0.13 |
–1.61 (–3.78–0.56) |
0.15 |
–3.1 (–7.25–0.91) |
0.13 |
–1.61 (–3.78–0.56) |
0.15 |
RS12037879 |
||||||||
AA |
1 |
1 |
1 |
1 |
||||
AG |
–1.16 (–4.07–1.75) |
0.43 |
0.06 (–4.23–4.35) |
0.98 |
2.01 (–5.92–9.94) |
0.62 |
0.06 (–4.23–4.35) |
0.98 |
GG |
4.44 (–9.06–1794) |
0.52 |
–0.20 (–4.40–4.00) |
0.93 |
0.71 (–7.40–8.81) |
0.87 |
––0.20 (–4.40–4.0) |
0.93 |
AG+GGVSAA |
–1.57 (–9.44–6.30) |
0.70 |
0.11 (–4.05–4.28) |
0.96 |
–1.57 (–9.44–6.30) |
0.69 |
0.11 (–4.05–7.28) |
0.96 |
AG+AAVSGG |
1.37 (–1.46+4.20) |
0.34 |
–0.26 (–1.76–1.24) |
0.74 |
1.37 (–1.46–4.20) |
0.34 |
–0.26 (–1.76–1.24) |
0.74 |
RS200446 |
||||||||
AA |
1 |
1 |
1 |
|||||
AG |
0.34 (–3.16–3.84) |
0.85 |
0.89 (–9.66–2.74) |
0.35 |
0.34 (–3.16–3.84) |
0.85 |
0.89 (–0.97–2.74) |
0.35 |
GG |
1.04 (–2.74–4.81) |
0.59 |
0.27 (–1.73–2.27) |
0.79 |
1.04 (–2.74–4.81) |
0.59 |
0.27 (–1.73–2.27) |
0.79 |
AG+GGVSAA |
–0.62 (–3.89–2.66) |
0.71 |
–0.64 (–2.37–1.09) |
0.47 |
–0.62 (–3.89–2.66) |
0.71 |
–0.64 (–2.38–1.09) |
0.47 |
AG+AAVSGG |
0.80 (–2.12–3.73) |
0.59 |
–0.34 (–1.89–1.21) |
0.67 |
0.80 (–2.12–3.73) |
0.59 |
–0.34 (–1.89–1.21) |
0.67 |
*denotes p < 0.05; aResults of linear regression analysis.
DISCUSSION
Leptin receptor (LEPR) is widely distributed in all human tissues and plays an important biological role with leptin. Hence, LEPR gene mutations can directly affect cellular function in response to leptin [11]. LEPR gene polymorphisms are an active area of research in relation to human diseases [12–14]. LEPR gene polymorphisms are associated with disorders related to lipid metabolism and insulin resistance in various populations [15–16]. However, the association of LEPR tagSNPs (rs1805094, rs1805096, rs13306526, rs1137110, rs1137101, rs1805134, rs9436740, rs4655802, rs4655802, rs13306519, rs12410666, rs7418057, rs12037879, rs200446, and rs1892535) with EH risk is not known, especially in the Mongolian and Han populations in China.
Although the precise pathogenic mechanism of hypertension is not known, studies have postulated that environmental stress factors influence changes in expression of EH susceptible genes. Moreover, different ethnic populations may exhibit variations in EH susceptibility due to inherent gene polymorphisms. Hence, we investigated the association of various polymorphisms in the LEPR gene with EH susceptibility in the Northern Han and Mongolian Chinese populations. Moreover, we analyzed the association between multiple LEPR SNPs and EH susceptibility.
Blood pressure is regulated by the sympathetic nervous system. Leptin increases the sympathetic nerve activity in rodents and humans. Leptin increases blood pressure in rodents through the hypothalamic and extra-hypothalamic regions [17]. Systolic blood pressure was lower in leptin-deficient and leptin receptor-deficient humans [18].
Studies investigating the relationship between LEPR gene polymorphisms such as rs1137100 (Lys109Arg), rs1137101 (Gln223Arg), rs1805094 (Lys656Asn) and EH risk in different ethnic groups showed contradictory results. Gu et al. performed a case-control study and showed that rs1137101 A (Gln223Arg) allele carriers showed higher diastolic blood pressure than GG carriers after adjustment for age and sex (P = 0.035, OR = 1.549, 95% CI 1.031–2.036) [19, 20]. Li et al. showed that the rs1137101 A (Gln223Arg) allele carriers correlated with EH [21]. In another study, Wiedemann et al. failed to identify any association between R223Q site of LEPR gene and EH in the German population [22]. Rosmond et al. suggested that rs1137100 (Lys109Arg) and rs1137101 (Gln223Arg) protected from hypertension in the Swedish population [23]. Farias et al. showed that women with the rs7799039 GG genotype were associated with higher BP levels throughout pregnancy and postpartum period than those with the AA genotype [24].
In the current study, we analyzed these loci in Chinese Han individuals from HapMap(www.hapmap.org). Then, we selected 8 tagSNPs using HaploView and analyzed new SNPs related to EH. In this case-control study, we focused on the Han and Mongolian populations in Mongolia, China. This is the first study on the Mongolian population, which harbors a high-risk population suffering from EH probably because of their ethnic background, drinking habits, and meat consumption.
In our study, none of the LEPR gene polymorphisms that we analyzed were associated with EH in the Han population after adjusting for gender, age, BMI, smoking, and drinking. This finding was inconsistent with the previous report by Gu et al. However, in the Mongolian population, rs1137100 GG, rs1805096 CT, rs1137101 AG rs1805134 CT genotypes were protective and rs12037879 AA and rs12037879 AG genotypes were risk factors for EH. We also showed that rs1137100 GG genotype was associated with SBP in Han population (P = 0.04) than AA allele carriers. In the Mongolian population, rs1137100 and rs1805134 polymorphisms were associated with DBP in the dominant genetic model (GG+AG vs. AA, P = 0.02; CT+TT vs. CC, P = 0.02). Gu et al. reported that subjects carrying the A allele of rs1137101 (Gln223Arg) were associated with hypertension than GG carriers (P = 0.001). The reasons for the inconsistent results could be as follows: (1) Gu et al. studied Han subjects from southern China, whereas our study was based on the northern Han population and Inner Mongolia of China. (2) SBP and DBP for normotensive controls in our study were <120 mmHg and <90 mmHg, respectively, whereas Gu et al. used SBP <130 mmHg and DBP <85 mmHg as cutoffs. (3) We considered confounding factors such as smoking, alcohol consumption, and BMI which were not part of the study by Gu et al. Smoking and alcohol intake are causative factors in the development of hypertension [25]. De Luis Roman and Liu Y et al. showed that SBP decreased significantly in the GG homozygotes of rs1805094 (Lys656) [26, 27], but, our study did not show any correlation. Therefore, differences in ethnic background could be the primary cause of variations observed in the various studies.
Hypertension is a disease caused by multiple genes and environmental factors. Thus, the role of a single site in the process of causing EH may not be obvious. In a recent study, it was shown that the rs1137101 (Gln223Arg) polymorphism affected leptin signaling via STAT3 and led to attenuation of the anti-apoptotic effects of leptin [28, 29]. The functional aspects of other polymorphisms have not yet been studied.
Haplotype analysis is more powerful than studying single polymorphisms in genetic association studies since interactions between multiple genetic markers within a haplotype may lead to disease susceptibility rather than single gene polymorphisms [30]. We found a strong LD in rs1892535 and rs1805096 in Mongolian population with individuals carrying the GT haplotype associated with higher risk of EH (P = 0.0034). However, we did not observe any LD in Han population. Therefore, the diversity in the results between the Han and Mongolian populations are most probably related to their ethnic backgrounds, including lifestyle and other socioeconomic factors that could increase or decrease blood pressure in combination with genetic factors.
In conclusion, our study showed association of multiple LEPR SNPs with EH risk, especially in the Mongolian population. We showed that rs1137100 GG genotype was associated with high SBP in Han population, whereas rs113710, rs1137101 and rs12037879 SNPs were associated with EH in the Mongolian population. Moreover, the GT haplotypes of rs1892535 and rs1805096 was associated with EH risk in Mongolian population. These findings demonstrate that leptin and its receptor are potential therapeutic targets for prevention and treatment of EH in Mongolian and Han populations in Northern China
MATERIALS AND METHODS
Study subjects
We analyzed 1952 Mongolian and Han study subjects, aged 20–90 y, in this study. These included 658 Mongolian EH patients and 403 Mongolian normotensive controls from Xilin Gol League and 411 Han EH patients and 480 Han normotensive controls from the Railway Hospital and Physical Examination Center in Inner Mongolia, China. The study subjects hailed from a family that lived in Inner Mongolia for at least three generations without a history of mixed marriage. This ethnic group was designated as Mongoloids. The subjects were diagnosed for EH according to the WHO/ISH (1999) diagnostic standards, which included a systolic blood pressure (SBP) of at least 140 mmHg and/or diastolic blood pressure (DBP) of at least 90 mmHg or antihypertensive treatment. The criteria for selecting normotensive controls included SBP <140 mmHg and/or DBP <90 mmHg as well as absence of any previous diagnosis with EH. Participants with stroke, coronary heart disease, diabetes, kidney failure, thyroid gland disease, or excessive drinking were excluded from the study.
The clinicopathological data for all the subjects was obtained from their medical records and included age, gender, alcohol consumption (≥50 g or more alcohol/day for at least 1 y), tobacco smoking (≥1 cigarette/day for at least 1 year), height, and weight. The body mass index (BMI) was defined as the person’s weight in kilograms (kgs) divided by the square of height in meters (m2). The blood pressure was measured at rest thrice with a 2-minute interval between each measurement. SBP was recorded to the nearest 2 mmHg at the appearance of the first Korotkoff sound (phase I), and DBP was recorded to the nearest 2 mmHg at the disappearance of the fifth Korotkoff sound (phase V). The mean of 3 consecutive physician-obtained SBP and DBP values were used for analysis.
Blood samples (10ml) were obtained from all study participants. The levels of total plasma cholesterol (TC), triglycerides (TG), high-density lipoprotein cholesterol (HDL-C), and low-density lipoprotein cholesterol (LDL-C) were measured within 8 h of drawing blood at a local hospital. The blood samples were preserved in EDTA-coated tubes at –80° C until further use. Informed consent was obtained from all study subjects. The study protocols were approved by the Ethics Committee of the Affiliated Hospital of Inner Mongolia Medical University.
DNA extraction and tagSNPs genotyping
We chose 14 tagSNPs of LEPR (rs1805094, rs1805096, rs13306526, rs1137110, rs1137101, rs1805134, rs9436740, rs4655802, rs4655802, rs13306519, rs12410666, rs7418057, rs12037879, rs200446, and rs1892535) for genotyping. These SNPs were selected based on pairwise r2 ≥ 0.5 and minor allele frequency (MAF) ≥0.05 from the Chinese HapMap database (http://www.hapmap.org) [31].
Genomic DNA was extracted from peripheral blood leukocytes using a commercial blood DNA extraction kit (Genomic DNA purification kit; Aidlab Biotechnologies Co., Ltd, Beijing, China) and stored at –20° C. Polymerase chain reaction-ligase detection reaction (PCR-LDR) was used to genotype all the 14 tagSNPs of LEPR. The primers were synthesized from Shanghai Biowing Applied Biotechnology Co., Ltd see Table 8. 200 μl of dNTP (20 mM / each), 20 μl of Taq enzyme (5 U/μl, TaKaRa Taq™ Hot Start Version, 1000 U), 400 μl of Q-solution (4×), and 40 μl of 10 ml of PCR-buffer (10×), 60 μl of Mg2 + primer (5 pM) and finally add 980 μl of deionized water. Fully mixed and centrifuged, and then take 19 ul sub-packaged in 200 ul PCR reaction tube, and finally add 1ul of genomic DNA. The PCR amplification included initial denaturation at 95° C for 15 min followed by 35 cycles of 94° C for 30s, 56° C for 1 min, 72° C for 1 min, and final extension at 72° C for 7 min. Then, 2 μl of the PCR product was assessed by 3.0% agarose gel electrophoresis in 0.5 × TBE.
Table 8: PCR primers for LEPR TagSNPs
TagSNPs |
PCR-primer sequence (5′→3′) |
PCR length |
|
|---|---|---|---|
rs1805094 |
TGAGAGGACCTGAATTTTGGAGA |
CAGGATTGTTGAGCTTTCCGA |
186 |
rs1805096 |
TGAGAATGTGAGGTGTGGTGA |
AGGACGAAAGCCAGAGACAA |
241 |
rs13306526 |
TCATCCCATATCTGAGCCCA |
GAAGACACAACGCAGCTTGA |
194 |
rs1137100 |
ACTGTTGCTTTCGGAGTGAGC |
AGCTAATGCTTACCTATTTGTTG |
123 |
rs1137101 |
ACAGCCAAACTCAACGACAC |
AGCAAAGTGAGATAAGCTAGCA |
204 |
rs1805134 |
TGTAACTCTGGAATGTGTTGTGA |
GGCTTTGAGGAATTTTCTCAGC |
244 |
rs9436740 |
AAAGCACTTTAGGCACCAGG |
ACCATAATGTACCATGTGTG |
96 |
rs4655802 |
AACAGTCCTTTCTCTGGAGC |
GTGGTACTTTGTAACGGCAG |
76 |
rs13306519 |
CAAAAACCATCTGAACAACTC |
GCAATGGAAGTTGTATCAG |
77 |
rs12410666 |
GATACATACATAAATGCTGG |
TGCCTTGTGAGGCAGTAAAC |
62 |
rs7418057 |
ATCACTTAACTGAGGAGACC |
CTGGATTGCTTTGATGAAAC |
99 |
rs12037879 |
CACATAAAGTGCAATTTGTGG |
CTAATTAAAAACACACAAGC |
95 |
rs200446 |
TGACTGCTCTCCCACAGCAT |
GCTTTGTCAAATGTGATGAG |
82 |
rs1892535 |
GATCTATACTCTTCCAATTGT |
AAGAAGATGATCTGAGAGGG |
86 |
For ligation reaction, we diluted the PCR product with equal volume of double-distilled water. The reaction master mix was comprised of 100 μl buffer (10×), 100 μl probe mix, 5 μl ligase, and 695 μl of deionized water. Then, 9 μl of this reaction master mix was mixed with1 μl PCR product and subjected to PCR-LDR, which included initial denaturation at 95° C for 2 min, followed by 35 cycles of 94° C for 30 s and 50° C for 2 min.
The last step consisted of 1.1 μl LDR reaction product mixed with 0.6 μl ABI GS-500 l ROX fluorescently labeled molecular weight standards and 10 μl hidi mixture. The reaction mixture was heat denatured at 95° C for 2 min, followed by rapid cooling on ice and electrophoresed in the ABI3730 sequencer. The genotyping and data analysis was performed by the Gene Mapper software.
Statistical analysis
The comparison of clinicopathological characteristics between EH and control groups was performed using the Wilcoxon rank test. The data were expressed as mean ± S.D ( ). The skewed distribution data were expressed by the median and interquartile range (M, IQ). The HaploView 4.0 software was used to analyze the genotype distributions of all the LEPR tagSNPs that deviated from the Hardy-Weinberg equilibrium (HWE). The allelic and genotypic frequencies between the groups were compared by unconditional logistic regression analysis. The association between EH and BMI corresponding to specific SNPs were described by the odds ratio (OR) and 95% confidence interval (95% CI). The dominant and recessive models were used to assess the association between LEPR gene polymorphisms and EH. The main homozygous genotype was used as a reference group for analysis. Multiple linear regression analysis was used to assess the association between genotype, allele, dominant model, recessive model, and SBP/DBP. MDR software was used to analyze the correlation between gene and environmental factors as well as effects of interaction between genes.
SPSS 20.0 software (SPSS Inc., Chicago, IL, USA) was used to perform the statistical analysis. P < 0.05 was considered statistically significant. HaploView software was used to calculate the coefficient D’ of linkage disequilibrium (LD) test and to construct the haplotypes. Haplotypes with frequencies <3% in the whole sample were considered rare. Linkage disequilibrium was considered to be strong when D > 0.8.
ACKNOWLEDGMENTS
This work was supported by National Natural Science Foundation of China No. 81260058. We thank the Clinical Medical Research Center of Affiliated Hospital of Inner Mongolia Medical University, Inner Mongolia Autonomous Region, China for their help in the study. We also thank Prof. Su Xiulan for his guidance.
CONFLICTS OF INTEREST
The authors declare that there are no conflicts of interest.
REFERENCES
1. Reddy KS. Cardiovascular disease in non-Western counties. N Engl J Med. 2004; 350:2438–40.
2. Prasanna Kumar KM. Metabolic syndrome. Int J Diabetes Dev Ctries. 2011; 31:185–187.
3. Singh M, Singh AK, Pandey P, Chandra S, Singh KA, Gambhir IS. Molecular genetics of essential hypertension. Clin Exp Hypertes. 2016; 38:268–77.
4. Freitas SR, Cabello PH, Moura-Neto RS, Dolinsky LC, Bóia MN. Combined analysis of genetic and environmental factors on essential hypertension in a brazilian rural population in the Amazon region. Arquivos Brasileiros De Cardiologia. 2007; 88:447.
5. Zhu LX, Dong Z. Research advancement of obesity gene protein-leptin. Chinese Journal of New Drugs and Clinical Remedies. 2003.
6. Denver RJ, Bonett RM, Boorse GC. Evolution of Leptin Structure and Function. Neuroendocrinology. 2011; 94:21–38.
7. do Carmo JM, da Silva AA, Wang Z, Fang T, Aberdein N, de Lara Rodriguez CE, Hall JE. Obesity-Induced Hypertension: Brain Signaling Pathways. Curr Hypertens Rep. 2016; 18:58.
8. Tang-Christensen M, Havel PJ, Jacobs RR, Larsen PJ, Cameron JL. Central administration of leptin inhibits food-intake and activates the sympathetic nervous system in rhesus macaques. J Clin Endocrinol Metab. 1999; 84:711–7.
9. Matsuoka N1, Ogawa Y, Hosoda K, Matsuda J, Masuzaki H, Miyawaki T, Azuma N, Natsui K, Nishimura H, Yoshimasa Y, Nishi S, Thompson DB, Nakao K. Human leptinreceptor gene in obese Japanese subjects: evidence against either obesity-causing mutation or association of sequence variants with obesity. Diabetologia. 1997; 40:1204–1210.
10. Carlson CS, Eberle MA, Rieder MJ, Yi Q, Kruglyak L, Nickerson DA. Selecting a maximally informative set of single-nucleotide polymorphisms for association analyses using linkage disequilibrium. Am J Hum Genet. 2004; 74:106–20.
11. An BQ, Lu LL, Yuan C, Xin YN, Xuan SY. Leptin Receptor Gene Polymorphisms and the Risk of Non-Alcoholic Fatty Liver Disease and Coronary Atherosclerosis in the Chinese Han Population. Hepat Mon. 2016; 16:e35055. https://doi.org/10.5812/hepatmon.35055.
12. Furusawa T1, Naka I, Yamauchi T, Natsuhara K, Kimura R, Nakazawa M, Ishida T, Inaoka T, Matsumura Y, Ataka Y, Nishida N, Tsuchiya N, Ohtsuka R, et al. The Q223R polymorphism in LEPR is associated with obesity in Pacific Islanders. Hum Genet. 2010; 127:287–294. https://doi.org/10.1007/s00439-009-0768-9.
13. Yiannakouris N, Yannakoulia M, Melistas L, Chan JL, Klimis-Zacas D, Mantzoros CS. The Q223R polymorphism of the leptin receptor gene is significantly associated with obesity and predicts a small percentage of body weight and body composition variability. J Clin Endocrinol Metab. 2001; 86:4434–4439.
14. Zain SM, Mohamed Z, Mahadeva S, Cheah PL, Rampal S, Chin KF, et al. Impact of leptin receptor gene variants on risk of non-alcoholic fatty liver disease and its interaction with adiponutrin gene. J Gastroenterol Hepatol. 2013; 28:873–9.
15. An BQ, Lu LL, Yuan C, Xin YN, Xuan SY. Leptin Receptor Gene Polymorphisms and the Risk of Non-Alcoholic Fatty Liver Disease and Coronary Atherosclerosis in the Chinese Han Population. Hepat Mon. 2016; 16:e35055. https://doi. org/10.5812.
16. Becer E, Mehmetçik G, Bareke H, Serakıncı N. Association of leptin receptor gene Q223R polymorphism on lipid profiles in comparison study between obese and non-obese subjects. Gene. 2013; 529:16–20.
17. Grassi G. Leptin, the sympathetic nervous system and blood pressure: the tale is still without an end. Journal of Hypertension, 2014, 32:738–739.
18. Simonds SE, Pryor JT, Cowley MA. Does leptin cause an increase in blood pressure in animals and humans. Curr Opin Nephrol Hypertens. 2017; 26:20–25.
19. Gu P, Jiang W, Chen M, Lu B, Shao J, Du H, Jiang S. Association of leptin receptor gene polymorphisms and essential hypertension in a Chinese population. J Endocrinol Invest. 2012; 35:859–65.
20. Lian Y, Tang Z, Xie Z, Chen Z. Leptin receptor gene polymorphisms and risk of hypertension: a meta-analysis. Int J Clin Exp Med. 2015; 8:14277–82.
21. CC LI, XM Wang, LX Yang. Study on the polymorphism of leptin receptor gene and cardiovascular and related diseases. Int J Cardiol. 2011; 38:281–283. China.
22. Wiedemann A, Vocke F, Fitzgerald JS, Markert UR, Jeschke U, Lohse P, Toth B. Leptingene (TTTC) (n) microsatellite polymorphism as well as leptin receptor R223Q and PPARgamma2 P12A substitutions are not associated with hypertensive disorders in pregnancy. Am J Reprod Immunol. 2010; 63:310–7.
23. Rosmond R, Chagnon YC, Holm G, Chagnon M, Pérusse L, Lindell K, Carlsson B, Bouchard C, Björntorp P. Hypertension in obesity and the leptin receptor gene locus. J Clin Endocrinol Metab. 2000; 85:3126–31.
24. Farias DR, Franco-Sena AB, Rebelo F, Salles GF, Struchiner CJ, Martins MC, Kac G. Polymorphisms of Leptin (G2548A) and Leptin Receptor (Q223R and K109R) Genes and Blood Pressure During Pregnancy and the Postpartum Period: A Cohort. Am J Hypertens. 2017; 30:130–140.
25. Kwon Y, Norby FL, Jensen PN, Agarwal SK, Soliman EZ, Lip GY, Longstreth WT Jr, Alonso A, Heckbert SR, Chen LY. Association of Smoking, Alcohol, and Obesity with Cardiovascular Death and Ischemic Stroke in Atrial Fibrillation: The Atherosclerosis Risk in Communities (ARIC) Study and Cardiovascular Health Study (CHS). PLoS One. 2016; 11:e0147065.
26. De Luis Roman D, de la Fuente RA, Sagrado MG, Izaola O, Vicente RC. Leptin receptor Lys656Asn polymorphism is associated with decreased leptin response and weight loss secondary to a lifestyle modification in obese patients. Arch Med Res. 2006; 37:854–9.
27. Liu Y, Lou YQ, Liu K, Liu JL, Wang ZG, Wen J, Zhao Q, Wen SJ, Xiao L. Role of leptin receptor gene polymorphisms in susceptibility to the development of essential hypertension: a case–control association study in a Northern Han Chinese population. J Hum Hypertens. 2014; 28:551–6.
28. Qu Y, Yang Z, Jin F, Sun L, Feng J, Tang L, Zhang C, Zhu X, Shi X, Sun H, Wang B, Wang L. The haplotype identified in LEPR gene is associated with type 2 diabetes mellitus in northern Chinese. Diabetes Res Clin Pract. 2008; 81:33–7.
29. Mackey-Lawrence NM, Guo X, Sturdevant DE, Virtaneva K, Hernandez MM, Houpt E, Alan Sher, Stephen F. Porcella, William A. Petri Jr. Effect of the leptin receptor Q223R polymorphism on the host transcriptome following infection with Entamoeba histolytica. Infect Immun. 2013; 81:1460–70.
30. Cardon LR, Abecasis GR. Using haplotype blocks to map human complex trait loci. Trends Genet. 2003; 19:135–40.
31. Ding X, Li M, Gu H, Peng X, Zhang Z, Wu F. Detecting SNP combinations discriminating human populations from HapMap data. IEEE Trans Nanobioscience. 2015; 14:220–8.