
INTRODUCTION
Despite the considerable efforts in the past decades to improve cancer treatment, the development of resistance towards anticancer therapy remains one of the most challenging situations. Cancer cells become resistant to various chemotherapeutic and xenobiotic drugs showing a trait known as multidrug resistance (MDR) [1]. Resistance even occurs in the most recent personalized anticancer therapies, which target specific molecular determinants in tumor cells [2]. The multiple factors behind cancer drug resistance clearly reflect its complexity. Host and tumor genetic alterations, signaling pathway alterations, epigenetic changes and tumor environment all seem to contribute to the fatal outcome of many tumor diseases [3–5]. Many relevant mechanisms for cytotoxic drug resistance have been described and discussed [1, 6, 7], among which the overexpression of the ATP-binding cassette (ABC) transporter proteins belongs to the most prominent MDR mechanisms. These membrane proteins represent one of the largest gene families in human beings and are responsible for the reduction of intracellular accumulation of many classical anticancer drugs below the effective level leading to drug resistance and treatment failure [8, 9]. P-glycoprotein (ABCB1/MDR1) is one of the most studied ABC transporters that are overexpressed in many tumor types [10]. P-glycoprotein consumes energy derived from ATP hydrolysis to expel an extremely broad range of structurally and functionally unrelated cytotoxic agents out of cancer cells such as taxanes (e.g. paclitaxel and docetaxel), Vinca alkaloids (e.g. vinblastine, vincristine, vindesine, vinorelbine), epipodophyllotoxins (e.g. teniposide, etoposide) and anthracyclines (e.g. doxorubicin, daunorubicin, epirubicin, idarubicin) [8]. Numerous inhibitors have been identified for P-glycoprotein’s efflux function [11–13]. Another well-known MDR-conferring ABC transporter is the breast cancer resistance protein (ABCG2/BCRP). It is associated with the MDR phenotype by active efflux to many approved conventional anticancer drugs and targeted small therapeutic molecules. For instance, doxorubicin, daunorubicin, mitoxantrone, and methotrexate are substrates for BCRP [8]. BCRP mediates MDR in breast, small cell lung, ovarian, colon, gastric or intestinal cancers. Besides, a strong correlation between high ABCG2 expression and poor prognosis of leukemia patients has been described [14]. ABCB5 is another ATP-binding MDR transporter that recently gathered attention. It mediates resistance to 7-Cl camptothecin and doxorubicin in human malignant melanoma [15]. Approaches of ABCB5 blockade may provide therapeutic benefits, which are still under development.
It is apparent that more than one MDR mechanism can be present in cancer cells. The oncogenic gain of function of the tumor suppressor gene TP53 due to the mutations is of great significance in cancer recurrence and resistance [16]. The accumulation of mutant TP53 has been observed in many human tumors, and its contribution in the evolvement of cancer stem cells is noteworthy. The latter has been considered as tumor reservoir with self-protection characteristics that mediates MDR [17]. The role of mutant TP53 for drug resistance may coincidence with its ability to mediate sustainable activation of the epidermal growth factor receptor (EGFR) pathway [18]. The expression of the EGFR gene occurs in a variety of tumors, including prostate, breast, gastric, colorectal, and ovarian carcinoma and affects treatment success [19]. Activation of EGFR signal transduction pathway leads to multiple biological processes such as gene expression and cellular proliferation, that eventually support tumor progression and promote oncogenesis [20]. More recently, TP53 has been recognized as treatment target to identify compounds that specifically target mutated TP53 [16]. Another resistance mediator is the transcription factor nuclear factor kappa-light-chain-enhancer of activated B cells (NF-κB), which is a key regulator of immune and inflammatory responses. NF-κB regulates the expression of genes involved in the control of cellular proliferation and apoptosis [21]. The constitutive activation of NF-κB in some tumors enhanced the expression of anti-apoptotic and MDR genes, adding a new dimension to the MDR profile [22]. It is important to point out that tumor cells reprogram and modulate their signaling pathways to achieve metabolic adaptation, in order to rapidly proliferate and survive. Targeting cellular metabolism has been considered as novel strategy for cancer treatment [23].
New agents that are less susceptible to known resistance mechanisms or that even contribute to reverse drug resistance phenotypes are urgently needed. In this context, plant-derived compounds served as rich source for the development of novel therapeutic anticancer agents. Such evidently successful compounds are Vinca alkaloids from Catharanthus roseus G. Don. (Apocynaceae), the terpene paclitaxel from Taxus brevifolia Nutt. (Taxaceae), the lignan podophyllotoxin isolated from Podophyllum peltatum L. (Berberidaceae) and the DNA topoisomerase I inhibitor camptothecin from Campototheca acuminata Decne. (Nyssaceae). A promising medicinal plant in this area is Azadirachta indica (family: Meliceae), commonly known as Neem Tree. This tree is native to India and the Indian subcontinent with a wide distribution in tropical areas [24]. Nimbolide is one of the limonoids that has been isolated from Neem seeds and leaves. It has an interesting chemopreventive and therapeutic profile against tumor cells [25]. Remarkable cytotoxic effects were observed in cell lines derived from leukemia, colon cancer, prostate cancer, glioblastoma multiforme, breast cancer and others [26]. Nimbolide was found to induce anti-proliferation effect mediated by downregulation of cyclin-dependent kinases (CDKs) and/or cyclin molecules causing cell cycle arrest [27]. Induction of apoptosis through both intrinsic and extrinsic pathways has been reported [28]. Nimbolide also targets diverse signaling cascades such as MAPK (ERK1/2), PI3K/Akt, Wnt/β-catenin and JAK2/STAT3, resulting in cell growth abrogation and anticancer effect [29]. Moreover, literature evidence indicats that nimbolide reduces angiogenesis and migration, in addition to suppression of tumorigenesis [25, 30, 31].
To best of our knowledge, the activity of nimbolide towards MDR phenotypes has been not yet investigated. This study was designed to explore the cellular responsiveness of nimbolide in sensitive and drug-resistant cell lines that especially overexpress classical MDR genes, namely ABC transporter proteins (ABCB1, ABCB5, ABCG2), TP53 or EGFR. Since P-glycoprotein-overexpressing cells showed remarkable sensitivity compared to their sensitive counterparts in our investigations, we further explored the underlying molecular mechanisms. The effect of nimbolide towards NF-κB was also evaluated. Lastly, the NCI cell line panel was used to identify putative molecular factors that may determine the response of tumor cells to nimbolide.
RESULTS
Cytotoxicity assays for nimbolide towards MDR-expressing cell lines
Different concentrations of nimbolide (from 0.001 μM to 100 μM) were used to perform resazurine assays. Interesting results came from testing the sensitivity of multidrug-resistant ABCB1/MDR1-expressing CEM/ADR5000 and parental CCRF-CEM leukemia cells. Nimbolide showed hypersensitivity towards CEM/ADR5000 cells with an IC50 value of 0.3 (± <0.01) μM compared to 17.4 (± 0.6) μM in CCRF-CEM cells, displaying a phenomenon known as collateral sensitivity [32]. The nimbolide activity was also tested in breast cancer cells transduced with cDNA for ABCG2/BCRP and compared with sensitive cells transduced with a control vector. The IC50 values for sensitive and resistant cell lines were 4.7 (± 0.05) μM and 3.7 (± 0.2) μM, respectively, indicating that cellular responsiveness to nimbolide may not be relevant to ABCG2/BCRP expression. In HEK293 cells, nimbolide was unexpectedly recognized as a substrate for ABCB5-transfected cells, with an IC50 value of 14.5 (± 0.3) μM compared to 0.25 (± 0.02) μM for the sensitive non-transfected ones. Furthermore, the cytotoxicity curves of nimbolide against glioblastoma and colon sensitive and resistant cell lines were comparable (1.12 (± <0.01) μM) for U87.MG and 3.4 (± 0.1) μM for U87.MGΔEGFR, 0.9 (± 0.05) μM for HCT116 p53+/+ and 1.8 (± 0.1) μM for HCT116 p53−/−). Hence, EGFR and TP53 may not be related to nimbolide activity. All concentration-dependent curves are depicted in Figure 1.
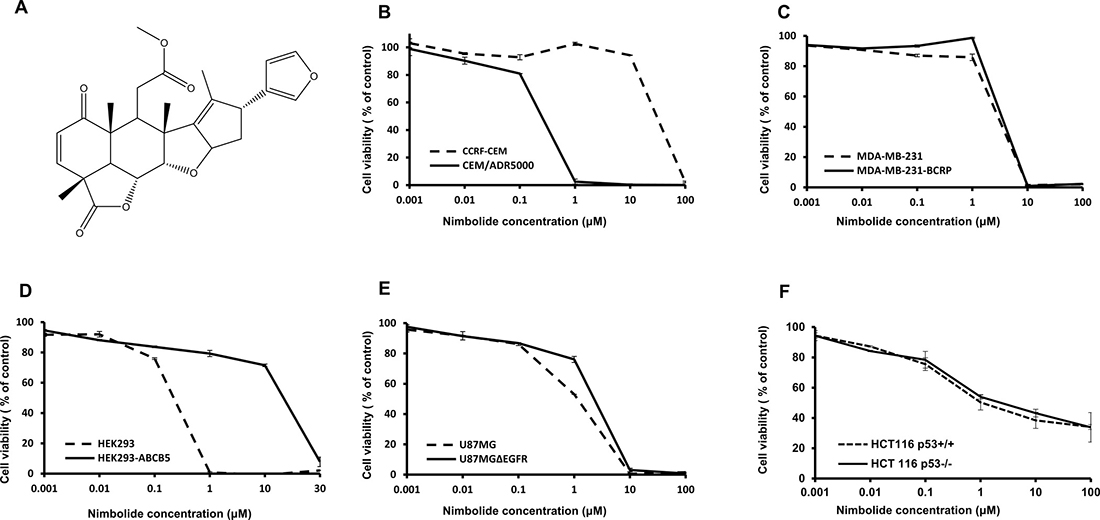
Figure 1: Nimbolide structure and cytotoxicity dose-response curves as determined by resazurin assay. (A) Chemical structure. (B) Drug-sensitive CCRF-CEM and P-glycoprotein-overexpressing CEM/ADR5000 cells. (C) Sensitive MDA-MB-231 pcDNA and BCRP-transfected MDA-MB-231 cells. (D) Non-transfected HEK293 cells and ABCB5-transfectant HEK293 subline. (E) Wild-type U87.MG cells and their mutated EGFR-transfected subline, U87.MGΔEGFR. (F) HCT116 p53+/+ and their knockout p53−/− subline. The curves show mean values ± SD of three independent experiments with each 6 parallel measurements.
Nimbolide-induced collateral sensitivity in P-glycoprotein-overexpressing cells
Functional pathway analysis
Microarray-based gene expression data was analyzed using bioinformatics tools. Chipster analyses identified 492 and 731 significantly deregulated genes in CCRF-CEM and CEM/ADR5000 cells, respectively (see Supplementary Tables 1 and 2). In both cell lines, the Ingenuity Pathway Analysis (IPA) program predicted cell death and survival, cellular development and cellular growth and proliferation as the most affected molecular and cellular functions (Figure 2). Nucleic acid metabolism, lipid metabolism, carbohydrate metabolism and free radical scavenging were only modulated in resistant cells and linked to their hypersensitivity response towards nimbolide. Remarkably, upstream analysis for P-glycoprotein-overexpressing cells identified PTEN and MYC as the most significantly targeted upstream regulators (Figure 3). Genes in CEM/ADR5000 cells that are consistent with activation by PTEN (P = 7.98 × 10⁻¹³) or inhibition by MYC (P = 3.89 × 10⁻²⁶) are shown in Tables 1 and 2.
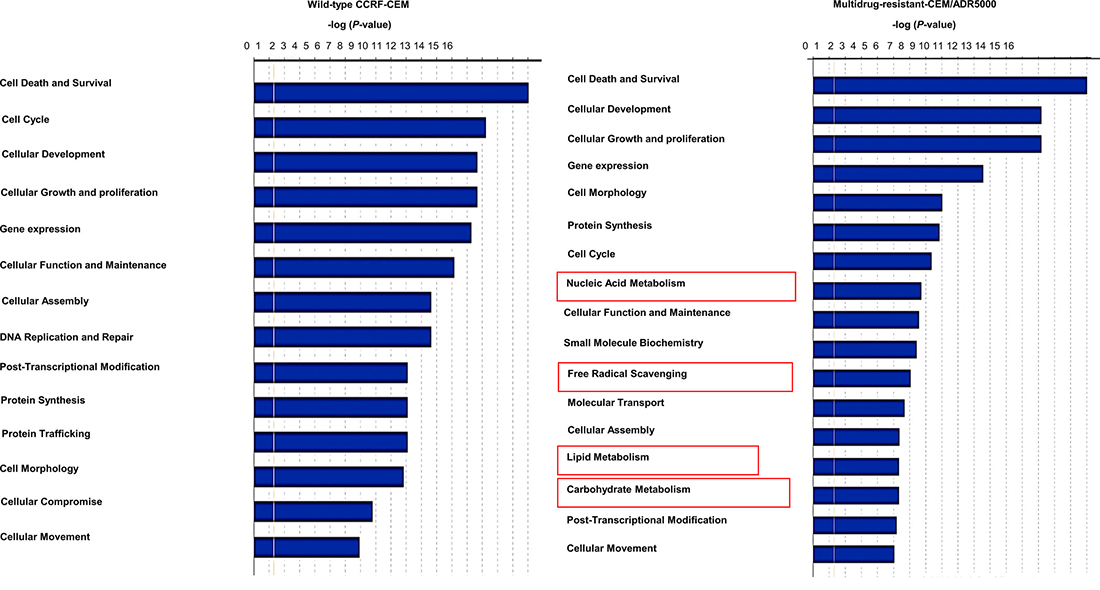
Figure 2: Ingenuity pathway analysis. Top cellular and molecular functions affected by nimbolide in CCRF-CEM and P-glycoprotein-overexpressing CEM/ADR5000 cells.
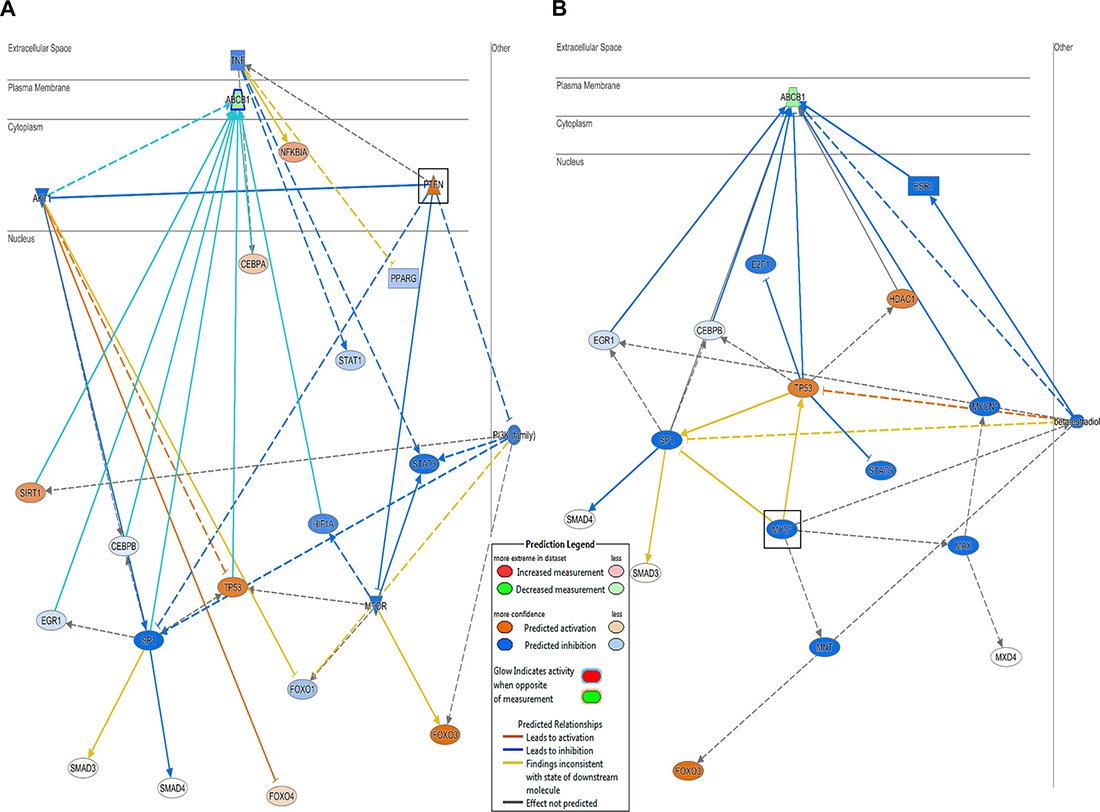
Figure 3: PTEN and MYC downstream effect and molecular network. Upstream analysis for P-glycoprotein-overexpressing cells identified (A) PTEN as the most significantly activated regulator (P = 7.98 × 10⁻¹³) and (B) MYC as the most significantly inhibited regulator (P = 3.89 × 10⁻²⁶).
Table 1: Genes in P-glycoprotein-overexpressing CEM/ADR5000 cells those are consistent with PTEN activation after nimbolide treatment
Gene symbol |
Exper. Fold change |
Gene symbol |
Exper. Fold change |
|---|---|---|---|
MXD4 |
2.325 |
CXCR4 |
−1.095 |
KLHL24 |
1.800 |
FAS |
−1.115 |
NDRG1 |
1.720 |
CFD |
−1.185 |
MEF2D |
1.290 |
CCND1 |
−1.185 |
AKR1C3 |
1.255 |
MAPKAPK3 |
−1.200 |
SAT1 |
1.215 |
PA2G4 |
−1.270 |
HSPA1A/HSPA1B |
1.215 |
NOP2 |
−1.320 |
TOM1 |
1.175 |
SCD |
−1.345 |
IFRD1 |
1.170 |
VEGFB |
−1.515 |
BTG1 |
1.090 |
CDK4 |
−1.590 |
KLF6 |
1.005 |
ATP5MC1 |
−1.680 |
ACACA |
−1.010 |
MRPL12 |
−2.145 |
H2AFY |
−1.015 |
FASN |
−2.355 |
SREBF1 |
−1.025 |
MYC |
−4.260 |
SORD |
−1.065 |
IPA program highlighted 29 genes from the dataset that have measurement directions in consistence with PTEN activation (p-value 7.98 × 10⁻¹³).
Table 2: Genes in P-glycoprotein-overexpressing CEM/ADR5000 cells those are consistent with MYC inhibition after nimbolide treatment
Gene symbol |
Exper. Fold change |
Gene symbol |
Exper. Fold change |
Gene symbol |
Exper. Fold change |
|---|---|---|---|---|---|
DDIT3 |
2.285 |
HNRNPU |
−1.225 |
HK2 |
−1.545 |
IRF7 |
1.815 |
PPAT |
−1.235 |
PTPRC |
−1.580 |
NDRG1 |
1.720 |
KAT2A |
−1.235 |
CDK4 |
−1.590 |
CCNG2 |
1.560 |
TFRC |
−1.240 |
RPL6 |
−1.605 |
SCPEP1 |
1.300 |
NOP58 |
−1.260 |
PTMA |
−1.625 |
FTH1 |
1.290 |
TYMS |
−1.265 |
CCND2 |
−1.625 |
SAT1 |
1.215 |
ID1 |
−1.265 |
SUMO3 |
−1.690 |
ALB |
1.085 |
PA2G4 |
−1.270 |
MCM7 |
−1.690 |
MCM6 |
−1.010 |
RRM2 |
−1.290 |
DCTPP1 |
−1.700 |
ACACA |
−1.010 |
MIF |
−1.295 |
SRM |
−1.720 |
HSPA9 |
−1.020 |
AK2 |
−1.310 |
PRMT1 |
−1.760 |
RRP1B |
−1.030 |
RPS7 |
−1.325 |
DDX21 |
−1.765 |
CAD |
−1.035 |
DDX39B |
−1.330 |
PAICS |
−1.780 |
PPP2CA |
−1.065 |
ALDH18A1 |
−1.345 |
RRS1 |
−1.810 |
POU4F1 |
−1.080 |
TPI1 |
−1.365 |
ABCE1 |
−1.820 |
NME2 |
−1.085 |
BCAT1 |
−1.370 |
GART |
−1.845 |
CDK6 |
−1.090 |
DNPH1 |
−1.380 |
ABCB10 |
−1.845 |
CD44 |
−1.110 |
CDCA7 |
−1.395 |
NME1 |
−1.850 |
EFTUD2 |
−1.115 |
C1QBP |
−1.395 |
IRX3 |
−1.850 |
MIR17HG |
−1.150 |
PRDX4 |
−1.400 |
NOLC1 |
−1.875 |
PPIA |
−1.180 |
NOP56 |
−1.410 |
PHB |
−2.035 |
ODC1 |
−1.180 |
PGAM1 |
−1.415 |
MRPL12 |
−2.145 |
ENO1 |
−1.190 |
SNRPD1 |
−1.435 |
RANBP1 |
−2.225 |
EIF4A1 |
−1.190 |
LDHA |
−1.475 |
FASN |
−2.355 |
PRDX2 |
−1.200 |
BZW2 |
−1.500 |
PFAS |
−2.375 |
ATAD3A |
−1.215 |
HNRNPAB |
−1.535 |
IPA program highlighted 77 genes from the dataset that have measurement directions in consistence with MYC inhibition (p-value 3.89 × 10⁻²⁶).
Validation of relative genes expression by quantitative reverse transcription PCR
We selected four genes related to the obtained functional pathway analysis in CEM/ADR5000 cells to validate their relative expressions with qPCR. The expression of MYC, MXD4, ABCB1 and DDIT3 was normalized to GAPDH, and the fold-change values of microarray hybridization and qPCR were then subjected to Pearson correlation test. With an R-value equal to 0.98, we assured the high conformity of microarray and qPCR data (Table 3 and Figure 4A). We particularly investigated the effect of different concentrations of nimbolide on the expression of ABCB1/MDR1. The data demonstrated a dose-dependent down-regulation (Figure 4B).
Table 3: Validation of microarray relative genes expression by quantitative real-time reverse transcription PCR
Gene name |
Microarray data (FC)* |
qPCR data (FC) |
|---|---|---|
MYC |
−4.3 |
−3.5 ± 0.4 |
ABCB1/MDR1 |
−1.3 |
−1.6 ± 0.3 |
MXD4 |
2.3 |
1.1 ± 1.1 |
DDIT3 |
2.3 |
2.8 ± 1.3 |
The R-value of 0.98, indicated a strong correlation coefficient between fold-change (*FC) values obtained from microarray hybridization and qPCR.
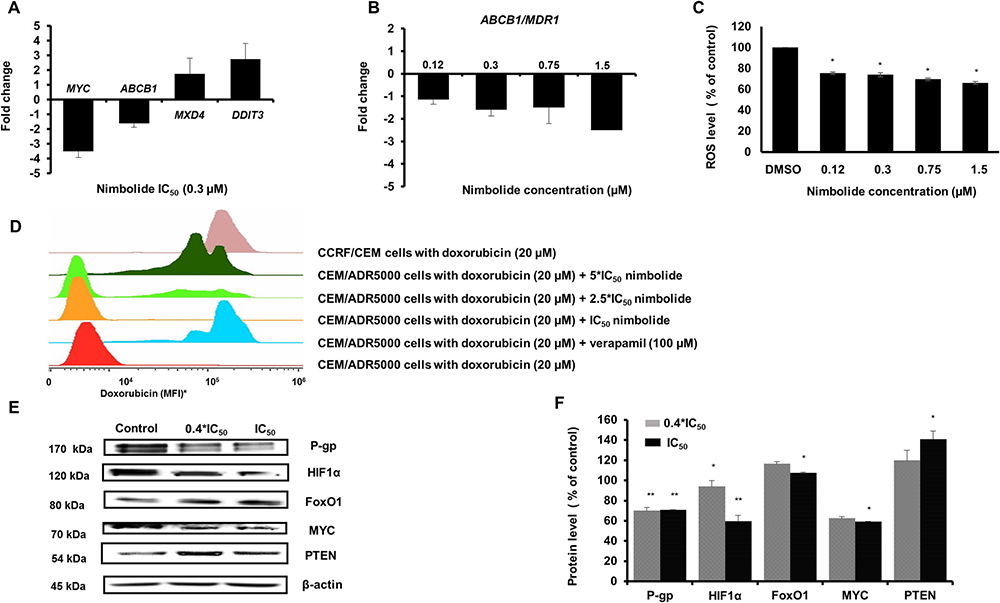
Figure 4: (A) The effect of nimbolide IC50 on MYC, ABCB1, MXD4, and DDIT3 expression levels. Strong correlation between microarray data and qPCR was confirmed with R-value = 0.98 (Table 3). (B) The effect of different concentrations of nimbolide (0.4*IC50, IC50, 2.5*IC50 and 5*IC50) on the expression of ABCB1/MDR1. (C) Significant reduction of reactive oxygen species in CEM/ADR5000 cells after treatment with different concentrations of nimbolide. The results show mean values ± SD of three independent experiments. (*p < 0.05, compared to DMSO control cells). (D) The uptake of 20 μM doxorubicin was measured after 24 h in the presence of different concentrations of nimbolide and compared to doxorubicin uptake in CCRF-CEM. Verapamil 100 μM, a known P-glycoprotein inhibitor was used as a positive control. (*MFI, mean fluorescence intensity). (E and F) The effect of nimbolide on the protein expression levels for P-glycoprotein, HIF1α, FoxO1, MYC and PTEN in CEM/ADR5000 cells. The bands were normalized to β-actin and the mean values ± SD are shown in the results. (*p < 0.05, **p < 0.01compared to DMSO control cells).
Uptake assay and ROS quantification
The effect of nimbolide on the efflux pump activity in P-glycoprotein-overexpressing cells was examined using flow cytometry. The results revealed increased cellular retention of doxorubicin after nimbolide treatment compared to untreated cells and similar to verapamil, which was used as control drug. It is well known that verapamil acts as a chemosensitizing agent and increases intracellular levels of cytotoxic P-glycoprotein substrates through its ability to stimulate ATPase activity, leading to ROS-mediated cell death. By contrast, nimbolide detoxified ROS cellular baseline suggesting another mechanism for collateral sensitivity (Figure 4C and 4D).
Western blot
From previous findings, IPA particularly recognized nimbolide induced-alterations in the metabolic pathways in P-glycoprotein-overexpressing cells (see Figure 2). Besides, the upstream analysis identified PTEN, MYC, HIF1α and FoxO1 as the most affected metabolic regulators. This prompted us to further test the effect of nimbolide on their protein expression levels, and to examine, whether nimbolide indeed induced-collateral sensitivity by targeting the cellular metabolism. The protein expression levels of MYC and HIF1α were down-regulated and those of PTEN and FoxO1 were up-regulated (Figure 4E and 4F).
COMPARE and hierarchical cluster analyses
COMPARE analysis was performed to recognize any novel molecular determinants that might contribute to the different sensitivity shown in Figure 1. Top genes with positive and negative correlations were identified and shown in Table 4. These genes belong to different functional groups such as those encoding ribosomal proteins and components of the mitochondrial respiratory chain, in addition to proteins with anti-apoptotic functions, DNA repair, replication, cell proliferation regulators and others. Interestingly, HIF1α was determined as a sensitivity factor of nimbolide.
Table 4: COMPARE coefficient obtained from the correlation of the mRNA expression of genes in NCI cell line panel with log10IC50 values of nimbolide
Coefficient |
Exper. ID |
Gene bank |
Gene |
Name |
Function |
|---|---|---|---|---|---|
0.681 |
GC37319 |
W52024 |
RPS15A |
Ribosomal protein S15a |
Ribosomal protein |
0.651 |
GC34926 |
X79563 |
RPS21 |
Ribosomal protein S21 |
Ribosomal protein |
0.648 |
GC31906 |
AF070071 |
MSH5 |
MutS homolog 5 (E. coli) |
Involved in meiotic recombination |
0.646 |
GC31589 |
T89651 |
RPL36A |
Ribosomal protein L36a |
Ribosomal protein |
0.637 |
GC29092 |
AA733050 |
SNRPE |
Small nuclear ribonucleoprotein polypeptide E |
Component of the pre-mRNA processing spliceosome |
0.636 |
GC39380 |
U09953 |
RPL9 |
Ribosomal protein L9 |
Ribosomal protein |
0.636 |
GC30848 |
X74262 |
RBBP4 |
Retinoblastoma binding protein 4 |
Involved in histone acetylation and chromatin assembly. |
0.633 |
GC36012 |
AI095013 |
HIST1H2AM |
Histone cluster 1. H2am |
Core component of nucleosome |
0.633 |
GC27139 |
D63482 |
GIT2 |
G protein-coupled receptor kinase interacting ArfGAP 2 |
GTPase-activating |
0.619 |
GC28890 |
Y07969 |
ANP32B |
Acidic (leucine-rich) nuclear phosphoprotein 32 family. member B |
Cell cycle progression factor |
0.619 |
GC30164 |
AF054187 |
NACA |
Nascent polypeptide-associated complex α subunit |
Involved in cell signaling |
0.615 |
GC35423 |
X53777 |
RPL17 |
Ribosomal protein L17 |
Ribosomal protein |
0.614 |
GC36655 |
U14966 |
RPL5 |
Ribosomal protein L5 |
Ribosomal protein |
0.612 |
GC36652 |
L38941 |
RPL34 |
Ribosomal protein L34 |
Ribosomal protein |
0.608 |
GC35734 |
AI557852 |
RPS27 |
Ribosomal protein S27 |
Ribosomal protein |
0.606 |
GC27422 |
J02923 |
LCP1 |
Lymphocyte cytosolic protein 1 (L-plastin) |
Actin-binding protein |
0.602 |
GC32838 |
D55716 |
MCM7 |
Minichromosome maintenance complex component 7 |
Essential for genome replication |
0.602 |
GC36916 |
AJ223349 |
HIRIP3 |
HIRA interacting |
Role in chromatin function and histone metabolism |
0.597 |
GC31486 |
X95525 |
TAF5 |
TATA box binding protein (TBP)-associated factor |
Regulation of RNA polymerase transcription |
0.595 |
GC39124 |
AA526497 |
UQCRH |
Ubiquinol-cytochrome c reductase hinge protein |
Part of the mitochondrial respiratory chain |
−0.569 |
GC31852 |
AF037339 |
CLPTM1 |
Cleft lip and palate associated transmembrane protein 1 |
Role in T-cell development |
−0.559 |
GC37799 |
M22299 |
PLS3 |
Plastin 3 |
Role in the regulation of bone development |
−0.54 |
GC31915 |
N36926 |
GNA11 |
Guanine nucleotide binding protein (G protein). α 11 (Gq class) |
Involved in transmembrane signaling |
−0.534 |
GC32200 |
AL096879 |
TMEM184B |
Transmembrane protein 184B |
Activates the MAP kinase signaling pathway |
−0.531 |
GC30688 |
AL009266 |
RBFOX2 |
RNA binding motif protein 9 |
Regulator of exon splicing in the nervous system |
−0.525 |
GC32662 |
D00017 |
ANXA2 |
Annexin A2 |
Involved in transduction pathways |
−0.517 |
GC29447 |
AJ133534 |
RABAC1 |
Rab acceptor 1 (prenylated) |
Controls vesicle docking and fusion |
−0.503 |
GC29436 |
D14696 |
LAPTM4A |
Lysosomal protein transmembrane 4 α |
Important for nucleosides transportation |
−0.496 |
GC32112 |
U97018 |
EML1 |
Echinoderm microtubule associated protein like 1 |
Required for neuronal progenitor cells proliferation |
−0.496 |
GC30594 |
AF038187 |
WSB2 |
WD repeat and SOCS box-containing 2 |
Component of ubiquitination processes |
−0.49 |
GC36562 |
U48861 |
CHRNB4 |
Cholinergic receptor. nicotinic β4 |
Extracellular ligand-gated ion channel activity |
−0.489 |
GC33491 |
L77886 |
PTPRK |
Protein tyrosine phosphatase. receptor type. K |
Negative regulator of EGFR signaling pathway |
−0.486 |
GC38772 |
AF089816 |
GIPC1 |
GIPC PDZ domain containing family. member 1 |
Involved in G protein-linked signaling |
−0.486 |
GC38406 |
AB011541 |
MEGF8 |
Multiple EGF-like-domains 8 |
Unknown function |
−0.486 |
GC33008 |
U22431 |
HIF1A |
Hypoxia inducible factor 1. α subunit (basic helix-loop-helix transcription factor) |
Master transcriptional regulator of the adaptive response to hypoxia |
−0.481 |
GC31510 |
AF062006 |
LGR5 |
Leucine-rich repeat-containing G protein-coupled receptor 5 |
Role in the formation of adult intestinal stem cells |
−0.477 |
GC34135 |
M35011 |
ITGB5 |
Integrin β5 |
Receptor for adenovirus type C |
−0.47 |
GC32475 |
M61916 |
LAMB1 |
Laminin β1 |
Mediates cells differentiation into tissues during embryonic development |
−0.469 |
GC29175 |
AA487755 |
FKBP9 |
FK506 binding protein 9 |
Accelerates protein folding |
−0.468 |
GC37524 |
AJ012582 |
HCN2 |
Hyperpolarization activated cyclic nucleotide-gated potassium channel 2 |
Contributes to spontaneous rhythmic activity in heart and brain |
Information on gene functions was taken from the GeneCards database of the Weizman Institute of Science (https://www.genecards.org/).
To analyze whether the gene expression profiles of the 60 cell lines might predict sensitivity or resistance to nimbolide, hierarchical cluster analyses were applied to mRNA expression data and five main cluster branches appeared with a statistically significant relationship (P = 9.718 ×10⁻⁴, Figure 5).
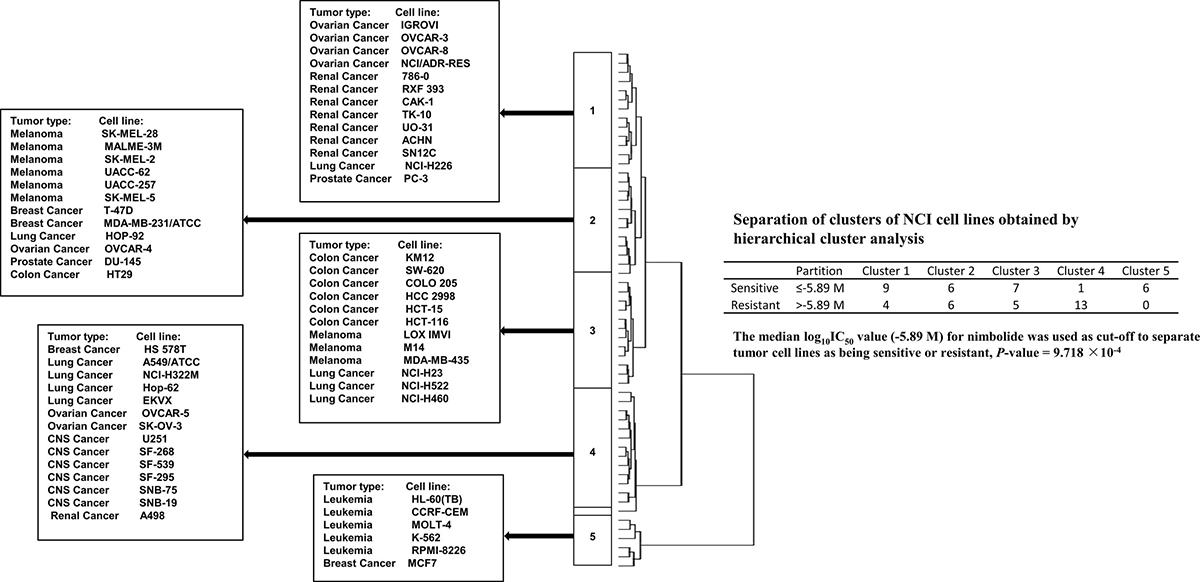
Figure 5: Hierarchical cluster analysis of microarray-based mRNA expression of genes obtained by COMPARE analysis. The dendrogram shows the clustering of the cell line panel into five main branches and indicates the degrees of relatedness between cell lines.
Transcription factor binding motif analysis and NF-kB reporter assay
The genes that have been identified by COMPARE analysis (see Table 4) were suggested to be regulated by common transcription factors. Therefore, transcription factor binding motif analysis was performed to 25 kb upstream promoter sequence of the 40 genes, and the results revealed significant presence of NF-κB-DNA binding motifs with 357 hits (Figure 6A).
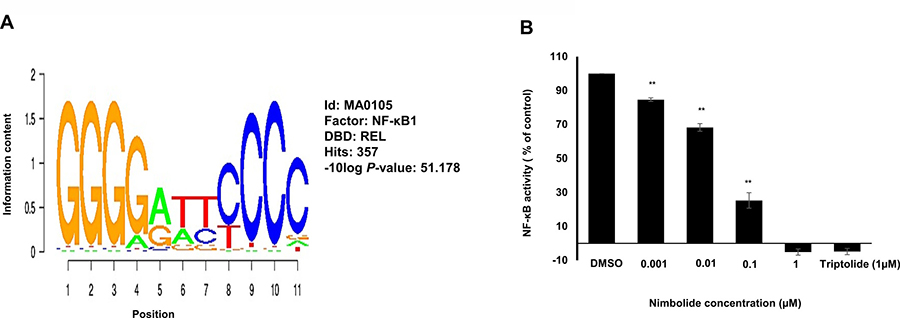
Figure 6: Nimbolide inhibits NF-κB activity. (A) Motif screening of 25 kb upstream regions of 40 genes identified by COMPARE analysis revealed the significant presence of NF-κB-DNA binding motifs. (B) Various concentrations of nimbolide (0.001 μM. 0.01 μM. 0.1 μM and 1 μM) were used to treat SEAP-driven cells stimulated with TNF-α for 24 h and compared to the positive control triptolide (1 μM). The results show mean values ± SD of three independent experiments. (**p< 0.01, compared to DMSO control cells).
A secreted alkaline phosphatase (SEAP)-driven NF-κB reporter cell line was used to investigate the effect of nimbolide towards the transcription factor NF-κB. Nimbolide significantly inhibited NF-κB activity at a low concentration of 0.1 μM after 1 h. Triptolide was used as positive control drug for NF-κB inhibition (Figure 6B).
DISCUSSION
Cytotoxicity of nimbolide against MDR-expressing cells
This study is part of an integrated strategy for discovering novel agents from natural sources to circumvent MDR. One of the first mechanisms to be investigated is the role of P-glycoprotein-mediated MDR. The fact that P-glycoprotein-overexpression has been detected in more than 50% of human cancers and has been correlated to inherent and acquired MDR led to intensified efforts to inhibit P-glycoprotein’s function [10]. P-glycoprotein-targeting chemosensitizers were designed to inactivate this transporter. However, they have experienced difficulties to pass clinical trials [33]. This has raised interest searching for novel agents that selectively kill ABCB1/MDR1-expressing cells as alternative strategy to overcome MDR through tumor re-sensitization [34]. Such agents show greater sensitivity to resistant cell lines than to sensitive ones, a phenomenon known as collateral sensitivity (CS). Interestingly, in this study ABCB1/MDR1-expressing resistant leukemia cell line showed greater sensitivity to nimbolide compared to sensitive cells. To best of our knowledge, this is the first time to report the potentiality of nimbolide to induce collateral sensitivity in P-glycoprotein-overexpressing cells. This finding suggests nimbolide as potent CS agent and supports its further development in this area. BCRP is another member of the ABC transporter-mediated classical MDR mechanism. The clinical relevance of BCRP as a transporter for broad-spectrum anticancer drugs with chemotherapy failure is well established [35]. Thus, agents that evade recognition and efflux by BCRP would be of great value. Our findings imply that BCRP may not play a role in resistance to nimbolide. In contrast, Both ABCB5-transfected and non-transfected HEK293 cells showed cross-resistance to nimbolide. Moreover, our results demonstrated that mutation of TP53 or EGFR did not confer resistance towards nimbolide. EGFR was correlated with cancer progression and poor survival in addition to the development of resistance to cytotoxic agents [19]. TP53 is the most commonly mutated gene in human cancer. Mutant TP53 does not only lose its normal function as tumor suppressor and the maintenance of genome stability, but also gains oncogenic features, promotes malignant progression and mediates drug resistance. Cell death attenuation and its ability to exert anti-apoptotic effects towards chemotherapeutics were observed with mutant TP53 [17]. Indeed, it trans-activates various death regulatory genes, and a high level of the MDR1 gene expression was also correlated to mutant TP53 status [36]. Nimbolide is supposed to bypass MDR mediated by the expression of EGFR and mutant TP53.
Nimbolide-induced collateral sensitivity in P-glycoprotein-overexpressing cells
The most remarkable observation from our cytotoxicity findings was the significant ability of nimbolide to inhibit cell viability of ABCB1/MDR1 expressing cells compared to the sensitive parental cell line. In an attempt to understand the relevant genetic pathway and molecular networks that mediate collateral sensitivity, bioinformatical analyses were performed with the gene expression profiles of both cell lines. The results did not reveal significant differences affected by nimbolide with regard to main cellular functions, including cell death and survival, cellular development and cellular growth and proliferation. This is in good agreement with the reported multiple mechanisms that are influenced by nimbolide to exert its anticancer effect [37]. In contrast to CCRF–CEM cells, MDR1-expressing CEM/ADR5000 only highlighted alterations in cellular metabolism, such as nucleic acid metabolism, lipid metabolism, carbohydrate metabolism and free radical scavenging. Besides, the reduction in ABCB1/MDR1 gene expression detected in microarray data, suggested that nimbolide might modulate P-glycoprotein expression at the transcriptional level. The upstream analysis highlighted significant PTEN activation and MYC inhibition. The tumor suppressor PTEN is well known as key negative regulator for the PI3K/Akt/mTOR pathway, and it has been proposed as powerful target for cancer treatment [38]. Several components in this signaling axis have been linked to anti-cancer drug resistance and most specifically to P-glycoprotein overexpression [39]. For instance, hypoxia inducible factor (HIF1α) is a well-known motif in the Akt/mTOR pathway with direct implications to affect P-glycoprotein expression and therapy resistance [40]. Our results showed a significant increase in the PTEN protein level and a reduction in HIF1α after nimbolide treatment. On the other hand, the redox systems also play a role for P-glycoprotein expression [41] and the ROS are well known to stabilize HIF1α [42]. In this context, our findings showed a reduction of cellular ROS after nimbolide treatment, suggested an indirect mechanism to regulate HIF1α through targeting ROS. It is worth to mention that high ROS production is proposed as one of the mechanisms for CS [34]. The hypothesis explains how P-glycoprotein substrates may stimulate ATPase activity and, therefore, why MDR cells preferentially die because of ROS generation and oxidative stress. Although nimbolide increased the cellular doxorubicin retention when we performed uptake assay to investigate its potentiality as P-glycoprotein substrate, we did not observe enhanced ROS production after treatment, which disprove the classical mechanism of CS. Indeed, nimbolide detoxifies the cellular baseline of ROS, downregulates MYC oncogene and upregulates FoxO1 transcription factor expressions, suggesting a novel mechanism for CS. MYC and FoxO are known in cancer metabolic adaptation and reprogramming, and the regulation of this axis is connected with the Akt/mTOR signaling pathway [43]. Taking together, we surmise that nimbolide induces CS in P-glycoprotein-overexpressing cells by targeting PTEN and modulating tumor cellular metabolic elements (HIF1α, FoxO1, c- MYC and ROS) (Figure 7).
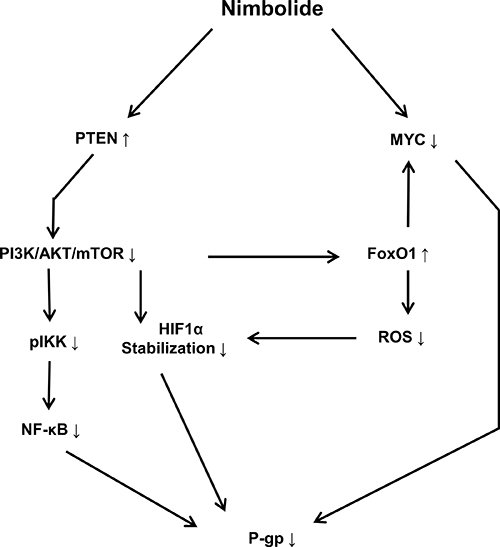
Figure 7: Schematic diagram showing the effect of nimbolide on P-glycoprotein expression and the involved molecular mediators. Nimbolide-mediated P-glycoprotein downregulation is accomplished through targeting PTEN and MYC. PI3K/AKT/mTOR signaling pathway regulates NF-κB translocation and transcriptional activity through IKK phosphorylation. The inhibition of PI3K/AKT/mTOR leads to increasing HIF1α degradation and FoxO1 activation. The latter antagonizes MYC activity and decreases cellular ROS level.
Analyses of microarray data using COMPARE and hierarchical cluster analysis
The COMPARE algorithm was used to identify compounds with similar growth inhibitory patterns as well as identifying molecular targets [44]. Genes from diverse different functional groups were identified as resistance and sensitivity mediators to nimbolide. Results were obtained from the correlation of mRNA expression profiles of the 60 cell lines panel in NCI with log10IC50 values of nimbolide. Regulators for DNA repair, replication and cell proliferation (MSH5, RBBP4, HIST1H2AM, MCM7) are example of genes found to mediate resistance to nimbolide. Other resistance genes exerted transcriptional activity (NACA, TAF5). In addition, ANP32B is one of the acidic (leucine-rich) nuclear phosphoprotein 32 kDa family members that has diverse physiological functions including apoptotic caspase modulation, transcriptional regulation, protein phosphorylation inhibition and regulation of intracellular transport [45]. The identification of ANP32B as resistance factor for nimbolide appears to be well substantiated by the study reported on ANP32B as negative regulator of apoptosis [46]. It was also suggested as tumor-promoting gene in breast cancer prognosis [45]. However, its causative relevance to mediate resistance towards nimbolide needs more investigations. Furthermore, it was not surprising that ribosomal proteins (RPS15A, RPS21, RPL9, RPL36A, RPL17, RPL5, RPL34, RPS27) and components of the mitochondrial respiratory chain (UQCRH) were identified as genes associated with resistance to nimbolide. Mediation of MDR by certain ribosomal proteins and their contribution toward cellular response has been reported as one of the extra-ribosomal functions [47]. Besides, the relation between the mitochondrial respiratory chain and chemotherapy resistance was previously described [48]. Via COMPARE analysis, another group of genes was linked to sensitivity towards nimbolide. Among them, HIF1α was the most interesting one. Especially, it has been marked up from our functional pathway analysis for collateral sensitivity-displayed cells as one of the targets. Consistent with our current work, a recent study has confirmed that nimbolide potentially targets HIFα [49]. For almost two decades, intensive research has been conducted on HIFs and HIF-related pathways due to their core involvement in therapy resistance and poor prognosis for patients [42].
Cluster analyses were performed as additional approach to predicted cellular responsiveness of the NCI 60 cell line panel by only including the mRNA expression profiles of the genes that were identified by COMPARE analysis. The IC50 values of the cell lines for nimbolide were not included in the cluster analysis. The genes were significantly distributed among five clusters, which emphasizes their potential relevance to mediate sensitivity and resistance to nimbolide.
Inhibition of NF-κB by nimbolide
To obtain more in-depth insight of other molecular determinants that might contribute to cellular responses, we hypothesized that gene expression profiles identified by COMPARE analyses might be transcriptionally regulated by common transcription factors. Thus, the motif-screening strategy was applied to the genes’ upstream promoter sequences. Among the different transcription factors that appeared, NF-κB was significantly observed to have DNA binding motifs, indicating that NF-κB may play a considerable role in regulating those genes. On the other hand, literature evidence implies a direct role of NF-κB in tumor cell desensitization towards many chemotherapeutics and radiation therapy [22]. Constitutive activation of NF-κB has been reported in leukemia and many solid tumors (breast cancer, melanoma, colon cancer, and pancreatic cancer), associated with NK-κB-induced anti apoptotic effects [50]. NF-κB represents a potential molecular target, and searching for novel agents that inhibit its functions is strongly recommended [50]. This prompted us to investigate the effect of nimbolide towards NF-κB using reporter cell assay. We observed the possession of nimbolide to potent inhibitory effects, which supports previous findings in the literature [37]. Gupta et al. reported that nimbolide inhibited NF-κB pathway through inhibition of IKK activation, leading to suppression of NFKBIA phosphorylation, degradation and subsequent negative regulation of the expression of many tumorigenic proteins [51]. The phosphorylated and activated NF-κB is considered as one of the downstream targets of PI3K/Akt pathway, and inhibiting this transcription factor has been reported in many studies to decrease ABCB1/MDR1 gene expression [52].
Our work has led us to conclude the potentiality of nimbolide to improve treatment success of tumors that especially express BCRP, P53 or EGFR multi-drug resistance mechanisms, as they do not play a role for nimbomide resistance. Strong collateral sensitivity towards P-glycoprotein (ABCB1/MDR1)-expressing cells was observed, and differential expression analysis suggested the involvement of essential cellular metabolic-regulating elements (HIF1α, FoxO1, MYC and ROS). Furthermore, nimbolide mediated collateral sensitivity through targeting PTEN and affecting its downstream components, resulting in significant downregulation of the ABCB1/MDR1 gene and protein expression. Nimbolide possessed potent inhibitory effects against NF-κB activity and may thus enhance the effectiveness of antitumor therapy through sensitization of tumor cells to apoptosis induced by anticancer agents. Other molecular factors obtained from COMPARE analysis need further investigations for their relevant mechanisms of action. Interestingly, HIF1α was determined to mediate sensitivity to nimbolide, which would be of great benefit in targeted therapy.
MATERIALS AND METHODS
Human multidrug-resistant tumor cell lines
Parental, drug-sensitive CCRF–CEM leukemia cells and MDR1-expressing CEM/ADR5000 were cultured in RPMI 1640 medium (Invitrogen/Life Technologies, Darmstadt, Germany), supplemented with 10% fetal bovine serum (FBS) and 1% penicillin (1000 U/mL) and streptomycin (100 μg/mL) (Life Technologies) at standard conditions (humidified 5% CO2 atmosphere at 37° C). The maintenance of the resistance phenotype was accomplished by 5000 ng/ml doxorubicin once per week. The breast cancer cell lines MDA-MB-231 and MDA-MB-231-BCRP were maintained in DMEM medium (Invitrogen) supplemented with 10% FBS and 1% penicillin/streptomycin at standard conditions. Geneticin (800 ng/mL) (Invitrogen, Karlsruhe, Germany) was continuously added to the resistant subline to ensure the expression of breast cancer resistance protein (BCRP) [53]. HEK293 cells transfected with cDNA for ABCB5 and non-transfected HEK293 cells, human glioblastoma multiforme U87.MGΔEGFR cells and parental U87.MG cell lines, in addition to human HCT116 p53+/+ wild-type colon cancer cells and HCT116 p53−/− knockout cells were cultured under the same conditions as breast cancer cells. The inactivation of the TP53 gene in HCT116 p53−/− cells was generated by homologous recombination [54]. The resistant glioblastoma and colon cancer cell lines were maintained with 400 μg/mL geneticin. All cells were passaged twice weekly and experiments were performed with cells in the logarithmic growth phase.
NCI 60 cell line panel
The Developmental Therapeutics Program (DTP) of the National Cancer Institute (NCI) cell line panel consists of 60 different human tumor, representing leukemia, melanoma and cancers of lung, colon, brain, ovary, breast, prostate, and kidney. The origin and processing of the cell lines have been previously described [55]. Nimbolide was tested against the NCI tumor panel.
Cytotoxicity assay
Resazurin assay is based on the amount of viable cells that are able to convert the non-fluorescent indicator dye to a highly fluorescent one [56]. According to the previously described procedure [57], cells were cultured in a 96-well cell culture plate in a total volume of 200 μL, then treated with different concentrations of nimbolide. The concentration of DMSO was kept at or below 0.1%. After 72 h, 20 μL resazurin 0.01% w/v solution (Sigma-Aldrich, Schnelldorf, Germany) was added to each well, and the plates were incubated at 37° C for 3–4 h. Fluorescence was measured with the Infinite M2000 Pro™ plate reader (Tecan). Each assay was done at least three times, with six replicates each. The viability was compared based on a comparison with untreated cells. The concentration of sample required to inhibit 50% of cell proliferation (IC50 values) was calculated from a concentration-dependent curve by linear regression in Microsoft Excel.
Gene expression profiling
Sensitive and resistant leukemia cell lines (CCRF–CEM and MDR1-expressing CEM/ADR5000) were subjected to total RNA extraction after 72 h of treatment with corresponding IC50 values of nimbolide or with DMSO solvent control. For this purpose, we used the RNeasy Kit from Qiagen (Hilden, Germany) and followed the manufacturer’s instructions. Microarray hybridizations were performed in duplicate for treated samples and for control samples by the Genomics and Proteomics Core Facility at the German Cancer Research Center (DKFZ, Heidelberg, Germany). The microarray hybridization procedure was previously described in detail [58].
Validation of relative genes expression by quantitative reverse transcription PCR
According to RevertAid H Minus First Strand cDNA Synthesis kit instructions (Thermo Scientific, Darmstadt, Germany), 1 μg RNA template was converted to its complementary DNA, and directly used with 5× Hot Start Taq EvaGreen® qPCR Mix (no ROX) (Axon Labortechnik, Kaiserslautern, Germany) for gene amplification. The PCR primer pairs were designed using NCBI/Primer-BLAST and obtained from Eurofins MWG Operon (Ebersberg, Germany) with the following sequences: ABCB1 forward primer: ACCTGTGAAGAGTAGAACATGAAGA, ABCB1 reverse primer: AATGTTCTGGCTTCCGTTGC, MYC forward primer: GTGGTCTTCCCCTACCCTCT, MYC reverse primer: GAGCAGAGAATCCGAGGACG, MXD4 forward primer: TCACCACATGCTCCAACCTC, MXD4 reverse primer: GGGCTCTGTTCTGCTTCTGT, DDIT3 forward primer: CACCACACCTGAAAGCAGAT, DDIT3 reverse primer: ATCTCTGCAGTTGGATCAGTC. QPCR was performed in CFX384™ (Bio-Rad, Munich, Germany) for 40 cycles. Each cycle includes, 95° C denaturation for 15 s, followed by 62–47° C gradient annealing step for 30 s, and 72° C elongation for 1 min at the end. The detailed analysis procedure for relative expression quantification is reported elsewhere [59].
Doxorubicin uptake assay
Different concentrations of nimbolide (IC50, 2.5*IC50, 5*IC50) were used to treat cells (106 cells/well in 6-well culture plates) incubated in transparent RPMI 1640 medium (without phenol red, Invitrogen™). The uptake of 20 μM doxorubicin (University Hospital Pharmacy, Mainz, Germany) was measured after 24 h in the presence or absence of nimbolide and compared to verapamil 100 μM, a known P-glycoprotein inhibitor (Sigma Aldrich, Taufkirchen, Germany). An excitation wavelength of 488 nm was selected, and doxorubicin mean fluorescence intensity (MFI) was measured using a band pass filter of 530/30 nm to collect the emitted light [60]. Measurements were performed by using a BD FACSCalibur™ (Beckton Dickinson, GmbH, Heidelberg, Germany), and the results were analyzed and visualized using FlowJo software.
ROS quantification
Detection of reactive oxygen species (ROS) in multidrug-resistant CEM/ADR5000 leukemia cells was based on 2,7-dichlorodihydrofluorescein diacetate (H2DCFH-DA). The dye itself is non-fluorescent. It diffuses into the cells and the cytoplasmic esterase cleaves it to 2,7-dichlorodihydrofluorescein (H2DCF), which in turn oxidizes to a fluorescent molecule in the presence of ROS. Aliquots of 104 cells/well were incubated in transparent RPMI 1640 medium for 3 h with different concentrations of nimbolide in 96-well plates. Afterwards, 10 μM dye was added 30 min prior the measurement and incubated in the dark. The fluorescent signals were recorded with an Infinite M2000 Pro™ plate reader (Tecan) at 495 nm excitation wavelength and 523 nm emission wavelength.
Immunoblotting
Total protein was extracted from CEM/ADR5000 leukemia cells after treatment for 24 h with different concentrations of nimbolide, following the previously mentioned protocol [61]. Then, 8% SDS-PAGE and (Ruti®-PVDF) membrane (Millipore Corporation, Billerica, MA) were used for protein separation and blotting, respectively. After transferring proteins using a wet sandwich procedure, the membranes were blocked for 1 h with 5% (w\v) bovine serum album in T-TBS (Tris-buffered saline containing 0.5% Tween-20). Primary antibodies for P-glycoprotein, PTEN, HIF1α, FoxO1, MYC and β-actin (Cell Signaling Technology, Frankfurt, Germany), were diluted (1:1000) and incubated at 4° C with gentle shaking overnight. Membranes were washed thrice with T-TBS and incubated with anti-rabbit secondary antibody linked to horseradish peroxidase enzyme (1:2000) for 1 h at room temperature. Afterwards, Luminata™ Classico Western HRP substrate (Merck Millipore, Schwalbach, Germany) was added and incubated for 3 min in the dark. Blot signals were detected and analyzed with Alpha Innotech FluorChem Q system (Biozym, Oldendorf, Germany) [60].
Bioinformatical methods
Chipster™ and Ingenuity pathway analysis (IPA)™ programs were applied to microarray data and used to analyze the change in genes expression levels in both leukemia cell lines after nimbolide treatment.
COMPARE algorithm developed by NCI (http://dtp.nci.nih.gov) was used to correlate nimbolide activity in terms of IC50 values with microarray-based mRNA expression profiles of the NCI panel of 60 cell lines. Since the COMPARE algorithm is based on Pearson’s correlation test, correlation coefficient (R-value) was obtained and ranked as a relative measure for the linear dependency of two variables [62]. Both standard and reverse COMPARE analyses were applied to identify genes that predict resistance (positive R-values) and sensitivity (negative R-values).
Hierarchical cluster analyses were performed to cluster the mRNA expression of genes identified by COMPARE analysis. A cluster tree or dendrogram was obtained by merging each individual object with another, depending on closeness of their characters using WinSTAT program (Kalmia Inc., Cambridge, MA). Then, the χ2-test was performed by taking the median of IC50 values of nimbolide as cut-off threshold [63].
Gene promoter analysis for transcription factor binding motifs was performed using Galaxy/Cistrome software available at (http://cistrome.org/ap/). Sequences of 40 genes that were associated with cellular response of tumor cells to nimbolide were changed to BED format using Table Browser in UCSC Genome Browser (https://genome.ucsc.edu/). Cistrome analysis platform was used to screen 25 kb upstream regions for all transcriptional factor-binding motifs via SeqPos tool [64].
NF-κB reporter assay
HEK-Blue-Null1 cells were seeded in a density of (5 × 10⁴/mL) in 96-well plates and incubated overnight at 37° C. Cells were treated with 1 μM triptolide (Invivogen) (positive control) and different concentrations of nimbolide (1 μM, 0.1 μM, 0.01 μM and 0.001 μM) for 1 h. Then, 100 ng/mL TNF-α (Sigma-Aldrich) were added for 24 h to induce the inflammatory state in the cells. To detect NF-κB activation, 20 μL from the supernatant of cell culture were added to 180 μL of pre-warmed Quanti-Blue detection reagent (Invivogen) per well according to the manufacturer’s instructions. NF-κB activation was detected by measuring SEAP spectrophotometrically at 630 nm using a Tecan reader [64].
Statistics
Results were obtained from three independent experiments and expressed as mean ± standard deviation (SD). Student’s t-test was used for statistical analysis, and P < 0.05 values were considered as statistically significant.
Abbreviations
ABC: ATP-binding cassette; BCRP: breast cancer resistance protein; CS: collateral sensitivity; EGFR: epidermal growth factor receptor; IPA: Ingenuity pathway analysis; MDR: multidrug resistance; NCI: National Cancer Institute; ROS: reactive oxygen species; TNF: tumor necrosis factor; TP53: tumor suppressor 53.
Author contributions
N. Mahmoud Carried out the bioinformatical analyses, performed the in vitro experiments and wrote the manuscript; M. Saeed and H. J. Greten designed the experiments; Y. Sugimoto provided ABCB5 transfected cell lines; S. M. Klauck performed the microarray experiment; T. Efferth supervised the work, provided the facilities for the study and edited the manuscript. All authors read the manuscript and approved the final version.
CONFLICTS OF INTEREST
The authors declare that there is no conflicts of interes.
REFERENCES
1. Efferth T, Volm M. Multiple resistance to carcinogens and xenobiotics: P-glycoproteins as universal detoxifiers. Archives of Toxicology. 2017; 91:2515–38. https://doi.org/10.1007/s00204-017-1938-5.
2. Efferth T, Volm M. Pharmacogenetics for individualized cancer chemotherapy. Pharmacology & Therapeutics. 2005; 107:155–76. https://doi.org/10.1016/j.pharmthera.2005.02.005.
3. Lin SS, Lyu XD, Yu J, Sun L, Du DY, Lai YQ, Li HY, Wang Y, Zhang LY, Yin HP, Yuan ST. MHP-1 inhibits cancer metastasis and restores topotecan sensitivity via regulating epithelial-mesenchymal transition and TGF-beta signaling in human breast cancer cells. Phytomedicine. 2016; 23:1053–63. https://doi.org/10.1016/j.phymed.2016.06.013.
4. Guo Y, Ding YY, Zhang T, An HL. Sinapine reverses multi-drug resistance in MCF-7/dox cancer cells by downregulating FGFR4/FRS2 alpha-ERK1/2 pathway-mediated NF-kappa B activation. Phytomedicine. 2016; 23:267–73. https://doi.org/10.1016/j.phymed.2015.12.017.
5. Juengel E, Euler S, Maxeiner S, Rutz J, Justin S, Roos F, Khoder W, Nelson K, Bechstein WO, Blaheta RA. Sulforaphane as an adjunctive to everolimus counteracts everolimus resistance in renal cancer cell lines. Phytomedicine. 2017; 27:1–7. https://doi.org/10.1016/j.phymed.2017.01.016.
6. Volm M, Efferth T. Prediction of Cancer Drug Resistance and implications for Personalized Medicine. Frontiers in Oncology. 2015; 5:282.
7. Schmidt F, Efferth T. Tumor Heterogeneity, Single-Cell Sequencing, and Drug Resistance. Pharmaceuticals (Basel). 2016; 9.
8. Efferth T. The human ATP-binding cassette transporter genes: from the bench to the bedside. Curr Mol Med. 2001; 1:45–65.
9. Wu JJ, Zhu YF, Guo ZZ, Lou YM, He SG, Guan Y, Zhu LJ, Liu ZQ, Lu LL, Liu L. Aconitum alkaloids, the major components of Aconitum species, affect expression of multidrug resistance-associated protein 2 and breast cancer resistance protein by activating the Nrf2-mediated signalling pathway. Phytomedicine. 2017; 44:87–97. https://doi.org/10.1016/j.phymed.2017.12.007.
10. Efferth T, Osieka R. Clinical Relevance of the Mdr-1 Gene and Its Gene-Product, P-Glycoprotein, for Cancer-Chemotherapy - a Metaanalysis. Tumordiagnostik & Therapie. 1993; 14:238–43.
11. Teng YN, Sheu MJ, Hsieh YW, Wang RY, Chiang YC, Hung CC. beta-carotene reverses multidrug resistant cancer cells by selectively modulating human P-glycoprotein function. Phytomedicine. 2016; 23:316–23. https://doi.org/10.1016/j.phymed.2016.01.008.
12. Umsumarng S, Pitchakarn P, Yodkeeree S, Punfa W, Mapoung S, Ramli RA, Pyne SG, Limtrakul P. Modulation of P-glycoprotein by Stemona alkaloids in human multidrug resistance leukemic cells and structural relationships. Phytomedicine. 2017; 34:182–90. https://doi.org/10.1016/j.phymed.2017.08.004.
13. Boonyong C, Pattamadilok C, Suttisri R, Jianmongkol S. Benzophenones and xanthone derivatives from Garcinia schomburgkiana-induced P-glycoprotein overexpression in human colorectal Caco-2 cells via oxidative stress-mediated mechanisms. Phytomedicine. 2017; 27:8–14. https://doi.org/10.1016/j.phymed.2017.01.011.
14. Uggla B, Stahl E, Wagsater D, Paul C, Karlsson MG, Sirsjo A, Tidefelt U. BCRP mRNA expression v. clinical outcome in 40 adult AML patients. Leukemia Research. 2005; 29:141–6. https://doi.org/10.1016/j.leukres.2004.06.004.
15. Frank NY, Margaryan A, Huang Y, Schatton T, Waaga-Gasser AM, Gasser M, Sayegh MH, Sadee W, Frank MH. ABCB5-mediated doxorubicin transport and chemoresistance in human malignant melanoma. Cancer Research. 2005; 65:4320–33. https://doi.org/10.1158/0008-5472.Can-04-3327.
16. Hientz K, Mohr A, Bhakta-Guha D, Efferth T. The role of p53 in cancer drug resistance and targeted chemotherapy. Oncotarget. 2017; 8:8921–46. https://doi.org/10.18632/oncotarget.13475.
17. Shetzer Y, Solomon H, Koifman G, Molchadsky A, Horesh S, Rotter V. The paradigm of mutant p53-expressing cancer stem cells and drug resistance. Carcinogenesis. 2014; 35:1196–208. https://doi.org/10.1093/carcin/bgu073.
18. Wang W, Cheng B, Miao L, Mei Y, Wu M. Mutant p53-R273H gains new function in sustained activation of EGFR signaling via suppressing miR-27a expression. Cell Death & Disease. 2013; 4:e574.
19. Baselga J. Why the epidermal growth factor receptor? The rationale for cancer therapy. Oncologist. 2002; 7:2–8.
20. Nicholson RI, Gee JMW, Harper ME. EGFR and cancer prognosis. European Journal of Cancer. 2001; 37:S9–S15.
21. Rayet B, Gelinas C. Aberrant rel/nfkb genes and activity in human cancer. Oncogene. 1999; 18:6938–47. https://doi.org/10.1038/sj.onc.1203221.
22. Bentires-Alj M, Barbu V, Fillet M, Chariot A, Relic B, Jacobs N, Gielen J, Merville MP, Bours V. NF-kappa B transcription factor induces drug resistance through MDR1 expression in cancer cells. Oncogene. 2003; 22:90–7. https://doi.org/10.1038/sj.onc.1206056.
23. Zhao Y, Butler EB, Tan M. Targeting cellular metabolism to improve cancer therapeutics. Cell Death & Disease. 2013; 4:e532.
24. Biswas K, Chattopadhyay I, Banerjee RK, Bandyopadhyay U. Biological activities and medicinal properties of neem (Azadirachta indica). Current Science. 2002; 82:1336–45.
25. Priyadarsini RV, Manikandan P, Kumar GH, Nagini S. The neem limonoids azadirachtin and nimbolide inhibit hamster cheek pouch carcinogenesis by modulating xenobiotic-metabolizing enzymes, DNA damage, antioxidants, invasion and angiogenesis. Free Radic Res. 2009; 43:492–504.
26. Wang L, Phan DD, Zhang J, Ong PS, Thuya WL, Soo R, Wong AL, Yong WP, Lee SC, Ho PC, Sethi G, Goh BC. Anticancer properties of nimbolide and pharmacokinetic considerations to accelerate its development. Oncotarget. 2016; 7:44790–802. https://doi.org/10.18632/oncotarget.8316.
27. Priyadarsini RV, Murugan RS, Sripriya P, Karunagaran D, Nagini S. The neem limonoids azadirachtin and nimbolide induce cell cycle arrest and mitochondria-mediated apoptosis in human cervical cancer (HeLa) cells. Free Radic Res. 2010; 44:624–34. https://doi.org/10.3109/10715761003692503.
28. Elumalai P, Gunadharini DN, Senthilkumar K, Banudevi S, Arunkumar R, Benson CS, Sharmila G, Arunakaran J. Induction of apoptosis in human breast cancer cells by nimbolide through extrinsic and intrinsic pathway. Toxicology Letters. 2012; 215:131–42. https://doi.org/10.1016/j.toxlet.2012.10.008.
29. Elumalai P, Arunakaran J. Review on molecular and chemopreventive potential of nimbolide in cancer. Genomics Inform. 2014; 12:156–64. https://doi.org/10.5808/GI.2014.12.4.156.
30. Babykutty S, Priya PS, Nandini RJ, Kumar MA, Nair MS, Srinivas P, Gopala S. Nimbolide retards tumor cell migration, invasion, and angiogenesis by downregulating MMP-2/9 expression via inhibiting ERK1/2 and reducing DNA-binding activity of NF-kappa B in colon cancer cells. Molecular Carcinogenesis. 2012; 51:475–90. https://doi.org/10.1002/mc.20812.
31. Elumalai P, Mercy AB, Arunkamar R, Sharmila G, Bhat FA, Balakrishnan S, Singh PR, Arunakaran J. Nimbolide inhibits invasion and migration, and down-regulates uPAR chemokine gene expression, in two breast cancer cell lines. Cell Proliferation. 2014; 47:540–52. https://doi.org/10.1111/cpr.12148.
32. Hutchison DJ. Cross Resistance and Collateral Sensitivity Studies in Cancer Chemotherapy. Advances in Cancer Research. 1963; 7:235–350. https://doi.org/10.1016/S0065-230x(08)60984-7.
33. Kathawala RJ, Gupta P, Ashby CR, Chen ZS. The modulation of ABC transporter-mediated multidrug resistance in cancer: A review of the past decade. Drug Resistance Updates. 2015; 18:1–17. https://doi.org/10.1016/j.drup.2014.11.002.
34. Pluchino KM, Hall MD, Goldsborough AS, Callaghan R, Gottesman MM. Collateral sensitivity as a strategy against cancer multidrug resistance. Drug Resistance Updates. 2012; 15:98–105. https://doi.org/10.1016/j.drup.2012.03.002.
35. Mao QC, Unadkat JD. Role of the Breast Cancer Resistance Protein (BCRP/ABCG2) in Drug Transport-an Update. AAPS J. 2015; 17:65–82. https://doi.org/10.1208/s12248-014-9668-6.
36. Matas D, Sigal A, Stambolsky P, Milyavsky M, Weisz L, Schwartz D, Goldfinger N, Rotter V. Integrity of the N-terminal transcription domain of p53 is required for mutant p53 interference with drug-induced apoptosis. EMBO J. 2001; 20:4163–72. https://doi.org/10.1093/emboj/20.15.4163.
37. Kumar GH, Priyadarsini RV, Vinothini G, Letchoumy PV, Nagini S. The neem limonoids azadirachtin and nimbolide inhibit cell proliferation and induce apoptosis in an animal model of oral oncogenesis. Investigational New Drugs. 2010; 28:392–401. https://doi.org/10.1007/s10637-009-9263-3.
38. Li X, Wu C, Chen N, Gu H, Yen A, Cao L, Wang E, Wang L. PI3K/Akt/mTOR signaling pathway and targeted therapy for glioblastoma. Oncotarget. 2016; 7:33440–50. https://doi.org/10.18632/oncotarget.7961.
39. Mayer IA, Arteaga CL. The PI3K/AKT Pathway as a Target for Cancer Treatment. Annu Rev Med. 2016; 67:11–28. https://doi.org/10.1146/annurev-med-062913-051343.
40. Seebacher NA, Richardson DR, Jansson PJ. Glucose modulation induces reactive oxygen species and increases P-glycoprotein-mediated multidrug resistance to chemotherapeutics. British Journal of Pharmacology. 2015; 172:2557–72. https://doi.org/10.1111/bph.13079.
41. Wartenberg M, Ling FC, Schallenberg M, Baumer AT, Petrat K, Hescheler J, Sauer H. Down-regulation of intrinsic P-glycoprotein expression in multicellular prostate tumor spheroids by reactive oxygen species. J Biol Chem. 2001; 276:17420–8. https://doi.org/10.1074/jbc.M100141200.
42. Yu TC, Tang B, Sun XY. Development of Inhibitors Targeting Hypoxia-Inducible Factor 1 and 2 for Cancer Therapy. Yonsei Medical Journal. 2017; 58:489–96. https://doi.org/10.3349/ymj.2017.58.3.489.
43. Stine ZE, Walton ZE, Altman BJ, Hsieh AL, Dang CV. MYC, Metabolism, and Cancer. Cancer Discovery. 2015; 5:1024–39. https://doi.org/10.1158/2159-8290.CD-15-0507.
44. Holbeck SL. Update on NCI in vitro drug screen utilities. European Journal of Cancer. 2004; 40:785–93. https://doi.org/10.1016/j.ejca.2003.11.022.
45. Reilly PT, Yu Y, Hamiche A, Wang LS. Cracking the ANP32 whips: Important functions, unequal requirement, and hints at disease implications. Bioessays. 2014; 36:1062–71. https://doi.org/10.1002/bies.201400058.
46. Shen SM, Yu Y, Wu YL, Cheng JK, Wang LS, Chen GQ. Downregulation of ANP32B, a novel substrate of caspase-3, enhances caspase-3 activation and apoptosis induction in myeloid leukemic cells. Carcinogenesis. 2010; 31:419–26. https://doi.org/10.1093/carcin/bgp320.
47. Shi YQ, Zhai HH, Wang X, Han ZY, Liu CJ, Lan M, Du JP, Guo CC, Zhang YM, Wu KC, Fan DM. Ribosomal proteins S13 and L23 promote multidrug resistance in gastric cancer cells by suppressing drug-induced apoptosis. Experimental Cell Research. 2004; 296:337–46. https://doi.org/10.1016/j.yexcr.2004.02.009.
48. Roesch A, Vultur A, Bogeski I, Wang H, Zimmermann KM, Speicher D, Korbel C, Laschke MW, Gimotty PA, Philipp SE, Krause E, Patzold S, Villanueva J, et al. Overcoming Intrinsic Multidrug Resistance in Melanoma by Blocking the Mitochondrial Respiratory Chain of Slow-Cycling JARID1B(high) Cells. Cancer Cell. 2013; 23:811–25. https://doi.org/10.1016/j.ccr.2013.05.003.
49. Kowshik J, Mishra R, Sophia J, Rautray S, Anbarasu K, Reddy GD, Dixit M, Mahalingam S, Nagini S. Nimbolide upregulates RECK by targeting miR-21 and HIF-1 alpha in cell lines and in a hamster oral carcinogenesis model. Scientific Reports. 2017; 7:2045.
50. Dolcet X, Llobet D, Pallares J, Matias-Guiu X. NF-kB in development and progression of human cancer. Virchows Archiv. 2005; 446:475–82. https://doi.org/10.1007/s00428-005-1264-9.
51. Gupta SC, Prasad S, Reuter S, Kannappan R, Yadav VR, Ravindran J, Hema PS, Chaturvedi MM, Nair M, Aggarwal BB. Modification of cysteine 179 of IkappaBalpha kinase by nimbolide leads to down-regulation of NF-kappaB-regulated cell survival and proliferative proteins and sensitization of tumor cells to chemotherapeutic agents. J Biol Chem. 2010; 285:35406–17. https://doi.org/10.1074/jbc.M110.161984.
52. Ma HY, Cheng L, Hao KJ, Li YP, Song XB, Zhou HM, Jia L. Reversal Effect of ST6GAL 1 on Multidrug Resistance in Human Leukemia by Regulating the PI3K/Akt Pathway and the Expression of P-gp and MRP1. PLoS One. 2014; 9:e85113.
53. Efferth T, Sauerbrey A, Olbrich A, Gebhart E, Rauch P, Weber HO, Hengstler JG, Halatsch ME, Volm M, Tew KD, Ross DD, Funk JO. Molecular modes of action of artesunate in tumor cell lines. Molecular Pharmacology. 2003; 64:382–94. https://doi.org/10.1124/Mol.64.2.382.
54. Boyer J, McLean EG, Aroori S, Wilson P, McCulla A, Carey PD, Longley DB, Johnston PG. Characterization of p53 wild-type and null isogenic colorectal cancer cell lines resistant to 5-fluorouracil, oxaliplatin, and irinotecan. Clinical Cancer Research. 2004; 10:2158–67. https://doi.org/10.1158/1078-0432.Ccr-03-0362.
55. Alley MC, Scudiero DA, Monks A, Hursey ML, Czerwinski MJ, Fine DL, Abbott BJ, Mayo JG, Shoemaker RH, Boyd MR. Feasibility of Drug Screening with Panels of Human-Tumor Cell-Lines Using a Microculture Tetrazolium Assay. Cancer Research. 1988; 48:589–601.
56. O’Brien J, Wilson I, Orton T, Pognan F. Investigation of the Alamar Blue (resazurin) fluorescent dye for the assessment of mammalian cell cytotoxicity. European Journal of Biochemistry. 2000; 267:5421–6. https://doi.org/10.1046/j.1432-1327.2000.01606.x.
57. Kuete V, Mbaveng AT, Sandjo LP, Zeino M, Efferth T. Cytotoxicity and mode of action of a naturally occurring naphthoquinone, 2-acetyl-7-methoxynaphtho[2,3-b]furan-4,9-quinone towards multi-factorial drug-resistant cancer cells. Phytomedicine. 2017; 33:62–8. https://doi.org/10.1016/j.phymed.2017.07.010.
58. Kadioglu O, Fu YJ, Wiench B, Zu YG, Efferth T. Synthetic cajanin stilbene acid derivatives inhibit c-MYC in breast cancer cells. Archives of Toxicology. 2016; 90:575–88. https://doi.org/10.1007/s00204-015-1480-2.
59. Gillet JP, Efferth T, Steinbach D, Hamels J, de Longueville F, Bertholet V, Remacle J. Microarray-based detection of multidrug resistance in human tumor cells by expression profiling of ATP-binding cassette transporter genes. Cancer Research. 2004; 64:8987–93. https://doi.org/10.1158/0008-5472.Can-04-1978.
60. Saeed MEM, Mahmoud N, Sugimoto Y, Efferth T, Abdel-Aziz H. Molecular Determinants of Sensitivity or Resistance of Cancer Cells Toward Sanguinarine. Frontiers in Pharmacology. 2018; 9:136.
61. Saeed M, Jacob S, Sandjo LP, Sugimoto Y, Khalid HE, Opatz T, Thines E, Efferth T. Cytotoxicity of the Sesquiterpene Lactones Neoambrosin and Damsin from Ambrosia maritima Against Multidrug-Resistant Cancer Cells. Frontiers in Pharmacology. 2015; 6:267.
62. Paull KD, Shoemaker RH, Hodes L, Monks A, Scudiero DA, Rubinstein L, Plowman J, Boyd MR. Display and Analysis of Patterns of Differential Activity of Drugs against Human-Tumor Cell-Lines - Development of Mean Graph and Compare Algorithm. Journal of the National Cancer Institute. 1989; 81:1088–92. https://doi.org/10.1093/jnci/81.14.1088.
63. Efferth T, Konkimalla VB, Wang YF, Sauerbrey A, Meinhardt S, Zintl F, Mattern J, Volm M. Prediction of broad spectrum resistance of tumors towards anticancer drugs. Clinical Cancer Research. 2008; 14:2405–12. https://doi.org/10.1158/1078-0432.CCR-07-4525.
64. Seo EJ, Saeed M, Law BY, Wu AG, Kadioglu O, Greten HJ, Efferth T. Pharmacogenomics of Scopoletin in Tumor Cells. Molecules. 2016; 21:496.