
INTRODUCTION
Ependymomas (EPN) are uncommon gliomas that recapitulate the ependymal cells lining the ventricles and spinal cord [1]. They occur throughout the neuraxis and are the third most common central nervous system (CNS) neoplasm in children [1]. Surgical resection is the treatment of choice with limited role for adjuvant radiotherapy [2, 3]. However, despite advances in neurosurgical techniques and higher rates of gross total excision, there has been little change in the overall and progression free survival of intracranial EPNs [4]. Histologically similar EPNs show site-specific differences in biological behavior and are postulated to arise from site-specific subsets of radial glia-like stem cells [5]. Large scale DNA methylation profiling has delineated nine molecular subgroups that predict outcome better than World Health Organisation (WHO) histological grade [1, 6]. Among these, the two largest subgroups: ST-EPN-RELA and PF-EPN-A, represented by supratentorial (ST) WHO Grade II/III EPNs harboring RELA fusions and posterior fossa (PF) WHO Grade II/III childhood EPNs with a CpG island methylator phenotype (CIMP) respectively, are associated with extremely poor outcomes [1, 6–8]. Further insights into the pathogenesis of these enigmatic tumors, particularly of the aggressive subgroups, are necessary to identify newer prognostic markers and therapeutic targets and thereby, devise alternate treatment modalities.
Epithelial-to-Mesenchymal Transition (EMT) is an evolutionary conserved physiological and developmental process that results in a series of rapid changes in cellular phenotype [9]. During EMT, epithelial cells down-regulate cell-cell adhesion, alter polarity and reorganize cytoskeletal structures to become disengaged from surrounding cells and acquire motility and invasiveness [9, 10]. In cancer, the process of EMT confers enhanced metastatic potential, increases stem cell-like characteristics, inhibits apoptosis and aids in immune escape, all of which are fundamental events in tumor progression [9–13]. The cardinal EMT regulating transcription factors (TFs): Snail and Slug have been found to be upregulated in various cancers [14–22], including ependymomas [23]. However, the mechanisms by which Snail and Slug contribute to the pathogenesis and aggressiveness of these tumors are largely unexplored.
Co-expression analysis of genes has recently emerged as a powerful tool for multi-gene analysis of large scale datasets [24]. While comparisons of gene expression datasets list out differentially expressed genes, distinguishing the functionally important genes remains challenging. Clarke C et al described the concept of gene co-expression analysis as ‘guilt-by-association’, wherein the groups of genes (also known as co-expressed modules) that maintain a consistent co-expression pattern likely share a common biological role and functional importance [25]. Co-expression analysis tools have been widely used in numerous biological investigations [26], including cancer biology. EGFR and PDGFR gene co-expression modules identified molecular subgroups of gliomas with distinct genomic/transcriptomic patterns and clinical outcome [27]. A TCGA-Glioma based co-expression study for CD133 and CD44 in glioblastomas (GBM) reported that CD133 module tumors were enriched for the Proneural GBM subtype, while CD44 module tumors were enriched in Mesenchymal subtype [28]. Another TCGA expression based study in Grade II and III oligodendrogliomas identified a co-expression network of six mitosis-regulating genes: AURKA, NDC80, CENPK, KIAA0101, TIMELESS and MELK that was found to have association with histological grade, TCGA subtype, proliferative indices and patient outcome [29]. Similar studies are lacking in ependymomas and we aimed to perform gene co-expression analysis for Snail and Slug genes in EPNs to explore and identify potential genes of pathogenic significance.
RESULTS
A total of 75 in-house samples of Grade II/III ependymomas were included in the study, subdivided into five clinico-pathologic-molecular subgroups, viz. ST-RELA+, ST-RELA-, PF-A, PF-B and SP, based on site, C11orf95-RELA fusions (in ST EPNs), and age (in PF EPNs). The clinicopathological features are summarized in Supplementary Table 1. YAP1 fusions were not detected in any of the ST EPNs tested.
Gene expression analysis identified consistent upregulation of Snail and Slug in intracranial EPNs across independent cohorts
Analysis of the three gene expression microarray datasets of EPNs: GSE27279 [7], GSE21687 [30] and GSE50385 [31], revealed overexpression of Snail and Slug in intracranial as compared to spinal EPNs (p=0.002) (Figure 1A). qRT-PCR for Snail and Slug on the 75 in-house EPNs showed higher expression levels of Snail and Slug in ST-RELA+ subset as compared to ST-RELA-, and higher expression levels in pediatric PF EPNs (PF-A) as compared to PF-B group, while SP group showed minimal upregulation of these transcription factors (Figure 1B).
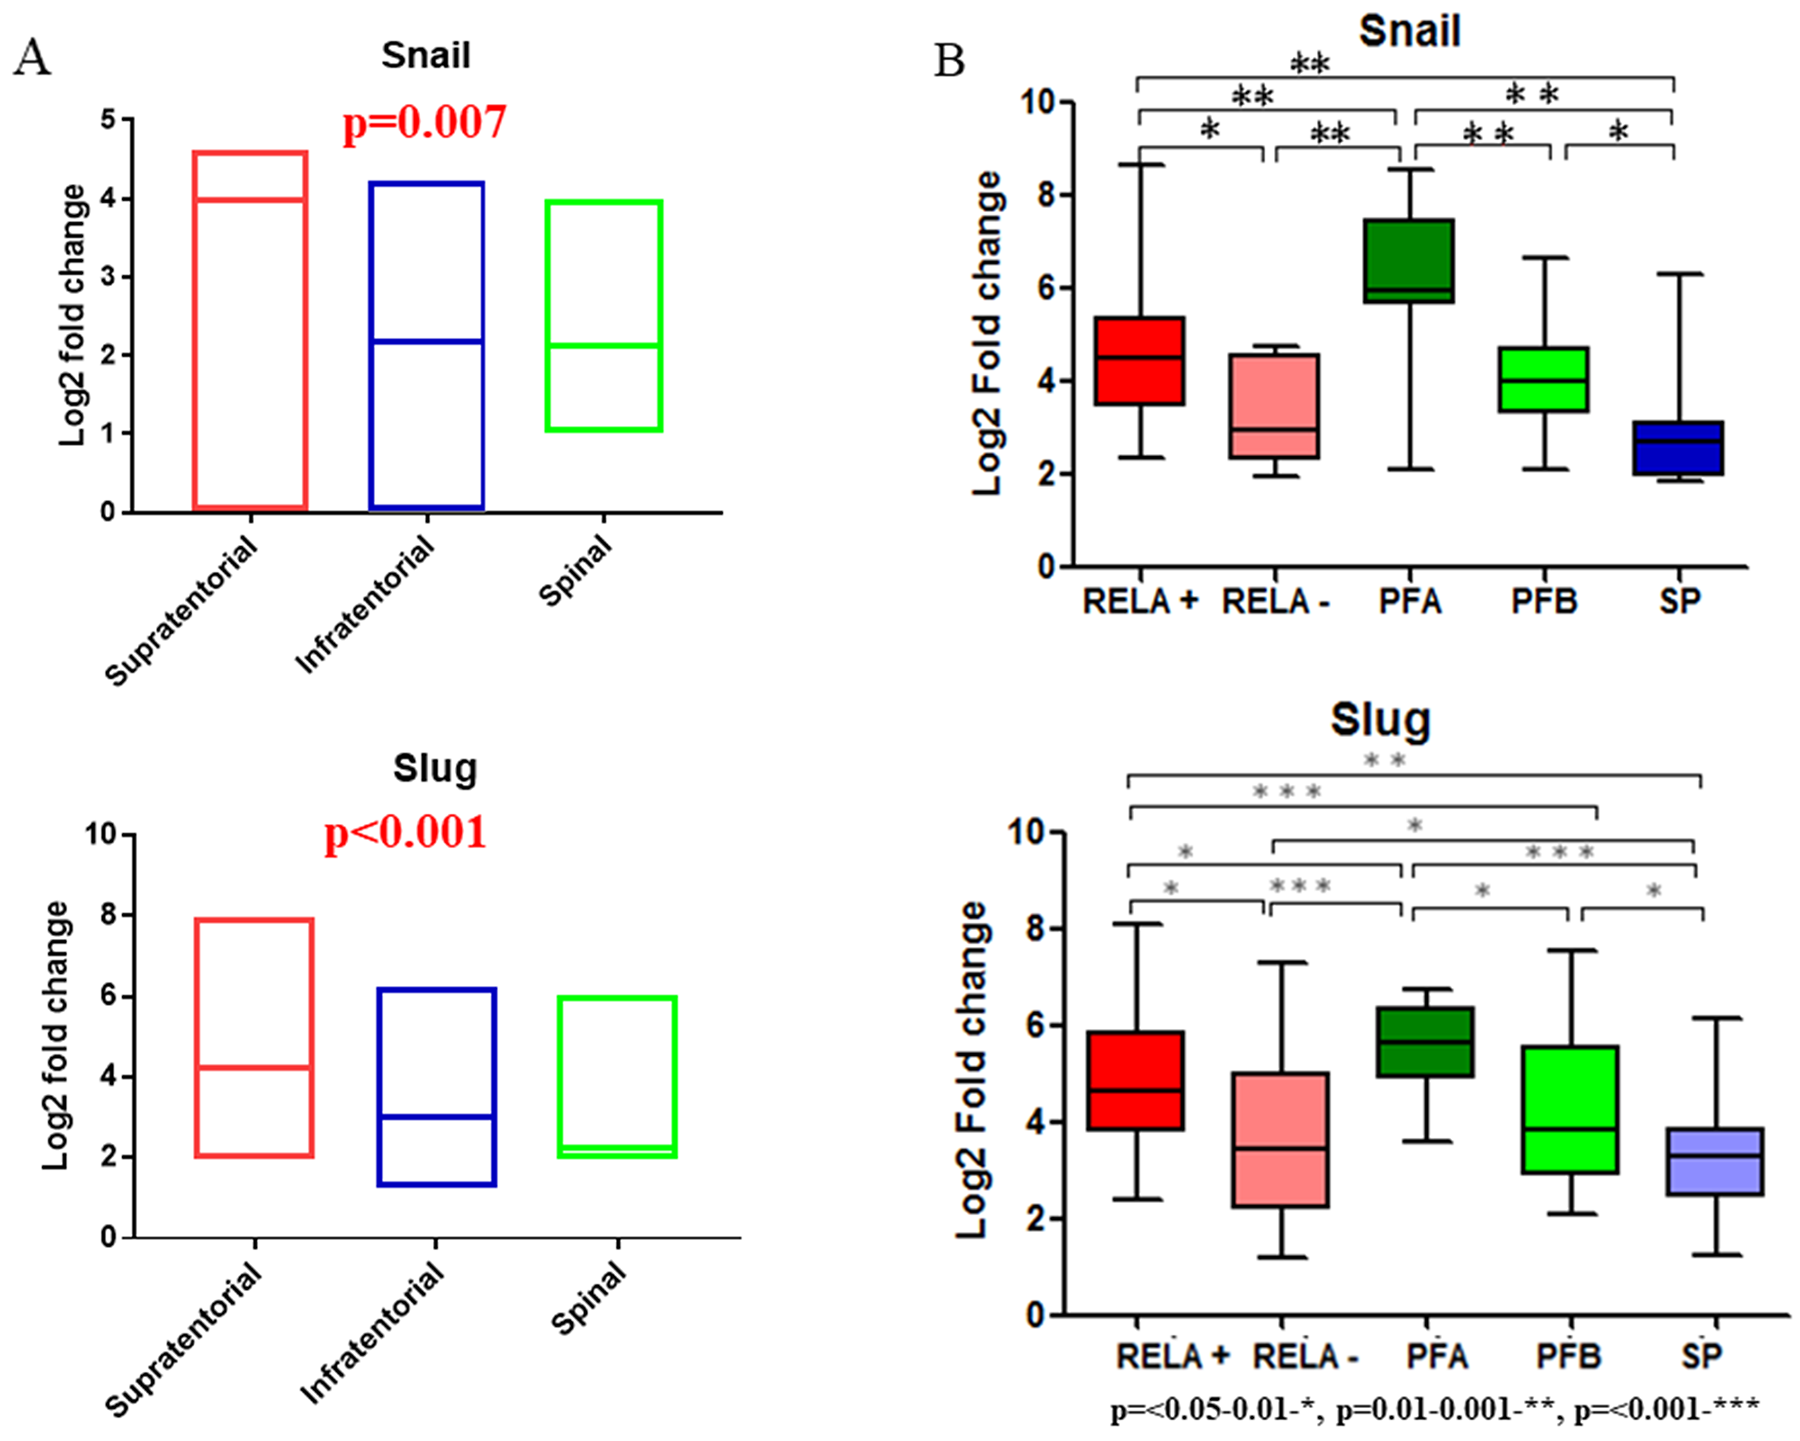
Figure 1: Gene expression analysis for Snail and Slug using published ependymoma cohorts and qRT-PCR data (in-house) in relation to molecular subgroups. Box plots for gene expression analysis of Snail and Slug in supratentorial, infratentorial and spinal compartments (A). Realtime Quantitative PCR analysis for Snail and Slug expression in different molecular subgroups of in-house ependymomas (B).
Gene co-expression network analysis and its functional annotation identifies distinct cellular functions regulated by Snail and Slug
Gene co-expression network analysis using R2 software on GSE27279 dataset [7] generated a total of 634 and 757 genes for Snail (positive=241, negative=393) and Slug (positive=364, negative=393) respectively (Figure 2A and 2B), of which only 37 genes were common to both gene-sets, indicating limited number of genes that are co-regulated by both Snail and Slug (Figure 2B). Among 593 genes co-regulated only by Snail, KEGG (Kyoto Encyclopedia of Genes and Genomes) pathway analyzing tool identified Osteoclast differentiation (p= 0.0001), TGF-β signaling pathway (p= 0.019) and Inositol phosphate metabolism (p= 0.024) as the enriched pathways (Figure 2B, Supplementary Table 2A). In biological processes, regulation of transcription, DNA-dependent (GO:0006355;p=3.8X10⁻¹²), cell adhesion (GO:0007155;p=3.2X10⁻⁵) and chromatin modification (GO:0016568;p=0.0004) were the most enriched regulatory networks (Figure 2B, Supplementary Table 2B). In contrast, among the 717 genes co-regulated only by Slug, focal adhesion (p=8.05X10⁻¹⁰), ECM-receptor interaction (p=5.53X10⁻⁸) and pathways in cancer (p=1.06X10⁻⁶) were the top 3 enriched pathways (Figure 2B, Supplementary Table 2C). Biological processes such as cilium assembly (GO:0042384:p=1.06X10⁻⁵), microtubule-based movement (GO:0007018:p=1.07X10⁻⁵) and cell projection organization (GO:0030030:p=3.47X10⁻⁵) were observed for Slug co-regulated genes in GO analysis (Figure 2B, Supplementary Table 2D). This data suggests that Snail family members (Snail and Slug) regulate distinct cellular functions in ependymomas including cell proliferation, cellular motility and transcription regulation.
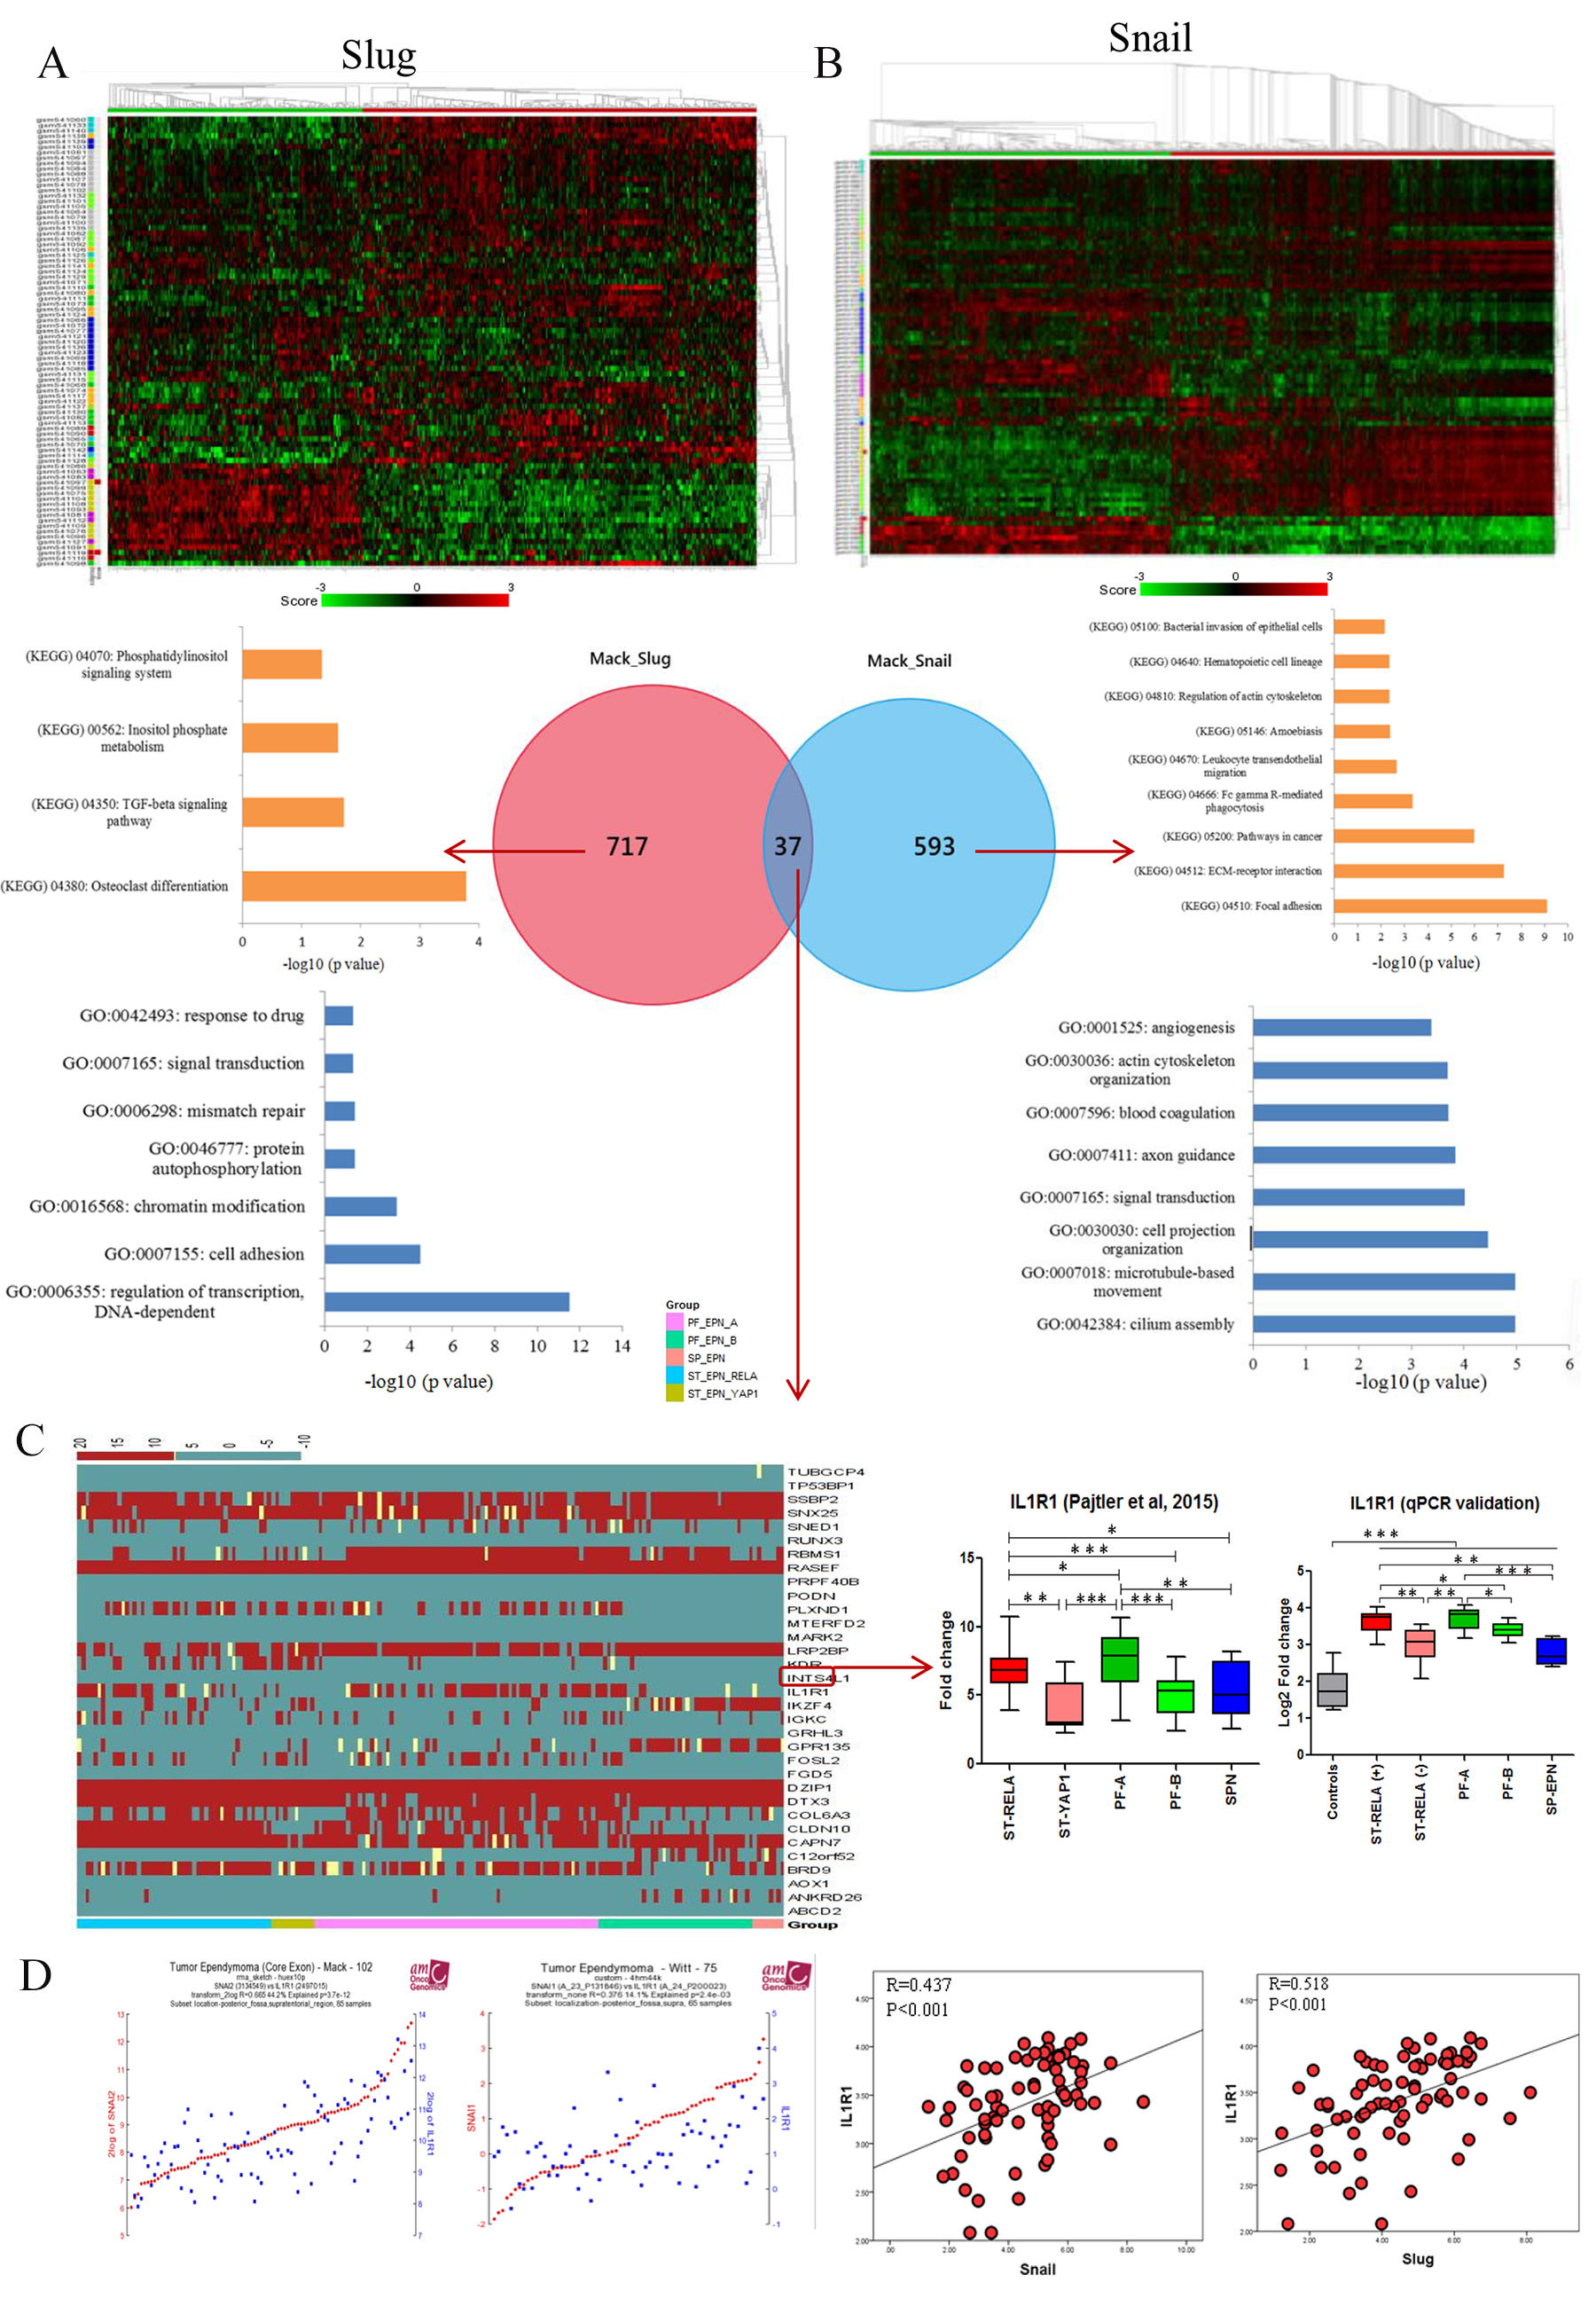
Figure 2: Co-expression network analysis of Snail and Slug and identification of IL1R1. Heatmap and Venn diagram showing different co-expressed genes with its pathway analysis for Snail and Slug (A and B), Heatmap for 37 co-expressed genes between Snail and Slug and expression of IL1R1 in published dataset (Pajtler KW, et al. 2015) and in-house cohort (C), Correlation plots of IL1R1 expression in published dataset and in-house cohort with Snail and Slug expression (D).
IL1R1, a positive correlated gene regulated by both Snail and Slug, shows higher expression levels in ST-EPN-RELA and PF-EPN-A molecular subgroups
The expression outcome of the 37 genes that were common to both Snail and Slug gene-sets were annotated by their expression status within Grade II and III ependymomas of GSE64415 dataset molecularly sub-grouped into ST-EPN-RELA, ST-EPN-YAP1, PF-EPN-A, PF-EPN-B and SP-EPN [6]. Among the 37 genes, the expression of IL1R1, a cytokine receptor belonging to the interleukin-1 receptor family, was selectively high in the most aggressive molecular subgroups viz. ST-EPN-RELA and PF-EPN-A leading us to explore IL1R1 further. We first validated expression levels of IL1R1 on in-house EPN samples and observed upregulated IL1R1 expression in ST-RELA+ subgroup as compared to ST-RELA- (p<0.001), and in PF-A group as compared to PF-B group (p<0.01) (Figure 2C). Next, we found a significant positive correlation between IL1R1 expression and both Snail (R=0.437; p<0.001) and Slug (R=0.518; p<0.001) (Figure 2D), suggesting an association of IL1R1 with EMT-like phenotype in EPNs. Prediction of protein-protein interactions (PPIs) of IL1R1 from an online database STRING (http://string.embl.de/) showed direct (physical) and indirect (functional) interactions of IL1R1 with components of NF-kB pathway (RELA, MYD88, NFKB1, SOCS3), JAK-STAT pathway (STAT1, STAT5, JAK2), P13K pathway (PIK3R1, PIK3CA) and MAPK pathway (MAP3K1, MAP3K7, MAP4K4) (Figure 3A), all of which have been previously implicated in the pathogenesis of intracranial EPNs [5–8, 30], pointing towards a central role for IL1R1 in various oncogenic and stemness related pathways in EPNs.
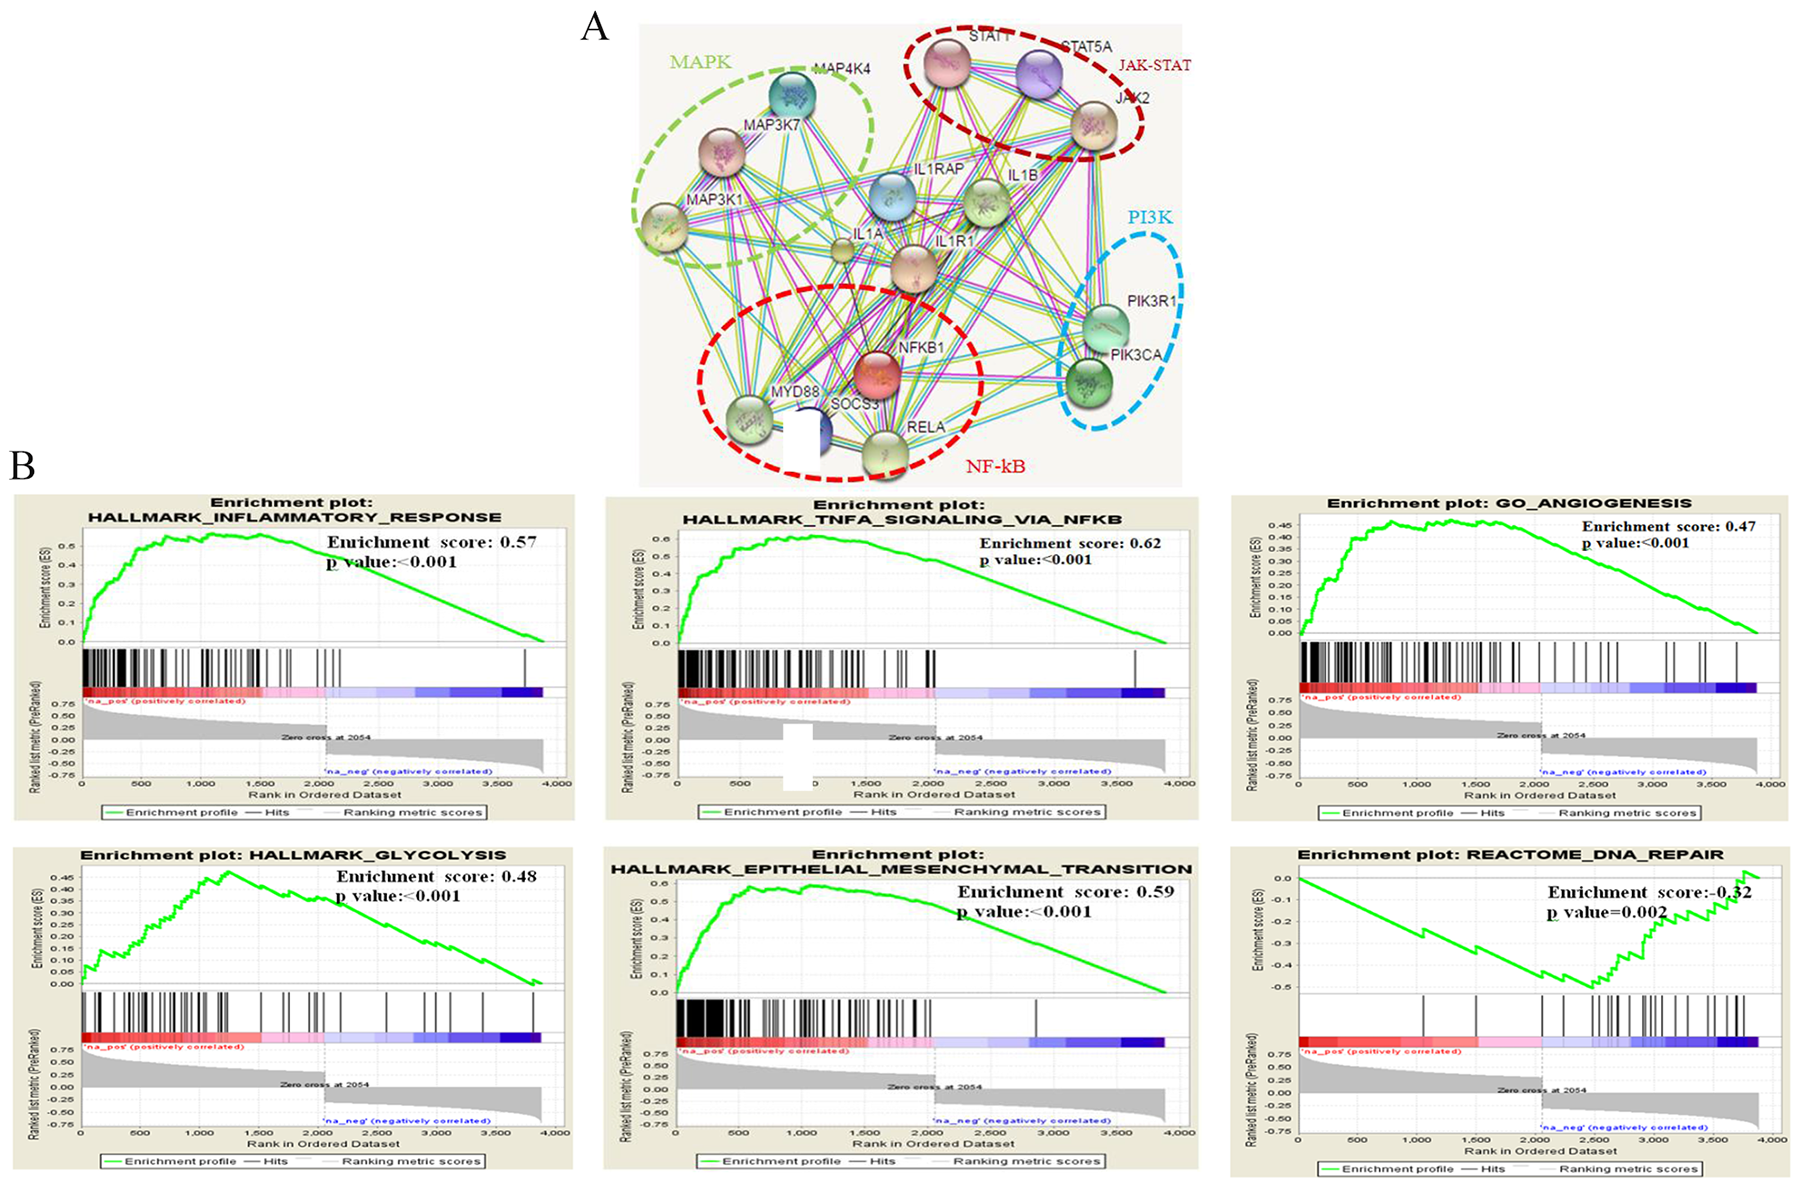
Figure 3: Regulation and pathway analysis of IL1R1. Protein-protein interaction (PPI) analysis of IL1R1 using STRING database (A), GSEA analysis of IL1R1 co-expressed genes in RELA and PF-A subgroup from published dataset (Pajtler KW, et al. 2015) indicating inflammatory, EMT and angiogenesis related pathway to be enriched (B).
Inflammatory, angiogeneic and EMT related factors are regulatory network for IL1R1 in ST-EPN-RELA and PF-EPN-A ependymomas
The preferential high expression of IL1R1 in ST-EPN-RELA and PF-EPN-A molecular subgroups led us to search for similarities in the transcriptional activation patterns of IL1R1 by using GSEA within a dataset of ST-EPN-RELA and PF-EPN-A molecular subgroups [6]. Gene sets for inflammation (GO_ACTIVATION_OF_IMMUNE_RESPONSE, GO_CYTOKINE_MEDIATED_SIGNALING_PATHWAY, HALLMARK_INFLAMMATORY_RESPONSE, HALLMARK_TNFA_SIGNALING_VIA_NFKB), angiogenesis (GO_ANGIOGENESIS), epithelial-to-mesenchymal transition (HALLMARK_EPITHELIAL_MESENCHYMAL_ TRANSITION) and glycolysis (HALLMARK_GLYCOLYSIS) showed positive enrichment with IL1R1 expression, whileREACTOME_DNA_REPAIR showed negative enrichment with IL1R1 expression (Figure 3B).
IL1R1 is expressed in the ependymal lining and sub-ventricular zone of juvenile mice and correlates with neural stem cell markers
We analyzed publically available in-situ hybridization data from the Allen Developing Mouse Brain Atlas to investigate the anatomical distribution of IL1R1 transcription. We found strong expression of IL1R1 mRNA in ependymal lining and sub-ventricular zone in juvenile mice (P14), while there was loss of IL1R1 mRNA in ependymal lining of adult mice (56 days) (Figure 4A). Considering that this subventricular zone is known to harbor stem cells capable of divergent differentiation [32] and radial-glia like stem cells are postulated to give rise to EPNs [5], we attempted to correlate IL1R1 expression with known neural stem cell markers of subventricular zone such as GFAP, Tenascin C, ID2 and RUNX1 [5, 33–35]. Interestingly, a significant positive correlation was observed between IL1R1 and TNC (R=0.45, p<0.001), GFAP (R=0.48, p<0.001), RUNX1 (R=0.52, p<0.001) and ID2 (R=0.40, p<0.001) on analyzing GSE64415 dataset [6] (Figure 4B). This suggests that IL1R1 may play a role in differentiation and proliferation of neural stem cells.
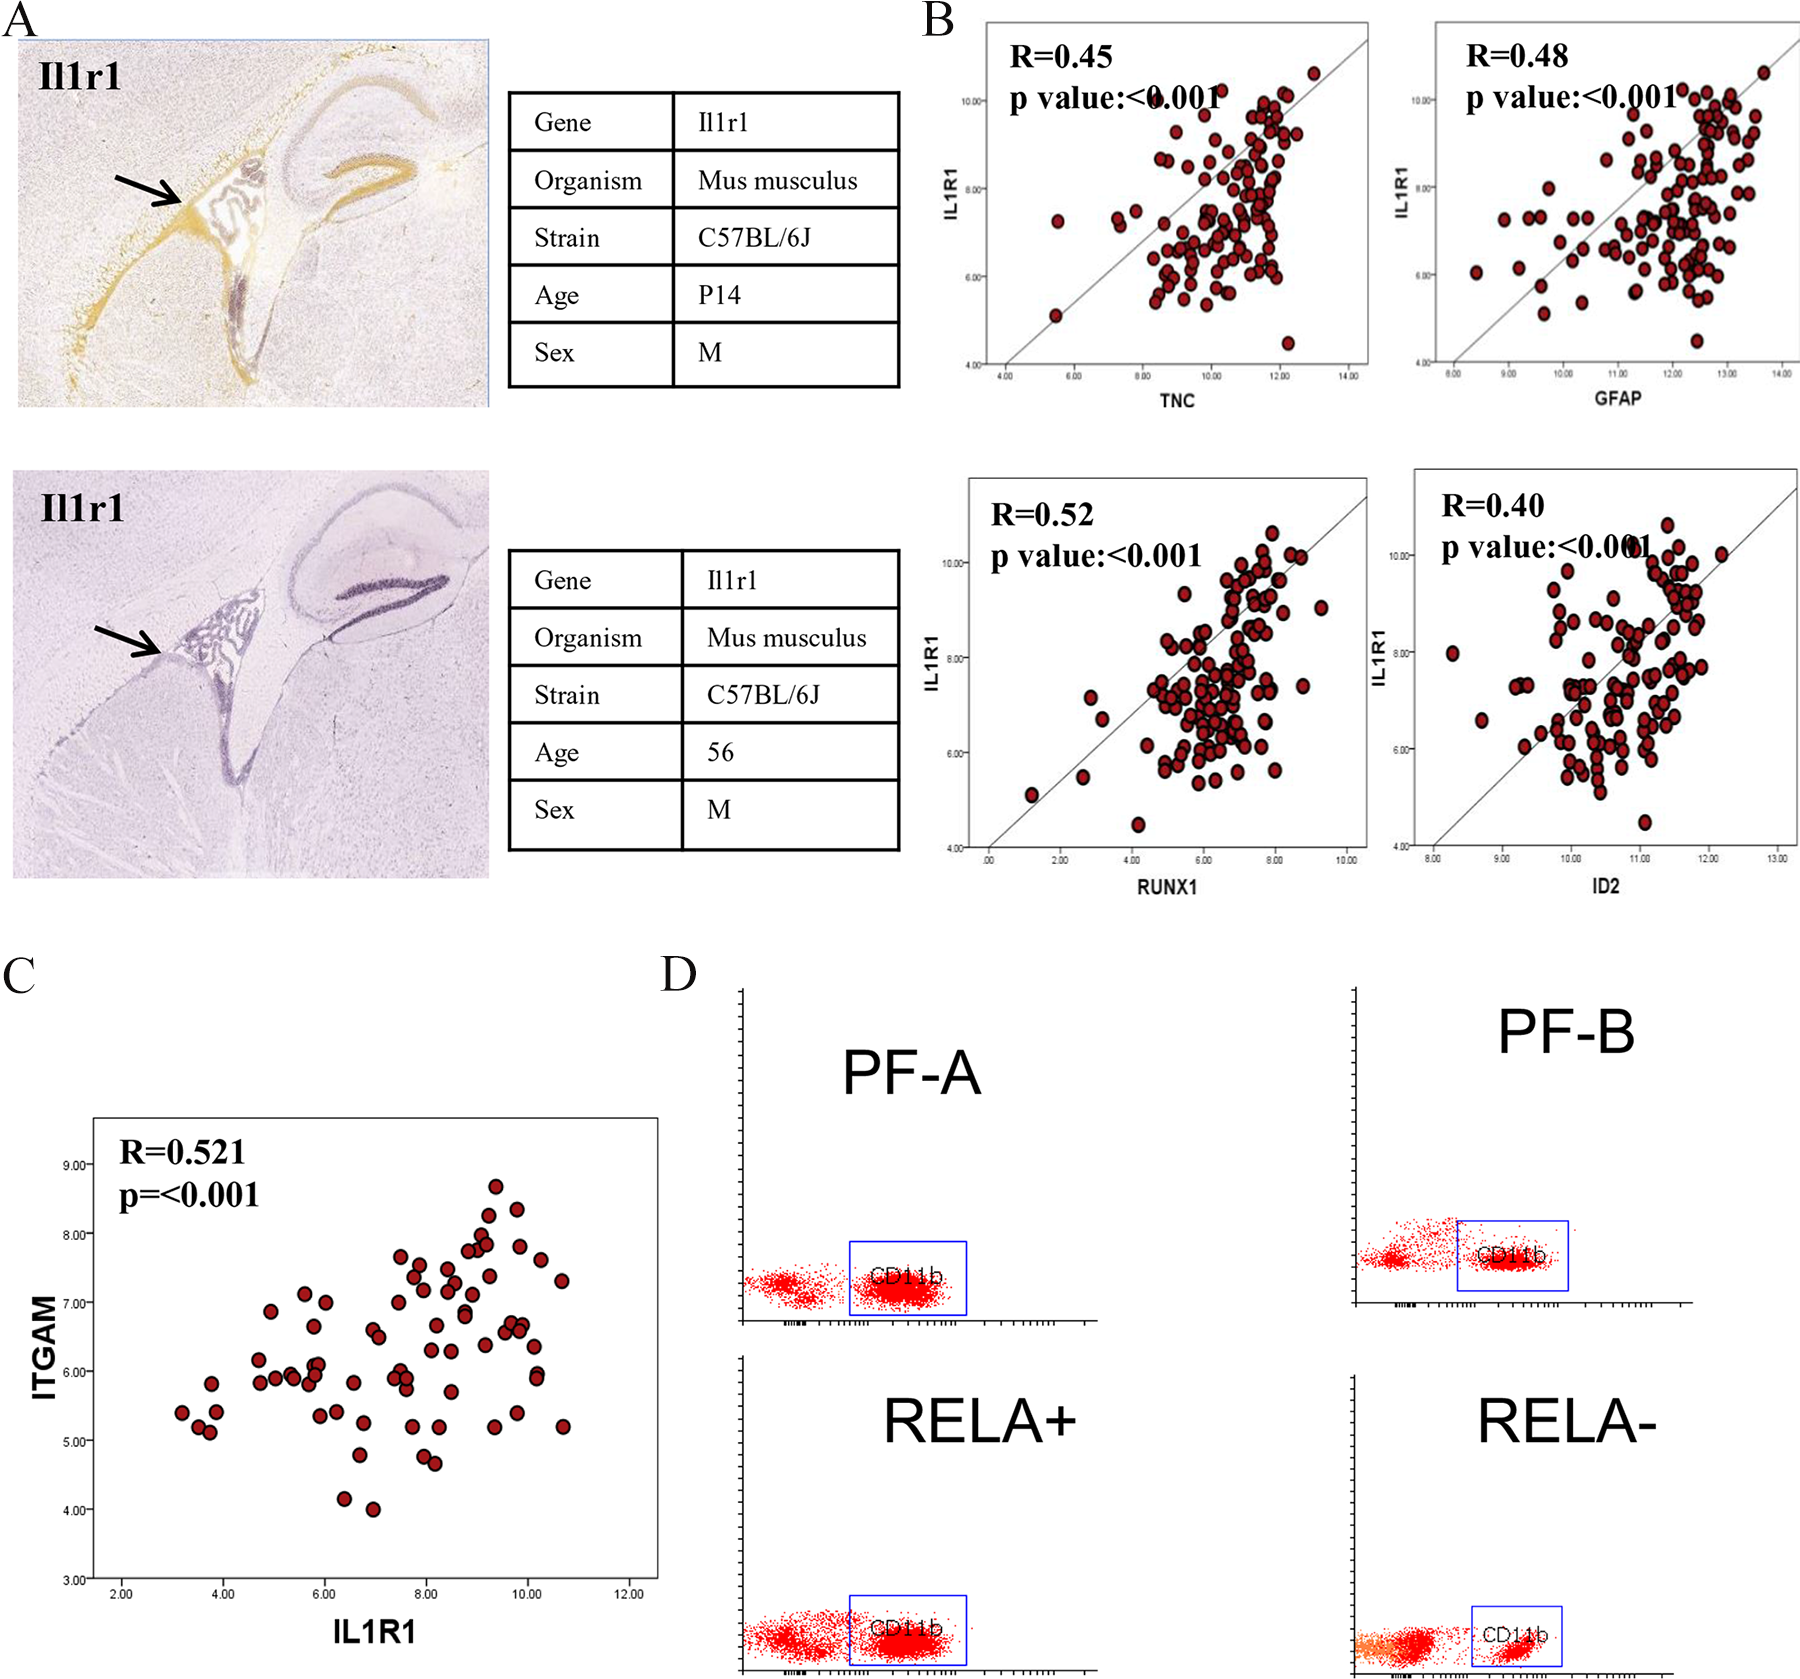
Figure 4: IL1R1 expression and its relation to neural stem cells and MDSC cells. In-situ hybridization images for IL1R1 expression in developing and adult mice (A), Correlation of IL1R1 expression with neural stem cells related genes (B), Correlation plot between IL1R1 and ITGAM/ CD11b expression (C), Flow cytometer analysis of CD11b cells in molecular subgroups of ependymomas (D).
IL1R1 correlates with increased numbers of tumor derived myeloid derived suppressor cells (CD11b+)
IL1R1 is known to activate myeloid derived suppressor cells (MDSCs) through IL1β [36]. Gene expression data of ST-EPN-RELA and PF-EPN-A molecular subgroups of Pajtler et al [6] was analyzed for expression levels of ITGAM/CD11b+(marker of MDSCs cells) and correlated with IL1R1 expression. A significant positive correlation was obtained between IL1R1 and ITGAM (R=0.52, p<0.001) (Figure 4C). To validate this finding, FACS was performed for enumeration of CD11b+ cells in 16 in-house EPN tumor samples [ST-RELA+ (n=4), ST-RELA- (n=4), PF-A (n=4), PF-B (n=4)]. Interestingly, a significantly higher population of CD11b+ MDSCs was observed in ST-RELA+ cases as compared to ST-RELA- (p=0.021) and PF-A as compared to PF-B (p=0.003) (Figure 4D).
IL1R1 expression is higher in ependymomas as compared to other CNS tumors
We next analyzed IL1R1 expression in other aggressive CNS tumors such as adult and pediatric gliomas, CNS/PNETs and medulloblastomas. Utilizing R2 software for selected GEO databases of different CNS tumors [37–41], as mentioned in methodology, we found that high expression levels of IL1R1 were unique to EPNs (p<0.001) (Figure 5A). While slight elevations of IL1R1 mRNA was noted in other gliomas as well, EPNs showed significantly higher expression levels (2 to 3 fold differences, p < 0.01). This selective expression of IL1R1 in ependymomas suggests the possibility of IL1R1 serving as a diagnostic marker for intracranial ependymomas and a potential therapeutic target.
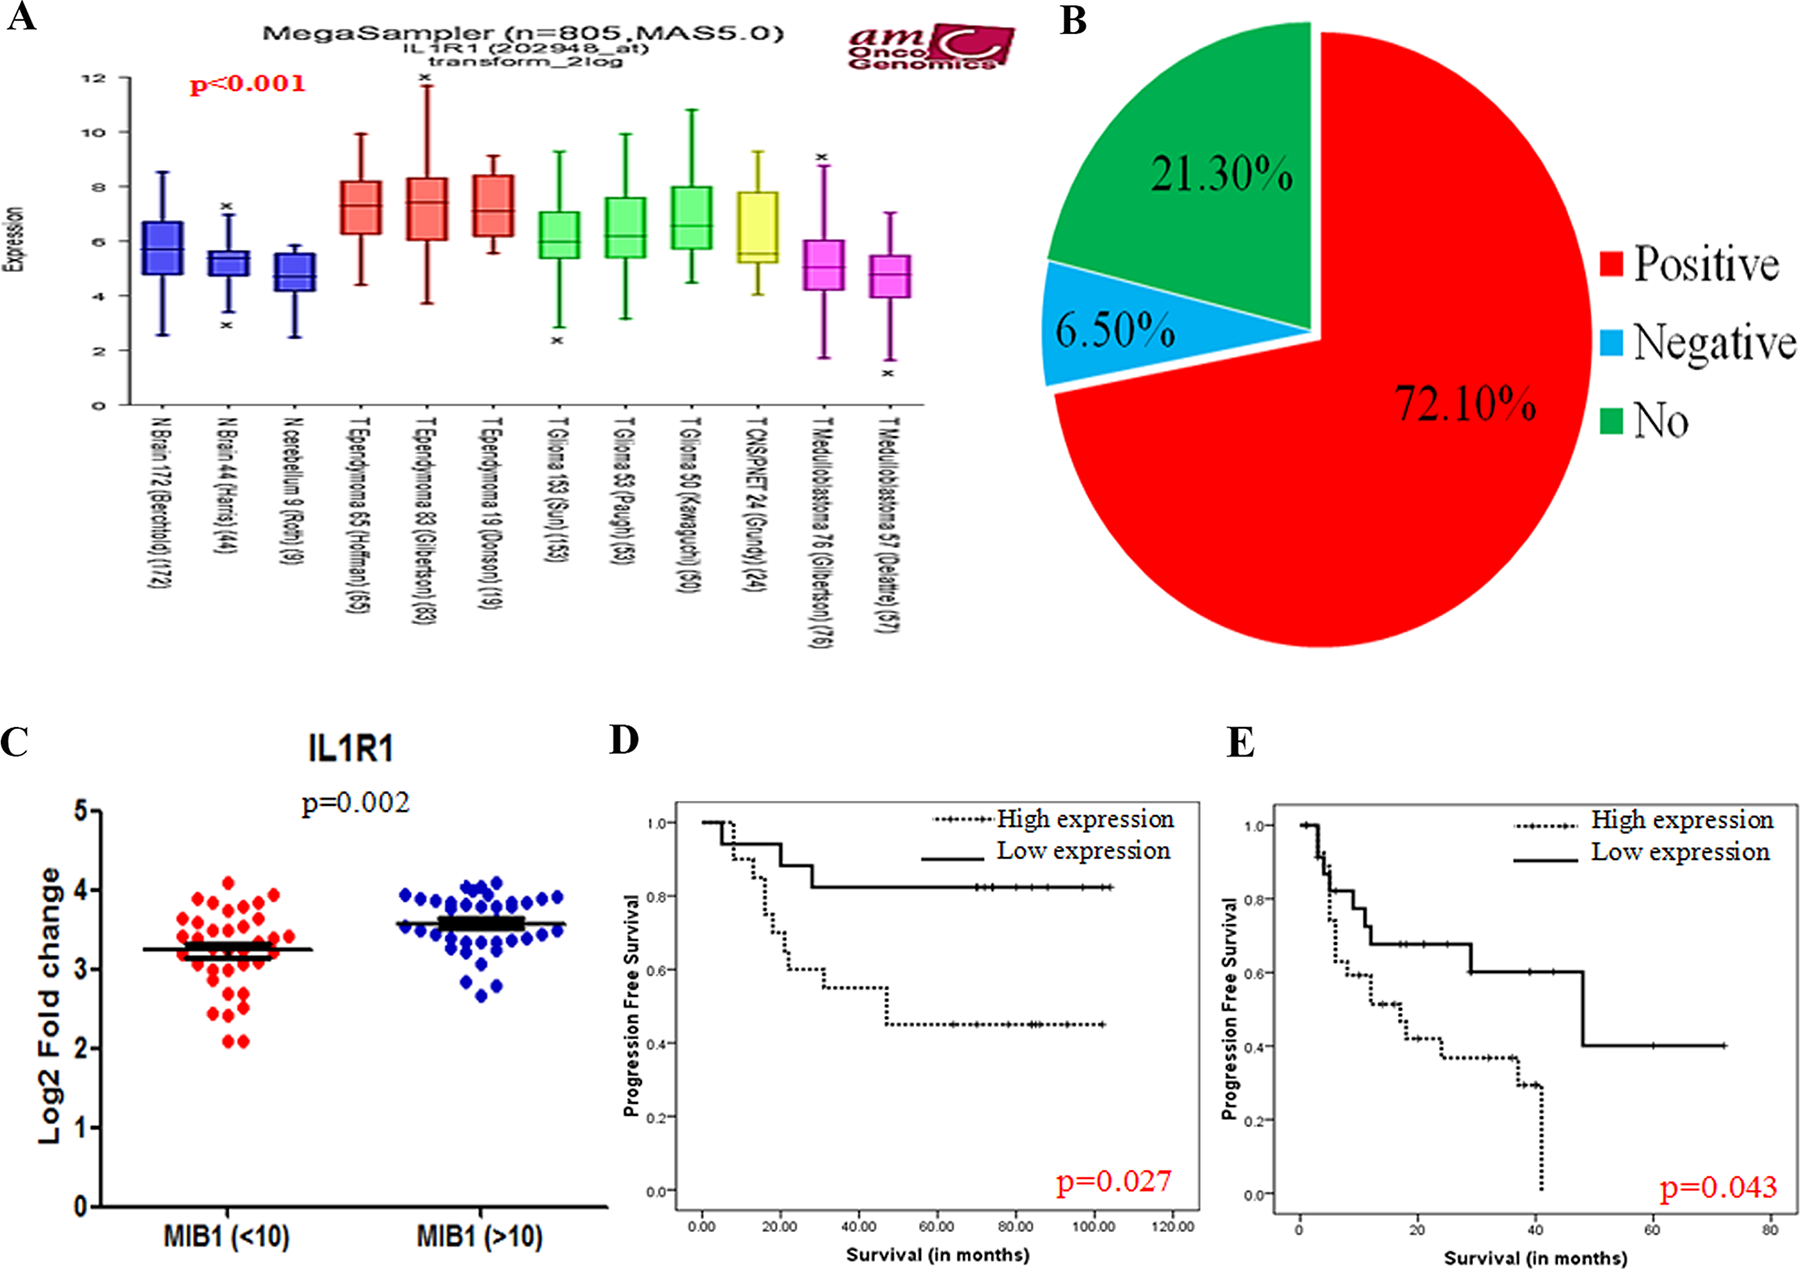
Figure 5: IL1R1 expression and its clinical importance. Gene expression of IL1R1 expression in different CNS tumors and normal brain (A), Pie chart for correlation of IL1R1 expression with EMT related genes (B), Scatter plot of in-house IL1R1 expression with high (≥10%) and low (<10%) MIB1/Ki-67 labelling indices (C), Univariate progression free survival analysis for IL1R1 expression in external cohort GSE27287 [7] (D) and in-house samples (E).
IL1R1 significantly associates with EMT signatures
To gain deeper insights into the molecular functions of IL1R1 in driving the aggressive phenotype in ependymomas, correlations were performed for IL1R1 expression with published gene-sets of EMT signatures using gene expression data of Pajtler K, et al. [6] for Grade II and III EPNs. It was interesting to note that a high percentage of EMT genes (72.1%, 44/61), including POSTN (R=0.538, p=<0.001), ADAM12 (R=0.633, p=<0.001) and LOX (R=0.337, p=<0.001), known to have an active role in activation and maintenance of EMT-like phenotype, positively correlated with IL1R1 expression across 5 molecular subgroups (Figure 5B). Less than 10% of genes (6.5%, 4/61) showed significant negative correlation such as THYN1 (R=-0.420, p=<0.001) and SULF1 (R=-0.287, p=0.002), while the remaining 21.3% (13/61) genes showed no correlation with IL1R1.
High IL1R1 expression correlates with higher tumor cell proliferation rate and worse clinical outcome
IL1R1 expression significantly correlated with higher MIB1/Ki-67 labelling indices (≥10%) (p=0.002) (Figure 5C). On univariate analyses, we found significantly increased hazard ratios and poor disease-free survival in patients with high expression levels of IL1R1 (HR=4.37, p=0.009) within the in-house EPN cohort (Figure 5D). Although multivariate analysis could not be performed due to small number of events in our cohort, we confirmed the poor prognosis of high IL1R1 expression in an independent external ependymoma cohort GSE27287 (p=0.027) [7] (Figure 5E).
DISCUSSION
In the present study, we have utilized a co-expression based method to analyze messenger RNA expression data set for Snail and Slug genes, with an aim to identify genes correlating with clinical variables including patient outcome. To achieve this, we first performed in-silico gene expression analysis across 3 independent cohorts of EPNs [7, 30, 31] and found significant upregulation of Snail and Slug expression in intracranial EPNs. We then validated these findings by performing gene expression analysis on 75 in-house EPNs samples subdivided into five distinct clinico-pathologic-molecular subgroups and demonstrated maximal upregulation of Snail and Slug in pediatric PF-EPNs followed by RELA fusion-positive ST EPNs. Gene co-expression analysis for Snail and Slug performed on microarray dataset of Witt H et al [7] identified IL1R1, a cytokine receptor belonging to the interleukin-1 receptor family, to positively correlate with Snail andSlug expression, with highest enrichment in ST-EPN-RELA and PF-EPN-A molecular subgroups of Pajtler et al dataset [6]. Supportive of these findings, gene expression analysis of our in-house EPN cohort showed upregulated IL1R1 expression levels in corresponding clinico-pathologic-molecular subgroups (ST-RELA+ and pediatric PF) with significant correlation with higher Snail/Slug expression levels, higher proliferative indices and poorer progression free survival. Further analysis into the functional significance of IL1R1 in EPNs revealed selective upregulation in EPNs as compared to other common brain tumors, strong expression in subventricular zones of juvenile but not adult mice brain, and association with expression of neural stem cell markers. Significant interactions with inflammatory, angiogenic, glycolytic and EMT related pathways were noted within the ST-EPN-RELA and PF-A molecular subsets. In particular, we demonstrated higher numbers of MDSCs, a known target of IL1R1-IL1β signaling, in RELA fusion positive ST EPNs and pediatric PF EPNs of our cohort by FACS. Our study for the first time reports a role for the inflammatory marker, IL1R1 of the interleukin-1 family, in ST-EPN-RELA and PF-EPN-A molecular subsets of EPNs, with possible roles in regulation of EMT, stemness, angiogenesis, metabolism and tumor inflammatory responses.
IL1R1/CD121a is an interleukin receptor which belongs to interleukin-1 cytokine receptor family. Physiologically, IL1R1 acts as a receptor for interleukin 1 alpha (IL1A), interleukin 1 beta (IL1B), and interleukin 1 receptor antagonist (IL1RA). Our PPI based analysis further identified its involvement in various oncogenic pathways including NF-kB, MAPK, PI3K which are known to be highly expressed in intracranial EPNs [6, 8, 42]. Notably, increased expression of IL1R1 regulates expression of several chemo- and radio resistant genes such as COX2, ABCG2, PTGES and RAGE [43]. Increased expression of COX2, leading to tumor growth and acquisition of multi-drug resistance has been previously reported in childhood EPNs [44, 45]. Overexpression of ABCG2 gene has also been reported in ependymomas [46, 47]. GSEA for IL1R1 identified pathways related to inflammation and angiogenesis to be further enriched in ST-EPN-RELA and PF-EPN-A molecular subgroups. Supportive of our findings, previous studies have already implicated these pathways in the pathogenesis of EPNs [48–50]. Of note, DNA repair pathway was found to be negatively correlated with IL1R1 expression, indicating impairment of DNA repair in IL1R1 expressing EPNs. Considering that chromothripsis and epigenetic alterations are the hallmarks of ST-EPN-RELA [6] and PF-EPN-A [7] molecular subgroups respectively, the loss in the DNA repair mechanisms may be a contributing factor.
Ependymomas are postulated to originate from radial glia-like cancer stem cells [5]. Previous studies have demonstrated increased expression of stem cell marker nestin to be associated with poor prognosis in intracranial ependymomas [51], with high expression levels in RELA fusion positive ST EPNs [8]. Similarly, stem cell pathways such as NOTCH and high expression levels of the developmental extracellular matrix glycoprotein, Tenascin C, are implicated in the pathogenesis of pediatric posterior fossa EPNs and PF-EPN-A molecular subgroup [52]. In-situ hybridization for IL1R1 performed in our study localized its physiological expression in the subventricular zone of neonatal but not adult mice. Subventricular zone is known to harbor neural stem cells involved in active neurogenesis [32], strengthening our hypothesis that IL1R1 may be involved in stemness traits. In support of our finding, previous studies have found IL1R1 expression on Nestin/SOX2 positive neural progenitor cells [53]. Further, it is well known that EMT phenotype also confers stem cell traits [11, 12], and we demonstrated correlation of IL1R1 with upto 72% of EMT genes, suggesting common links among IL1R1, EMT phenotype and stemness.
A gene ontology based analysis of a small cohort of recurrent and non-recurrent pediatric EPNs identified that immune function related genes were enriched in non-recurrent EPNs and correlated with a better outcome [54]. In the same study, they demonstrated by immunohistochemistry that these genes are likely overexpressed by a subset of tumor infiltrating microglia/macrophages, which were significantly more populous in the non-recurrent EPNs as compared to their recurrent counterparts [54]. Although non-specific immunotherapeutic strategies have occasionally been tried in ependymomas [55], the lack of appropriate antigen targets has precluded development of valid immune-based therapies in EPNs [56]. In this context, IL1R1 emerges as a potential target. Tu S et al reported activation of myeloid derived suppressive cells (MDSCs) in tumor via IL1β, both in-vitro and in-vivo, through an IL1R/NF-kB pathway [36]. In the present study, quantification of CD11b+ cells using FACS demonstrated significantly higher levels of MDSCs in RELA fusion positive ST EPN and pediatric PF EPNs, further supported by the positive correlation of gene expression between IL1R1 and ITGAM/ CD11b+ in ST-EPN-RELA and PF-EPN-A molecular subgroups of Pajtler KW et al [6]. This suggests that ILIR1 may play a role in immune escape. Further, MDSCs can also directly incorporate into tumor endothelium and promote tumor angiogenesis by producing high levels of matrix metalloproteinase-9 (MMP9) [36]. We found significant correlation of IL1R1 with MMP11 expression, which in involved in breakdown of extracellular matrix, tissue remodeling and metastasis. High microvascular densities and increased expression of vascular endothelial derived growth factor (VEGF) has been observed in intracranial EPNs [51] and our findings suggest that IL1R1 may play a role in these phenotypic changes as well.
A large number of studies have highlighted site specific variations in the cytogenetic, gene expression, molecular and epigenetic profiles of histologically similar appearing EPNs arising from different anatomical locations [3–7]. More recently, a large scale DNA methylation study identified nine molecular subgroups of EPNs within the three anatomical compartments viz. ST, PF and SP [6]. The two most common molecular subgroups: ST-EPN-RELA and PF-EPN-A comprise of Grade II/III tumors, predominate in children and associate with very poor outcome [6, 8]. While DNA methylation assay is considered gold standard for molecular subgrouping [6], surrogate immunohistochemical markers such as L1CAM and pRelA/p65 for ST-EPN-RELA, and LAMA2 and H3K27me3 for PF-EPN-A subgroup [6–8, 57–58] have been suggested. Limited studies have reported their utility and reproducibility in clinical practice and our co-expression study for Snail and Slug has identified a unique marker, IL1R1, to be highly expressed in these two subgroups and correlated with higher tumor cell proliferation rates. High IL1R1 expression also emerged as a poor prognostic marker for progression free survival in our in-house cohort and in an external independent cohort [7], strengthening the clinical importance and translational potential of our findings. Thus, IL1R1 presents with a potential to serve as a diagnostic marker and therapeutic target in these aggressive subgroups. Given the availability of selective inhibitors of IL1R1 [59], further investigations into the pharmacological inhibition of IL1R1 in ST-EPN-RELA and PF-EPN-A molecular subgroups are warranted.
To conclude, the present study identified IL1R1, an inflammatory cytokine, as a co-expressed gene for Snail and Slug in intracranial EPNs. ILIR1 was selectively upregulated in ependymomas, as compared to other common CNS tumors, with highest expression levels in the aggressive ST-EPN-RELA and PF-EPN-A molecular subgroups and showed positive correlation with EMT markers, higher proliferation index, and immunological and angiogenesis related pathways and stemness. IL1R1 expression associated with worse prognosis and further studies are warranted to evaluate and validate IL1R1 as a therapeutic target.
MATERIALS AND METHODS
Gene co-expression analysis for Snail and Slug
Gene co-expression analysis based on the microarray data generated by Witt H, et al (GSE27279) was performed [7]. The source data set was originally generated using Affymetrix Human Exon 1.0 ST Array and comprised of 102 samples of EPNs of all sites (ST-31; PF-54, SP-15; site not available in 2 samples). The data was analyzed using database analysis tool R2: Genomics Analysis and Visualization Platform (http://r2.amc.nl) and normalized using the MAS 5.0 algorithm. To start with, we employed Pearson’s correlation coefficient and computed genes associated with Snail (SNAI1) and Slug (SNAI2) expression in all EPN cases. Next, in order to select significant gene subsets showing strong correlation (positive and negative) with Snail and Slug expressions and to shrink the gene list to a manageable size, we setup a filter to select only for genes showing an absolute correlation cutoff greater than ±0.3 Pearson’s value and p value less than 0.05. Repetitive genes were removed while retaining only one representative gene with most significant p-value among replicates. We next assessed Gene Ontology (GO) terms and KEGG pathways using hypergeometric tests for these transcripts. P-values were adjusted for multiple testing using Benjamini–Hochberg correction. Patient outcome data was also retrieved for this EPN cohort (GSE27279) for survival analysis [7].
In-house ependymoma sample collection
The study was of ambispective design (2003-2016) and ethically approved by the Institute Ethics Committee (Ref No: IESC/T-211/05/05/2015). Tumor samples with a diagnosis of ependymoma, as reconfirmed independently by two neuropathologists (MCS & AN) and classified according to the 2016 World Health Organisation (WHO) classification of CNS tumors [1], with available tumor tissue, including snap-frozen tissue and clinical follow-up, were included for analysis. WHO Grade I EPNs (subependymomas and myxopapillary ependymomas) were excluded. Clinical follow-up data was obtained from the records of the department of Neurosurgery.
Clinico-pathologic-molecular subgrouping of cases
Quantitative real time polymerase chain reaction (qRT-PCR) was performed for the detection of Type 1 and 2 C11orf95-RELA, YAP1-MAMLD1 and YAP1-FAM118B fusion transcripts in ST EPNs using cDNA as described previously [8]. ST EPNs with RELA fusions were grouped as ST-RELA+ while those with YAP1 fusions were grouped as ST-YAP1+ and the remaining grouped as ST-RELA-. Among PF EPNs, those occurring in children ≤18 years of age were grouped as PF-A, while those in adults >18 years were grouped as PF-B. Spinal Grade II/III ependymomas were grouped as SP group.
Gene expression analysis for Snail, Slug and IL1R1 on in-house ependymoma tumor samples
Total RNA was isolated using mirVana™ miRNA Isolation Kit (M/S Ambion, Life Technologies, USA) as per manufacturer’s protocol. One μg of total RNA was reverse transcribed using Superscript VILO cDNA Synthesis Kit (M/S Invitrogen, Life Technologies, USA). Quantitative Real time PCR (qPCR) was performed using Syber-green with Agilent Mx3005P system (Agilent Technologies, USA). The differences in expression were calculated using the comparative method and the level of Snail, Slug and IL1R1 fold change was calculated using 2−ΔΔCt method using ACTB and GAPDH as housekeeping genes. The primer sequences for the transcripts analyzed are provided in Supplementary Table 3.
Microarray datasets of independent published ependymoma cohorts for in-silico data analysis
Gene expression microarray dataset of three independent cohorts of EPNs: GSE21687 (n=83) [30], GSE27279 (n=102) [7] and GSE50385 (n=65) [31] were analyzed for the expression levels of Snail and Slug using R2 software. For comparison of IL1R1 expression between various CNS tumors, 2 gene expression microarray datasets for medulloblastoma: GSE37418 (n=76) [37] and GSE NA, 1 dataset for CNS-PNETs: GSE19404 (n=23) [38], 3 dataset for gliomas: GSE43378 (n=50) [39], GSE19578 (n=53) [40] and GSE4290 (n=157) [41], and 3 normal brains: GSE7307 (n=1), GSE13564 (n=1) [60] and GSE11882 (n=1) [61], were analyzed using R2 software.
Detailed methodology for FACS for CD11b quantification, GSEA analysis, immunohistochemistry for MIB1 and ISH data can be found in Supplementary materials and methods.
Statistical analysis
Kaplan–Meier survival analysis was used to obtain survival estimates. GraphPad Prism version 5.0 for Windows was used for constructing scatter, correlation and box plots. Pearson correlation, ANOVA and T-test were performed using SPSS version 11.5 for Windows. In all statistical analyses, 2-sided test with P value less than 0.05 was considered as significant.
Author contributions
Conception and design: Prit Benny Malgulwar, Mehar Chand Sharma. Performed the gene expression experiments and data analysis: Prit Benny Malgulwar, Vikas Sharma, Ashutosh Singh Tomar. FACS analysis: Prit Benny Malgulwar, Chaitenya Verma. Contributed reagents/ materials/analysis tools: Mehar Chand Sharma, Aruna Nambirajan, Chitra Sarkar, Vaishali Suri, Manmohan Singh. Wrote the paper: Prit Benny Malgulwar, Mehar Chand Sharma.
ACKNOWLEDGMENTS AND FUNDING
The authors are thankful to Neuro Sciences Centre, AIIMS and Science and Engineering Research Board (SERB) (EMR/2016/003365) for financial support of the work; all consultants from the Departments of Pathology and Neurosurgery, AIIMS; all technical staff from the Neuropathology laboratory, AIIMS, Department of Biostatistics, AIIMS and Indian Council of Medical Research (ICMR) for Senior Research Fellowship award to Prit Benny Malgulwar (No.3/2/3/284/2014/NCD-III).
CONFLICTS OF INTEREST
None.
REFERENCES
1. Ellison DW, McLendon R, Wiestler OD, Kros JM, Korshunov A, Ng HK, Witt H, Hirose T. Ependymoma. In: Louis DN, Ohgaki H, Wiestler OD, Cavenee WK, editors. WHO classification of tumors of the central nervous system. Revised 4th edition. Lyon: IARC; 2016. pp. 106–12.
2. Merchant TE. Current clinical challenges in childhood ependymoma: a focused review. J Clin Oncol. 2017; 35:2364–69.
3. Korshunov A, Witt H, Hielscher T, Benner A, Remke M, Ryzhova M, Milde T, Bender S, Wittmann A, Schöttler A, Kulozik AE, Witt O, von Deimling A, et al. Molecular staging of intracranial ependymoma in children and adults. J Clin Oncol. 2010; 28:3182–90.
4. Kilday JP, Rahman R, Dyer S, Ridley L, Lowe J, Coyle B, Grundy R. Pediatric ependymoma: biological perspectives. Mol Cancer Res. 2009; 7:765–86.
5. Taylor MD, Poppleton H, Fuller C, Su X, Liu Y, Jensen P, Magdaleno S, Dalton J, Calabrese C, Board J, Macdonald T, Rutka J, Guha A, et al. Radial glia cells are candidate stem cells of ependymoma. Cancer Cell. 2005; 8:323–35.
6. Pajtler KW, Witt H, Sill M, Jones DT, Hovestadt V, Kratochwil F, Wani K, Tatevossian R, Punchihewa C, Johann P, Reimand J, Warnatz HJ, Ryzhova M, et al. Molecular classification of ependymal tumors across all CNS compartments, histopathological grades, and age groups. Cancer Cell. 2015; 27:728–43.
7. Witt H, Mack SC, Ryzhova M, Bender S, Sill M, Isserlin R, Benner A, Hielscher T, Milde T, Remke M, Jones DT, Northcott PA, Garzia L, et al. Delineation of two clinically and molecularly distinct subgroups of posterior fossa ependymoma. Cancer Cell. 2011; 20:143–57.
8. Malgulwar PB, Nambirajan A, Pathak P, Faruq M, Rajeshwari M, Singh M, Suri V, Sarkar C, Sharma MC. C11orf95-RELA fusions and upregulated NF-KB signalling characterise a subset of aggressive supratentorial ependymomas that express L1CAM and nestin. J Neurooncol. 2018; 138:29–39.
9. Lim J, Thiery JP. Epithelial-mesenchymal transitions: insights from development. Development. 2012; 139:3471–86.
10. Kalluri R, Weinberg RA. The basics of epithelial-mesenchymal transition. J Clin Invest. 2009; 119:1420–28.
11. Mani SA, Guo W, Liao MJ, Eaton EN, Ayyanan A, Zhou AY, Brooks M, Reinhard F, Zhang CC, Shipitsin M, Campbell LL, Polyak K, Brisken C, et al. The epithelial-mesenchymal transition generates cells with properties of stem cells. Cell. 2008; 133:704–15.
12. Scheel C, Weinberg RA. Cancer stem cells and epithelial-mesenchymal transition: concepts and molecular links. Semin Cancer Biol. 2012; 22:396–403.
13. Nieto MA, Cano A. The epithelial-mesenchymal transition under control: global programs to regulate epithelial plasticity. Semin Cancer Biol. 2012; 22:361–68.
14. Kahlert UD, Nikkhah G, Maciaczyk J. Epithelial-to-mesenchymal(-like) transition as a relevant molecular event in malignant gliomas. Cancer Lett. 2013; 331:131–38.
15. Zarkoob H, Taube JH, Singh SK, Mani SA, Kohandel M. Investigating the link between molecular subtypes of glioblastoma, epithelial-mesenchymal transition, and CD133 cell surface protein. PLoS One. 2013; 8:e64169.
16. Myung JK, Choi SA, Kim SK, Wang KC, Park SH. Snail plays an oncogenic role in glioblastoma by promoting epithelial mesenchymal transition. Int J Clin Exp Pathol. 2014; 7:1977–87.
17. Nagaishi M, Paulus W, Brokinkel B, Vital A, Tanaka Y, Nakazato Y, Giangaspero F, Ohgaki H. Transcriptional factors for epithelial-mesenchymal transition are associated with mesenchymal differentiation in gliosarcoma. Brain Pathol. 2012; 22:670–76.
18. Pecina-Slaus N, Cicvara-Pecina T, Kafka A. Epithelial-to-mesenchymal transition: possible role in meningiomas. Front Biosci (Elite Ed). 2012; 4:889–96.
19. Qi ST, Zhou J, Pan J, Zhang C, Silky C, Yan XR. Epithelial-mesenchymal transition and clinicopathological correlation in craniopharyngioma. Histopathology. 2012; 61:711–25.
20. Bill R, Christofori G. The relevance of EMT in breast cancer metastasis: correlation or causality? FEBS Lett. 2015; 589:1577–87.
21. Davidson B, Tropé CG, Reich R. Epithelial-mesenchymal transition in ovarian carcinoma. Front Oncol. 2012; 2:33.
22. Fang D, Chen H, Zhu JY, Wang W, Teng Y, Ding HF, Jing Q, Su SB, Huang S. Epithelial-mesenchymal transition of ovarian cancer cells is sustained by Rac1 through simultaneous activation of MEK1/2 and Src signaling pathways. Oncogene. 2017; 36:1546–58.
23. Malgulwar PB, Nambirajan A, Pathak P, Rajeshwari M, Suri V, Sarkar C, Singh M, Sharma MC. Epithelial-to-mesenchymal transition related transcription factors are upregulated in ependymomas and correlate with a poor prognosis. Hum Pathol. 2018 Jul 29. [Epub ahead of print].
24. van Dam S, Võsa U, van der Graaf A, Franke L, de Magalhães JP. Gene co-expression analysis for functional classification and gene-disease predictions. Brief Bioinform. 2018; 19:575-592
25. Clarke C, Madden SF, Doolan P, Aherne ST, Joyce H, O’Driscoll L, Gallagher WM, Hennessy BT, Moriarty M, Crown J, Kennedy S, Clynes M. Correlating transcriptional networks to breast cancer survival: a large-scale coexpression analysis. Carcinogenesis. 2013; 34:2300–08.
26. Oldham MC, Horvath S, Geschwind DH. Conservation and evolution of gene coexpression networks in human and chimpanzee brains. Proc Natl Acad Sci U S A. 2006; 103:17973–78.
27. Sun Y, Zhang W, Chen D, Lv Y, Zheng J, Lilljebjörn H, Ran L, Bao Z, Soneson C, Sjögren HO, Salford LG, Ji J, French PJ, et al. A glioma classification scheme based on coexpression modules of EGFR and PDGFRA. Proc Natl Acad Sci U S A. 2014; 111:3538–43.
28. Brown DV, Daniel PM, D’Abaco GM, Gogos A, Ng W, Morokoff AP, Mantamadiotis T. Coexpression analysis of CD133 and CD44 identifies proneural and mesenchymal subtypes of glioblastoma multiforme. Oncotarget. 2015; 6:6267–80. https://doi.org/10.18632/oncotarget.3365.
29. Liu Y, Hu H, Zhang C, Wang H, Zhang W, Wang Z, Li M, Zhang W, Zhou D, Jiang T. Co-expression of mitosis-regulating genes contributes to malignant progression and prognosis in oligodendrogliomas. Oncotarget. 2015; 6:38257–69. https://doi.org/10.18632/oncotarget.5499.
30. Johnson RA, Wright KD, Poppleton H, Mohankumar KM, Finkelstein D, Pounds SB, Rand V, Leary SE, White E, Eden C, Hogg T, Northcott P, Mack S, et al. Cross-species genomics matches driver mutations and cell compartments to model ependymoma. Nature. 2010; 466:632–36.
31. Hoffman LM, Donson AM, Nakachi I, Griesinger AM, Birks DK, Amani V, Hemenway MS, Liu AK, Wang M, Hankinson TC, Handler MH, Foreman NK. Molecular sub-group-specific immunophenotypic changes are associated with outcome in recurrent posterior fossa ependymoma. Acta Neuropathol. 2014; 127:731–45.
32. Sanai N, Alvarez-Buylla A, Berger MS. Neural stem cells and the origin of gliomas. N Engl J Med. 2005; 353:811–22.
33. Faissner A, Roll L, Theocharidis U. Tenascin-C in the matrisome of neural stem and progenitor cells. Mol Cell Neurosci. 2017; 81:22–31.
34. Havrda MC, Paolella BR, Ran C, Jering KS, Wray CM, Sullivan JM, Nailor A, Hitoshi Y, Israel MA. Id2 mediates oligodendrocyte precursor cell maturation arrest and is tumorigenic in a PDGF-rich microenvironment. Cancer Res. 2014; 74:1822–32.
35. Fukui H, Rünker A, Fabel K, Buchholz F, Kempermann G. Transcription factor Runx1 is pro-neurogenic in adult hippocampal precursor cells. PLoS One. 2018; 13:e0190789.
36. Tu S, Bhagat G, Cui G, Takaishi S, Kurt-Jones EA, Rickman B, Betz KS, Penz-Oesterreicher M, Bjorkdahl O, Fox JG, Wang TC. Overexpression of interleukin-1beta induces gastric inflammation and cancer and mobilizes myeloid-derived suppressor cells in mice. Cancer Cell. 2008; 14:408–19.
37. Robinson G, Parker M, Kranenburg TA, Lu C, Chen X, Ding L, Phoenix TN, Hedlund E, Wei L, Zhu X, Chalhoub N, Baker SJ, Huether R, et al. Novel mutations target distinct subgroups of medulloblastoma. Nature. 2012; 488:43–48.
38. Rogers HA, Ward JH, Miller S, Lowe J, Coyle B, Grundy RG. The role of the WNT/β-catenin pathway in central nervous system primitive neuroectodermal tumours (CNS PNETs). Br J Cancer. 2013; 108:2130–41.
39. Kawaguchi A, Yajima N, Tsuchiya N, Homma J, Sano M, Natsumeda M, Takahashi H, Fujii Y, Kakuma T, Yamanaka R. Gene expression signature-based prognostic risk score in patients with glioblastoma. Cancer Sci. 2013; 104:1205–10.
40. Paugh BS, Qu C, Jones C, Liu Z, Adamowicz-Brice M, Zhang J, Bax DA, Coyle B, Barrow J, Hargrave D, Lowe J, Gajjar A, Zhao W, et al. Integrated molecular genetic profiling of pediatric high-grade gliomas reveals key differences with the adult disease. J Clin Oncol. 2010; 28:3061–68.
41. Sun L, Hui AM, Su Q, Vortmeyer A, Kotliarov Y, Pastorino S, Passaniti A, Menon J, Walling J, Bailey R, Rosenblum M, Mikkelsen T, Fine HA. Neuronal and glioma-derived stem cell factor induces angiogenesis within the brain. Cancer Cell. 2006; 9:287–300.
42. Palm T, Figarella-Branger D, Chapon F, Lacroix C, Gray F, Scaravilli F, Ellison DW, Salmon I, Vikkula M, Godfraind C. Expression profiling of ependymomas unravels localization and tumor grade-specific tumorigenesis. Cancer. 2009; 115:3955–68.
43. De Marco P, Lappano R, De Francesco EM, Cirillo F, Pupo M, Avino S, Vivacqua A, Abonante S, Picard D, Maggiolini M. GPER signalling in both cancer-associated fibroblasts and breast cancer cells mediates a feedforward IL1β/IL1R1 response. Sci Rep. 2016; 6:24354.
44. Kim SK, Lim SY, Wang KC, Kim YY, Chi JG, Choi YL, Shin HJ, Cho BK. Overexpression of cyclooxygenase-2 in childhood ependymomas: role of COX-2 inhibitor in growth and multi-drug resistance in vitro. Oncol Rep. 2004; 12:403–09.
45. Roma AA, Prayson RA. Expression of cyclo-oxygenase-2 in ependymal tumors. Neuropathology. 2006; 26:422–28.
46. Ginguené C, Champier J, Maallem S, Strazielle N, Jouvet A, Fèvre-Montange M, Ghersi-Egea JF. P-glycoprotein (ABCB1) and breast cancer resistance protein (ABCG2) localize in the microvessels forming the blood-tumor barrier in ependymomas. Brain Pathol. 2010; 20:926–35.
47. Gojo J, Lötsch D, Spiegl-Kreinecker S, Pajtler KW, Neumayer K, Korbel P, Araki A, Brandstetter A, Mohr T, Hovestadt V, Chavez L, Kirchhofer D, Ricken G, et al. Telomerase activation in posterior fossa group A ependymomas is associated with dismal prognosis and chromosome 1q gain. Neuro Oncol. 2017; 19:1183–94.
48. Griesinger AM, Birks DK, Donson AM, Amani V, Hoffman LM, Waziri A, Wang M, Handler MH, Foreman NK. Characterization of distinct immunophenotypes across pediatric brain tumor types. J Immunol. 2013; 191:4880–88.
49. Griesinger AM, Josephson RJ, Donson AM, Mulcahy Levy JM, Amani V, Birks DK, Hoffman LM, Furtek SL, Reigan P, Handler MH, Vibhakar R, Foreman NK. Interleukin-6/STAT3 pathway signaling drives an inflammatory phenotype in group A ependymoma. Cancer Immunol Res. 2015; 3:1165–74.
50. Sandén E, Enríquez Pérez J, Visse E, Kool M, Carén H, Siesjö P, Darabi A. Preoperative systemic levels of VEGFA, IL-7, IL-17A, and TNF-β delineate two distinct groups of children with brain tumors. Pediatr Blood Cancer. 2016; 63:2112–22.
51. Nambirajan A, Sharma MC, Gupta RK, Suri V, Singh M, Sarkar C. Study of stem cell marker nestin and its correlation with vascular endothelial growth factor and microvascular density in ependymomas. Neuropathol Appl Neurobiol. 2014; 40:714–25.
52. Andreiuolo F, Puget S, Peyre M, Dantas-Barbosa C, Boddaert N, Philippe C, Mauguen A, Grill J, Varlet P. Neuronal differentiation distinguishes supratentorial and infratentorial childhood ependymomas. Neuro Oncol. 2010; 12:1126–34.
53. Crampton SJ, Collins LM, Toulouse A, Nolan YM, O’Keeffe GW. Exposure of foetal neural progenitor cells to IL-1β impairs their proliferation and alters their differentiation - a role for maternal inflammation? J Neurochem. 2012; 120:964–73.
54. Donson AM, Birks DK, Barton VN, Wei Q, Kleinschmidt-Demasters BK, Handler MH, Waziri AE, Wang M, Foreman NK. Immune gene and cell enrichment is associated with a good prognosis in ependymoma. J Immunol. 2009; 183:7428–40.
55. Ardon H, De Vleeschouwer S, Van Calenbergh F, Claes L, Kramm CM, Rutkowski S, Wolff JE, Van Gool SW. Adjuvant dendritic cell-based tumour vaccination for children with malignant brain tumours. Pediatr Blood Cancer. 2010; 54:519–25.
56. Pollack IF, Jakacki RI, Butterfield LH, Hamilton RL, Panigrahy A, Potter DM, Connelly AK, Dibridge SA, Whiteside TL, Okada H. Antigen-specific immune responses and clinical outcome after vaccination with glioma-associated antigen peptides and polyinosinic-polycytidylic acid stabilized by lysine and carboxymethylcellulose in children with newly diagnosed malignant brainstem and nonbrainstem gliomas. J Clin Oncol. 2014; 32:2050–58.
57. Gessi M, Giagnacovo M, Modena P, Elefante G, Gianno F, Buttarelli FR, Arcella A, Donofrio V, Diomedi Camassei F, Nozza P, Morra I, Massimino M, Pollo B, et al. Role of immunohistochemistry in the identification of supratentorial C11ORF95-RELA fused ependymoma in routine neuropathology. Am J Surg Pathol. 2017 Dec 20. [Epub ahead of print].
58. Panwalkar P, Clark J, Ramaswamy V, Hawes D, Yang F, Dunham C, Yip S, Hukin J, Sun Y, Schipper MJ, Chavez L, Margol A, Pekmezci M, et al. Immunohistochemical analysis of H3K27me3 demonstrates global reduction in group-A childhood posterior fossa ependymoma and is a powerful predictor of outcome. Acta Neuropathol. 2017; 134:705–14.
59. Akeson AL, Woods CW, Hsieh LC, Bohnke RA, Ackermann BL, Chan KY, Robinson JL, Yanofsky SD, Jacobs JW, Barrett RW, Bowlin TL. AF12198, a novel low molecular weight antagonist, selectively binds the human type I interleukin (IL)-1 receptor and blocks in vivo responses to IL-1. J Biol Chem. 1996; 271:30517–23.
60. Harris LW, Lockstone HE, Khaitovich P, Weickert CS, Webster MJ, Bahn S. Gene expression in the prefrontal cortex during adolescence: implications for the onset of schizophrenia. BMC Med Genomics. 2009; 2:28.
61. Berchtold NC, Cribbs DH, Coleman PD, Rogers J, Head E, Kim R, Beach T, Miller C, Troncoso J, Trojanowski JQ, Zielke HR, Cotman CW. Gene expression changes in the course of normal brain aging are sexually dimorphic. Proc Natl Acad Sci U S A. 2008; 105:15605–10.