
INTRODUCTION
Alzheimer’s disease (AD) is a progressive neurodegenerative disease and a major cause of dementia in adults over 60 years of age, affecting cognitive functions of nearly 24 million patients worldwide [1].
The AD occurs in two forms: familial and sporadic AD [2]. The latter is typical for aging population, and is caused by both, genetic (70%) [3] and environmental (30%) [4] factors. Currently, the pathomechanism of AD is explained in multiple pathways, including dysregulation of the interaction network between the production, clearance, and aggregation of amyloid β (Aβ), a central player in an Aβ cascade hypothesis. This phenomenon may occur more often in individuals with rare variants in genes associated with metabolism of Aβ and cholesterol turnover, located on chromosome 19, in APOE gene cluster. The APOE gene polymorphisms have been extensively studied, and the emerging research focuses on other genes in the immediate vicinity of the APOE gene, i.e., TOMM40 and APOC1, APOC2, APOC4 [5–7].
The APOC2 and APOC4 are understudied with the last publication for APOC2 from 2011 and with only a single work for APOC4 by Cervantes et al. [7], who have obtained insignificant results after statistics adjustment. Above genes represent rather modest odds ratios (OR) values for AD [0.82-1.20]. In turn, the APOC1 gene locus has been reported to house multiple changes deciphered using the long-range sequencing in Caucasians: rs445925, rs59325138, rs390082, rs4420638, rs4803770. These variants exhibit moderate OR values, except rs4420638 (OR=3.46; hereafter APOC1’638), which is located 14 kb adjacent to APOC1 gene [7–9]. The APOC1 gene encodes apolipoprotein C1, a key regulator of the metabolism of high-density and very-low density lipoproteins [10], and may be associated with cognitive impairment in Chinese [11]. The frequency of ‘638 single nucleotide polymorphism (SNP) in Polish AD patients has not been studied yet.
From the 5’end, the APOE gene neighbors with TOMM40 gene, containing multiple genetic variants described by using the long-range sequencing: N1, rs11556510, rs184017, rs157580, rs2075650, rs157581, rs34095326, rs11556505, rs157582, rs59007384, rs77301115, rs8106922, N5, rs73052321, rs741780, rs405697, rs10119 [7]. Most of these variants are located deep in intronic sequences and should have little effect on splicing machinery, except rs2075650 (hereafter TOMM40’650), which sits just 31bp from exon junction [12]. The reported OR for this SNP is 2.94 [CI 2.31-3.74], and minor allele frequency is 0.214 [7]. The association of TOMM40‘650 with AD has been confirmed by two independent mataanalyses [13, 14]. Moreover, aside AD, the ‘650 SNP was shown to be associated with a decreased delayed recall score in persons above 60 years of age [15]. For Polish population, no data has been reported to date.
Another frequently studied variant in TOMM40 is a highly polymorphic poly-T fragment in the intron 6, rs10524523 (hereafter ‘523), with differing number of deoxythymidine repeats. Three “alleles” of ‘523 polymorphism have been described: Short (S, ≤19 T), Long (L, 20-29 T) and Very Long (VL, ≥30 T) with ability to impact the age of onset (AOO) of AD, as well as the brain structure and cognitive functions [16–26]. The effect of ‘523 polymorphism on AOO of Polish AD patients has been analyzed only in one study [24], which did not correlate this SNP with other variants in APOE cluster beside E2/E3/E4. The TOMM40 gene encodes translocase of the outer mitochondrial membrane homolog 40 (TOM40). In AD, TOM40 channels may be blocked by Aβ, and this enables Aβ to enter the mitochondria, and the accumulation of Aβ in mitochondria leads to the overproduction of reactive oxygen species (ROS) [27, 28]. The accumulation of ROS might be regulated by natural antioxidants, including glutathione (GSH).
The GSH in mitochondria (mtGSH) inhibits intramitochondrial proteins form entering the cytoplasm and inducing the cell death machinery. The mtGSH forms an alternative pool to cytoplasmic GSH and requires specific carriers to enter the mitochondria, such as TOM40 [29]. The blockade and underexpression of TOM40 lead to an impaired penetration of GSH into the mitochondria, which in turn causes the excessive ROS production, mitochondrial failure and releasing of caspases – the apoptosis inducers, contributing to progressive neuronal loss and the onset of dementia [30]. Moreover, in the course of the several neurodegenerative diseases, including AD, the GSH concentration may be decreased. Hence the GSH has been proposed as a biomarker for diagnosis of neurodegenerative diseases, and promising target of future therapies [31]. Especially helpful would seem the increasing of the mtGSH pool, due to its protective role to the mitochondria [32].
The regulation of mtGSH may also be misbalanced by the accumulation of homocysteine (Hcy), a metabolite of methionine (Met) [33]. Furthermore, the high concentration of Hcy would impede production of GSH, since 50% is metabolized back to Met, and the rest to cysteine (Cys), subsequently used for GSH synthesis [34]. Hcy may directly inhibit the mtGSH pool renewal, exhibiting pronounced toxicity to isolated rodent hippocampal mitochondria. Moreover, numerous studies have confirmed the increased plasma concentration of Hcy as a risk factor of developing dementia and vascular diseases [35].
The high levels of Hcy (hyperhomocysteinemia, HHcy) may result in increased production of ROS in mitochondria, followed by formation of 8-oxo-2’-deoxyguanosine (8-oxo2dG). The accumulation of 8-oxo2dG in the DNA arises early the course of AD, and may advance with disease progression [36]. The concentration of 8-oxo2dG is elevated in the brain cells as well as in the DNA of peripheral lymphocytes or serum of AD patients [37]. The presence of 8-oxo2dG in DNA during replication may lead to inordinate base pairing, causing somatic mutations and loose of genes functions in up to 14% of events [38]. In order to prevent mispairing, the 8-oxo2dG is removed from DNA by a repair enzyme: 8-oxoguanine DNA glycosylase (OGG1), a protein associated with base excision repair (BER) system, depending on removal of modified nucleotides from DNA before replication and fixation of the mutation [39]. The concentration of OGG1 in serum and lymphocytes isolated from AD patients may be decreased in the course of the disease [37, 40], and the mRNA expression of certain isoforms of OGG1 are significantly dysregulated in AD, and therefore may impede the OGG1 function and serve as AD biomarker [41].
Importantly, the OGG1 enzyme similarly to GSH requires TOM40 machinery to enter the mitochondria. According to the literature, the TOMM40’523 poly-T variants may influence the amount of TOM40 and hence affect the regulation of oxidative damage scavengers and repair mechanisms [42–45]. The physiological level of OGG1 and GSH may protect the cell against oxidative damage, and affect the onset and progression of AD. It seems that the oxidative stress in AD may be associated with genes in APOE cluster, which may undergo expression regulation by PPARγ [46], a transcription factor associated with a reduction of oxidative stress in mitochondria [47].
In turn, the involvement of APOC1’638 and TOMM40’650 SNPs in the generation of oxidative stress in AD remains unknown. There is also no information on how each of these variants influences the level of biochemical factors associated with oxidative stress in AD.
The aim of the study was to analyze the plasma concentration of biothiols: Hcy, GSH as well as the concentration of a product of oxidative DNA damage: 8-oxo2dG, and the concentration of the OGG1, a repair enzyme that is able to remove oxidized guanosine from the DNA. Furthermore, we analyzed the correlation between polymorphisms of three loci within APOE gene cluster, i.e. two located in proximity of TOMM40: a polyT length polymorphism in intron 6 (‘523) and SNP in intron 2 (‘650), as well as SNP adjacent to APOC1 gene: rs4420638 (‘638), and concentration of measured biochemical parameters in AD patients, related and unrelated controls in Polish population.
RESULTS
Biochemical parameters
Our study has shown a significant increase in Hcy concentration in AD patients as compared to both, UC and RC (p<0.01 and p<0.001, respectively), as shown in Table 1. The elevated plasma Hcy (hyperhomocysteinemia, Hcy level above 15 μmol/L) we observed in 60.9% AD patients as compared to 34.2% of UC and 32.3% of RC (OR=3.00, 95% CI: 1.53-5.86, p<0.01 and OR=3.27, 95% CI: 1.59-6.71, p<0.01, Fisher exact test, respectively). The highest median Hcy concentration was observed in persons with possible preclinical AD (mild cognitive impairment, MCI; 24-27 points in MMSE scale; Hcy 20.3 μmol/L) and in AD patients before the pharmacotherapy with common AD drugs (Hcy 22.9 μmol/L, p<0.01 vs. UC and p<0.001 vs. RC). Subsequently, the lowest median concentration of Hcy was found in AD patients with moderate dementia (11-18 MMSE; Hcy 16.0 μmol/L) or treated with AchEI (donepezil, rivastigmine; Hcy 14.9 μmol/L), the detailed data is shown in Supplementary Tables 1 and 2.
Table 1: The concentration of homocysteine (Hcy), glutathione (GSH), 8-oxo-2’-deoxyguanosine (8-oxo2dG) and 8-oxoguanine DNA glycosylase (OGG1) in plasma of Alzheimer’s disease (AD) patients and related controls (RC) and unrelated controls (UC)
Parameters |
Unrelated controls (UC) |
Related controls (RC) |
Alzheimer’s disease (AD) |
p |
|||
|---|---|---|---|---|---|---|---|
AD vs. UC vs. RC |
AD vs. UC |
AD vs. RC |
UC vs. RC |
||||
Hcy [μmol/L] |
13.1 |
13.2 |
18.1**(***) |
p=0.0007# |
p<0.01$ |
p<0.001$ |
p>0.05$ |
GSH [μmol/L] |
910.0 |
887.1 |
790.0** |
p=0.0459# |
p<0.01$ |
p>0.05$ |
p>0.05$ |
GSH/Hcy |
73.0 |
68.5 |
49.0***(***) |
p<0.0001# |
p<0.001$ |
p<0.001$ |
p>0.05$ |
8-oxo2dG [ng/mL] |
5.016 |
6.284*** |
1.919**(***) |
p<0.0001# |
p<0.01$ |
p<0.001$ |
p<0.01$ |
OGG1 [ng/mL] |
1.211 |
1.706** |
1.400 |
p=0.0293# |
p>0.05$ |
p>0.05$ |
p<0.01$ |
8-oxo2dG/OGG1 |
3.257 |
3.298 |
1.586**(***) |
p=0.0006# |
p<0.01$ |
p<0.001$ |
p>0.05$ |
Median [1st - 3rd quartile]; #-Kruskal-Wallis test, $-followed by Dunn’s Multiple Comparisons test @-Mann-Whitney test; **p<0.01, ***p<0.001, as compared to unrelated controls, (***) p<0.001 as compared to related controls.
For the biochemical studies, the minimal number of cases to achieve desired sample power (0.800) was estimated for 42 cases by T test. Therefore, the number of patients included to the present study provided sufficient sample power (0.9560). Due to the significant differences in Hcy levels in studied groups, affecting other parameters, sample power was not calculated for remaining parameters.
Subsequently, we found that in the plasma of AD patients, the concentration of GSH was significantly reduced as compared with the UC (p<0.01) and the decrease was close to significant as compared to RC (p=0.0511), as shown in Table 2. Moreover, the level of GSH changed with the progress of the disease (Supplementary Table 1). We observed the lowest median level of GSH in MCI (GSH 691.0 μmol/L) and in severe AD (0-10 MMSE; GSH 772.0 μmol/L, p<0.05 vs. UC), accompanied by elevated Hcy levels, while the highest GSH was measured in mild and moderate AD (GSH 832.5 μmol/L, p<0.05 vs. UC and GSH 822.5 μmol/L, respectively), where Hcy concentrations were less heightened. The change of GSH concentration was significant in the mild and severe AD (p<0.05 vs. UC). Subsequently, the AD patients treated with AchEI or AchEI and memantine had lowered median GSH (GSH 772.0 μmol/L, p<0.01 vs. UC, p<0.05 vs. RC and 755.5 μmol/L), while treatment with memantine alone elevated plasma GSH (GSH 1091.5 μmol/L, vs. RC p<0.05; Supplementary Table 2). Additionally, we observed that GSH level was decreased with the duration of AD both lower and over five years (GSH 828.5 and 778.0 μmol/L, p<0.05 vs. UC), however with similarly elevated Hcy concentration (p<0.05 vs. UC and RC; Supplementary Table 3).
Table 2: Alzheimer’s disease and control’s APOE, TOMM40 and APOC1 minor allele frequencies (MAF) and genotypes
Minor alleles |
Unrelated controls (UC) |
Related controls (RC) |
Alzheimer’s disease (AD) |
AD vs. UC |
AD vs. RC |
UC vs. RC |
|
|---|---|---|---|---|---|---|---|
APOE E4 [%] |
8.10 |
24.2*** |
31.3*** |
OR |
5.14 |
1.42 |
3.61 |
95% CI |
2.68-9.85 |
0.85-2.40 |
1.79-7.27 |
||||
p |
<0.0001 |
0.1953 |
0.0002 |
||||
TOMM40‘523-L [%] |
7.50 |
26.2*** |
31.3*** |
OR |
5.61 |
1.28 |
4.39 |
95% CI |
2.87-10.9 |
0.765-2.14 |
2.15-8.95 |
||||
p |
<0.0001 |
0.3672 |
<0.0001 |
||||
TOMM40‘650-G [%] |
6.20 |
16.1* |
29.0***(*) |
OR |
6.12 |
2.12 |
2.88 |
95% CI |
2.98-12.6 |
1.19-3.78 |
1.30-6.42 |
||||
p |
<0.0001 |
0.0127 |
0.0105 |
||||
TOMM40‘650-G [%] |
5.20 |
7.40 |
23.8***(**) |
OR |
5.65 |
3.92 |
1.43 |
95% CI |
2.25-14.2 |
1.38-1.42 |
0.4395 |
||||
p |
0.0001 |
0.0074 |
4.7177 |
||||
APOC1‘638-G [%] |
9.40 |
25.0*** |
36.9***(*) |
OR |
5.66 |
1.76 |
3.22 |
95% CI |
3.07-10.5 |
1.06-2.92 |
1.65-6.29 |
||||
p |
<0.0001 |
0.0328 |
0.0006 |
||||
APOC1‘638-G [%] |
3.70 |
2.90 |
13.8*(*) |
OR |
4.11 |
5.26 |
0.782 |
95% CI |
1.37-12.3 |
1.12-24.6 |
0.147-4.14 |
||||
p |
0.0131 |
0.0221 |
1.0000 |
||||
(‘523-L)+(‘650-G)+(‘638-G) [%] |
7.70 |
22.4*** |
33.6***(***) |
OR |
6.07 |
1.75 |
3.46 |
95% CI |
4.15-8.88 |
1.30-2.37 |
2.29-5.24 |
||||
p |
<0.0001 |
0.0003 |
<0.0001 |
GENOTYPES |
|||||
|---|---|---|---|---|---|
Locus |
Variant |
UC |
RC |
AD |
p# |
TOMM40‘523 genotypes [%] |
S/S |
21.3 |
4.9 |
8.0 |
0.0002 |
S/L |
11.3 |
21.3 |
23.8 |
||
S/VL |
38.8 |
29.5 |
25.0 |
||
L/L |
0.0 |
6.6 |
11.4 |
||
L/VL |
3.8 |
18.0 |
15.9 |
||
VL/VL |
25.0 |
19.7 |
15.9 |
||
TOMM40 ‘650 genotypes [%] |
A/A |
87.5 |
74.2 |
55.7 |
0.0001 |
A/G |
12.5 |
19.4 |
30.7 |
||
G/G |
0.0 |
6.4 |
13.6 |
||
APOC1‘638 genotypes [%] |
A/A |
81.3 |
53.2 |
39.8 |
<0.0001 |
A/G |
18.7 |
43.6 |
46.6 |
||
G/G |
0.0 |
3.2 |
13.6 |
||
percent values; Fisher exact test, *p<0.05, **p<0.01, ***p<0.001 as compared to unrelated controls, (*/**/***) p as compared to related controls, p#-Chi squared test.
We also assessed the plasma concentration of oxygenated guanosine excised from DNA (8-oxo2dG), and the excising enzyme (OGG1). Our studies indicated a significant reduction of median 8-oxo2dG concentration in AD patients, as compared to UC and RC (p<0.01 and p<0.001, respectively, see Table 1). The decrease was most visible in mild dementia (1.282 ng/mL; p<0.01 vs. UC and p<0.001 vs. RC; Supplementary Table 1), and was accompanied by the relatively high level of plasma GSH (as described above). A reverse trend was observed in RC whose decreased GSH was accompanied by increased 8-oxo2dG (p<0.01 vs. UC), as well as in MCI, severe dementia and AD lasting over five years.
The concentration of OGG1 was significantly increased in RC (p<0.01) and insignificantly in AD (p=0.2206) as compared with UC. The OGG1 increase in RC was accompanied with respective 8-oxo2dG rise as compared to UC, what explains similar median 8-oxo2dG/OGG1 ratios (3.257 vs. 3.298). Moreover, significantly worse efficiency of OGG1 dependent BER mechanism (lowest ratio of 8-oxo2dG/OGG1) was observed in AD patients before the treatment (0.8072, p<0.05 vs. UC and RC), in the first five years of AD (1.379, p<0.01 vs. UC and p<0.001 vs. RC), in patients with mild and moderate dementia (0.7233, p<0.001 vs. UC and RC, and 1.846, p<0.05 vs. RC; Supplementary Tables 1-3).
Genetic analysis
The frequency of all genotypes is shown in Table 2. The minor alleles: TOMM40’523-L,’650-G and APOC1’638-G were shown to be significantly overrepresented in AD group as compared to controls (‘523 L vs. S+VL: OR=5.61, 95% CI: 2.87-10.9, p<0.0001; ‘650 G vs. A: OR=6.12, 95% CI: 2.98-12.6, p<0.0001; and ‘638 G vs. A: OR=5.66, 95% CI: 3.07-10.4, p<0.0001), and were more specific than APOE E4 (OR=5.14, 95% CI: 2.68-9.85, p<0.0001). The significant differences between AD and RC groups were observed only for TOMM40’650 and APOC1’638 SNPs (‘650 G vs. A: OR=2.12, 95% CI: 1.19-3.78, p<0.05; and ‘638 G vs. A: OR=1.76, 95% CI: 1.06-2.92, p<0.05; Table 2). Subsequently, 78.4% of AD patients were carriers of at least one of studied alleles, as compared to 30.0% of UC and 56.5% of RC (OR=8.47, 95% CI: 4.21-17.0, p<0.0001 and OR=2.80, 95% CI: 1.37-5.72, p<0.01; p values were calculated with Fisher exact test).
Moreover, the rare variants were also more frequent in persons with APOE E4 genotype. However, the observed linkage was not perfect. The highest coinheritance with APOE E4 was shown for the TOMM40’523 L genotype, where 92.3% of UC, 100% of RC and 92.7% of AD patients were heterozygous for both APOE E4 and TOMM40 L alleles. The similar, but the weaker trend was observed for APOC1’638 polymorphism, where 76.9% of UC, 92.4% of RC and 75.6% of AD patients carried one copy of APOE E4 and APOC1’638 G alleles. On the contrary, the linkage between APOE E4 and TOMM40’650 was much less pronounced, since only 23.1% of UC, 23.1% of RC and 26.8% of AD cases have inherited the heterozygous TOMM40’650 G allele together with APOE E4 (as shown in Table 2, 3). We also performed a simple in silico analysis of the effect of TOMM40’650 minor variant on splicing machinery, and we found a new potential donor splice site: GGGgtggag, exciding the threshold consensus value (65) for the Human Splicing Finder algorithm ver. 3.1 [48].
Table 3: The frequency of TOMM40‘523, TOMM40’650 and APOC1’638 polymorphisms in relation to APOE E4 alleles
APOE groups |
Unrelated controls |
Related controls |
Alzheimer’s disease (AD) |
|||||||
|---|---|---|---|---|---|---|---|---|---|---|
Genotypes of TOMM40&APOC1 |
EX/EX |
EX/E4 |
E4/E4 |
EX/EX |
EX/E4 |
E4/E4 |
EX/EX |
EX/E4 |
E4/E4 |
|
TOMM40’523 |
S/S |
23.9 |
7.7 |
- |
9.1 |
- |
- |
17.5 |
- |
- |
S/VL |
46.2 |
- |
- |
54.5 |
- |
- |
47.5 |
7.3 |
- |
|
VL/VL |
29.9 |
- |
- |
36.4 |
- |
- |
35.0 |
- |
- |
|
S/L |
- |
69.2 |
- |
- |
50.0 |
- |
- |
51.2 |
- |
|
L/L |
- |
- |
- |
- |
7.7 |
100 |
- |
9.8 |
85.7 |
|
L/VL |
- |
23.1 |
- |
- |
42.3 |
- |
- |
31.7 |
14.3 |
|
TOMM40’650 |
A/A |
89.6 |
76.9 |
- |
85.3 |
65.4 |
- |
57.5 |
61.0 |
14.3 |
A/G |
10.4 |
23.1 |
- |
14.7 |
23.1 |
50.0 |
37.5 |
26.8 |
14.3 |
|
G/G |
- |
- |
- |
- |
11.5 |
50.0 |
5.0 |
12.2 |
71.4 |
|
APOC1’638 |
A/A |
92.5 |
23.1 |
- |
94.1 |
3.8 |
- |
75.0 |
12.2 |
- |
A/G |
7.5 |
76.9 |
- |
5.9 |
92.4 |
50.0 |
22.5 |
75.6 |
14.3 |
|
G/G |
- |
- |
- |
- |
3.8 |
50.0 |
2.5 |
12.2 |
85.7 |
|
percent values; EX – APOE E2 or E3; E4 – APOE E4.
We observed a significant AOO effect for TOMM40’523 polymorphism. The most visible difference was between S/S and L/L vs. VL/VL genotypes, where S/S carriers developed disease 7.9±7.5 years earlier than patients with VL/VL genotype (p<0.05, unpaired T test), whereas L/L carriers 7.8±5.4 years earlier (p<0.01, unpaired T test). The TOMM40’650 G/G genotype carriers had significantly earlier AOO than A/G carriers (4.6±4.5 years, p<0.05, unpaired T test with Welch correction), while the difference between A/A and G/G was not significant. Similarly, the APOC1’638 caused earlier AOO only in G/G carriers (5.1±4.1 years, p<0.05 vs. A/A and 5.1±3.3 years, p<0.01 vs. A/G, unpaired T test with Welch correction).
In turn, the AD patients with aggregation of minor alleles: TOMM40’523 L/L, ‘650 G/G, and APOC1’638 G/G exhibited 13.7±6.9 years earlier AOO than those with major variants: TOMM40 VL/VL, A/A and APOC1 A/A (p<0.01, unpaired T test). The cumulative effect of three polymorphisms was much stronger than the effect of APOE E4 allele alone since the E4/E4 carriers showed just 7.2±6.9 years earlier onset than E4 non-carriers (p<0.05, unpaired T test), see Supplementary Table 4.
TOMM40 and APOC1 genotypes and biochemical parameters
The analysis also included the assessment of the concentrations of Hcy, GSH, 8-oxo2dG and OGG1 in relation to genetic variants of TOMM40’523, TOMM40‘650, and APOC1’638 SNPs.
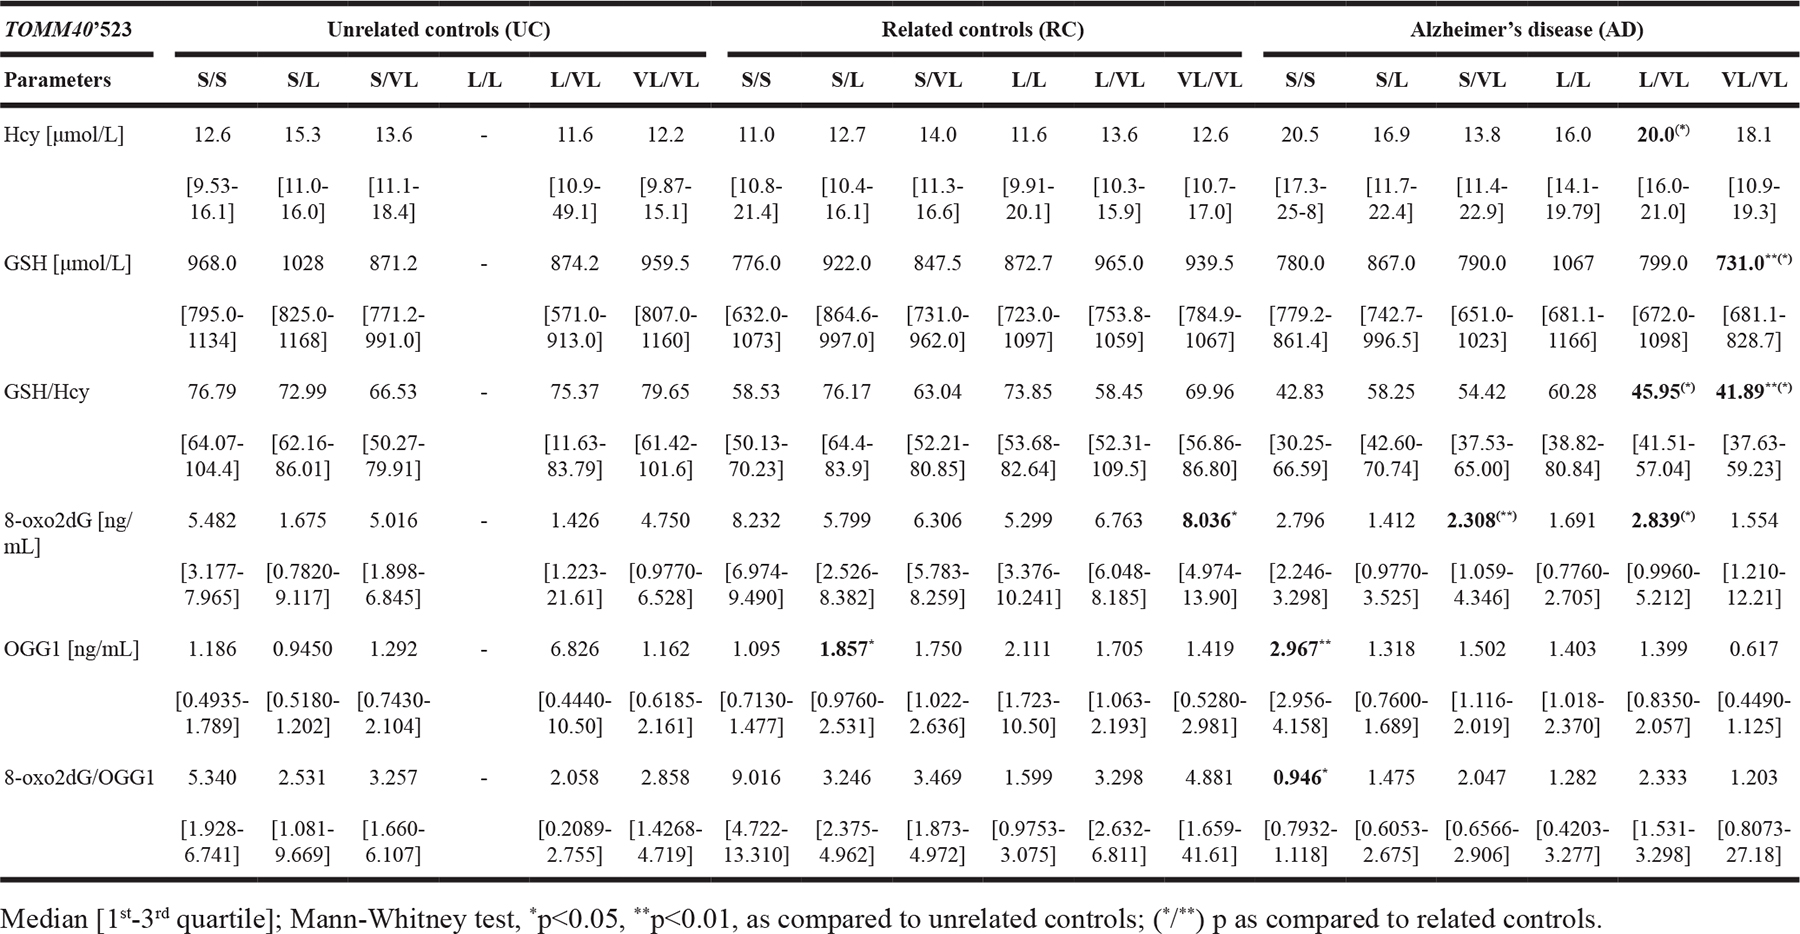
We have found that the AD patients with TOMM40‘523 S/S showed a nonsignificant tendency to increased and L/VL significant elevated (p<0.05 vs. RC) Hcy levels as compared to controls, accompanied by decreased GSH concentration. The highest GSH in UC was observed in TOMM40’523 S/L carriers, while in AD in L/L carriers. In both, UC and RC with VL/VL genotype the GHS level was slightly elevated as compared to median for all genotypes, however, the AD patients with VL/VL genotype showed the lowest GSH level (p<0.01 vs. UC and p<0.05 vs. RC), accompanied by slightly elevated Hcy level, and decreased GSH/Hcy ratio (p<0.01 vs. UC and p<0.05 vs. RC). The difference in median OGG1 plasma level was most significant in TOMM40’523 S/S genotype carriers (p<0.01 vs. UC), where the concentration of 8-oxo2dG was almost 3-fold lower as compared to RC (p<0.01) and was accompanied by a significant decrease of the 8-oxo2dG/OGG1 ratio (p<0.05 vs. UC). On the contrary, in AD patients with VL/VL genotype, the 8-oxo2dG was significantly reduced and accompanied by a reduction of OGG1 and 8-oxo2dG/OGG1 ratio, as compared to UC (Table 4).
Table 4: The concentration of homocysteine (Hcy), glutathione (GSH), 8-oxo-2’-deoxyguanosine (8-oxo2dG) and 8-oxoguanine DNA glycosylase (OGG1) in plasma of Alzheimer’s disease (AD) patients, related (RC) and unrelated controls (UC) stratified according to TOMM40’523 genotype
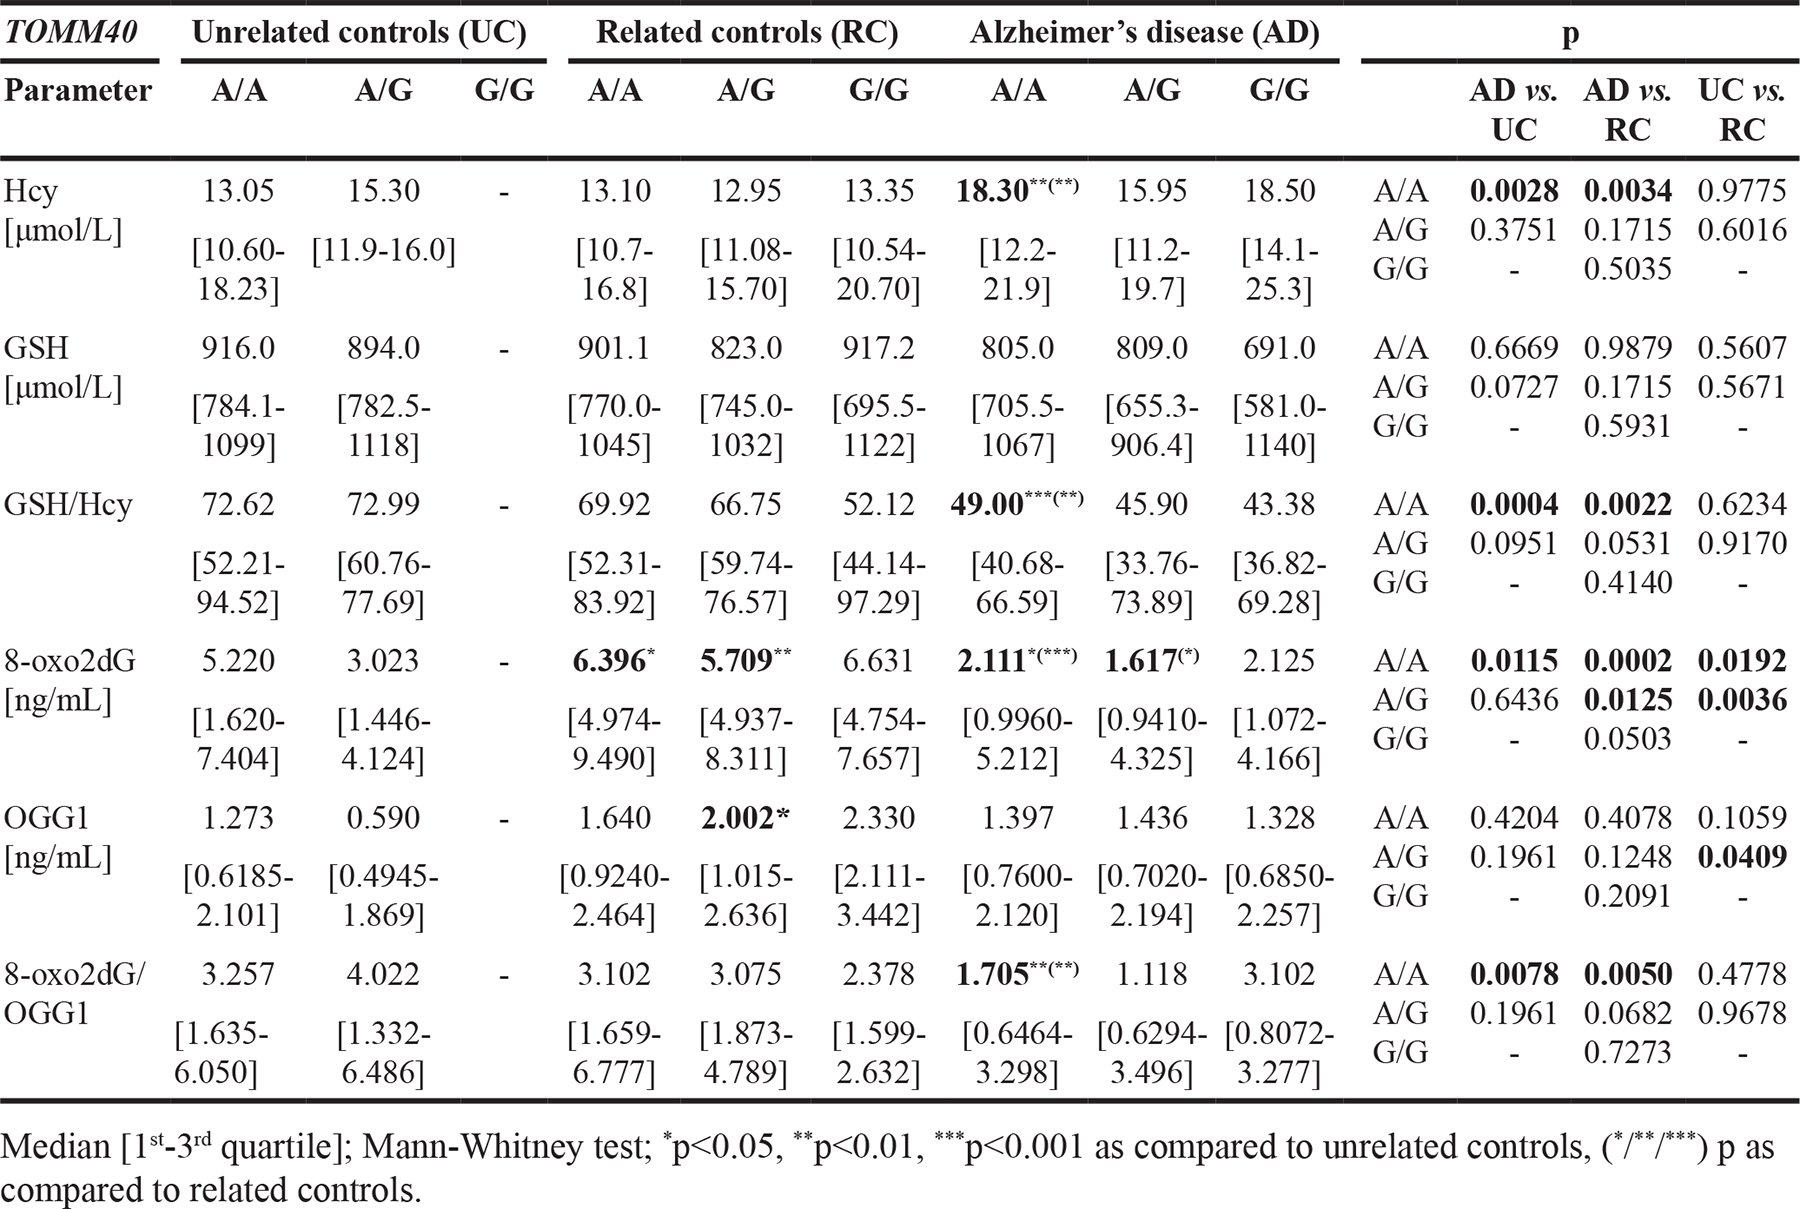
Subsequently, the analysis of TOMM40’650 SNP showed that in AD patients with A/A genotype the level of Hcy was significantly increased (p<0.01 vs. UC and RC), while GSH/Hcy ratio (p<0.001 vs. UC and p<0.01 vs. RC), 8-oxo2dG (p<0.05 vs. UC and p<0.001 vs. RC) and 8-oxo2dG/OGG1 ratio (p<0.01 vs. UC and RC) were significantly reduced, as compared to controls with the same genotype, regardless of family history of AD. Furthermore, we observed a tendency for decreased median GSH level in plasma of AD patients with G/G genotype as compared with RC with the same genotype. In both, RC and in AD, the ratio of GSH/Hcy tended to decrease with the presence of TOMM40’650 G allele in dose dependent manner. The reduction was more pronounced in RC. However, the lower values were observed for AD patients, as shown in Table 5. No similar trends were observed for other parameters.
Table 5: The concentration of homocysteine (Hcy), glutathione (GSH), 8-oxo-2’-deoxyguanosine (8-oxo2dG) and 8-oxoguanine DNA glycosylase (OGG1) in plasma of Alzheimer’s disease (AD) patients and related (RC) and unrelated controls (UC), stratified according to TOMM40’650 genotype
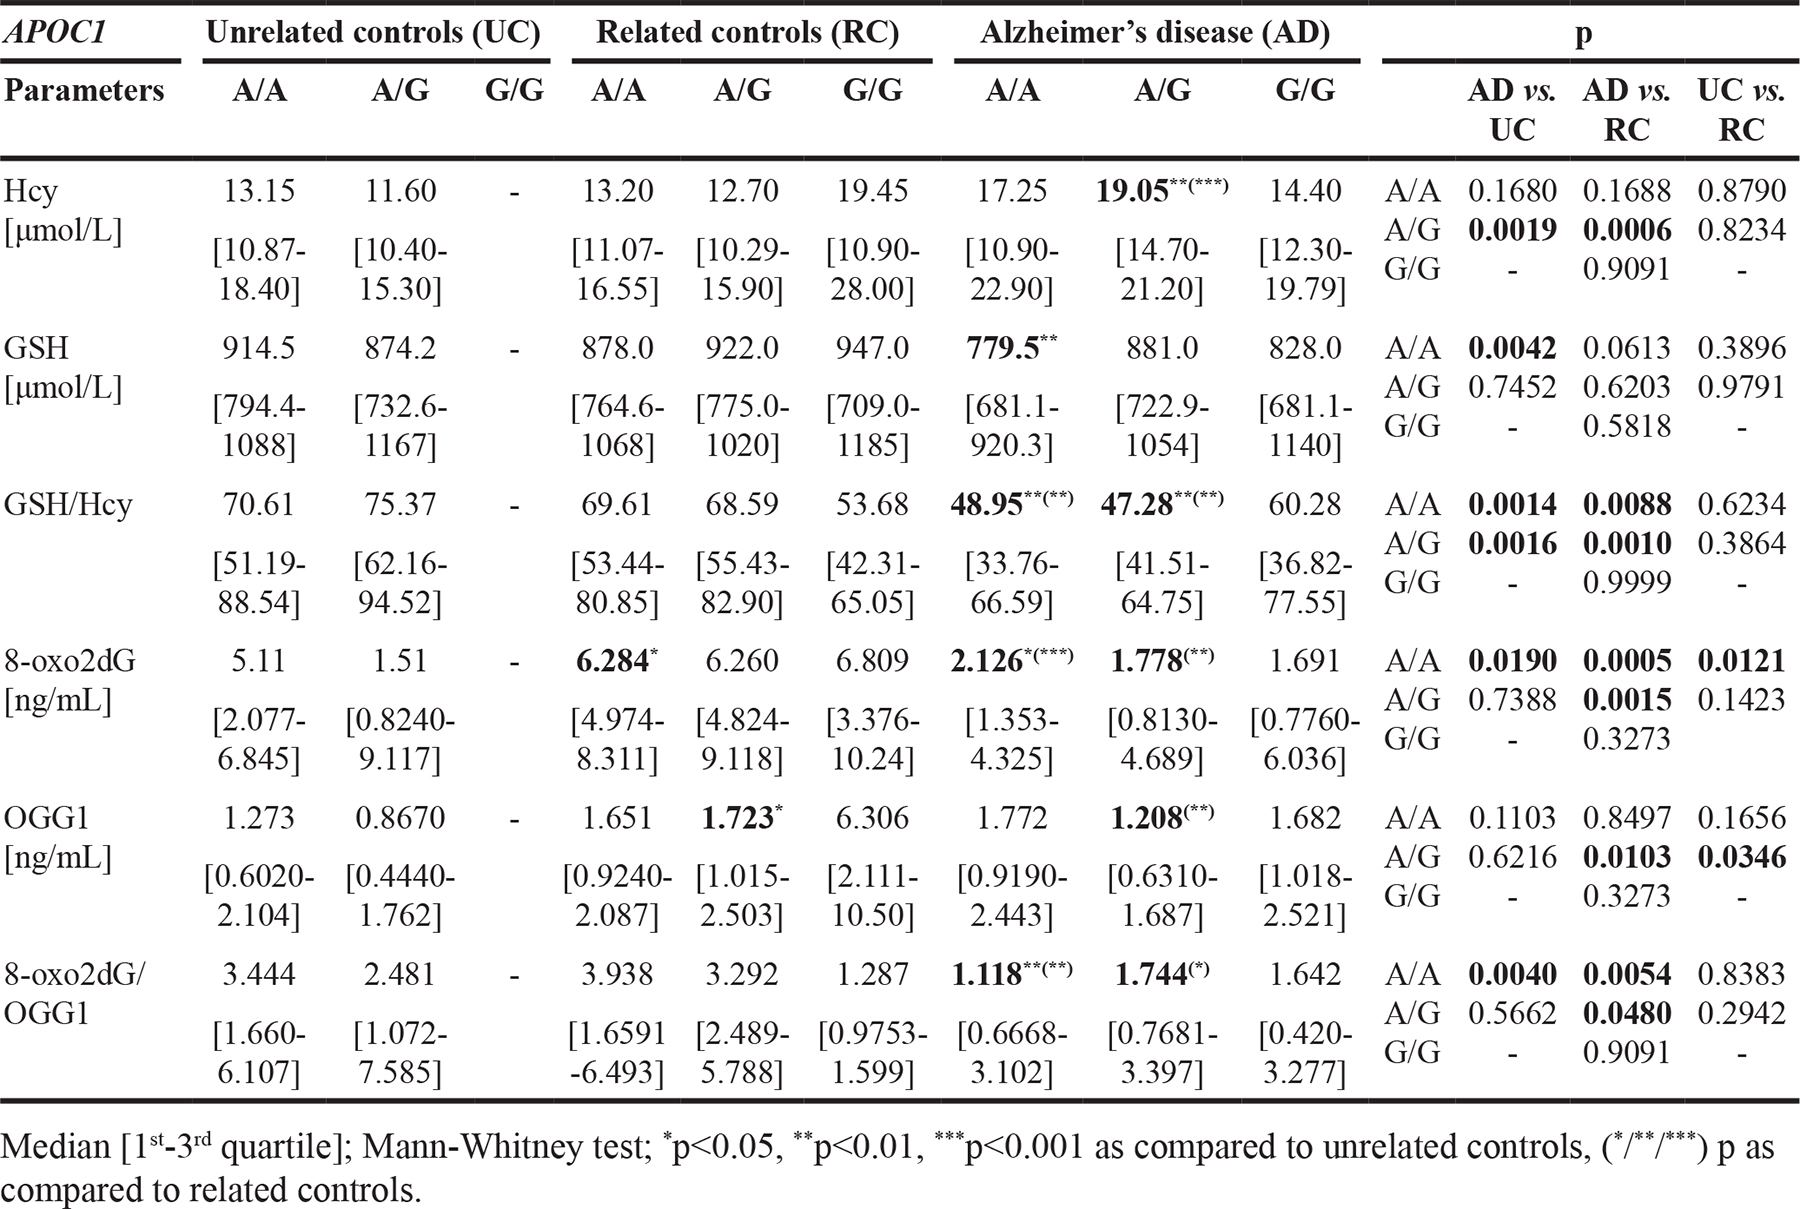
Our analysis on APOC1’638 SNP showed that in AD patients with A/A genotype, the GSH content (p<0.01 vs. UC), GSH/Hcy ratio (p<0.01 vs. UC and RC), 8-oxo2dG level (p<0.05 vs. UC and p<0.001 RC) and 8-oxo2dG/OGG1 ratio (p<0.01 vs. UC and RC) were significantly reduced, as compared to controls with or without family history of AD. Subsequently, for A/G genotype carriers, we observed significant increase of median Hcy level (p<0.01 vs. UC and p<0.001 vs. RC), accompanied by reduction of GSH/Hcy ratio (p<0.01 vs. UC and RC) and decreased of 8-oxo2dG level (p<0.01) and increased OGG1 content (p<0.01), followed by reduced 8-oxo2dG/OGG1 ratio (p<0.05), as compared to RC. Additionally, in controls with the G allele, we observed a tendency for decrease of GSH concentration. In turn, the reverse trend was found in RC. In both, UC and RC carriers of APOC1’638 G allele, we observed a tendency for dose dependent decrease of 8-oxo2dG/OGG1 ratio (Table 6).
Table 6: The concentration of homocysteine (Hcy), glutathione (GSH), 8-oxo-2’-deoxyguanosine (8-oxo2dG) and 8-oxoguanine DNA glycosylase (OGG1) in plasma of Alzheimer’s disease (AD) patients and related (RC) and unrelated controls (UC), stratified according to APOC1’638 genotype
DISCUSSION
So far, the pathomechanism of AD has been explained by various hypothesizes [49], including: neurofibrillary degeneration [50], amyloid cascade [51], impaired Aβ clearance [52], e.g., due to apolipoprotein misbalance [53, 54], neuroinflammation [55], mitochondrial dysfunction [13, 56, 57] and increased oxidative stress [58]. Factors responsible for generation of oxidative stress in AD include: Hcy [59], reduced antioxidant capacity [60], biometals, such as copper, iron, and zinc [61], disturbed glutamate signalling [62], microglia activation [63], as well as Aβ oligomers and hyperphosphorylated tau protein [64].
Dorszewska et al. [34] showed that in individuals over 60 years of age, the level of Hcy was significantly increased, probably due to decreased availability of cofactors essential for its metabolism, such as folic acid, and B vitamins [65]. The increased Hcy level may be seen in 25% of elderly persons without signs of dementia and may be associated with decreased cognitive functions [66]. According to the recent metaanlaysis of 111 papers by Setién-Suero [35], as well as Polish data [67–69], and our study, the Hcy levels were increased in the course of AD, possibly due to multiple mechanisms, which would include increased stress and neurotoxic agents.
Moreover, the level of Hcy in AD patients may depend on the advancement of the disease, as well as the used pharmacotherapy [35]. Our study has shown that Hcy level is particularly increased in the early stage of this dementive disease. Similar results were obtained by Kim et al. [70] and Sachdev et al. [71].
It seems that accumulation of Hcy in the central nervous system (CNS) may deteriorate function of the blood-brain-barrier (BBB) causing neurotoxic effects via damaging vascular endothelium and disturbed the production of nitrogen oxide [72]. Therefore, Hcy is thought to be one of the most significant factors associated with the risk of vascular and degenerative diseases, such as AD [73]. Peripheral Hcy concentration reflects its level in the brain, as Hcy crosses the BBB [74]. Fuso et al. [75], have shown that the elevated concentrations of Hcy in AD may lower the level of S-adenosylmethionine (SAM), essential for DNA methylation, thus may affect activity of presenilin 1 (PS1) and beta-site amyloid precursor protein cleaving enzyme 1 (BACE1), responsible for Aβ synthesis, associated with severity of the disease. In Polish population of AD patients, we showed that significantly higher level of Hcy may correspond to the severity of clinical symptoms.
Another mechanism of Hcy toxicity was described by Genedani et al. [59], who demonstrated that Hcy may interact as a NMDA receptors agonist, opening calcium ion channels and facilitating ion influx. Hcy mediated activation of NMDA receptor also induces decreased membrane potentials, and insufficient ATP production due to mitochondrial failure [76], visible by the release of cytochrome c [77]. The NMDA receptors are also a target for memantine, a drug commonly used for the treatment of AD, both single, or in combination with other drugs, for instance, AchE inhibitors. Memantine may act as neuroprotective agent [78] and may improve neuroplasticity in brain damaged by ischemia episodes [79]. Subsequently, both Gubandru et al. [80], and our studies have shown that treatment of AD patients with memantine or donepezil (AchEI) alone, or in combination, may be associated with a tendency for decreased Hcy as compared to non-treated patients, probably due to enhanced turnover, improved mitochondrial function and decreased oxidative stress [77].
It is known that 50% of Hcy is metabolized to Met, while the rest to Cys, used further for GSH synthesis [34, 81]. In AD, these metabolic pathways of the transformation of Hcy to Met and Cys are disturbed, possibly influencing the GSH production [34].
Subsequently, the data of the level of GSH in AD are divergent. Some data point out that GSH does not change significantly in post-mortem brains of AD patients [82] or may even rise in certain areas, including hippocampus [83], in the late stage of the disease. In turn, Gu et al. [84], and Venkateshappa et al. [85] reported the decreased concentration of GSH in the brains of AD patients. Interestingly, also the reduced level of plasma GSH may be observed in the early stage of dementia (MCI) [86, 87], and in AD patients, in whom the GSH concentration is reduced by roughly 13% [88], what is in line with our results. The reduced content of GSH is probably an effect of excessive Hcy production due to disturbed transformation to Cys [89].
According to our studies, the GSH level may depend on the advancement of the disease, as well as used pharmacotherapy. It would seem that the described relationship is the strongest in the early stage of the disease. On the other hand, particularly the therapy with memantine may lead to the improved transformation of Hcy to GSH, reduced ROS production as well as better mitochondria efficiency [81]. The GSH content decreases in severe dementia and the compensatory mechanisms associated with oxidative stress become disturbed.
It seems that reduction of GSH in AD may be associated with increased oxidative stress and may promote accumulation of DNA oxidation adducts, such as 8-oxo2dG [90]. The elevated level of 8-oxo2dG was observed in nuclear DNA from frontal, temporal, and parietal lobes and cerebellum of AD patients [91], as well as in peripheral tissues [34, 37, 40, 41]. However, Lovell et al. [92, 93], showed the decreased concentration of oxidized guanine in cerebrospinal fluid of AD patients. We observed similar differences in plasma of AD patients. Subsequently, it seems that presence of 8-oxo2dG in DNA during replication may lead to mutations and production of nonfunctional proteins, including DNA repair enzymes [38].
The main mechanism repairing oxidative damage in DNA by excising 8-oxo2dG depends on an OGG1 protein that seems to play a role both, in normal aging and in persons with an increased risk of developing AD. OGG1 content may be decreased in the brain [94], peripheral lymphocytes [40, 41], as well as in serum [37] of AD patients. In turn, in the present study we observed a reverse tendency for increase of OGG1 level in plasma of AD patients, what could be a response to the CNS DNA damage, as a consequence of the ongoing dementia process and the late activation of repair mechanisms. However, in conditions of developing the disease and increasing oxidative stress, the effectiveness of the enzyme is weakening, probably due to accumulated mutations and other genetic changes [95]. It seems that polymorphisms in TOMM40 and APOC1 genes may also contribute to excessive oxidative stress in persons predisposed for AD onset.
Our study showed that overrepresentation of TOMM40’523 L allele in the AD as well as the frequencies of other alleles, after adjusting for age, are in line with another Polish survey, by Maruszak et al. [24]. Although the literature data on TOMM40’523 are divergent, several reports indicate that the length variants (S, L, and VL) may be associated with the AOO of AD. Majority of reports, including the present study, show that the L variant is in strong linkage disequilibrium with APOE E4. Hence its independent effect is very difficult to analyze. The outcome of the remaining two alleles (S and VL) may be determined by several factors, including the presence of the APOE E4 allele, the age of the patients, familial, especially maternal, history of AD, the evaluated phenotype, the time of assessment and the length of follow up period [96]. The original work on TOMM40’523 variant by Roses et al. [26] indicated that in APOE E3/E4 carriers – VL allele may be associated with earlier symptoms of AD. Similar results were provided by subsequent works [22, 23, 97–99] and in part by Payton et al. [100] and Crenshaw et al. [101]. In turn, several works were not able to point out the role of TOMM40 homopolymers in AD [102–105]. The only study on the Polish population, by Maruszak et al. [24], indicated the contrary, the VL variant to be more frequent in patients who developed AD after 79 years of age. Several of the newer studies, including our data, have shown that the TOMM40’523 S variant may be associated with a faster cognitive decline or earlier dementia onset [21, 106]. Similarly, the data on APOE E3/E3 homozygous persons presented by Payton et al. [100] and Crenshaw et al. [101] were parallel to our observations. Furthermore, a recent work of Willette et al. [107] pointed out that familial and especially maternal history and of AD have a significant impact on the effect of TOMM40’523 S and VL alleles on AOO and rate of cognitive decline, also in younger subjects. The VL genotype was accompanied with the faster cognitive decline, while the tendency reversed in favor of S genotype in older persons. Interestingly, the observed increased frequency of L allele in persons with family history of AD occurred probably due to its linkage to APOE E4.
The possible mechanism of TOMM40‘523 length polymorphism on AOO may be associated with changed TOM40 protein production in the brain. Linnertz et al. [108], reported that the TOMM40’523 VL/VL genotype was accompanied with increased levels of both proteins (apoE and TOM40) in the AD autopsy brains. Moreover, the authors were able to reproduce those results in vitro by luciferase assays on two cell lines: hepatoma HepG2 and neuroblastoma SH-SY5Y. Another study confirmed those observations using luciferase reporter, founding that the VL/VL genotype was accompanied with a doubled expression as of S/S variant [100]. It was shown that overexpression of TOM40 improves the mitochondrial function and efficiency, abolishes the Aβ mitochondrial toxicity [109], possibly by improving import of repair enzymes and antioxidants [110], produced in cytoplasm and transferred to mitochondria [111], via dicarboxylate carrier (DIC) [112] and TOM40 pores [113], which in AD may be blocked by Aβ oligomers [114].
The correlation between gene variants associated with the generation of oxidative stress via mitochondria (TOMM40), performed for the first time in AD patients in this study, indicated that presence of single or double VL allele (‘523) most likely leads to a reduction in GSH levels as a consequence of Hcy production. Subsequently, the decline of antioxidant potential leads to significant disruption of excision of oxidation adducts from DNA. It seems that in these patients the late manifestation of dementia symptoms was associated with an additional factor. However, the presence of two S/S alleles (‘523) led to a decrease in the efficiency of oxidative DNA damage repair systems (expressed as the ratio of 8-oxo2dG/OGG1) and earlier onset of the disease.
The TOMM40’650 SNP may also be engaged in the proper function of mitochondria and thus the generation of oxidative damage in AD. According to current reports, and the present study, the G allele of this SNP was overrepresented in AD [115] and was strongly connected with APOE E4 [15, 116]. This SNP may affect TOM complex, probably by introducing new splicing site, impeding the function of the TOM40 protein, hence decreasing the availability of antioxidant peptides (GSH) and repair proteins to mitochondria (OGG1). The polymorphism was also connected with dyslipidaemia and artery damage [117, 118]. For the first time, our analysis showed that in AD patients, either or both, A/A genotype (‘650) and VL allele (‘523) were associated with more pronounced Hcy generation at the expense of GSH, expressed in decreased GSH/Hcy ratio, and less effective excision of damaged forms of nucleotides (8-oxo2dG) from DNA. In addition, the major predisposition factor for dementia for Polish AD patients with A/A genotype (‘650) present in 67% of carriers, would comprise the elevated concentration of Hcy (above 15 μmol/L). Since only 56% of G/G carriers had increased Hcy, the cause of facilitated AD onset for this genotype would require additional studies.
Similarly, the effect of APOC1’638 SNP in AD may also be associated with the generation of oxidative stress. The frequency analyses in AD confirmed our findings as G allele is more frequent in dementia [7–9]. Furthermore, the allele remains in strong, but not absolute, linkage with APOE E4. Interestingly, this SNP is significantly associated with a cingulate Aβ load in the human brain [119] and with an increase of low density lipoproteins [120], hence alleviating the risk of atherosclerosis and BBB damage. To our knowledge present study for the first time correlates peripheral biothiols and oxidative stress markers in respect to this SNP. Our study showed that, in AD, the presence of either one or two A alleles (‘638) was associated with an increase in Hcy concentration, most likely at the expense of GSH. Additionally, the decrease of the natural antioxidant level most likely led to the generation of oxidative DNA damage and a decrease in the efficiency of the DNA repair system, especially when family relationships with AD patients were taken into consideration. On the other hand, in the patients with G/G genotype (‘638), another factor than the inordinate transformation of biothiols and the deficiency of the DNA repair system was probably responsible for early dementia onset. Nevertheless, the explanation of the APOC1’638 dependent mechanism in AD pathogenesis requires further studies.
What is worth noting, the combining of data on the genetic status of APOE E4, TOMM40’650 and APOC1’623 increases significantly the sensitivity of assessing the risk of developing late onset AD based solely on APOE status [6, 115, 121, 122]. Moreover, the AD brain is under the influence of excessive oxidative stress, as soon as in preclinical stage [123], it may enhance appearing of symptoms, thus explaining why the patients with inordinate stress responses due to TOMM40 and APOC1 rare variants may develop AD in younger age [124, 125].
METHODS
Subjects
The study was subjected to 230 individuals. 88 AD patients, diagnosed according to NINCDS-ADRDRDA criteria [126] were enrolled in the study. The 10.3% of patients were early diagnosed, prior treatment, 57.3% of patients received acetylcholinesterase inhibitors (AchEI: donepezil or rivastigmine, in doses 5-10 mg/daily or 3-6 mg/daily, respectively), 11.8% of patients were treated with memantine (5-20 mg/daily) and 20.6% of patients were treated with combination of memantine and donepezil (10-20 and 5-10 mg/daily). We also recruited 80 control volunteers over 60 years of age with no signs of dementia and other neurological disorders or family history of AD. The comparative group comprised 62 volunteers aged > 60 years with a positive family history of AD and no signs of dementia or other neurological diseases. The alleles of the APOE gene were analyzed in all subjects. The demographic data are shown in Table 7. All participants or their legal guardians provided signed a written consent. The research project was approved by the Bioethical Committee at the Poznan University of Medical Sciences, a decision no. 1031/13, dated May 5, 2013, with subsequent supplement.
Table 7: Alzheimer’s disease and control’s demographic and genetic data, including age, sex distribution, APOE frequencies, duration of the disease, mini-mental (MMSE) score and used pharmacotherapy
Parameters |
Unrelated controls (UC) |
Related controls (RC) |
Alzheimer’s disease (AD) |
|
No. of cases [n] |
80 |
62 |
88 |
|
Age [years]* |
70 |
64 |
76 |
|
Sex [% female] |
78.8 |
72.6 |
67.0 |
|
APOE genotypes [%] |
E2/E2 |
1.3 |
0.0 |
0.0 |
E2/E3 |
13.8 |
9.7 |
3.4 |
|
E2/E4 |
3.8 |
1.6 |
3.4 |
|
E3/E3 |
68.8 |
45.2 |
42.0 |
|
E3/E4 |
12.5 |
40.3 |
43.2 |
|
E4/E4 |
0.0 |
3.2 |
8.0 |
|
Duration of the disease [%, years] |
<5 |
- |
- |
67.9 |
>5 |
- |
- |
32.1 |
|
MMSE score |
Within normal range [27–30] |
15.3±6.7# |
||
Treatment [%] |
None |
100 |
100 |
10.3 |
AchEI |
0 |
0 |
57.3 |
|
Mem |
0 |
0 |
11.8 |
|
AI+M |
0 |
0 |
20.6 |
|
*Median [min-max], #Mean±SD, otherwise percent values
AchEI – acetylcholinesterase inhibitors, Mem – memantine, AI+M – acetylcholinesterase inhibitors + memantine.
Material
Each participant’s blood was collected on an anticoagulant – K3EDTA (Monovette™ vacuum system, Sarstedt, USA). A total volume of 3 ml of blood was immediately aliquoted, frozen and stored at -80°C upon nucleic acid isolation (Gravity Flow, A&A Biotechnology, Poland). Subsequently, the remaining blood was centrifuged (1400 RCF, 10 min). The obtained plasma was aliquoted and stored at -80°C until further processing.
Homocysteine and glutathione quantification
The concentrations of plasma biothiols (Hcy and GSH) were analyzed by High Performance Liquid Chromatography with Electrochemical Detection (HPLC/EC) (Dionex, Germany/ESA, USA) according to Dorszewska et al. [34]. Briefly, 150 μL of plasma was diluted with 75 μL of water. Subsequently, the thiols were reduced with 25 μL of 10% TCEP (tris[2-carboxyethyl]phosphine) in water. Then, the sample was deproteinized with 500 μL 1M HClO4 and centrifuged for 5 min at 12,000 RCF, and the supernatant was injected into HPLC/EC system equipped with C18 column (250 mm x 4.6 mm x 5 μm) with pre-column (ThermoFisher Scientific, Germany) and eluted with aqueous buffer supplied with 25 mM NaH2PO4, 15 mM sodium dodecyl sulphate and 17% acetonitrile (vol.) at pH=2.90. The data were integrated and analyzed by Chromelon software.
OGG1 and 8-oxo2dG quantification
Determination of the plasma 8-oxo2dG and OGG1 concentrations was performed by the ELISA method. For 8-oxo2dG, the assay measured free circulating nucleotide in the plasma, excised from DNA, without prior DNA extraction and digestion. Similarly, the assay for OGG1 measured free circulating protein. The analysis was performed according to the manufacturer’s protocols (EI LAB, China) on undiluted plasma samples. Absorbance was measured by the EPOCH microplate reader (BioTek, USA). The concentrations were calculated from a four-parametric standard curve (R=0.998) by Gen5 ver. 2.01 software (provided with the reader). Inter- and intra-assay coefficients of variability amounted: 5.3% and 7.2% for 8-oxo2dG and 6.5% and 9.7% for OGG1, respectively.
APOE genotyping
The method of APOE genotyping has been described previously [127]. Briefly, the 40-50 ng of DNA extracted from frozen blood (Genomic Micro AX Blood Gravity, A&A Biotechnology, Poland) was used for Real-Time qPCR (CFX Connect, 1x SsofastEvaGreenSupermix, Bio-Rad, USA) with three pairs of primers (c=6.25 mM) corresponding to three common alleles of APOE (E2, E3, and E4, respectively). The reactions with Cq≤28 (≤10 cycle of secondary qPCR) were considered positive.
TOMM40’523 genotyping
For the carriers of APOE E4 allele, the TOMM40‘523 variant was analyzed by modified capillary electrophoresis method described before [24]. Briefly, 40-50 ng of genomic DNA was amplified with 10 mM corresponding primers (forward labeled with 5-FAM), Hi-Fi polymerase in a mixture of 1x Hi-Fi buffer, 1.6x Amplifier and 4 mM dNTPs (Novazym, Poland). The electrophoresis was carried out by an external laboratory on ABI3000 analyzer (GE, USA). The data was analyzed by Peak Scanner software. The results were validated by sequencing by an external laboratory.
Subsequently, for the remaining subjects (without APOE E4 allele), with a bimodal distribution of S and VL TOMM40‘523 variants, the analysis was performed by High Resolution Melting Analysis (HRM), according to: Laczó et al. [19], with modifications. Briefly, 20 ng of genomic DNA was used for Real-Time-qPCR (CFX Connect, 1x SsofastEvaGreenSupermix, Bio-Rad, USA) with corresponding primers (c=6.25 mM), next, the melting analysis was performed, and the data was analyzed by Melting Analysis software (Bio-Rad, USA). The HRM results were cross-referenced with the data obtained by capillary electrophoresis and validated by direct sequencing of 10% of samples in a commercial facility.
TOMM40’650 and APOC1’638 genotyping were performed by HRM method in conditions described above, and similarly, 10% of samples were validated by direct sequencing in an external laboratory.
The cycling conditions of PCRs and HRM, as well as the sequences of the primers used, shall be provided upon request.
The statistical analysis was performed using GraphPad for Windows software and Statistica 12.5 for Windows (StatSoft, USA), with the nonparametric Kruskal-Wallis and Mann-Whitney tests, unless stated otherwise. The normality of data distributions was checked using the Shapiro-Wilk test (when the sample size were 50 or less) and Kolgomorov-Smirnow (when the sample size is larger than 50). Analysis of the homogeneity of variance was carried out using the Levene’s test. Considering the potential false positive rate incurred by multiple comparisons of several gene associations in control and two patient groups, we applied the Bonferroni correction method to adjust the p value (pcorr). The level of significance was set as p<0.05.
CONCLUSIONS
Out of the analyzed variants, the TOMM40’523-L and APOC1’638-G were in the strongest linkage disequilibrium with APOE E4, while the association was much less pronounced for TOMM40’650-G SNP, especially in persons without a family history of AD. In the course of AD, the VL and A alleles of the analyzed genes (TOMM40’523 and APOC1’650) were associated with the generation of Hcy and with a decrease in the formation of antioxidants (GSH), followed by the reduced level of oxidized nucleotide (8-oxo2dG) removed from DNA. On the other hand, in patients with TOMM40’523 S/S genotype, most likely reduced the efficiency of the oxidative damage repair system (OGG1) led to the accumulation of oxidative damage in DNA and early symptoms of dementia.
Abbreviations
8-oxo2dG: 8-oxo-2’-deoxyguanosine, Aβ: amyloid β, AchEI: acetylcholinesterase inhibitor, AD: Alzheimer’s disease, apoC1: apolipoprotein C1, apoE: apolipoprotein E, AOO: age of onset, BACE1: beta-site amyloid precursor protein cleaving enzyme 1, BBB: blood-brain barrier, BER: base excision repair, CNS: central nervous system, Cys: cysteine, GSH: glutathione, Hcy: homocysteine, HHcy: hyperhomocysteinemia, HPLC/EC: high pressure liquid chromatography with electrochemical detection, HRM: high resolution melting, MCI: mild cognitive impairment, Met: methionine, MMSE: Mini–Mental State Examination, mtGSH: mitochondrial glutathione, OGG1: 8-oxoguanine DNA glycosylase, PS1: presenilin 1, RC: related controls - control volunteers with positive family history of Alzheimer’s disease, ROS: reactive oxygen species, SAM: S-adenosylmethionine, SNP: single nucleotide polymorphism, TOM40: translocase of the outer mitochondrial membrane homolog 40, UC: unrelated controls: control volunteers without positive family history of Alzheimer’s disease.
Author contributions
Michał Prendecki (M.P.) – recruited control and comparative groups, performed sample banking, DNA and plasma isolation and genetic analyses of APOE, APOC1 and TOMM40, as well as prepared the manuscript with subsequent editing; M.P. with the help of Marta Kowalska performed ELISA assessment of 8-oxo2dG and OGG1 in plasma, and prepared samples for HPLC analysis of Hcy and GSH. Jolanta Florczak-Wyspiańska, Jan Ilkowski, Małgorzata Wiszniewska and Wojciech Kozubski – recruited AD patients and performed clinical features assessment. Teresa Grzelak and M.P. – performed statistical analyses. Katarzyna Bialas – performed secondary editing and language correction. Jolanta Dorszewska performed chromatographic assessments and provided numerical data, as well as performed critical review and thorough editing of the manuscript.
CONFLICTS OF INTEREST
The authors have no conflicts of interest to disclose.
FUNDING
This work was supported by the grant of Poznan University of Medical Sciences, no. 502-14-01111677-10342.
REFERENCES
1. Reitz C, Brayne C, Mayeux R. Epidemiology of Alzheimer disease. Nat Rev Neurol. 2011; 7:137–52. https://doi.org/10.1038/nrneurol.2011.2.
2. Bekris LM, Yu CE, Bird TD, Tsuang DW. Genetics of Alzheimer disease. J Geriatr Psychiatry Neurol. 2010; 23:213–27. https://doi.org/10.1177/0891988710383571.
3. Alonso Vilatela ME, López-López M, Yescas-Gómez P. Genetics of Alzheimer’s disease. Arch Med Res. 2012; 43:622–31. https://doi.org/10.1016/j.arcmed.2012.10.017.
4. Lahiri DK, Maloney B, Basha MR, Ge YW, Zawia NH. How and when environmental agents and dietary factors affect the course of Alzheimer’s disease: the “LEARn” model (latent early-life associated regulation) may explain the triggering of AD. Curr Alzheimer Res. 2007; 4:219–28.
5. Corder EH, Saunders AM, Strittmatter WJ, Schmechel DE, Gaskell PC, Small GW, Roses AD, Haines JL, Pericak-Vance MA. Gene dose of apolipoprotein E type 4 allele and the risk of Alzheimer’s disease in late onset families. Science. 1993; 261:921–3.
6. Kamino K, Yoshiiwa A, Nishiwaki Y, Nagano K, Yamamoto H, Kobayashi T, Nonomura Y, Yoneda H, Sakai T, Imagawa M, Miki T, Ogihara T. Genetic Association Study between Senile Dementia of Alzheimer’s type and APOE/C1/C2 gene cluster. Gerontology. 1996; 42:12–9. https://doi.org/10.1159/000213820.
7. Cervantes S, Samaranch L, Vidal-Taboada JM, Lamet I, Bullido MJ, Frank-García A, Coria F, Lleó A, Clarimón J, Lorenzo E, Alonso E, Sánchez-Juan P, Rodríguez-Rodríguez E, et al. Genetic variation in APOE cluster region and Alzheimer’s disease risk. Neurobiol Aging. 2011; 32:2107.e7–2107.e17. https://doi.org/10.1016/j.neurobiolaging.2011.05.023.
8. Seshadri S, Fitzpatrick AL, Ikram MA, DeStefano AL, Gudnason V, Boada M, Bis JC, Smith AV, Carassquillo MM, Lambert JC, Harold D, Schrijvers EM, Ramirez-Lorca R, et al. Genome-wide analysis of genetic loci associated with Alzheimer disease. JAMA. 2010; 303:1832–40. https://doi.org/10.1001/jama.2010.574.
9. Li H, Wetten S, Li L, St Jean PL, Upmanyu R, Surh L, Hosford D, Barnes MR, Briley JD, Borrie M, Coletta N, Delisle R, Dhalla D, et al. Candidate single-nucleotide polymorphisms from a genomewide association study of Alzheimer disease. Arch Neurol. 2008; 65:45–53. https://doi.org/10.1001/archneurol.2007.3.
10. Jong MC, Gijbels MJ, Dahlmans VE, Gorp PJ, Koopman SJ, Ponec M, Hofker MH, Havekes LM. Hyperlipidemia and cutaneous abnormalities in transgenic mice overexpressing human apolipoprotein C1. J Clin Invest. 1998; 101:145–52. https://doi.org/10.1172/JCI791.
11. Zhang W, Hu C, Yang Z, Zhou Q, Peng D, Yuan X, Lv Z, Pang S, Jiang W, Yang C, Shi X, Pang G, Yang Y, et al. APOE and APOC1 gene polymorphisms are associated with cognitive impairment progression in Chinese patients with late-onset Alzheimer′s disease. Neural Regen Res. 2014; 9:653. https://doi.org/10.4103/1673-5374.130117.
12. Bagnoli S, Piaceri I, Tedde A, Bessi V, Bracco L, Sorbi S, Nacmias B. Tomm40 polymorphisms in Italian Alzheimer’s disease and frontotemporal dementia patients. Neurol Sci. 2013; 34:995–8. https://doi.org/10.1007/s10072-013-1425-6.
13. Huang H, Zhao J, Xu B, Ma X, Dai Q, Li T, Xue F, Chen B. The TOMM40 gene rs2075650 polymorphism contributes to Alzheimer’s disease in Caucasian, and Asian populations. Neurosci Lett. 2016; 628:142–6. https://doi.org/10.1016/j.neulet.2016.05.050.
14. He Y, Li C, Yang Y, Li Y, Wang Y, Yang H, Jin T, Chen S. Meta-analysis of the rs2075650 polymorphism and risk of Alzheimer disease. Aging Clin Exp Res. 2016; 28:805–11. https://doi.org/10.1007/s40520-015-0489-y.
15. Arpawong TE, Pendleton N, Mekli K, McArdle JJ, Gatz M, Armoskus C, Knowles JA, Prescott CA. Genetic variants specific to aging-related verbal memory: insights from GWASs in a population-based cohort. Ginsberg SD, editor. PLoS One. 2017; 12:e0182448. https://doi.org/10.1371/journal.pone.0182448.
16. Linnertz C, Saunders AM, Lutz MW, Crenshaw DM, Grossman I, Burns DK, Whitfield KE, Hauser MA, McCarthy JJ, Ulmer M, Allingham R, Welsh-Bohmer KA, Roses AD, et al. Characterization of the poly-T variant in the TOMM40 gene in diverse populations. PLoS One. 2012; 7:e30994. https://doi.org/10.1371/journal.pone.0030994.
17. Helisalmi S, Hall A, Meriläinen EH, Väisänen V, Koivisto AM, Herukka SK, Laitinen M, Soininen H, Hiltunen M. The Effect of TOMM40 Poly-T Repeat lengths on age of onset and cerebrospinal fluid biomarkers in finnish Alzheimer’s disease patients. Neurodegener Dis. 2014; 14:204–8. https://doi.org/10.1159/000367994.
18. Lyall DM, Harris SE, Bastin ME, Muñoz Maniega S, Murray C, Lutz MW, Saunders AM, Roses AD, Valdés Hernández M del C, Royle NA, Starr JM, Porteous DJ, Wardlaw JM, et al. Alzheimer’s disease susceptibility genes APOE and TOMM40, and brain white matter integrity in the Lothian Birth Cohort 1936. Neurobiol Aging. 2014; 35:1513.e25–1513.e33. https://doi.org/10.1016/j.neurobiolaging.2014.01.006.
19. Laczó J, Andel R, Vyhnalek M, Matoska V, Kaplan V, Nedelska Z, Lerch O, Gazova I, Moffat SD, Hort J. The effect of TOMM40 on spatial navigation in amnestic mild cognitive impairment. Neurobiol Aging. 2015; 36:2024–33. https://doi.org/10.1016/j.neurobiolaging.2015.03.004.
20. Lyall DM, Harris SE, Bastin ME, Muñoz Maniega S, Murray C, Lutz MW, Saunders AM, Roses AD, Valdés Hernández M del C, Royle NA, Starr JM, Porteous DJ, Wardlaw JM, et al. Are APOE ɛ genotype and TOMM40 poly-T repeat length associations with cognitive ageing mediated by brain white matter tract integrity? Transl Psychiatry. 2014; 4:e449. https://doi.org/10.1038/tp.2014.89.
21. Yu L, Lutz MW, Wilson RS, Burns DK, Roses AD, Saunders AM, Gaiteri C, De Jager PL, Barnes LL, Bennett DA. TOMM40 ′523 variant and cognitive decline in older persons with APOE ε3/3 genotype. Neurology. 2017; 88:661–8. https://doi.org/10.1212/WNL.0000000000003614.
22. Caselli RJ, Dueck AC, Huentelman MJ, Lutz MW, Saunders AM, Reiman EM, Roses AD. Longitudinal modeling of cognitive aging and the TOMM40 effect. Alzheimers Dement. 2012; 8:490–5. https://doi.org/10.1016/j.jalz.2011.11.006.
23. Johnson SC, La Rue A, Hermann BP, Xu G, Koscik RL, Jonaitis EM, Bendlin BB, Hogan KJ, Roses AD, Saunders AM, Lutz MW, Asthana S, Green RC, et al. The effect of TOMM40 poly-T length on gray matter volume and cognition in middle-aged persons with APOE E3/E3 genotype. Alzheimers Dement. 2011; 7:456–65. https://doi.org/10.1016/j.jalz.2010.11.012.
24. Maruszak A, Pepłońska B, Safranow K, Chodakowska-Żebrowska M, Barcikowska M, Zekanowski C. TOMM40 rs10524523 polymorphism’s role in late-onset Alzheimer’s disease and in longevity. J Alzheimers Dis. 2012; 28:309–22. https://doi.org/10.3233/JAD-2011-110743.
25. Schott JM, Crutch SJ, Carrasquillo MM, Uphill J, Shakespeare TJ, Ryan NS, Yong KX, Lehmann M, Ertekin-Taner N, Graff-Radford NR, Boeve BF, Murray ME, Khan QU, et al. Genetic risk factors for the posterior cortical atrophy variant of Alzheimer’s disease. Alzheimers Dement. 2016; 12:862–71. https://doi.org/10.1016/j.jalz.2016.01.010.
26. Roses AD, Lutz MW, Amrine-Madsen H, Saunders AM, Crenshaw DG, Sundseth SS, Huentelman MJ, Welsh-Bohmer KA, Reiman EM. A TOMM40 variable-length polymorphism predicts the age of late-onset Alzheimer’s disease. Pharmacogenomics J. 2010; 10:375–84. https://doi.org/10.1038/tpj.2009.69.
27. Devi L, Prabhu BM, Galati DF, Avadhani NG, Anandatheerthavarada HK. Accumulation of Amyloid precursor protein in the mitochondrial import channels of human Alzheimer’s disease brain is associated with mitochondrial dysfunction. J Neurosci. 2006; 26:9057–68. https://doi.org/10.1523/JNEUROSCI.1469-06.2006.
28. Hansson Petersen CA, Alikhani N, Behbahani H, Wiehager B, Pavlov PF, Alafuzoff I, Leinonen V, Ito A, Winblad B, Glaser E, Ankarcrona M. The amyloid beta-peptide is imported into mitochondria via the TOM import machinery and localized to mitochondrial cristae. Proc Natl Acad Sci U S A. 2008; 105:13145–50. https://doi.org/10.1073/pnas.0806192105.
29. Ribas V, García-Ruiz C, Fernández-Checa JC. Glutathione and mitochondria. Front Pharmacol. 2014; 5:151. https://doi.org/10.3389/fphar.2014.00151.
30. Ruszkiewicz J, Albrecht J. Changes in the mitochondrial antioxidant systems in neurodegenerative diseases and acute brain disorders. Neurochem Int. 2015; 88:66–72. https://doi.org/10.1016/j.neuint.2014.12.012.
31. Gu F, Chauhan V, Chauhan A. Glutathione redox imbalance in brain disorders. Curr Opin Clin Nutr Metab Care. 2015; 18:89–95. https://doi.org/10.1097/MCO.0000000000000134.
32. Shaki F, Shayeste Y, Karami M, Akbari E, Rezaei M, Ataee R. The effect of epicatechin on oxidative stress and mitochondrial damage induced by homocycteine using isolated rat hippocampus mitochondria. Res Pharm Sci. 2017; 12:119. https://doi.org/10.4103/1735-5362.202450.
33. Ganapathy PS, Perry RL, Tawfik A, Smith RM, Perry E, Roon P, Bozard BR, Ha Y, Smith SB. Homocysteine-mediated modulation of mitochondrial dynamics in retinal ganglion cells. Invest Ophthalmol Vis Sci. 2011; 52:5551. https://doi.org/10.1167/iovs.11-7256.
34. Dorszewska J, Florczak J, Rozycka A, Kempisty B, Jaroszewska-Kolecka J, Chojnacka K, Trzeciak WH, Kozubski W. Oxidative DNA damage and level of thiols as related to polymorphisms of MTHFR, MTR, MTHFD1 in Alzheimer’s and Parkinson’s diseases. Acta Neurobiol Exp (Wars). 2007; 67:113–29.
35. Setién-Suero E, Suárez-Pinilla M, Suárez-Pinilla P, Crespo-Facorro B, Ayesa-Arriola R. Homocysteine and cognition: a systematic review of 111 studies. Neurosci Biobehav Rev. 2016; 69:280–98. https://doi.org/10.1016/j.neubiorev.2016.08.014.
36. de Souza-Pinto NC, Wilson DM, Stevnsner TV, Bohr VA. Mitochondrial DNA, base excision repair and neurodegeneration. DNA Repair (Amst). 2008; 7:1098–109. https://doi.org/10.1016/j.dnarep.2008.03.011.
37. Sliwinska A, Kwiatkowski D, Czarny P, Toma M, Wigner P, Drzewoski J, Fabianowska-Majewska K, Szemraj J, Maes M, Galecki P, Sliwinski T. The levels of 7,8-dihydrodeoxyguanosine (8-oxoG) and 8-oxoguanine DNA glycosylase 1 (OGG1) – A potential diagnostic biomarkers of Alzheimer’s disease. J Neurol Sci. 2016; 368:155–9. https://doi.org/10.1016/j.jns.2016.07.008.
38. Yasui M, Kanemaru Y, Kamoshita N, Suzuki T, Arakawa T, Honma M. Tracing the fates of site-specifically introduced DNA adducts in the human genome. DNA Repair (Amst). 2014; 15:11–20. https://doi.org/10.1016/j.dnarep.2014.01.003.
39. Kwiatkowski D, Czarny P, Toma M, Jurkowska N, Sliwinska A, Drzewoski J, Bachurska A, Szemraj J, Maes M, Berk M, Su KP, Galecki P, Sliwinski T. Associations between DNA Damage, DNA base excision repair gene variability and Alzheimer’s disease risk. Dement Geriatr Cogn Disord. 2016; 41:152–71. https://doi.org/10.1159/000443953.
40. Dezor M, Dorszewska J, Florczak J, Kempisty B, Jaroszewska-Kolecka J, Rozycka A, Polrolniczak A, Bugaj R, Jagodzinski PP, Kozubski W. Expression of 8-oxoguanine DNA glycosylase 1 (OGG1) and the level of p53 and TNF-αlpha proteins in peripheral lymphocytes of patients with Alzheimer’s disease. Folia Neuropathol. 2011; 49:123–31.
41. Dorszewska J, Kempisty B, Jaroszewska-Kolecka J, Różycka A, Florczak J, Lianeri M, Jagodziński PP, Kozubski W. Expression and polymorphisms of gene 8-Oxoguanine Glycosylase 1 and the Level of Oxidative DNA damage in peripheral blood lymphocytes of patients with Alzheimer’s disease. DNA Cell Biol. 2009; 28:579–88. https://doi.org/10.1089/dna.2009.0926.
42. Melin J, Schulz C, Wrobel L, Bernhard O, Chacinska A, Jahn O, Schmidt B, Rehling P. Presequence recognition by the tom40 channel contributes to precursor translocation into the mitochondrial matrix. Mol Cell Biol. 2014; 34:3473–85. https://doi.org/10.1128/MCB.00433-14.
43. Du H, Guo L, Yan S, Sosunov AA, McKhann GM, Yan SS. Early deficits in synaptic mitochondria in an Alzheimer’s disease mouse model. Proc Natl Acad Sci U S A. 2010; 107:18670–5. https://doi.org/10.1073/pnas.1006586107.
44. Swerdlow RH, Khan SM. A mitochondrial cascade hypothesis for sporadic Alzheimer’s disease. Med Hypotheses. 2004; 63:8–20. https://doi.org/10.1016/j.mehy.2003.12.045.
45. Marí M, Morales A, Colell A, García-Ruiz C, Fernández-Checa JC. Mitochondrial glutathione, a key survival antioxidant. Antioxid Redox Signal. 2009; 11:2685–700. https://doi.org/10.1089/ARS.2009.2695.
46. Subramanian S, Gottschalk WK, Kim SY, Roses AD, Chiba-Falek O. The effects of PPARγ on the regulation of the TOMM40 - APOE - C1 genes cluster. Biochim Biophys Acta. 2017; 1863:810–6. https://doi.org/10.1016/j.bbadis.2017.01.004.
47. Corona JC, Duchen MR. PPARγ as a therapeutic target to rescue mitochondrial function in neurological disease. Free Radic Biol Med. 2016; 100:153–63. https://doi.org/10.1016/j.freeradbiomed.2016.06.023.
48. Human Splicing Finder - Version 3.1 [Internet]. Available 2018 May 7, from http://www.umd.be/HSF3/index.html.
49. Dorszewska J, Prendecki M, Oczkowska A, Dezor M, Kozubski W. Molecular basis of familial and sporadic Alzheimer’s disease. Curr Alzheimer Res. 2016; 13:952–63. https://doi.org/10.2174/1567205013666160314150501.
50. Kidd M. Paired helical filaments in electron microscopy of Alzheimer’s disease. Nature. 1963; 197:192–3.
51. Hardy J, Allsop D. Amyloid deposition as the central event in the aetiology of Alzheimer’s disease. Trends Pharmacol Sci. 1991; 12:383–8.
52. Selkoe DJ. Physiological production of the beta-amyloid protein and the mechanism of Alzheimer’s disease. Trends Neurosci. 1993; 16:403–9.
53. Biere AL, Ostaszewski B, Zhao H, Gillespie S, Younkin SG, Selkoe DJ. Co-expression of β-amyloid precursor protein (βAPP) and apolipoprotein E in cell culture: analysis of βAPP processing. Neurobiol Dis. 1995; 2:177–87. https://doi.org/10.1006/nbdi.1995.0019.
54. Michaelson DM. APOE ε4: the most prevalent yet understudied risk factor for Alzheimer’s disease. Alzheimers Dement. 2014; 10:861–8. https://doi.org/10.1016/j.jalz.2014.06.015.
55. Hauss-Wegrzyniak B, Dobrzanski P, Stoehr JD, Wenk GL. Chronic neuroinflammation in rats reproduces components of the neurobiology of Alzheimer’s disease. Brain Res. 1998; 780:294–303.
56. Bennett MC, Diamond DM, Stryker SL, Parks JK, Parker WD. Cytochrome oxidase inhibition: a novel animal model of Alzheimer’s disease. J Geriatr Psychiatry Neurol. 1992; 5:93–101.
57. Szabados T, Dul C, Majtényi K, Hargitai J, Pénzes Z, Urbanics R. A chronic Alzheimer’s model evoked by mitochondrial poison sodium azide for pharmacological investigations. Behav Brain Res. 2004; 154:31–40. https://doi.org/10.1016/j.bbr.2004.01.016.
58. Zafrilla P, Mulero J, Xandri JM, Santo E, Caravaca G, Morillas JM. Oxidative stress in Alzheimer patients in different stages of the disease. Curr Med Chem. 2006; 13:1075–83.
59. Genedani S, Rasio G, Cortelli P, Antonelli F, Guidolin D, Galantucci M, Fuxe K, Agnati LF. Studies on homocysteine and dehydroepiandrosterone sulphate plasma levels in Alzheimer’s disease patients and in Parkinson’s disease patients. Neurotox Res. 2004; 6:327–32.
60. Foy CJ, Passmore AP, Vahidassr MD, Young IS, Lawson JT. Plasma chain-breaking antioxidants in Alzheimer’s disease, vascular dementia and Parkinson’s disease. QJM. 1999; 92:39–45.
61. Kozlowski H, Janicka-Klos A, Brasun J, Gaggelli E, Valensin D, Valensin G. Copper, iron, and zinc ions homeostasis and their role in neurodegenerative disorders (metal uptake, transport, distribution and regulation). Coord Chem Rev. 2009; 253:2665–85. https://doi.org/10.1016/J.CCR.2009.05.011.
62. Butterfield DA, Hensley K, Cole P, Subramaniam R, Aksenov M, Aksenova M, Bummer PM, Haley BE, Carney JM. Oxidatively induced structural alteration of glutamine synthetase assessed by analysis of spin label incorporation kinetics: relevance to Alzheimer’s disease. J Neurochem. 1997; 68:2451–7.
63. Colton CA, Gilbert DL. Production of superoxide anions by a CNS macrophage, the microglia. FEBS Lett. 1987; 223:284–8. https://doi.org/10.1016/0014-5793(87)80305-8.
64. Huang WJ, Zhang X, Chen WW. Role of oxidative stress in Alzheimer’s disease. Biomed Rep. 2016; 4:519–22. https://doi.org/10.3892/br.2016.630.
65. Miner SE, Evrovski J, Cole DE. Clinical chemistry and molecular biology of homocysteine metabolism: an update. Clin Biochem. 1997; 30:189–201.
66. Prins ND, Den Heijer T, Hofman A, Koudstaal PJ, Jolles J, Clarke R, Breteler MM; Rotterdam Scan Study. Homocysteine and cognitive function in the elderly: the Rotterdam Scan Study. Neurology. 2002; 59:1375–80.
67. Religa D, Styczynska M, Peplonska B, Gabryelewicz T, Pfeffer A, Chodakowska M, Luczywek E, Wasiak B, Stepien K, Golebiowski M, Winblad B, Barcikowska M. Homocysteine, Apolipoproteine E and Methylenetetrahydrofolate Reductase in Alzheimer’s disease and mild cognitive impairment. Dement Geriatr Cogn Disord. 2003; 16:64–70. https://doi.org/10.1159/000070677.
68. Styczyńska M, Strosznajder JB, Religa D, Chodakowska-Zebrowska M, Pfeffer A, Gabryelewicz T, Czapski GA, Kobryś M, Karciauskas G, Barcikowska M. Association between genetic and environmental factors and the risk of Alzheimer’s disease. Folia Neuropathol. 2008; 46:249–54.
69. Czapski GA, Maruszak A, Styczyńska M, Żekanowski C, Safranow K, Strosznajder JB. Association between plasma biomarkers, CDK5 polymorphism and the risk of Alzheimer’s disease. Acta Neurobiol Exp (Wars). 2012; 72:397–411.
70. Kim J, Park MH, Kim E, Han C, Jo SA, Jo I. Plasma homocysteine is associated with the risk of mild cognitive impairment in an elderly Korean population. J Nutr. 2007; 137:2093–7.
71. Sachdev PS, Lipnicki DM, Crawford J, Reppermund S, Kochan NA, Trollor JN, Draper B, Slavin MJ, Kang K, Lux O, Mather KA, Brodaty H; Memory and Ageing Study Team. Risk profiles of subtypes of mild cognitive impairment: the sydney memory and ageing study. J Am Geriatr Soc. 2012; 60:24–33. https://doi.org/10.1111/j.1532-5415.2011.03774.x.
72. Ho PI, Ortiz D, Rogers E, Shea TB. Multiple aspects of homocysteine neurotoxicity: glutamate excitotoxicity, kinase hyperactivation and DNA damage. J Neurosci Res. 2002; 70:694–702. https://doi.org/10.1002/jnr.10416.
73. Beard RS, Reynolds JJ, Bearden SE. Hyperhomocysteinemia increases permeability of the blood-brain barrier by NMDA receptor-dependent regulation of adherens and tight junctions. Blood. 2011; 118:2007–14. https://doi.org/10.1182/blood-2011-02-338269.
74. Agnati LF, Genedani S, Leo G, Forni A, Woods AS, Filaferro M, Franco R, Fuxe K. Aβ peptides as one of the crucial volume transmission signals in the trophic units and their interactions with homocysteine. Physiological implications and relevance for Alzheimer’s disease. J Neural Transm. 2007; 114:21–31. https://doi.org/10.1007/s00702-006-0564-9.
75. Fuso A, Seminara L, Cavallaro RA, D’Anselmi F, Scarpa S. S-adenosylmethionine/homocysteine cycle alterations modify DNA methylation status with consequent deregulation of PS1 and BACE and beta-amyloid production. Mol Cell Neurosci. 2005; 28:195–204. https://doi.org/10.1016/j.mcn.2004.09.007.
76. Kamat PK, Kalani A, Tyagi SC, Tyagi N. Hydrogen Sulfide Epigenetically Attenuates Homocysteine-Induced Mitochondrial Toxicity Mediated Through NMDA Receptor in Mouse Brain Endothelial (bEnd3) Cells. J Cell Physiol. 2015; 230:378–94. https://doi.org/10.1002/jcp.24722.
77. Chen S, Dong Z, Zhao Y, Sai N, Wang X, Liu H, Huang G, Zhang X. Homocysteine induces mitochondrial dysfunction involving the crosstalk between oxidative stress and mitochondrial pSTAT3 in rat ischemic brain. Sci Rep. 2017; 7:6932. https://doi.org/10.1038/s41598-017-07112-z.
78. Karolczak D, Sawicka E, Dorszewska J, Radel A, Bodnar M, Błaszczyk A, Jagielska J, Marszałek A. Memantine - neuroprotective drug in aging brain. Pol J Pathol. 2013; 64:196–203.
79. Wang Y, Sanchez-Mendoza EH, Doeppner TR, Hermann DM. Post-acute delivery of memantine promotes post-ischemic neurological recovery, peri-infarct tissue remodeling, and contralesional brain plasticity. J Cereb Blood Flow Metab. 2017; 37:980–93. https://doi.org/10.1177/0271678X16648971.
80. Gubandru M, Margina D, Tsitsimpikou C, Goutzourelas N, Tsarouhas K, Ilie M, Tsatsakis AM, Kouretas D. Alzheimer’s disease treated patients showed different patterns for oxidative stress and inflammation markers. Food Chem Toxicol. 2013; 61:209–14. https://doi.org/10.1016/j.fct.2013.07.013.
81. Mosharov E, Cranford MR, Banerjee R. The quantitatively important relationship between homocysteine metabolism and glutathione synthesis by the transsulfuration pathway and its regulation by redox changes. Biochemistry. 2000; 39:13005–11.
82. Perry TL, Yong VW, Bergeron C, Hansen S, Jones K. Amino acids, glutathione, and glutathione transferase activity in the brains of patients with Alzheimer’s disease. Ann Neurol. 1987; 21:331–6. https://doi.org/10.1002/ana.410210403.
83. Adams JD, Klaidman LK, Odunze IN, Shen HC, Miller CA. Alzheimer’s and Parkinson’s disease. Brain levels of glutathione, glutathione disulfide, and vitamin E. Mol Chem Neuropathol. 1991; 14:213–26.
84. Gu M, Owen A, Toffa SE, Cooper J, Dexter D, Jenner P, Marsden C, Schapira AH. Mitochondrial function, GSH and iron in neurodegeneration and Lewy body diseases. J Neurol Sci. 1998; 158:24–9. https://doi.org/10.1016/S0022-510X(98)00095-1.
85. Venkateshappa C, Harish G, Mahadevan A, Srinivas Bharath MM, Shankar SK. Elevated oxidative stress and decreased antioxidant function in the human hippocampus and frontal cortex with increasing age: implications for neurodegeneration in Alzheimer’s disease. Neurochem Res. 2012; 37:1601–14. https://doi.org/10.1007/s11064-012-0755-8.
86. Bermejo P, Martín-Aragón S, Benedí J, Susín C, Felici E, Gil P, Ribera JM, Villar AM. Peripheral levels of glutathione and protein oxidation as markers in the development of Alzheimer’s disease from Mild Cognitive Impairment. Free Radic Res. 2008; 42:162–70. https://doi.org/10.1080/10715760701861373.
87. Puertas MC, Martínez-Martos JM, Cobo MP, Carrera MP, Mayas MD, Ramírez-Expósito MJ. Plasma oxidative stress parameters in men and women with early stage Alzheimer type dementia. Exp Gerontol. 2012; 47:625–30. https://doi.org/10.1016/j.exger.2012.05.019.
88. Rani P, Krishnan S, Rani Cathrine C. Study on Analysis of Peripheral Biomarkers for Alzheimer’s Disease Diagnosis. Front Neurol. 2017; 8:328. https://doi.org/10.3389/fneur.2017.00328.
89. Vitvitsky V, Thomas M, Ghorpade A, Gendelman HE, Banerjee R. A Functional Transsulfuration Pathway in the Brain Links to Glutathione Homeostasis. J Biol Chem. 2006; 281:35785–93. https://doi.org/10.1074/jbc.M602799200.
90. Akkaya Ç, Yavuzer SS, Yavuzer H, Erkol G, Bozluolcay M, Dinçer Y. DNA damage, DNA susceptibility to oxidation and glutathione redox status in patients with Alzheimer’s disease treated with and without memantine. J Neurol Sci. 2017; 378:158–62. https://doi.org/10.1016/J.JNS.2017.04.051.
91. Gabbita SP, Lovell MA, Markesbery WR. Increased nuclear DNA oxidation in the brain in Alzheimer’s disease. J Neurochem. 1998; 71:2034–40.
92. Lovell MA, Gabbita SP, Markesbery WR. Increased DNA oxidation and decreased levels of repair products in Alzheimer’s disease ventricular CSF. J Neurochem. 1999; 72:771–6.
93. Lovell MA, Xie C, Markesbery WR. Decreased base excision repair and increased helicase activity in Alzheimer’s disease brain. Brain Res. 2000; 855:116–23.
94. Iida T, Furuta A, Nishioka K, Nakabeppu Y, Iwaki T. Expression of 8-oxoguanine DNA glycosylase is reduced and associated with neurofibrillary tangles in Alzheimer’s disease brain. Acta Neuropathol. 2002; 103:20–5.
95. Mao G, Pan X, Zhu BB, Zhang Y, Yuan F, Huang J, Lovell MA, Lee MP, Markesbery WR, Li GM, Gu L. Identification and characterization of OGG1 mutations in patients with Alzheimer’s disease. Nucleic Acids Res. 2007; 35:2759–66. https://doi.org/10.1093/nar/gkm189.
96. Chiba-Falek O, Gottschalk WK, Lutz MW. The effects of the TOMM40 poly-T alleles on Alzheimer’s disease phenotypes. Alzheimers Dement. 2018; 14:692–8. https://doi.org/10.1016/j.jalz.2018.01.015.
97. Burggren AC, Mahmood Z, Harrison TM, Siddarth P, Miller KJ, Small GW, Merrill DA, Bookheimer SY. Hippocampal thinning linked to longer TOMM40 poly-T variant lengths in the absence of the APOE ε4 variant. Alzheimers Dement. 2017; 13:739–48.
98. Greenbaum L, Springer RR, Lutz MW, Heymann A, Lubitz I, Cooper I, Kravitz E, Sano M, Roses AD, Silverman JM, Saunders AM, Beeri MS. The TOMM40 poly-T rs10524523 variant is associated with cognitive performance among non-demented elderly with type 2 diabetes. Eur Neuropsychopharmacol. 2014; 24:1492–9. https://doi.org/10.1016/j.euroneuro.2014.06.002.
99. Hayden KM, McEvoy JM, Linnertz C, Attix D, Kuchibhatla M, Saunders AM, Lutz MW, Welsh-Bohmer KA, Roses AD, Chiba-Falek O. A homopolymer polymorphism in the TOMM40 gene contributes to cognitive performance in aging. Alzheimers Dement. 2012; 8:381–8. https://doi.org/10.1016/j.jalz.2011.10.005.
100. Payton A, Sindrewicz P, Pessoa V, Platt H, Horan M, Ollier W, Bubb VJ, Pendleton N, Quinn JP. A TOMM40 poly-T variant modulates gene expression and is associated with vocabulary ability and decline in nonpathologic aging. Neurobiol Aging. 2015; 39:217.e1–7. https://doi.org/10.1016/j.neurobiolaging.2015.11.017.
101. Crenshaw DG, Gottschalk WK, Lutz MW, Grossman I, Saunders AM, Burke JR, Welsh-Bohmer KA, Brannan SK, Burns DK, Roses AD. Using genetics to enable studies on the prevention of Alzheimer’s disease. Clin Pharmacol Ther. 2013; 93:177–85. https://doi.org/10.1038/clpt.2012.222.
102. Pomara N, Bruno D, Nierenberg JJ, Sidtis JJ, Martiniuk FT, Mehta PD, Zetterberg H, Blennow K. TOMM40 poly-T variants and cerebrospinal fluid amyloid beta levels in the elderly. Neurochem Res. 2011; 36:1124–8. https://doi.org/10.1007/s11064-011-0459-5.
103. Chu SH, Roeder K, Ferrell RE, Devlin B, DeMichele-Sweet MAA, Kamboh MI, Lopez OL, Sweet RA. TOMM40 poly-T repeat lengths, age of onset and psychosis risk in Alzheimer disease. Neurobiol Aging. 2011; 32:2328.e1–9. https://doi.org/10.1016/j.neurobiolaging.2011.06.016.
104. Lyall DM, Royle NA, Harris SE, Bastin ME, Maniega SM, Murray C, Lutz MW, Saunders AM, Roses AD, del Valdés Hernández MC, Starr JM, Porteous DJ, Wardlaw JM, et al. Alzheimer’s disease susceptibility genes APOE and TOMM40, and hippocampal volumes in the Lothian birth cohort 1936. PLoS One. 2013; 8:e80513. https://doi.org/10.1371/journal.pone.0080513.
105. Jun G, Vardarajan BN, Buros J, Yu CE, Hawk MV, Dombroski BA, Crane PK, Larson EB, Alzheimer’s Disease Genetics Consortium R, Mayeux R, Haines JL, Lunetta KL, Pericak-Vance MA, et al. Comprehensive search for Alzheimer disease susceptibility loci in the APOE region. Arch Neurol. 2012; 69:1270–9. https://doi.org/10.1001/archneurol.2012.2052.
106. Cruchaga C, Nowotny P, Kauwe JS, Ridge PG, Mayo K, Bertelsen S, Hinrichs A, Fagan AM, Holtzman DM, Morris JC, Goate AM; Alzheimer’s Disease Neuroimaging Initiative. Association and expression analyses with single-nucleotide polymorphisms in TOMM40 in Alzheimer disease. Arch Neurol. 2011; 68:1013–9. https://doi.org/10.1001/archneurol.2011.155.
107. Willette AA, Webb JL, Lutz MW, Bendlin BB, Wennberg AM, Oh JM, Roses A, Koscik RL, Hermann BP, Dowling NM, Asthana S, Johnson SC; Alzheimer’s Disease Neuroimaging Initiative. Family history and TOMM40 ‘523 interactive associations with memory in middle-aged and Alzheimer’s disease cohorts. Alzheimers Dement. 2017; 13:1217–25. https://doi.org/10.1016/j.jalz.2017.03.009.
108. Linnertz C, Anderson L, Gottschalk W, Crenshaw D, Lutz MW, Allen J, Saith S, Mihovilovic M, Burke JR, Welsh-Bohmer KA, Roses AD, Chiba-Falek O. The cis-regulatory effect of an Alzheimer’s disease-associated poly-T locus on expression of TOMM40 and apolipoprotein E genes. Alzheimers Dement. 2014; 10:541–51. https://doi.org/10.1016/j.jalz.2013.08.280.
109. Zeitlow K, Charlambous L, Ng I, Gagrani S, Mihovilovic M, Luo S, Rock DL, Saunders A, Roses AD, Kirby Gottschalk W. The biological foundation of the genetic association of TOMM40 with Late-onset Alzheimer’s disease. Biochim Biophys Acta. 2017; 1863:2973–2986. https://doi.org/10.1016/j.bbadis.2017.07.031.
110. Roses A, Sundseth S, Saunders A, Gottschalk W, Burns D, Lutz M. Understanding the genetics of APOE and TOMM40 and role of mitochondrial structure and function in clinical pharmacology of Alzheimer’s disease. Alzheimers Dement. 2016; 12:687–94. https://doi.org/10.1016/j.jalz.2016.03.015.
111. Johnson WM, Wilson-Delfosse AL, Mieyal JJ. Dysregulation of glutathione homeostasis in neurodegenerative diseases. Nutrients. 2012; 4:1399–440. https://doi.org/10.3390/nu4101399.
112. Kamga CK, Zhang SX, Wang Y. Dicarboxylate carrier-mediated glutathione transport is essential for reactive oxygen species homeostasis and normal respiration in rat brain mitochondria. Am J Physiol Cell Physiol. 2010; 299:C497–505. https://doi.org/10.1152/ajpcell.00058.2010.
113. Zara V, Palmisano I, Rassow J, Palmieri F. Biogenesis of the dicarboxylate carrier (DIC): translocation across the mitochondrial outer membrane and subsequent release from the TOM channel are membrane potential-independent. J Mol Biol. 2001; 310:965–71. https://doi.org/10.1006/jmbi.2001.4833.
114. Gottschalk WK, Lutz MW, He YT, Saunders AM, Burns DK, Roses AD, Chiba-Falek O. The Broad impact of TOM40 on Neurodegenerative diseases in aging. J Parkinsons Dis Alzheimers Dis. 2014; 1. https://doi.org/10.13188/2376-922X.1000003.
115. Ortega-Rojas J, Morales L, Guerrero E, Arboleda-Bustos CE, Mejia A, Forero D, Lopez L, Pardo R, Arboleda G, Yunis J, Arboleda H. Association analysis of polymorphisms in TOMM40, CR1, PVRL2, SORL1, PICALM, and 14q32.13 regions in colombian Alzheimer disease patients. Alzheimer Dis Assoc Disord. 2016; 30:305–9. https://doi.org/10.1097/WAD.0000000000000142.
116. Hinney A, Albayrak O, Antel J, Volckmar AL, Sims R, Chapman J, Harold D, Gerrish A, Heid IM, Winkler TW, Scherag A, Wiltfang J, Williams J, et al. Genetic variation at the CELF1 (CUGBP, elav-like family member 1 gene) locus is genome-wide associated with Alzheimer’s disease and obesity. Am J Med Genet B Neuropsychiatr Genet. 2014; 165B:283–93. https://doi.org/10.1002/ajmg.b.32234.
117. Abe S, Tokoro F, Matsuoka R, Arai M, Noda T, Watanabe S, Horibe H, Fujimaki T, Oguri M, Kato K, Minatoguchi S, Yamada Y. Association of genetic variants with dyslipidemia. Mol Med Rep. 2015; 12:5429–36. https://doi.org/10.3892/mmr.2015.4081.
118. Ronald J, Rajagopalan R, Ranchalis JE, Marshall JK, Hatsukami TS, Heagerty PJ, Jarvik GP. Analysis of recently identified dyslipidemia alleles reveals two loci that contribute to risk for carotid artery disease. Lipids Health Dis. 2009; 8:52. https://doi.org/10.1186/1476-511X-8-52.
119. Li J, Zhang Q, Chen F, Yan J, Kim S, Wang L, Feng W, Saykin AJ, Liang H, Shen L. Genetic interactions explain variance in cingulate amyloid burden: an AV-45 PET genome-wide association and interaction study in the ADNI cohort. Biomed Res Int. 2015; 2015:647389. https://doi.org/10.1155/2015/647389.
120. Willer CJ, Sanna S, Jackson AU, Scuteri A, Bonnycastle LL, Clarke R, Heath SC, Timpson NJ, Najjar SS, Stringham HM, Strait J, Duren WL, Maschio A, et al. Newly identified loci that influence lipid concentrations and risk of coronary artery disease. Nat Genet. 2008; 40:161–9. https://doi.org/10.1038/ng.76.
121. Chen YC, Hsiao CJ, Jung CC, Hu HH, Chen JH, Lee WC, Chiou JM, Chen TF, Sun Y, Wen LL, Yip PK, Chu YM, Chen CJ, et al. Performance metrics for selecting single nucleotide polymorphisms in late-onset Alzheimer’s disease. Sci Rep. 2016; 6:36155. https://doi.org/10.1038/srep36155.
122. Scacchi R, Gambina G, Ruggeri M, Martini MC, Ferrari G, Silvestri M, Schiavon R, Corbo RM. Plasma levels of apolipoprotein E and genetic markers in elderly patients with Alzheimer’s disease. Neurosci Lett. 1999; 259:33–6.
123. Balazs L, Leon M. Evidence of an oxidative challenge in the Alzheimer’s brain. Neurochem Res. 1994; 19:1131–7.
124. Zhang W, Bai M, Xi Y, Hao J, Liu L, Mao N, Su C, Miao J, Li Z. Early memory deficits precede plaque deposition in APPswe/PS1dE9 mice: involvement of oxidative stress and cholinergic dysfunction. Free Radic Biol Med. 2012; 52:1443–52. https://doi.org/10.1016/j.freeradbiomed.2012.01.023.
125. Takei N, Miyashita A, Tsukie T, Arai H, Asada T, Imagawa M, Shoji M, Higuchi S, Urakami K, Kimura H, Kakita A, Takahashi H, Tsuji S, et al. Genetic association study on in and around the APOE in late-onset Alzheimer disease in Japanese. Genomics. 2009; 93:441–8. https://doi.org/10.1016/j.ygeno.2009.01.003.
126. Dubois B, Feldman HH, Jacova C, Dekosky ST, Barberger-Gateau P, Cummings J, Delacourte A, Galasko D, Gauthier S, Jicha G, Meguro K, O’brien J, Pasquier F, et al. Research criteria for the diagnosis of Alzheimer’s disease: revising the NINCDS-ADRDA criteria. Lancet Neurol. 2007; 6:734–46. https://doi.org/10.1016/S1474-4422(07)70178-3.
127. Prendecki M, Florczak-Wyspianska J, Kowalska M, Lianeri M, Kozubski W, Dorszewska J. Normal aging and dementia. Update on Dementia. 2016. https://doi.org/10.5772/64203.