
INTRODUCTION
NB is the most common pediatric malignancy diagnosed before the first birthday and it is commonly localized in the abdomen [1]. It has a presumable cell origin in the sympathoadrenal lineage of the neural crest during development and represents about 6% of all cancers in children, with approximately 700 new cases appearing each year in the United States [2, 3].
The amplification of MYCN oncogene in sporadic NB is the most common focal genetic lesion. It occurs in approximately 22% of tumors and is associated with poor outcome [4, 5]. The International Neuroblastoma Risk Group Staging System (INRGSS) includes MYCN status together with age at diagnosis, histology and grade of tumor differentiation, presence or absence of 11q aberrations and tumor-cell ploidy to perform the actual risk-groups classification used in the clinic [6].
Despite the existence of intensive multimodal therapy and recent advances in target-directed therapies, which have improved NB patients´ responses, long-term survival of patients with high-risk NB remains poor. In this scenario, the glycolipid GD2 has demonstrated to be a good target for immunotherapy. In March 2015, the FDA approved a chimeric, human-murine, anti-GD2 monoclonal antibody known as Dinutuximab (Unituxin©, United Therapeutics Corporation, Silver Spring, MD) as an orphan drug designation for the maintenance treatment of pediatric patients with high risk NB. Dinutuximab achieved, as maintenance treatment in high risk NB, a partial response to first-line multiagent, multimodal therapy [7]. The clinical benefit of the anti-GD2 therapy for this indication stresses the important role that this glycolipid has in the biology of these tumor cells [8]. Nevertheless, many aspects of the participation of glycans in NB biology are still unknown.
In mammalian cells, glycans are made of at least 32 saccharides bound by different types of covalent bonds [9]. The participation of glycans in cell biology can be classified into four distinct categories that comprise 1) structural role, 2) inter-species recognition, 3) intra-species recognition and 4) molecular mimicry of host glycans [10]. In eukaryotic cells, glycans are attached to proteins defining O- and N-glycans branches. While O-glycans are mostly linked by an N-Acetylgalactosamine (GalNAc) to the hydroxyl group of the aminoacids threonine or serine, N-glycans are attached via the amide group of an asparagine residue [11, 12].
There are several reports describing the participation of glycans in cancer progression and dissemination [13, 14]. However, we are far from completely understanding the participation of glycans in cancer biology. Aberrant tumor glycosylation enables malignant cells to modulate the intra-species recognition, allowing them to escape from immune surveillance, promote inflammation, undergo epithelial-mesenchymal transition, increase vascular tumor cell-rolling and extravasation, and facilitate distant cell homing [15–17]. The altered glycophenotype in cancer involves different modifications in the cell surface, including falling or rising expression of certain glycans, accumulation of precursors and appearance of unfinished and novel structures [18]. The resulting glycophenotype depends on many factors, but mainly on the abnormal expression of the enzymes involved in the biosynthesis of glycan structures, also described as glycosyltransferases [19, 20].
Lewis blood group antigens are a related set of glycans with α1-3/α1-4 Fucose (Fuc) residues. It has been shown that Lewis glycans are overexpressed in different cancer indications as terminal glycan epitopes associated with bad prognosis and poor survival. In particular, Sialyl Lewis X (SLex) and Sialyl Lewis A (SLea) take part in the binding of E- and P- selectins to their ligands. Selectins mediate cellular extravasation and platelet aggregation that are highly associated with tumor cell circulation and dissemination. In certain tumors, mainly carcinomas, the overexpression of Lewis glycans on selectin ligands is reported to have an essential role in dissemination and metastasis [21, 22].
Even though our knowledge of glycan participation in tumor biology is growing faster, little is explored about the glycobiology of pediatric cancers and the role that glycans play in the malignant phenotype of tumors such as NB. Many reports are focused on the study of glycosyltransferases but very few describe glycan expression in this indication [23]. The first publication related to the expression of glycans in NB analyzed only 5 NB paraffin-fixed tumor samples, and described the loss of expression of the O-glycan blood-group-related antigens Thomsen–Friedenreich (T), Tn, Sialyl Tn (sTn), Lea, SLea, Leb, Lex, SLex, polyfucosyl Lex and Ley [24]. No other reports describing the general glycophenotype of NB can be found in the last years.
Regarding glycosyltransferases in NB, recent results published by Ho et al. associate favorable clinical prognosis with the expression of GALNT2, one of the enzymes that mediates the initial step of O-GalNAc glycosylation (GalNAcTs) [25]. The same group reported that overexpression of B3GNT3, which produces extended Core 1 O-glycans, down modulates the malignant phenotype in a NB cell line and predicts a favorable 5-year survival rate for NB patients [26]. In addition to GalNAcTs, Berois et al. proposed GALNT9 and GALNT13 as tumor prognostic markers in low and high risk tumors, respectively [27, 28]. Moreover, expression of GnT-V, an enzyme related to N-glycans biosynthesis, associates with a favorable prognosis and treatment outcome in NB patients. In the same report, it was demonstrated that GnT-V expression sensitizes NB cells to undergo apoptosis in response to retinoic acid [29].
Cancer glycobiology research has provided novel biomarkers and potential therapeutic targets in different cancer indications. In this work, we describe the glycan phenotype and the glycosyltransferases expression in a panel of NB cell lines and also in primary-tumor patient samples. Our results support the hypothesis that Lewis family glycans, as part of O-glycosylated proteins, have a role in the malignant phenotype of MYCN-amplified NB cells.
RESULTS
The presence of Lewis glycan family (SLex, Lex, SLea, Lea, Ley and Leb) and truncated O-glycans (Tn, STn and T) in human NB cell lines was evaluated by Flow Cytometry using specific mAb. Higher expression of Lewis glycans was observed in the MYCN-amplified cell lines (SK-N-BE (2), IMR-32 and CHP-212) in comparison with the non-amplified ones (SK-N-AS and SK-N-SH). Neither of the Lewis glycans showed high expression (greater than 1.5 rMFI) in MYCN-non-amplified cell lines. Conversely, we observed high or medium (between 1.25 and 1.5 rMFI) expression of SLex, Lex, Ley and Leb in all the MYCN-amplified cell lines. Lea and SLea expression was rated as medium and high in CHP-212 and SK-N-BE(2), respectively. Regarding truncated O-glycans, a low expression (lower than 1.25) was found in most of the cell lines evaluated. Only T antigen showed high and medium expression in SK-N-BE(2) and SK-N-SH, respectively (Table 1).
Table 1: Glycan expression evaluated by flow cytometry in the MYCN-amplified (SK-N-BE(2), IMR-32 and CHP-212) and MYCN-non-amplified (SK-N-AS and SK-N-SH) NB cell lines
Neuroblastoma Cell Lines |
|||||
|---|---|---|---|---|---|
MYCN-amplified |
MYCN non-amplified |
||||
Lewis glycan family |
SK-N-BE(2) |
IMR-32 |
CHP-212 |
SK-N-AS |
SK-N-SH |
Slex |
1.87 + 0.14 |
1.32 + 0.09 |
5.33 + 1.29 |
1.23 + 0.13 |
1.15 + 0.09 |
Lex |
2.19 + 0.63 |
1.51 + 0.09 |
1.66 + 0.14 |
1.16 + 0.16 |
1.05 + 0.10 |
Slea |
1.10 + 0.18 |
1.03 + 0.01 |
1.32 + 0.31 |
1.09 + 0.08 |
1.11 + 0.05 |
Lea |
1.53 + 0.25 |
1.08 + 0.05 |
1.01 + 0.08 |
1.17 + 0.05 |
1.03 + 0.12 |
Ley |
1.75 + 0.45 |
1.72 + 0.55 |
2.70 + 0.30 |
1.04 + 0.11 |
1.15 + 0.13 |
Leb |
2.29 + 0.30 |
2.27 + 0.19 |
1.32 + 0.20 |
1.37 + 0.06 |
1.05 + 0.02 |
Truncated O-Glycans |
|||||
Tn |
1.06 + 0.02 |
1.07 + 0.02 |
1.07 + 0.05 |
1.06 + 0.04 |
1.15 + 0.06 |
STn |
1.02 + 0.06 |
1.06 + 0.04 |
1.05 + 0.06 |
1.10 + 0.06 |
1.06 + 0.03 |
T |
1.57 + 0.25 |
1.21 + 0.14 |
1.09 + 0.03 |
1.11 + 0.05 |
1.38 + 0.06 |
Data represent MFImeans ± S.D (rMFI) of triplicate determinants. High expression was considered greater than 1.5 rMFI, medium between 1.25 and 1.5 rMFI, and low as lower than 1.25 rMFI.
Transcription activity of the glycosyltransferases involved in the biosynthesis of Lewis antigens was carried out by qRT-PCR. Lewis glycans biosynthetic pathway is illustrated in Supplementary Figure 1. We evaluated the mRNA levels of the enzymes C2GNT1, which is responsible for the Core 2 structure in O-glycans, the sialyltransferases ST3GAL3/4/6 and the fucosyltransferases FUT3/4/6/7/9/11, which catalyze the addition of the sialic acid and the fucose residues on the Lewis family glycans, respectively. Regarding C2GNT1, two out of three MYCN-amplified cell lines showed more than threefold increase in mRNA expression compared with MYCN-non-amplified cells, in line with glycans expression. Although SK-N-BE(2) cell line did not overexpress C2GNT1, it shows overexpression of ST3Gal6 and FUT3/6/7/9. On the whole, all MYCN-amplified cell lines showed overexpression of at least one ST3Gal and more than one FUT (Figure 1). CHP-212 and SK-N-AS were chosen to conduct the rest of the experimental evaluations comparing MYCN-amplified and non-amplified cells, since they demonstrated the biggest difference in the glycophenotype profile.
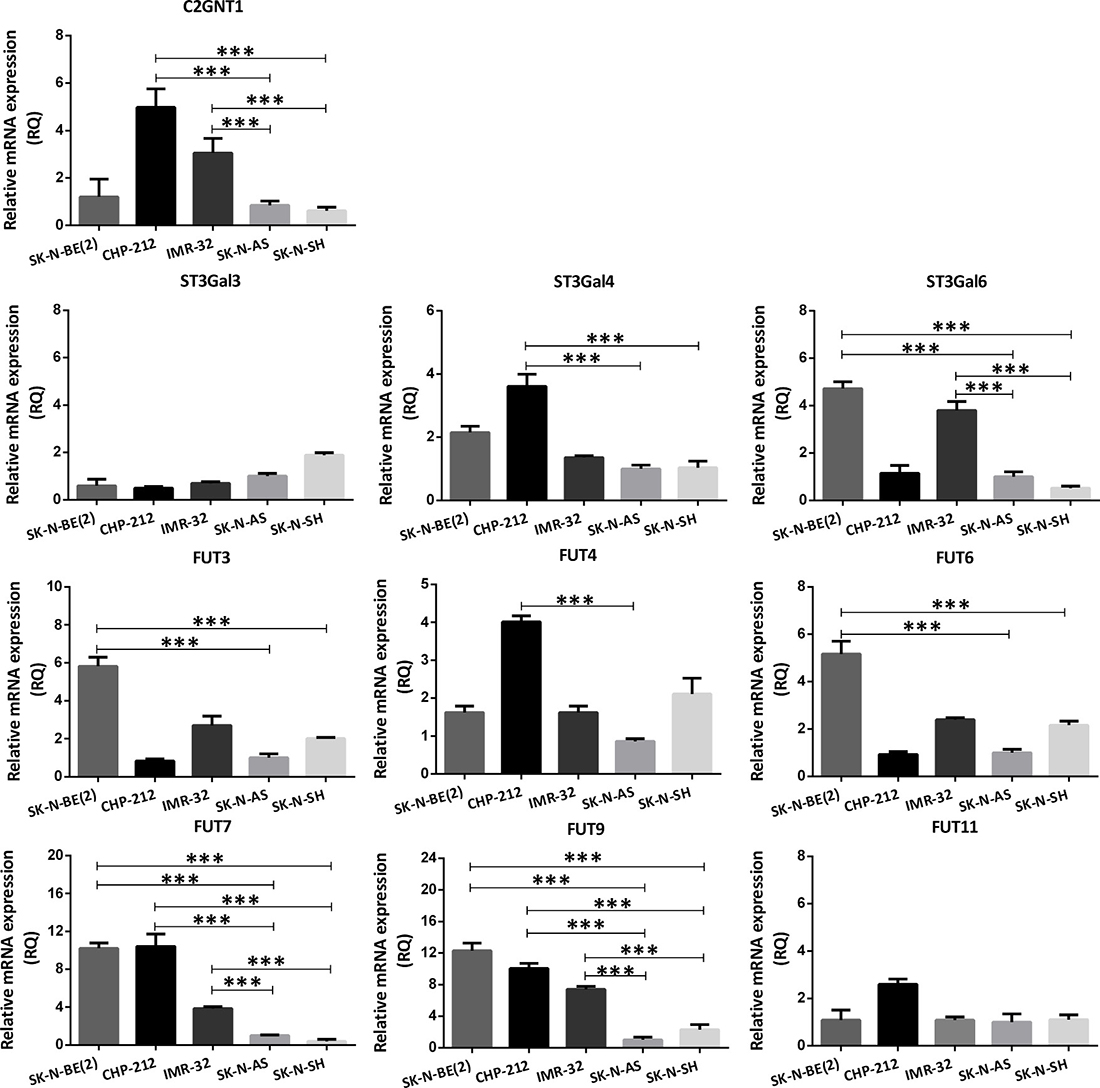
Figure 1: Comparison of glycosyltransferases transcripts expression involved in Core 2 O-glycan biosynthesis in NB cell lines. The mRNA levels were analyzed using qRT-PCR. The relative amount of mRNA levels was normalized to the endogenous HPRT1 expression. A significant biological result was considered at threefold difference between samples values. Data represent means ± S.D. of three independent experiments (***p < 0.001, ANOVA followed by Tukey’s multiple comparisons test).
Similar results were observed in the evaluation of the transcription level of these glycosyltransferases using primary-tumor samples from NB patients. Determination of MYCN status showed that two out of four NB were MYCN-amplified (NB1 and NB2) and the other two were non-amplified (NB3 and NB4). Transcription level of C2GNT1 was more than three times higher for NB1 in comparison with non-amplified tumor samples. Regarding downstream glycosyltransferases expression involved in the biosynthesis of Lewis glycans, NB1 showed higher levels of ST3GAL3/6 and FUT3/4/6/7/11. Even though C2GNT1 was not overexpressed in NB2, ST3GAL4 was overexpressed as well as all the FUTs evaluated (FUT3/4/6/7/9/11). MYCN-non-amplified samples NB3 and NB4 showed low glycosyltransferases transcription levels in comparison with the MCYN-amplified samples (Figure 2).
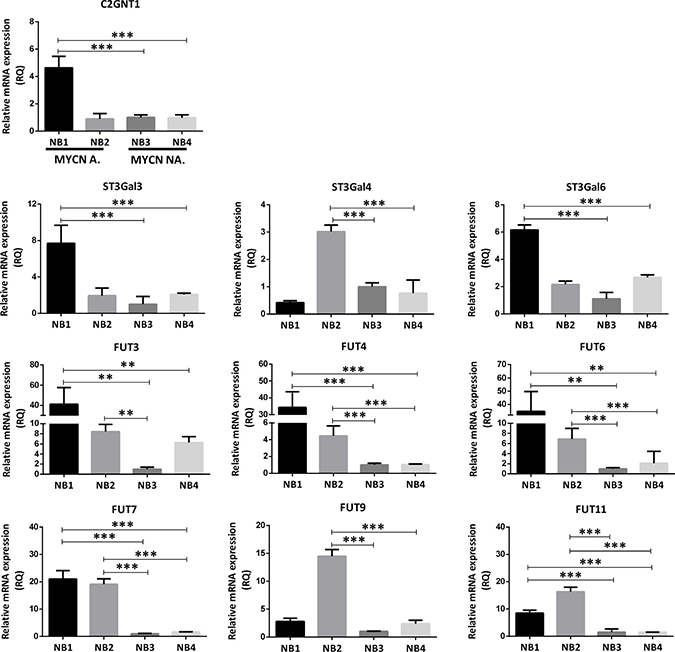
Figure 2: Comparison of glycosyltransferases transcripts expression involved in Core 2 O-glycan biosynthesis in patient-derived primary-tumor samples. The mRNA levels were analyzed using qRT-PCR. The relative amount of mRNA levels was normalized to the endogenous HPRT1 expression. A significant biological result was considered at a threefold difference between samples values. Data represent means ± S.D. of three independent experiments (**p < 0.01, ***p < 0.001, ANOVA followed by Tukey’s multiple comparisons test).
In order to evaluate the participation of C2GNT1 expression in Lewis glycans biosynthesis, we treated CHP-212 and SK-N-AS cell lines with a specific small interfering RNA (siRNA). A significant decrease of C2GNT1 mRNA expression was obtained by qRT-PCR (Figure 3A). In addition, we observed a reduction in SLex and Ley expression in these cells upon C2GNT1 silencing measured by Flow Cytometry (Figure 3B). To study if Lewis glycans were part of N-glycans we measured their expression after treatment with Tunicamycin (TNM). This treatment did not decrease expression of SLex and Ley in any of the cell lines evaluated. As positive controls of TNM treatment, we measured Concanavalin A (ConA) or Phytohemagglutinin-L (L-PHA) binding, observing a decrease in the expression of N-glycans structures (Supplementary Figure 2).
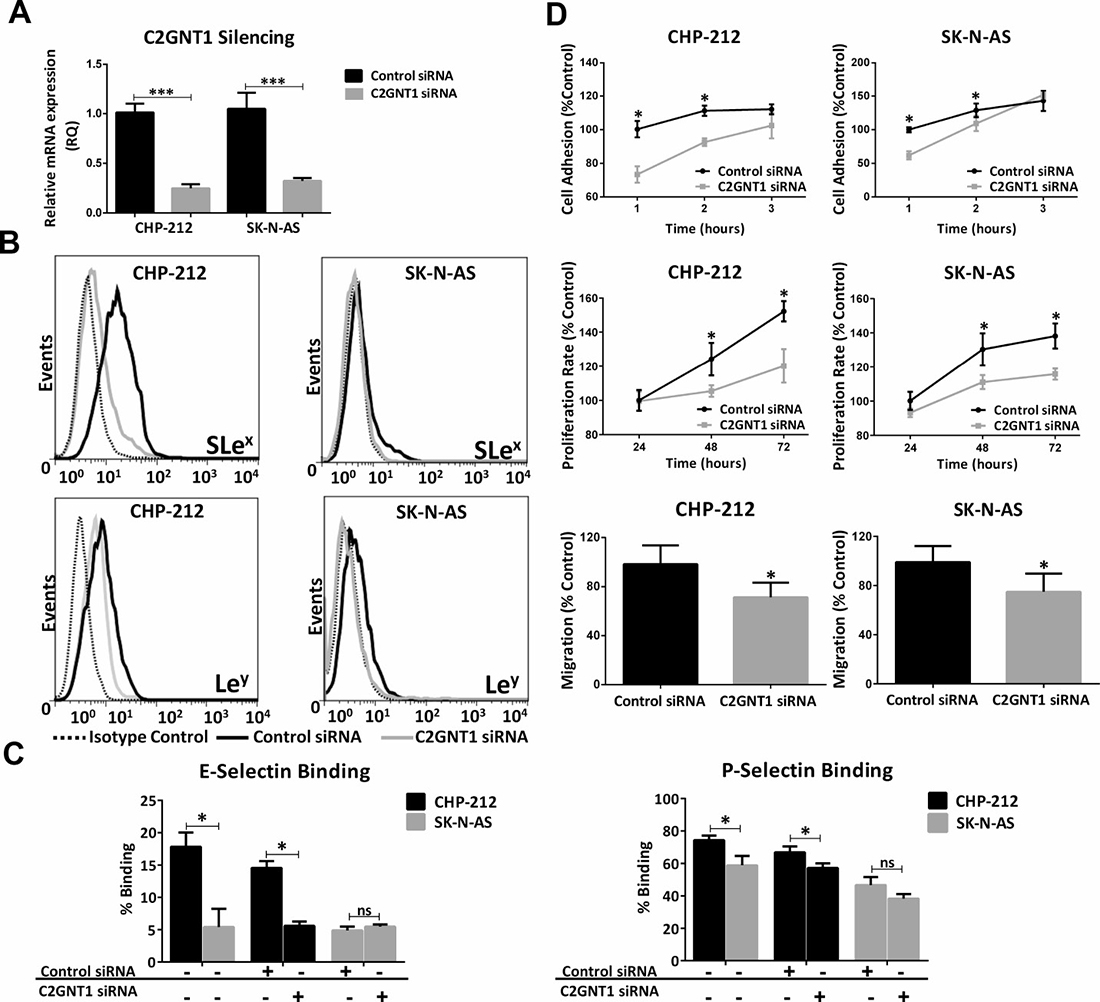
Figure 3: Silencing of C2GNT1 gene by siRNA technology in CHP-212 and SK-N-AS cell lines after 48 h of siRNA transfection (C2GNT1 and control). (A) Measurement of C2GNT1 transcript levels by qRT-PCR (***p < 0.001, T-test). (B) Analysis of SLex and Ley expression. (C) Binding of selectins on control siRNA or C2GNT1 siRNA transfected cell lines and non-treated cells. (D) Cell adhesion measured at 1, 2 and 3 h; Cell proliferation measured at 24, 48 and 72 h (ANOVA followed by Tukey’s multiple comparisons post hoc test, *p < 0.05); Cell migration capacity assessed by Transwell® inserts (*p < 0.05, T-test). For all assays, data represent means ± S.D. of three independent assays.
Cell capacity to bind selectins or expression of selectin ligands was studied using Recombinant Human (E-, L- or P-) Selectin Fc chimeras. Our results showed higher binding to E- and P-selectin for CHP-212 in comparison with SK-N-AS. CHP-212 binding to E- and P- selectins decreased sharply due to C2GNT1 silencing (Figure 3C). No differences in L-selectin binding were found between both cell lines (data not shown). Additionally, higher expression of selectin ligand PSGL-1 was observed in CHP-212 compared to SK-N-AS (Supplementary Figure 3).
Furthermore, we observed a modulation in the in vitro cell behaviour when C2GNT1 was silenced. Our results show that cell adhesion, proliferation and also migration were significantly reduced by the decrease of C2GNT1 mRNA expression in CHP-212 and SK-N-AS cell lines. C2GNT1 knockdown provoked a significant reduction in adhesion, by almost 30% for CHP-212 and 35% for SK-N-AS cell line, compared with control siRNA transfected cells. Concerning cell proliferation, we observed a significant reduction when both cell lines were silenced at 24 h. Moreover, cell migration significantly decreased after C2GNT1 knockdown, in CHP-212 as well as in SK-N-AS (Figure 3D).
Finally, we wondered if the observed glycophenotype was regulated by epigenetic mechanisms. To answer this, we treated the cells with Trichostatin A (TSA) and as a consequence we found a significant increase in the expression of SLex and Ley in treated SK-N-AS cells. No expression changes were recorded in TSA-treated CHP-212 cells (Figure 4A). The presence of Lewis glycans in MYCN-non-amplified cells after TSA treatment accounted for a significant increase in the transcription rate of C2GNT1 and FUT3/7 (Figure 4B). Moreover, our results also show a significant increase in E-selectin ligands expression in MYCN-non-amplified cells treated with TSA (Figure 4C). Considering all the results obtained in this work, we proposed a hypothetical functional model described in Figure 5.
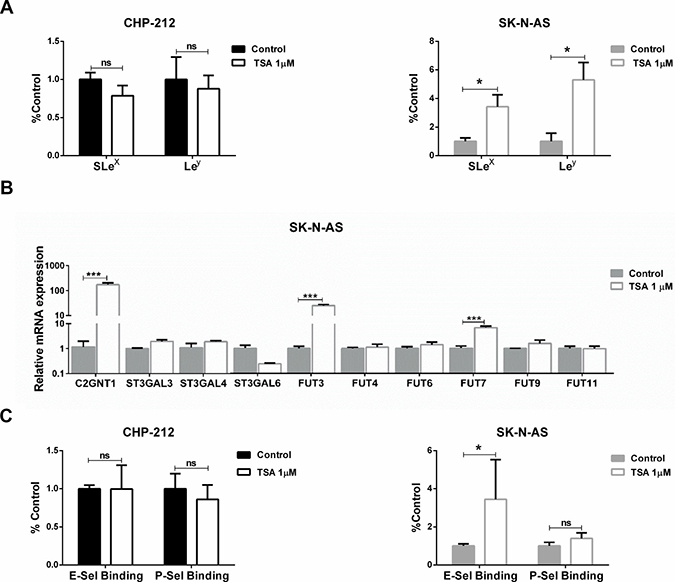
Figure 4: Evaluation of epigenetic regulation. CHP-212 and SK-N-AS cell lines were treated with TSA 1 mM for 24 h and controls in DMSO. (A) SLex and Ley expression (*p < 0.05, T-test). (B) Glycosyltransferases mRNA expression (***p < 0.001, T-test). (C) Binding of E-, P-selectin (*p < 0.05, Mann–Whitney for E-selectin binding and T-test for P-selectin binding). Data represent means ± S.D. of three independent assays.
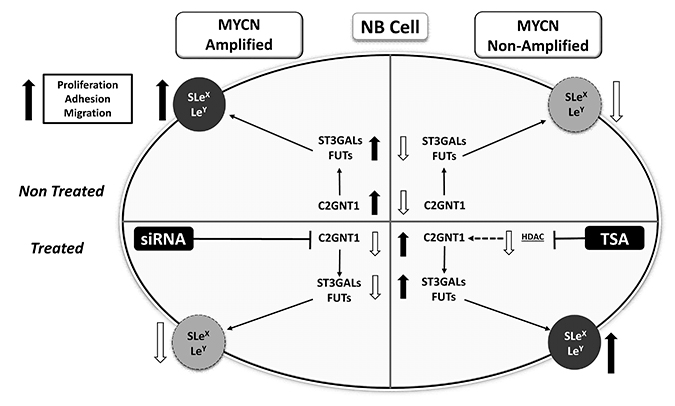
Figure 5: Schematic representation of results obtained for Lewis glycans and glycosyltransferases expression in treated and untreated MYCN-amplified and non-amplified NB cells.
DISCUSSION
Proteins and lipids-associated carbohydrates have demonstrated to play a crucial role in the interaction between cancer cells and tumor microenvironment. Most of our prevailing knowledge about cancer glycosylation has been obtained working on adult indications. Conversely, much less is known regarding pediatric cancers such as NB. Our work describes the expression of Lewis antigens in the context of O-glycans in NB cells and the consequences of their downregulation in cell behaviour. These results support the hypothesis that this group of glycans plays an important role in NB cell malignancy.
Abnormal synthesis of cancer-associated glycans occurs as a consequence of the deregulated expression of glycosyltransferases genes. While sialyltransferases catalyze the transference of a sialic acid (Sia) from CMP-Sia to the hydroxyl group at the terminal non-reducing position of Galactose, N-Acetylglucosamine (GlcNAc), GalNAc or Sia monosaccharide, fucosyltransferases are responsible for the transference of an L-fucose sugar from GDP-fucose to an acceptor substrate [30]. The biosynthesis of Lewis glycans depends on the expression of enzyme members of one or both of these gene families. In adult cancers, such as breast and colorectal cancer, it has been demonstrated that overexpression of ST3Gal3 and FUT4 is associated with poor prognosis [31–33].
The glycophenotype characterization of five established and validated NB cell lines revealed high expression of the Lewis family glycans (Lex, SLex, Ley and Leb) in those with amplification of the oncogene MYCN. Our results show that high expression of the Lewis antigens in MYCN-amplified cell lines could be a consequence of the overexpression of ST3Gal4/6 and more than one FUT. Interestingly, ST3Gal3 and FUT11 were not overexpressed in any of the cell lines evaluated. No glycosyltransferases overexpression was detected in MYCN-non-amplified cell lines in accordance with the low expression of glycans. Similar results were obtained with patient-derived primary-tumor samples; while overexpression of ST3Gal3/6 was detected in one MYCN-amplified patient sample (NB1), overexpression of ST3Gal4 was found in the other (NB2). In MYCN-amplified patient samples, we also found raised transcript levels in most of the FUTs. In relation to this, it is reported that several FUTs have overlapping roles in this metabolic route [34–36]. Our findings suggest that, in the biosynthesis of Lewis glycans, redundant enzymatic activities seem to be equally chosen by malignant cells.
The enzyme C2GNT1 synthesizes the Core 2 O-glycans by catalyzing the bond of GlcNAc to the Core 1, being the only enzyme capable of this activity. The higher gene transcription of C2GNT1 in MYCN-amplified IMR-32 and CHP-212 in contrast to the MYCN-non-amplified SK-N-SH and SK-N-AS cell lines, suggests that Lewis glycans are expressed as part of Core 2 O-glycans in MYCN-amplified cells. Overexpression of C2GNT1 mRNA levels was also observed in NB1 MYCN-amplified patient tumor sample. Although the other MYCN-amplified tumor sample NB2 showed low transcription levels of C2GNT1, we observed remarkable high levels of most of the downstream glycosyltransferases evaluated, suggesting a presumed high expression of Lewis glycans. Evaluation of Lewis glycans presence should be conducted on patient samples to analyze their association with MYCN status. Subsequent experiments in cell lines showed a significant reduction in the expression of SLex and Ley when C2GNT1 expression was silenced. In this line, no changes in the expression of SLex and Ley were observed as a result of TNM treatment, confirming the low presence of these antigens in N-glycans. Moreover, silencing of C2GNT1 diminished in vitro cell adhesion, proliferation and migration indicating the participation of O-glycans in these cell behaviors.
Ho et al. recently published that overexpression of GALNT2, one of the GalNAcTs involved in O-glycans biosynthesis, suppresses malignant phenotype by increasing the amount of T and Tn on the IGF-1 receptor [25]. It is described in another publication that overexpression of B3GNT3, the enzyme that is responsible for adding GlcNAc to Core 1 to produce Extended Core 1 oligosaccharides, down modulates the malignant phenotype including migration and invasion [37]. Additionally, B3GNT3 has been proposed as an independent prognostic factor of better survival outcome after the evaluation of its expression in NB tumor tissues [26]. Considering that B3GNT3 and C2GNT1 use the same substrate but lead to a different glycan branching with a different role in malignant cell behavior, it can be proposed that Ho et al. results are complementary to this work supporting the hypothesis that extended Core 1 formation down modulates the malignant phenotype while Core 2 formation promotes it.
Hill and colleagues reported that the expression of SLex in the context of Core 2 O-glycan regulates invasion by E-selectin ligands, using Colon and Hepatic Carcinoma cell lines [38]. In our work, we showed that the MYCN-amplified cell line CHP-212 presents high levels of SLex, catalyzed by ST3Gal4 and FUT4/7/9 in the context of Core 2 O-glycans. Furthermore, in the evaluation of total selectin ligands by selectin Fc quimera in both cell lines, we also observed higher binding of E- and P- selectins to the MYCN-amplified cell line. The silencing of C2GNT1 significantly reduced E- and P-selecting binding. Selectins have a wide panel of ligands in which Lewis glycans have a key role. Post-translational modification of P-selectin ligands with SLex was reported in NB cell lines among other indications, but their association with C2GNT1 expression was not reported [39]. Additionally, CHP-212 shows higher expression of the natural ligand PSGL-1.
It is known that MYCN cannot initiate de novo gene transcription but is a key element in the recruitment of nucleosome-modifiers, mainly histone acetyltransferases (HAC), diminishing histone deacetyltransferases (HDAC) to promote a positive transcription landscape [40]. Abnormal epigenetic regulation involving HDACs has been largely associated with cancer development. HDACs are a family of 18 enzymes that maintain histones in a positively charged state which in turn promotes a condensed chromatin structure that prevents gene transcription. A large body of evidences indicates that HDACs are involved in cancer progression at cell cycle regulation, apoptosis, DNA damage response, metastasis and angiogenesis [41]. HDACs participation on NB has been previously reported. A gene expression analysis published by Keshelava et al. on 17 cell lines demonstrated a strong association of HDAC1 gene expression with multidrug resistance [42]. In addition, a correlation between the HDAC8 expression, disease stage and poor outcome was published by Oehme et al. analyzing 118 NB patient samples by q-RT-PCR. In this work, the authors showed a correlation between HDAC8 expression and the International Neuroblastoma Staging System (INSS) stages, as well as with the Shimada pathology classification among others, but they were unable to report an association with MYCN amplification status [43]. Very few reports stand on the relation between HDACs, glycophenotype and glycosyltransferases regulation as it is reported in this work. The incubation of SK-N-AS cells with the broad spectrum HDACs inhibitor TSA promotes a remarkable overexpression of C2GNT1 and FUT3/7 which results in a high expression of Ley and SLex. Consequently, the modification of the glycophenotype on these MYCN-non-amplified cells increases the presence of selectin ligands.
The results presented in this work described the biosynthetic route and the epigenetic regulation involved in the expression of Lewis family antigens as part of Core 2 O-glycans. In summary, our results and the evidence provided by other groups strongly support the hypothesis that Lewis family glycans as part of Core 2 O-glycans play a relevant role in NB malignant cell behavior in MYCN-amplified cells.
MATERIALS AND METHODS
Cell lines
Human MYCN-amplified NB cell lines SK-N-BE(2) (CRL-2271), IMR-32 (CCL-127) and CHP-212 (CRL-2273), and human MYCN-non-amplified NB cell lines SK-N-AS (CRL-2137) and SK-N-SH (HTB-11) were obtained from the American Type Culture Collection (ATCC, Virginia, United States) [44, 45]. SK-N-BE(2) and CHP-212 cells were grown in a mixture (1:1) of Eagle’s Minimum Essential Medium (Sigma Aldrich by Merck, Darmstadt, Germany) and Ham´s F-12 Nutrient Mix (Gibco, California, United States). SK-N-AS cells were grown in Dulbecco’s Modified Eagle’s Medium (Gibco, California, United States) and 0.1 mM of Non-Essential Amino Acids (Gibco, California, United States). IMR-32 and SK-N-SH cells were grown in Eagle’s Minimum Essential Medium. 10% fetal bovine serum (FBS) (Gibco, California, United States) was added and the cell cultures were maintained at 37° C in a humidified atmosphere of 5% CO2. Cell lines were tested for Mycoplasma every three months by DAPI staining (Vector, California, United States). Cells passages lower than 20 were used in the described experiments.
Patient-derived primary-tumor samples
Different amounts (1 to 2 mg) of four samples of human pediatric NB tumors were chosen for RNA extraction. Two samples presented MYCN-amplified (NB1 and NB2) and two MYCN non-amplified status (NB3 and NB4) evaluated by IHC (data not shown). Tumor samples were obtained from the Pediatric Hospital “Prof. Dr. Juan P. Garrahan”. MYCN status was determined by interfering FISH technique with Vysis Paraffin II Pretreatment Reagent Kit (Abbott Laboratories, Illinois, United States) on histological FFPE sections of 3 μm thickness according to the manufacturer›s instructions. Briefly, the deparaffinisation of the histological section was performed with xylene, then a pretreatment with a guanidinium thiocyanate solution for 10 min at 80° C was performed followed by enzymatic digestion at 37° C for 10 min. After that, tissue sections were incubated with LSI MYCN probe (2p24.1) in the hybridizer HYBrite (Abbott Laboratories, Illinois, United States) for co-denaturation (73° C for 5 min) and hybridization (37° C for 20 h). Post-hybridation washes were performed using 2× SSC buffer with NP40. Tissue sections were stained with DAPI and observed with a fluorescence microscope (Eclipse 80i, Nikon, Tokyo, Japan). Patients gave their consent to perform the proposed diagnostic and therapeutic procedures, and everything necessary to achieve them. The project was approved by the Research Ethics Committee and the Research Review Committee of the Argentinean Pediatric Hospital “Prof. Dr. Juan P. Garrahan”.
Flow cytometry assay
After 24 h of serum starvation, cell lines were collected by enzyme-free cell dissociation buffer (Gibco by Thermo Fisher Scientific, California, United States) and incubated with antigens specific mAbs or isotype control for 30 min on ice. The mAbs used were Lex (4E10, Novus Biologicals, Colorado, United States), SLex (CSLEX1, BD Pharmingen, California, United States), Lea (Abcam, Cambridge, United Kingdom), SLea (KM231, Millipore, Massachusetts, United States), Leb (2-25LE, Abcam, Cambridge, United Kingdom), Ley (F3, Abcam, Cambridge, United Kingdom), PSGL-1 (PL-1, eBioscience by Thermo Fisher Scientific, California, United States), T (Thomsen–Friedenreich Antigen, SPM320, Novus Biologicals, Colorado, United States), Tn (Tn 218, Abcam, Cambridge, United Kingdom), STn (B72.3, Santa Cruz, Texas, United States), Mouse IgG1 Isotype Control (Thermo Fisher Scientific, California, United States), Mouse IgM Isotype Control (Dako, Santa Clara, United States). Cells were washed with phosphate buffered saline (PBS) and incubated with Polyclonal Goat Anti-Mouse Phycoerythrin (PE) labeled anti-mouse immunoglobulins (Dako, Santa Clara, United States) for 30 min on ice. For lectins binding, biotinylated ConA or L-PHA (Vector Laboratories, United States) were incubated for 30 min on ice with fluorescein streptavidin to form a complex. Then, cells were incubated 30 min on ice with the lectin-streptavidin complex. For mAbs or lectins, acquisition was achieved by a FACSCalibur flow cytometer (Becton Dickinson, New Jersey, United States) and analyzed by the FlowJo® software. Data was analyzed as median florescence intensity relativized to isotype control (rMFI). High expression of terminal glycan structures (Lewis and truncated) was defined as greater than 1.5 rMFI, medium: between 1.25 and 1.5 rMFI, and low as lower than 1.25 rMFI.
Selectin binding assay
CHP-212 and SK-N-AS cell lines were collected by enzyme-free cell dissociation buffer and incubated with selectin complexes for 30 min on ice, washed and analyzed using a FACSCalibur (Becton Dickinson, New Jersey, United States) and analyzed by the FlowJo® software. Production of complexes was carried out in PBS buffer + 1 mM Ca2+ + 1 mM Mg2+ with 1 mg/ml of Recombinant Human (E-, L- or P-) Selectin Fc chimera (R&D systems, Minnesota, United States) or Fc control (R&D systems, Minnesota, United States) and 0.5 mg/ml of goat anti-human-IgG-FITC (Abcam, Cambridge, United Kingdom).
Quantitative RT-PCR (qRT-PCR)
Total RNA from cell lines after 24 h of serum starvation (1 × 10⁶ cells) or frozen samples of NB patients, was purified with the PureLink® RNA Mini Kit (Invitrogen, by Thermo Fisher Scientific, California, United States) according to the manufacturer’s protocol. RNA was reverse transcribed with Super Script™ III (Thermo Fisher Scientific, California, United States) according to the manufacturer’s protocol. The concentration and purity of RNA was assessed using a Nanodrop spectrometer (Thermo Fisher Scientific, California, United States). Primers were designed using the Primer3 plus software (http://www.bioinformatics.nl/cgi-bin/primer3plus/primer3plus.cgi) and checked for their specificity by The Basic Local Alignment Search Tool (BLAST). Primers were manufactured by Invitrogen (Invitrogen, by Thermo Fisher Scientific, California, United States) and their sequences are provided in Supplementary Table 1. qRT-PCR was performed using Power SYBR™ Green PCR Master Mix (Thermo Fisher Scientific, California, United States) and StepOne Real-Time PCR System (Applied Biosystems, California, United States). The following thermal cycling conditions were used: 48º C for 30 min, 95º C for 10 min, 40 cycles of 95º C for 15 seconds followed by 60º C for 60 seconds. Each sample was analyzed in triplicate and mean cycle threshold values (Ct) were used for further analysis. Ct values were normalized for hypoxanthine phosphoribosyltransferase 1 (HPRT1) expression levels. Relative quantification (RQ) values were calculated as 2−ΔΔCt. A significant biological result was assumed when a threefold difference between samples values was obtained.
siRNA mediated knockdown
C2GNT1 expression was downmodulated by using siRNA. C2GNT1 and a scramble siRNAs (control) were obtained from Origene (Maryland, United States). C2GNT1 construct is composed by 3 unique 27mer siRNA duplexes (Locus ID 2650), and control siRNA is a Trilencer-27 Universal Scrambled Negative Control. Cells were plated on 60 mm dishes, grown until approximately 80% of confluency and then transfected with C2GNT1 siRNA or control siRNA using Lipofectamine 2000 (Thermo Fisher Scientific, California, United States) following manufacturer’s instructions. 24 h after transfection, cells were collected and plated for adhesion and proliferation assays or 48 h after transfection cells were processed for qRT-PCR.
Tunicamycin (TNM) treatment
Cells were cultured in the absence or in the presence of 150 nM TNM from Streptomyces sp.(Merck KGaA, Darmstadt, Germany) for 24 h, controls were cultured in the presence of an equivalent volume of DMSO [46]. After treatment, presence of SLex, Ley and N-glycan branching was measured by flow cytometry.
Trichostatine A (TSA) treatment
TSA was kindly provided by Dr. Norberto W. Zwirner, Laboratory of Pathophysiology of Innate Immunity, Institute of Experimental Biology and Medicine (IBYME), Argentina. Cells were cultured in the presence of 1 mM TSA for 24 h, controls were cultured in the presence of an equivalent volume of DMSO [47]. After treatment, SLex/ Ley expression and E-, P-selectin binding were measured by flow cytometry.
Cell proliferation assay
Proliferative effect of C2GNT1 silencing was measured on rapidly growing tumor cells using MTS assay (3-(4, 5-dimethylthiazol-2-yl)-5-(3-carboxymethoxyphenyl)-2-(4-sulfophenyl)-2H-tetrazolium; Promega, Madison, United States). Cells were plated in 96-well flat bottom plates at a density of 5 × 10³ cells/well in 200 μl of corresponding medium supplemented with 10% FBS. MTS reagent (20 μl) was added to each well and the plate was incubated at 37° C for 2–4 hours. The absorbance of each well was measured in a microplate reader at 490 nm. The proliferative effect was measured at 24 h, 48 h and 72 h.
Cell adhesion assay
Cell adhesion was measured by a colorimetric method, as previously reported [48]. CHP-212 and SK-N-AS cells, after 48 h of siRNA transfection (C2GNT1 or control) were harvested with an enzyme-free cell dissociation buffer and seeded at a concentration of 4 × 10⁴ cells/well in complete medium in a 96-well plate. After 1–3 h of incubation at 37° C, cells were washed with PBS, and non-adherent cells were removed by aspiration. Adherent cells were stained with 0.5% violet crystal diluted in 20% methanol and rinsed with distilled water. The dye in the stained cells was solubilized by adding 10% methanol 5% acetic acid solution, and the absorbance was measured at 595 nm using a microplate reader. Data was expressed as percentage of the control.
Cell migration assay
After overnight starvation, 3 × 10⁵ CHP-212 cells or 3 × 10³ SK-N-AS cells previously transfected for 48h with siRNA were seeded into the Transwell® inserts with 8 μm pore (Corning, New York, United States) in serum-free medium. The lower chamber was filled with medium containing 10% FBS as chemoattractant. Stationary cells were removed from the upper surface of the membranes with a cotton swab. Cells that migrated to the lower surface were fixed and stained with violet crystal. Migrating cells in five randomly selected fields were counted and normalized to control.
Statistical analysis
Statistical significance was evaluated using Prism 6 statistical software (GraphPad, Inc. California, United States). Results presented in this study are expressed as mean values ± SD. For comparisons between two independent samples, T-test or Mann–Whitney was used. For multiple comparisons between experimental groups ANOVA (followed by Tukey’s multiple comparisons test) was performed. Data correspond of at least three independent experiments. Significant levels were defined as p < 0.05.
Abbreviations
C2GNT1: Core 2 Beta1,6 N-Acetylglucosaminyltransferase; FDA: Food and Drug Administration; FUT: fucosyltransferase; GalNAc: N-Acetylgalactosamine; GalNAcTs: N-Acetylgalactosaminetransferases; GlcNAc: N-Acetylglucosamine; HDACs: histone deacetylases; HPRT1: hypoxanthine phosphoribosyltransferase 1; INRGSS: International Neuroblastoma Risk Group Staging System; Lea: Lewis A; Leb: Lewis B; Lex: Lewis X; Ley: Lewis Y; MYCN: Neuroblastoma MYC Oncogene; NB: Neuroblastoma; PBS: phosphate buffered saline; PE: Phycoerythrin; qRT-PCR: Quantitative RT-PCR; rMFI: relative Median Florescence Intensity; RQ: Relative quantification; Sia: sialic acid; siRNA: Small interfering RNA; SLea: Sialyl Lewis A; SLex: Sialyl Lewis X; ST: sialyltransferase; STn: SialylTn; TNM: Tunicamycin; TSA: Trichostatin A; T: Thomsen–Friedenreich Antigen.
Author contributions
H.A.C., V.I.S. and M.R.G. participated in the conception and design of the experiments, the analysis and interpretation of data and in the process of manuscript writing. Also, H.A.C., M.A, C.A.G., R.A., S.C. and L.G.M. worked in development of methodology and acquisition of data. Review of the manuscript was done by K.M., D.A.F. and F.L.
ACKNOWLEDGMENTS
We would like to thank Drs. I. Gloger, S. Sullivan and N. Zwirner for intellectual support and R. Armando for technical assistance in qRT-PCR.
CONFLICTS OF INTEREST
All authors declare no conflict of interest. V.I. Segatori, M.R. Gabri, and D.F. Alonso are members of the National Council of Scientific and Technical Research (CONICET, Argentina). H.A. Cuello and M. Alberto are research fellows from CONICET, and R. Aschero from. ANPCyT. K. Madauss is a full-time employee from Glaxo Smith Kline.
FUNDING
This work was supported by the National Agency for Scientific and Technological Promotion (ANPCYT, Argentina) and Glaxo Smith Kline (grant PAE-GSK 2014-0010).
REFERENCES
1. Jiang M, Stanke J, Lahti JM. The connections between neural crest development and neuroblastoma. Curr Top Dev Biol. 2011; 94:77–127. https://doi.org/10.1016/B978-0-12-380916-2.00004-8.
2. Cheung NK, Dyer MA. Neuroblastoma: developmental biology, cancer genomics and immunotherapy. Nat Rev Cancer. 2013; 13:397–411. https://doi.org/10.1038/nrc3526.
3. Siegel RL, Miller KD, Jemal A. Cancer Statistics, 2017. CA Cancer J Clin. 2017; 67:7–30. https://doi.org/10.3322/caac.21387.
4. Brodeur GM. Neuroblastoma: biological insights into a clinical enigma. Nat Rev Cancer. 2003; 3:203–16. https://doi.org/10.1038/nrc1014.
5. Zhu S, Lee JS, Guo F, Shin J, Perez-Atayde AR, Kutok JL, Rodig SJ, Neuberg DS, Helman D, Feng H, Stewart RA, Wang W, George RE, et al. Activated ALK collaborates with MYCN in neuroblastoma pathogenesis. Cancer Cell. 2012; 21:362–73. https://doi.org/10.1016/j.ccr.2012.02.010.
6. Monclair T, Brodeur GM, Ambros PF, Brisse HJ, Cecchetto G, Holmes K, Kaneko M, London WB, Matthay KK, Nuchtern JG, von Schweinitz D, Simon T, Cohn SL, et al. The International Neuroblastoma Risk Group (INRG) staging system: an INRG Task Force report. J Clin Oncol. 2009; 27:298–303. https://doi.org/10.1200/JCO.2008.16.6876.
7. Ploessl C, Pan A, Maples KT, Lowe DK. Dinutuximab: An Anti-GD2 Monoclonal Antibody for High-Risk Neuroblastoma. Ann Pharmacother. 2016; 50:416–22. https://doi.org/10.1177/1060028016632013.
8. Xu H, Guo H, Cheung IY, Cheung NK. Antitumor Efficacy of Anti-GD2 IgG1 Is Enhanced by Fc Glyco-Engineering. Cancer Immunol Res. 2016; 4:631–8. https://doi.org/10.1158/2326-6066.CIR-15-0221.
9. Marth JD. A unified vision of the building blocks of life. Nat Cell Biol. 2008; 10:1015–6. https://doi.org/10.1038/ncb0908-1015.
10. Varki A. Biological roles of glycans. Glycobiology. 2017; 27:3–49. https://doi.org/10.1093/glycob/cww086.
11. Kudelka MR, Ju T, Heimburg-Molinaro J, Cummings RD. Simple sugars to complex disease—mucin-type O-glycans in cancer. Adv Cancer Res. 2015; 126:53–135. https://doi.org/10.1016/bs.acr.2014.11.002.
12. Schwarz F, Aebi M. Mechanisms and principles of N-linked protein glycosylation. Curr Opin Struct Biol. 2011; 21: 576–82. https://doi.org/10.1016/j.sbi.2011.08.005.
13. Pinho SS, Reis CA. Glycosylation in cancer: mechanisms and clinical implications. Nat Rev Cancer. 2015; 15:540–55. https://doi.org/10.1038/nrc3982.
14. Stowell SR, Ju T, Cummings RD. Protein glycosylation in cancer. Annu Rev Pathol. 2015; 10:473–510. https://doi.org/10.1146/annurev-pathol-012414-040438.
15. Sarrats A, Saldova R, Pla E, Fort E, Harvey DJ, Struwe WB, de Llorens R, Rudd PM, Peracaula R. Glycosylation of liver acute-phase proteins in pancreatic cancer and chronic pancreatitis. Proteomics Clin Appl. 2010; 4:432–48. https://doi.org/10.1002/prca.200900150.
16. Li X, Wang X, Tan Z, Chen S, Guan F. Role of Glycans in Cancer Cells Undergoing Epithelial-Mesenchymal Transition. Front Oncol. 2016; 6:33. https://doi.org/10.3389/fonc.2016.00033.
17. Natoni A, Macauley MS, O’Dwyer ME. Targeting Selectins and Their Ligands in Cancer. Front Oncol. 2016; 6:93. https://doi.org/10.3389/fonc.2016.00093.
18. Varki A, Kannagi R, Toole BP. Glycosylation Changes in Cancer. In: Varki A, Cummings RD, Esko JD, Freeze HH, Stanley P, Bertozzi CR, Hart GW, Etzler ME, eds. Essentials of Glycobiology. (Cold Spring Harbor (NY). 2009.
19. Greaves M, Maley CC. Clonal evolution in cancer. Nature. 2012; 481:306–13. https://doi.org/10.1038/nature10762.
20. Rini J, Esko J, Varki A. Glycosyltransferases and Glycan-processing Enzymes. In: Varki A, Cummings RD, Esko JD, Freeze HH, Stanley P, Bertozzi CR, Hart GW, Etzler ME, eds. Essentials of Glycobiology. (Cold Spring Harbor (NY). 2009.
21. Julien S, Ivetic A, Grigoriadis A, QiZe D, Burford B, Sproviero D, Picco G, Gillett C, Papp SL, Schaffer L, Tutt A, Taylor-Papadimitriou J, Pinder SE, et al. Selectin ligand sialyl-Lewis x antigen drives metastasis of hormone-dependent breast cancers. Cancer Res. 2011; 71:7683–93. https://doi.org/10.1158/0008-5472.CAN-11-1139.
22. Nakayama T, Watanabe M, Katsumata T, Teramoto T, Kitajima M. Expression of sialyl Lewis(a) as a new prognostic factor for patients with advanced colorectal carcinoma. Cancer. 1995; 75:2051–6.
23. Ho WL, Hsu WM, Huang MC, Kadomatsu K, Nakagawara A. Protein glycosylation in cancers and its potential therapeutic applications in neuroblastoma. J Hematol Oncol. 2016; 9: 100. https://doi.org/10.1186/s13045-016-0334-6.
24. Zhang S, Zhang HS, Cordon-Cardo C, Reuter VE, Singhal AK, Lloyd KO, Livingston PO. Selection of tumor antigens as targets for immune attack using immunohistochemistry: II. Blood group-related antigens. Int J Cancer. 1997; 73:50–6.
25. Ho WL, Chou CH, Jeng YM, Lu MY, Yang YL, Jou ST, Lin DT, Chang HH, Lin KH, Hsu WM, Huang MC. GALNT2 suppresses malignant phenotypes through IGF-1 receptor and predicts favorable prognosis in neuroblastoma. Oncotarget. 2014; 5:12247–59. https://doi.org/10.18632/oncotarget.2627.
26. Ho WL, Che MI, Chou CH, Chang HH, Jeng YM, Hsu WM, Lin KH, Huang MC. B3GNT3 expression suppresses cell migration and invasion and predicts favorable outcomes in neuroblastoma. Cancer Sci. 2013; 104:1600–8. https://doi.org/10.1111/cas.12294.
27. Berois N, Blanc E, Ripoche H, Mergui X, Trajtenberg F, Cantais S, Barrois M, Dessen P, Kagedal B, Benard J, Osinaga E, Raguenez G. ppGalNAc-T13: a new molecular marker of bone marrow involvement in neuroblastoma. Clin Chem. 2006; 52:1701–12. https://doi.org/10.1373/clinchem.2006.067975.
28. Berois N, Gattolliat CH, Barrios E, Capandeguy L, Douc-Rasy S, Valteau-Couanet D, Benard J, Osinaga E. GALNT9 gene expression is a prognostic marker in neuroblastoma patients. Clin Chem. 2013; 59:225–33. https://doi.org/10.1373/clinchem.2012.192328.
29. Inamori K, Gu J, Ohira M, Kawasaki A, Nakamura Y, Nakagawa T, Kondo A, Miyoshi E, Nakagawara A, Taniguchi N. High expression of N-acetylglucosaminyltransferase V in favorable neuroblastomas: Involvement of its effect on apoptosis. FEBS Lett. 2006; 580:627–32. https://doi.org/10.1016/j.febslet.2005.12.089.
30. Tsuji S. Molecular cloning and functional analysis of sialyltransferases. J Biochem. 1996; 120:1–13.
31. Recchi MA, Hebbar M, Hornez L, Harduin-Lepers A, Peyrat JP, Delannoy P. Multiplex reverse transcription polymerase chain reaction assessment of sialyltransferase expression in human breast cancer. Cancer Res. 1998; 58:4066–70.
32. Yan X, Lin Y, Liu S, Aziz F, Yan Q. Fucosyltransferase IV (FUT4) as an effective biomarker for the diagnosis of breast cancer. Biomed Pharmacother. 2015; 70:299–304. https://doi.org/10.1016/j.biopha.2014.12.048.
33. Petretti T, Kemmner W, Schulze B, Schlag PM. Altered mRNA expression of glycosyltransferases in human colorectal carcinomas and liver metastases. Gut. 2000; 46:359–66.
34. de Vries T, Knegtel RM, Holmes EH, Macher BA. Fucosyltransferases: structure/function studies. Glycobiology. 2001; 11:119R–128R.
35. Buffone A Jr, Mondal N, Gupta R, McHugh KP, Lau JT, Neelamegham S. Silencing alpha1,3-fucosyltransferases in human leukocytes reveals a role for FUT9 enzyme during E-selectin-mediated cell adhesion. J Biol Chem. 2013; 288:1620–33. https://doi.org/10.1074/jbc.M112.400929.
36. Weninger W, Ulfman LH, Cheng G, Souchkova N, Quackenbush EJ, Lowe JB, von Andrian UH. Specialized contributions by alpha(1,3)-fucosyltransferase-IV and FucT-VII during leukocyte rolling in dermal microvessels. Immunity. 2000; 12:665–76.
37. Mitoma J, Petryniak B, Hiraoka N, Yeh JC, Lowe JB, Fukuda M. Extended core 1 and core 2 branched O-glycans differentially modulate sialyl Lewis X-type L-selectin ligand activity. J Biol Chem. 2003; 278:9953–61. https://doi.org/10.1074/jbc.M212756200.
38. St Hill CA, Baharo-Hassan D, Farooqui M. C2-O-sLeX glycoproteins are E-selectin ligands that regulate invasion of human colon and hepatic carcinoma cells. PLoS One. 2011; 6: e16281. https://doi.org/10.1371/journal.pone.0016281.
39. Stone JP, Wagner DD. P-selectin mediates adhesion of platelets to neuroblastoma and small cell lung cancer. J Clin Invest. 1993; 92:804–13. https://doi.org/10.1172/JCI116654.
40. He S, Liu Z, Oh DY, Thiele CJ. MYCN and the epigenome. Front Oncol. 2013; 3:1. https://doi.org/10.3389/fonc.2013.00001.
41. Li Y, Seto E. HDACs and HDAC Inhibitors in Cancer Development and Therapy. Cold Spring Harb Perspect Med. 2016; 6. https://doi.org/10.1101/cshperspect.a026831.
42. Keshelava N, Davicioni E, Wan Z, Ji L, Sposto R, Triche TJ, Reynolds CP. Histone deacetylase 1 gene expression and sensitization of multidrug-resistant neuroblastoma cell lines to cytotoxic agents by depsipeptide. J Natl Cancer Inst. 2007; 99:1107–19. https://doi.org/10.1093/jnci/djm044.
43. Oehme I, Deubzer HE, Wegener D, Pickert D, Linke JP, Hero B, Kopp-Schneider A, Westermann F, Ulrich SM, von Deimling A, Fischer M, Witt O. Histone deacetylase 8 in neuroblastoma tumorigenesis. Clin Cancer Res. 2009; 15:91–9. https://doi.org/10.1158/1078-0432.CCR-08-0684.
44. Walton JD, Kattan DR, Thomas SK, Spengler BA, Guo HF, Biedler JL, Cheung NK, Ross RA. Characteristics of stem cells from human neuroblastoma cell lines and in tumors. Neoplasia. 2004; 6:838–45. https://doi.org/10.1593/neo.04310.
45. Thiele CJ. Neuroblastoma: In (Ed.) Masters, J. Human Cell Culture Lancaster, UK: Kluwer Academic Publishers. 1999; 1:21–53.
46. Contessa JN, Bhojani MS, Freeze HH, Rehemtulla A, Lawrence TS. Inhibition of N-linked glycosylation disrupts receptor tyrosine kinase signaling in tumor cells. Cancer Res. 2008; 68:3803–9. https://doi.org/10.1158/0008-5472.CAN-07-6389.
47. Rossi LE, Avila DE, Spallanzani RG, Ziblat A, Fuertes MB, Lapyckyj L, Croci DO, Rabinovich GA, Domaica CI, Zwirner NW. Histone deacetylase inhibitors impair NK cell viability and effector functions through inhibition of activation and receptor expression. J Leukoc Biol. 2012; 91:321–31. https://doi.org/10.1189/jlb.0711339.
48. De Lorenzo MS, Lorenzano Menna PL, Alonso DF, Gomez DE. In vitro activity of a Solanum tuberosum extract against mammary carcinoma cells. Planta Med. 2001; 67:164–6. https://doi.org/10.1055/s-2001-11502.