
INTRODUCTION
Acute myeloid leukemia (AML) is the second most common pediatric leukemia with poor outcomes indicated by 5-year survival rates of 50-60%[1, 2]. Cytarabine is one of the most effective chemotherapeutic agents used in AML treatment and has contributed to improved remission rates and overall survival.[3] Although most patients achieve remission after intensive cytarabine-containing induction therapy, a significant proportion of patients experience relapse. Development of resistance to anti-leukemic agents, such as cytarabine, is one of the biggest challenges in achieving successful treatment outcome in AML. Thus, there is a need to better understand the factors that impact the chemosensitivity of leukemic cells. Previous efforts to identify single nucleotide polymorphisms (SNPs) associated with cytarabine resistance in AML have focused on SNPs within candidate pharmacokinetic genes involved in cytarabine metabolism and transport, as well as a few (LCLs) genome-wide efforts studies using of lymphoblastoid cell lines (LCLs)[4–12]. One of the limitations of LCLs used in GWAS studies is that these were derived from healthy individuals that are available through the International HapMap project.[9–12] Given that LCLs do not represent leukemic cells, these cell lines are not the best models to study leukemic cell chemosensitivity to cytarabine. Other efforts have focused on identifying differences in gene expression among AML cell lines with varying sensitivity to cytarabine.[13–19] To the best of our knowledge, no GWAS has so far been performed to identify SNPs that associate with the sensitivity of AML patients’ diagnostic leukemic cells to cytarabine in vitro. The difficulty of obtaining bone marrow samples and the in vitro cytarabine chemosensitivity in primary AML cells is probably the reason for the lack of such studies, especially in pediatric patients.
RESULTS
Patient demographics
The current study included 65 patients enrolled in the multi-center St. Jude AML02 clinical trial with specimens available for determination of in vitro leukemic cell cytarabine chemosensitivity. Of these 65 patients, 50 (including 40 white patients) had leukemic cells with in vitro cytarabine with IC50 < 5 ng/μL and 15 (including 10 white patients) had leukemic cells that were resistant to cytarabine (IC50 not achieved). The baseline demographics of the patients included in the study are summarized in Table 1. There was no significant difference in age, gender and race between the patients classified as having leukemic cells sensitive or resistant to cytarabine. However, as expected, patients with high-risk group features were more abundant in cytarabine resistant cases. Given that our overall sample size was limited and most (77%) of the participants were genetically white and had a similar proportion of resistant vs. sensitive cases as the whole cohort, we restricted our analysis to the 50 genetically white patients.
Table 1: Characteristics of patients included in the present study
Characteristic |
All patients* (n=65) |
Caucasians (n=50) |
||||
|---|---|---|---|---|---|---|
Resistant |
Sensitive |
P-value |
Resistant |
Sensitive |
P-value |
|
Age in years (mean±SD) |
11.4 ± 5.2 |
8.8 ± 6.3 |
0.159 |
10.9 ± 4.0 |
8.6 ± 6.5 |
0.295 |
Female sex |
8 (53.3) |
26 (52) |
0.928 |
5 (50) |
21 (52.5) |
0.887 |
Race |
|
|
0.282 |
|
|
- |
Caucasian |
10 (66.7) |
40 (80) |
|
- |
- |
|
Black |
5 (33.3) |
10 (20) |
|
- |
- |
|
Initial risk group |
|
|
0.002 |
|
|
0.002 |
Low |
2 (13.3) |
17 (34) |
|
0 (0) |
14 (35) |
|
Standard |
3 (20) |
24 (48) |
|
3 (30) |
20 (50) |
|
High |
10 (66.7) |
9 (18) |
|
7 (70) |
6 (15) |
|
Values are presented as number (percentage) unless otherwise noted.
*All patients comprise of 50 Caucasians and 15 Blacks.
Genome-wide association analysis
After rigorous quality control (QC) as described in the methods below, we evaluated 1,317,106 variants in 50 white patients. With this limited sample size, none of the SNPs reached genome-wide significance at the Bonferroni threshold for the familywise error rate (P<5 × 10⁻⁸; Figure 1). Nevertheless, as our study likely has the largest feasible sample size in this rare disease setting, we selected 113 SNPs with p < 0.0001 to evaluate for further scientific evidence of involvement in cytarabine response (Table 2).
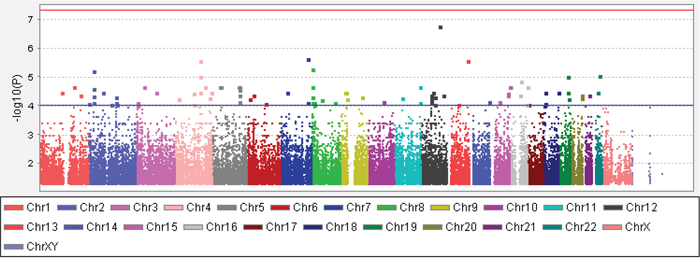
Figure 1: The Manhattan plot showing results of the genome-wide SNP association analysis with in vitro cytarabine IC50 of diagnostic leukemic cells within white pediatric AML patients. The y-axis is – log10 the association p-value for the SNPs and the x-axis shows the chromosomal locations of the SNPs. The red line is the genome-wide significance threshold (P=5x10⁻⁸) and the blue line is the suggestive threshold (P=1x10⁻⁴).
Table 2: List of 113 SNPs with suggestive level of association (P<1.0x10⁻⁴) with in vitro cytarabine chemo-sensitivity of diagnostic leukemic cells from AML patients enrolled on multicenter St. Jude AML02 clinical trial
SNP |
Chr |
Location relative to nearest gene |
Gene Name |
P-value |
Direction of association with minor allele |
|---|---|---|---|---|---|
rs17030128 |
1 |
37kb 5' of CTTNBP2NL |
CTTNBP2 N-terminal like |
0.00004 |
Resistance |
rs78755594 |
1 |
509kb 5' of LOC642587 |
MIR205 host gene |
0.00004 |
Resistance |
rs12730413 |
1 |
Within TNFSF4 |
Tumor necrosis factor superfamily, member 4 |
0.00002 |
Resistance |
rs11123318 |
2 |
Within DPP10 |
Dipeptidyl peptidase like 10 |
0.00009 |
Resistance |
rs2384234 |
2 |
Within DTNB |
Dystrobrevin beta |
0.00001 |
Resistance |
rs12472283 |
2 |
Within DTNB |
Dystrobrevin beta |
0.00003 |
Resistance |
rs13025966 |
2 |
Within DTNB |
Dystrobrevin beta |
0.00003 |
Resistance |
rs17745923 |
2 |
Within DTNB |
Dystrobrevin beta |
0.00003 |
Resistance |
rs34104763 |
2 |
Within DTNB |
Dystrobrevin beta |
0.00005 |
Resistance |
rs34736805 |
2 |
Within DTNB |
Dystrobrevin beta |
0.00005 |
Resistance |
rs35921400 |
2 |
Within DTNB |
Dystrobrevin beta |
0.00008 |
Resistance |
rs1869686 |
2 |
16kb 5' of HNMT |
Histamine N-methyltransferase |
0.00008 |
Resistance |
rs2241028 |
2 |
Within HTRA2 |
HtrA serine peptidase 2 |
0.00004 |
Resistance |
rs1437352 |
2 |
Within LRP1B |
Low density lipoprotein receptor related protein 1B |
0.00005 |
Sensitivity |
rs16847711 |
2 |
Within LRP1B |
Low density lipoprotein receptor related protein 1B |
0.00009 |
Resistance |
rs7565278 |
2 |
5' of TGFA and 26kb 3' of ADD2 |
Transforming growth factor alpha and adducin 2 |
0.00004 |
Resistance |
rs12714411 |
2 |
60kb 3' of TMEM18 |
Transmembrane protein 18 |
0.00008 |
Resistance |
rs16850901 |
3 |
215kb 5' of ALCAM |
Activated leukocyte cell adhesion molecule |
0.00004 |
Resistance |
rs11719029 |
3 |
17kb 5' of CX3CR1 |
C-X3-C motif chemokine receptor 1 |
0.00002 |
Resistance |
rs11927011 |
3 |
723kb 5' of MIR4790 |
MicroRNA 4790 |
0.00008 |
Resistance |
rs6773395 |
3 |
725kb 5' of MIR4790 |
MicroRNA 4790 |
0.00008 |
Resistance |
rs9835716 |
3 |
735kb 5' of MIR4790 |
MicroRNA 4790 |
0.00010 |
Resistance |
rs11934226 |
4 |
970kb 3' of C4orf33 |
Chromosome 4 open reading frame 33 |
0.00000 |
Resistance |
rs7664923 |
4 |
958kb 3' of C4orf33 |
Chromosome 4 open reading frame 33 |
0.00000 |
Resistance |
rs111261849 |
4 |
973kb 3' of C4orf33 |
Chromosome 4 open reading frame 33 |
0.00001 |
Resistance |
rs62309493 |
4 |
460kb 3' of C4orf33 |
Chromosome 4 open reading frame 33 |
0.00004 |
Resistance |
rs4253418 |
4 |
Within F11 |
Coagulation factor XI |
0.00004 |
Resistance |
rs79827604 |
4 |
9.6kb 3' of PRSS48 |
Protease, serine 48 |
0.00002 |
Resistance |
rs614158 |
4 |
4.1kb 5' of SLIT2 |
Slit guidance ligand 2 |
0.00006 |
Resistance |
rs640501 |
4 |
5.4kb 5' of SLIT2 |
Slit guidance ligand 2 |
0.00006 |
Resistance |
rs9991282 |
4 |
Within UNC5C |
Unc-5 netrin receptor C |
0.00004 |
Resistance |
rs73838827 |
4 |
Within UNC5C |
Unc-5 netrin receptor C |
0.00009 |
Resistance |
rs2062416 |
4 |
60kb 3' of VEGFC |
Vascular endothelial growth factor C |
0.00005 |
Resistance |
rs62370525 |
5 |
232kb 3' of FBXO4 |
F-box protein 4 |
0.00002 |
Resistance |
rs34115593 |
5 |
Within FGF1 |
Fibroblast growth factor 1 |
0.00002 |
Resistance |
rs71587226 |
5 |
Within FGF1 |
Fibroblast growth factor 1 |
0.00003 |
Resistance |
rs6884797 |
5 |
Within FGF1 |
Fibroblast growth factor 1 |
0.00004 |
Resistance |
rs17574650 |
5 |
Within GHR |
Growth hormone receptor |
0.00002 |
Resistance |
rs9324859 |
5 |
3.1kb 5' of LOC729080 |
Glycine cleavage system protein H (aminomethyl carrier) pseudogene |
0.00007 |
Resistance |
rs17797667 |
5 |
25kb 3' of NPY6R |
neuropeptide Y receptor Y6 (pseudogene) |
0.00002 |
Resistance |
rs4645358 |
5 |
2.1kb 5' of PCDH1 |
protocadherin 1 |
0.00007 |
Resistance |
rs72923772 |
6 |
277kb 5' of MIR4643 |
microRNA 4643 |
0.00008 |
Resistance |
rs9368620 |
6 |
NEDD9 |
neural precursor cell expressed |
0.00006 |
Resistance |
rs356973 |
6 |
ZNRD1-AS1 |
Zinc Ribbon Domain Containing 1 Antisense, Pseudogene |
0.00004 |
Resistance |
rs17798136 |
7 |
39kb 3' of BBS9 |
Bardet-Biedl syndrome 9 |
0.00004 |
Resistance |
rs2174362 |
7 |
5.9kb 5' of ZC3HAV1 |
zinc finger CCCH-type containing, antiviral 1 |
0.00000 |
Resistance |
rs76651618 |
7 |
10kb 5' of ZC3HAV1 |
zinc finger CCCH-type containing, antiviral 1 |
0.00000 |
Resistance |
rs59520763 |
7 |
2.3kb 5' of ZC3HAV1 |
zinc finger CCCH-type containing, antiviral 1 |
0.00008 |
Resistance |
rs270066 |
8 |
CSMD1 |
CUB and Sushi multiple domains 1 |
0.00001 |
Resistance |
rs4242513 |
8 |
CSMD1 |
CUB and Sushi multiple domains 1 |
0.00002 |
Resistance |
rs4493928 |
8 |
CSMD1 |
CUB and Sushi multiple domains 1 |
0.00002 |
Resistance |
rs55824821 |
8 |
CSMD1 |
CUB and Sushi multiple domains 1 |
0.00005 |
Resistance |
rs12542120 |
8 |
CSMD1 |
CUB and Sushi multiple domains 1 |
0.00008 |
Resistance |
rs897266 |
8 |
DLC1 |
DLC1 Rho GTPase activating protein |
0.00008 |
Sensitivity |
rs7018361 |
8 |
DLC1 |
DLC1 Rho GTPase activating protein |
0.00009 |
Sensitivity |
rs16939055 |
8 |
6.2kb 3' of SNAI2 |
snail family transcriptional repressor 2 |
0.00006 |
Resistance |
rs13270346 |
8 |
TRPS1 |
transcriptional repressor GATA binding 1 |
0.00008 |
Resistance |
rs199615944 |
9 |
1.8kb 5' of C9orf144 |
Family With Sequence Similarity 205 Member B, Pseudogene |
0.00006 |
Resistance |
rs72717694 |
9 |
45kb 5' of MIR873 |
microRNA 873 |
0.00004 |
Resistance |
rs16936272 |
9 |
506kb 3' of TMEM38B |
transmembrane protein 38B |
0.00005 |
Resistance |
rs6477500 |
9 |
502kb 3' of TMEM38B |
transmembrane protein 38B |
0.00005 |
Resistance |
rs77798124 |
9 |
500kb 3' of TMEM38B |
transmembrane protein 38B |
0.00005 |
Resistance |
rs7854098 |
9 |
502kb 3' of TMEM38B |
transmembrane protein 38B |
0.00005 |
Resistance |
rs10966448 |
9 |
909kb 3' of TUSC1 |
tumor suppressor candidate 1 |
0.00004 |
Resistance |
rs884889 |
10 |
1.6kb 3' of ZMIZ1 |
Zinc Finger MIZ-Type Containing 1 |
0.00007 |
Resistance |
rs12364729 |
11 |
30kb 5' of LOC100507205 |
uncharacterized LOC100507205 |
0.00005 |
Resistance |
rs77600532 |
11 |
OPCML |
opioid binding protein/cell adhesion molecule like |
0.00002 |
Resistance |
rs545375 |
11 |
OPCML |
opioid binding protein/cell adhesion molecule like |
0.00008 |
Resistance |
rs303825 |
12 |
1.7kb 3' of FIGNL2 |
fidgetin like 2 |
0.00006 |
Resistance |
rs11067996 |
12 |
72kb 5' of MED13L |
Mediator Complex Subunit 13 Like |
0.00004 |
Resistance |
rs721947 |
12 |
93kb 3' of NEDD1 |
neural precursor cell expressed |
0.00000 |
Resistance |
rs303815 |
12 |
SCN8A |
sodium voltage-gated channel alpha subunit 8 |
0.00004 |
Resistance |
rs303817 |
12 |
SCN8A |
sodium voltage-gated channel alpha subunit 8 |
0.00004 |
Resistance |
rs60637 |
12 |
SCN8A |
sodium voltage-gated channel alpha subunit 8 |
0.00004 |
Resistance |
rs747283 |
12 |
SCN8A |
sodium voltage-gated channel alpha subunit 8 |
0.00007 |
Resistance |
rs1905248 |
12 |
SCN8A |
sodium voltage-gated channel alpha subunit 8 |
0.00008 |
Resistance |
rs76411845 |
12 |
TBC1D30 |
TBC1 domain family member 30 |
0.00004 |
Resistance |
rs1112973 |
12 |
633kb 3' of TRHDE |
thyrotropin releasing hormone degrading enzyme |
0.00005 |
Sensitivity |
rs7301109 |
12 |
635kb 3' of TRHDE |
thyrotropin releasing hormone degrading enzyme |
0.00009 |
Sensitivity |
rs7996008 |
13 |
63kb 3' of PCDH17 |
protocadherin 17 |
0.00009 |
Resistance |
rs72632692 |
13 |
1Mb 5' of SLC10A2 |
solute carrier family 10 member 2 |
0.00000 |
Resistance |
rs58540528 |
14 |
33kb 3' of DLK1 |
delta like non-canonical Notch ligand 1 |
0.00007 |
Resistance |
rs75400242 |
15 |
147kb 3' of FAM169B/360 kb upstream of IGF1R |
Insulin like growth factor receptor 1 |
0.00002 |
Resistance |
rs1974961 |
15 |
SHC4 |
SHC adaptor protein 4 |
0.00007 |
Resistance |
rs62011577 |
15 |
SLCO3A1 |
solute carrier organic anion transporter family member 3A1 |
0.00004 |
Resistance |
rs7182304 |
15 |
SLCO3A1 |
solute carrier organic anion transporter family member 3A2 |
0.00004 |
Resistance |
rs9889220 |
16 |
3.2kb 3' of ADAD2 |
adenosine deaminase domain containing 2 |
0.00009 |
Resistance |
rs1376041 |
16 |
GPR56 |
G Protein-Coupled Receptor 56 |
0.00001 |
Resistance |
rs8051448 |
16 |
JPH3 |
junctophilin 3 |
0.00002 |
Resistance |
rs9922685 |
16 |
SRL |
sarcalumenin |
0.00002 |
Resistance |
rs7203855 |
16 |
72kb 5' of ZNF423 |
zinc finger protein 423 |
0.00004 |
Resistance |
rs9911336 |
17 |
SLC43A2 |
solute carrier family 43 member 2 |
0.00009 |
Resistance |
rs9967269 |
18 |
DLGAP1 |
DLG associated protein 1 |
0.00010 |
Sensitivity |
rs34381217 |
18 |
852kb 3' of GALR1 |
galanin receptor 1 |
0.00004 |
Resistance |
rs4796870 |
18 |
169kb 3' of VAPA |
VAMP associated protein A |
0.00004 |
Resistance |
rs9957328 |
18 |
163kb 3' of VAPA |
VAMP associated protein A |
0.00008 |
Resistance |
rs2968180 |
19 |
BCAM |
basal cell adhesion molecule |
0.00001 |
Resistance |
rs7249750 |
19 |
BCAM |
basal cell adhesion molecule |
0.00004 |
Resistance |
rs4801739 |
19 |
BSPH1 |
binder of sperm protein log 1 |
0.00006 |
Resistance |
rs10408993 |
19 |
1.8kb 3' of CBLC |
Cbl proto-oncogene C |
0.00004 |
Resistance |
rs78253907 |
19 |
CBLC |
Cbl proto-oncogene C |
0.00004 |
Resistance |
rs4925251 |
20 |
CDH4 |
cadherin 4 |
0.00004 |
Resistance |
rs6142655 |
20 |
CDH4 |
cadherin 4 |
0.00004 |
Resistance |
rs6142792 |
20 |
CDH4 |
cadherin 4 |
0.00004 |
Resistance |
rs62201785 |
20 |
CDH4 |
cadherin 4 |
0.00004 |
Resistance |
rs67283024 |
20 |
CDH4 |
cadherin 4 |
0.00004 |
Resistance |
rs4925252 |
20 |
CDH4 |
cadherin 4 |
0.00005 |
Resistance |
rs34517760 |
21 |
47kb 5' of SOD1 |
superoxide dismutase 1, soluble |
0.00004 |
Resistance |
rs56837868 |
22 |
495kb 3' of MN1 |
Meningioma 1 proto-oncogene (Transcriptional Regulator) |
0.00004 |
Resistance |
rs2072712 |
22 |
NCF4 |
neutrophil cytosolic factor 4 |
0.00001 |
Resistance |
rs34072125 |
22 |
1.7kb 3' of NCF4 |
neutrophil cytosolic factor 4 |
0.00001 |
Resistance |
rs5995360 |
22 |
NCF4 |
neutrophil cytosolic factor 4 |
0.00001 |
Resistance |
rs6000462 |
22 |
287bp 3' of NCF4 |
neutrophil cytosolic factor 4 |
0.00001 |
Resistance |
Abreviations: Chr: chromosome; SNP: Single nucleotide polymorphism.
The top GWAS SNP associated with cytarabine resistance is rs721947 (P=1.77x10⁻⁷). It is located on chromosome 12 downstream of NEDD1 and co-localized within a long intergenic non-coding RNA (LincRNA) region. A few other potentially interesting SNPs localized within or close to the genes of potential relevance in myeloid malignancies. A synonymous SNP, rs1376041 G>A (P=1.42x10⁻⁵), is located within a conserved region close to exon/intron splice junction within the G protein-coupled receptor 56 (GPR56) gene. Presence of the minor allele A for rs1376041 was associated with cytarabine resistance. Our results on this SNP are very exciting given that GPR56 contributes to AML development and its expression has been associated with inferior outcome in AML.[18, 20] rs75400242 G>A (P=2.1x10⁻⁵) SNP is located in a region upstream of IGF1R (Insulin like growth factor receptor) a gene expressed in human leukemia cell lines with pathological significance in AML [21–23]. IGF1R is among one of the significantly phosphorylated receptor tyrosine kinase in AML that has been associated with activation of PI3K/AKT signaling and thus cell growth and survival in AML [23].
rs56837868 G>A (P=3.56x10⁻⁵) is located in a LincRNA ENSG00000233574 and is roughly 495 kb downstream of the transcriptional co-activator Meningioma1 (MN1) proto-oncogene. MN1 overexpression has been reported to be an important step in the development of inv(16) AML, and is predictive of poor outcome in AML patients with normal cytogenetics.[24, 25] An intronic SNP, rs545375 A>G (P=7.67x10⁻⁵), in opioid binding protein/cell adhesion molecule like (OPCML) occurs in high LD (r2=0.93, D’=1) with rs540923, which is an eQTL for Homeobox A10 (HOXA10), a well-known myeloid leukemia gene. rs7565278 is present around 26kb 3’ of the adducin 2 beta (ADD2) gene and approximately 85kb 5’ of the transforming growth factor alpha (TGFA) gene, which is expressed in neoplastic myeloblasts.
Several SNPs were located in or near cell adhesion genes (ALCAM, BCAM, CDH4, NEDD9, OCML, PCDH1 and PCDH17) and genes involved death receptor signaling pathways (HTRA2 and ZC3HAV1a PARP family member). SNPs with in or close to other biologically interesting genes included: CXC3R1, a chemokine receptor which is expressed at higher levels in AML [26]; DLK1, a member of the NOTCH signally pathway with a potentially oncogenic role in myeloid dysplastic syndrome [27], a disease that frequently progresses into AML; VEGFC (vascular endothelial growth factor C), for which higher expression has been previously associated with chemo-resistance and adverse prognosis in AML [28].
Expression quantitative trait loci (eQTL) analysis for differentially expressed genes
We then evaluated the association of the expression of the genes using 578 unique microarray probe sets located within 500kb of the 113 SNPs identified in the GWAS analysis above. Thirty-eight probes representing 38 unique genes showed significant differential expression between the 10 cytarabine-resistant cases and the 40 cytarabine-sensitive cases (p < 0.05; Supplementary Table 1). Next, we determined cis-eQTL associations between expression levels of the 38 genes with differential expression between sensitive and resistant cell lines and the 113 identified SNPs. We identified 19 SNP-gene pairs among 13 unique SNPs and 12 unique genes with a concordant triad of associations (Table 3): SNP genotype with cytarabine sensitivity (p < 0.0001), mRNA expression with cytarabine sensitivity (p < 0.05), and SNP genotype with mRNA expression (p < 0.1). Five SNP-gene pairs were informatively redundant due to linkage among SNPs. Figures 2A-2C provides heat-maps illustrating the genotype distribution of the 13 SNPs between cytarabine sensitive and resistant leukemia cells as well expression levels of the 12 genes between cytarabine sensitive and resistant leukemia cells.
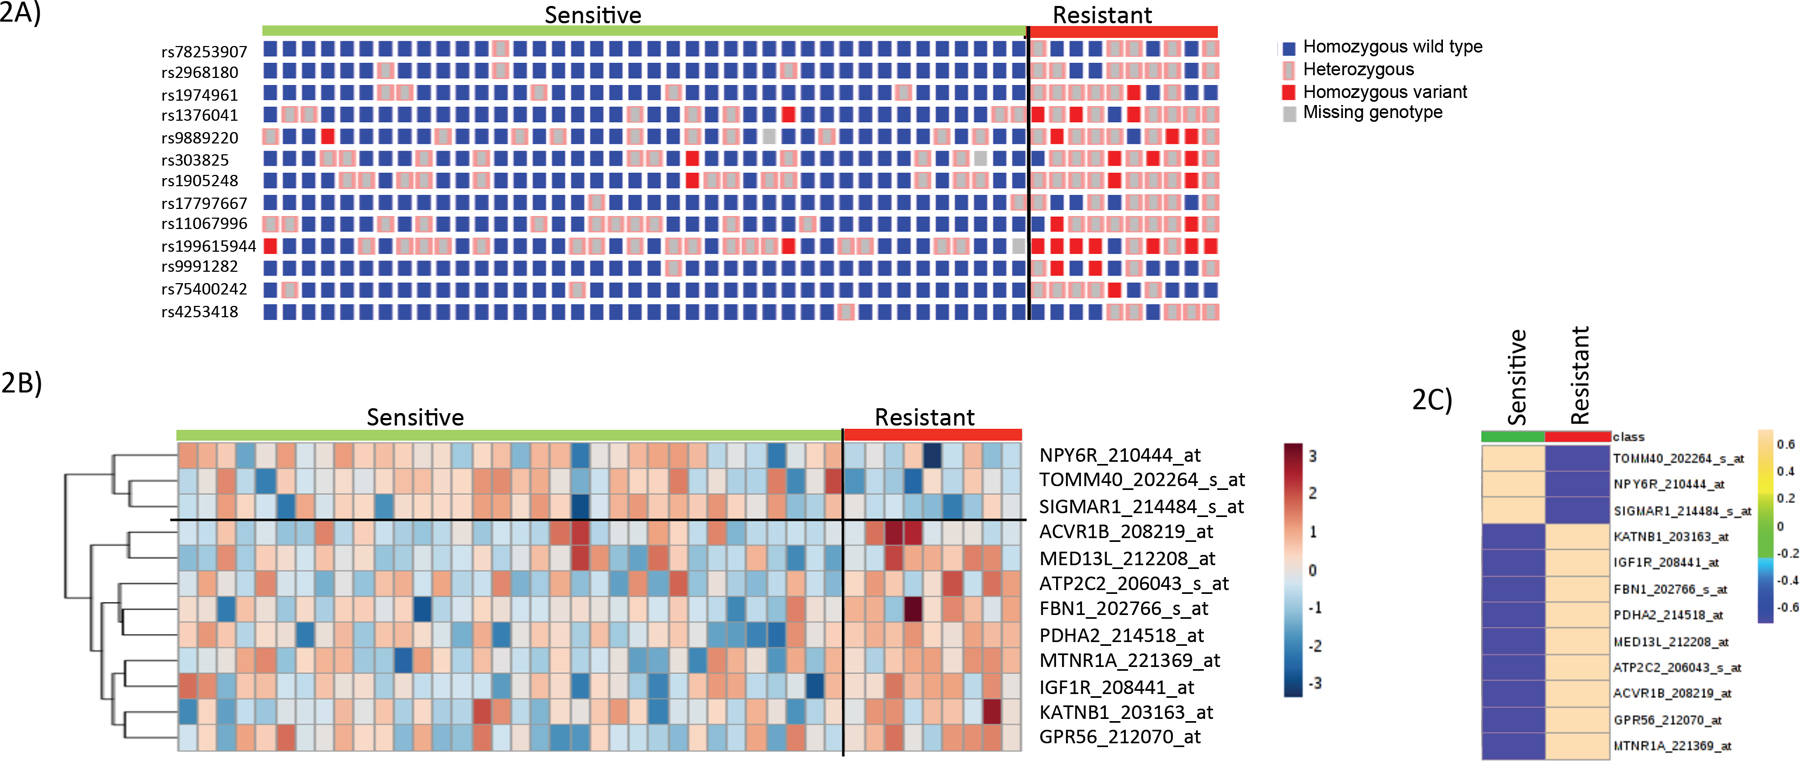
Figure 2: SNP-genotype and gene-expression heat-map in cytarabine sensitive and resistant cases. (A) Genotype heat-map for 13 unique SNPs between cytarabine sensitive and resistant cases.. (B) Gene-expression heat-map of 12 genes showing expression differences between cytarabine sensitive and resistant cases. (C) Average gene-expression of 12 genes between cytarabine sensitive and resistant cases.
Table 3: List of candidate SNP-gene pairs that passed all the three criteria -i) SNP associated with cytarabine in vitro sensitivity ii) gene within 500+/- of SNP was differentially expressed in resistant vs. sensitive cases and iii) SNP is associated with gene expression
SNP |
Probe ID |
Gene Symbol |
SNP-gene expression (cis-eQTL) P-value |
Minor Allele association direction with gene-expression |
Gene-expression vs. cytarabine in vitro sensitivity (P-value) |
Gene-expression association direction in Resistant Cells |
SNP vs. cytarabine in vitro Sensitivity P-value |
Minor allele association direction with cytarabine in vitro sensitivity |
|---|---|---|---|---|---|---|---|---|
rs78253907 |
202264_s_at |
TOMM40 |
0.023 |
Low |
0.022 |
Low |
0.0000356 |
Resistant |
rs2968180 |
202264_s_at |
TOMM40 |
0.010 |
Low |
0.022 |
Low |
0.0000099 |
Resistant |
rs1974961 |
202766_s_at |
FBN1 |
0.046 |
High |
0.006 |
High |
0.0000749 |
Resistant |
rs1376041 |
203163_at |
KATNB1 |
0.049 |
High |
0.046 |
High |
0.0000142 |
Resistant |
rs9889220 |
206043_s_at |
ATP2C2 |
0.040 |
High |
0.034 |
High |
0.0000899 |
Resistant |
rs303825 |
208219_at |
ACVR1B |
0.019 |
High |
0.029 |
High |
0.0000551 |
Resistant |
rs1905248 |
208219_at |
ACVR1B |
0.009 |
High |
0.029 |
High |
0.0000767 |
Resistant |
rs17797667 |
210444_at |
NPY6R |
0.016 |
Low |
0.034 |
Low |
0.000022 |
Resistant |
rs1376041 |
212070_at |
GPR56 |
0.022 |
High |
0.036 |
High |
0.0000142 |
Resistant |
rs11067996 |
212208_at |
MED13L |
0.033 |
High |
0.014 |
High |
0.0000442 |
Resistant |
rs199615944 |
214484_s_at |
SIGMAR1 |
0.040 |
Low |
0.006 |
Low |
0.0000558 |
Resistant |
rs9991282 |
214518_at |
PDHA2 |
0.023 |
High |
0.003 |
High |
0.0000374 |
Resistant |
rs75400242 |
rs208441_at |
IGF1R |
0.062 |
High |
0.031 |
High |
0.0000219 |
Resistant |
rs4253418 |
221369_at |
MTNR1A |
0.031 |
High |
0.026 |
High |
0.0000356 |
Resistant |
rs78253907 within TOMM40 occurs in LD (r2=1) with rs10408993 and rs7249750rs303825 in ACVR1B occurs in LD (r2 =1) with rs303815, rs60637 and rs303817.
Guided by the results above and existing evidence from literature on genes with relevance in AML, we further selected GPR56 and IGF1R for further in vitro validation of the impact on cytarabine resistance in AML cell lines.
rs1376041-GPR56
GPR56 has been reported previously to play a role in leukemogenesis [20]and has been recently identified to be part of a 17-gene leukemia stem cell signature, LSC17.[29] The GPR56 SNP rs1376041 G>A minor allele A was associated with cytarabine resistance (P=1.42x10⁻⁵, Figure 3A); greater GPR56 mRNA expression levels in AML patients’ diagnostic leukemic cells were associated with resistance to cytarabine (P=0.036, Figure 3B) and consistent with these, presence of rs1376041 minor allele A was associated with greater GPR56 mRNA expression in leukemic cells (P=0.022, Figure 3C). Other genes in the flanking region within 500kb of the GPR56 SNP include other G protein-coupled receptors, namely GPR97 and GPR114 (Figure 3D). In addition to the ciseQTL association of rs1376041 with GPR56 expression, a significant association was also observed with the neighboring gene KATNB1 (Table 3). We further investigated the impact of siRNA mediated transient knockdown of GPR56 on cellular sensitivity to cytarabine. siRNA mediated knockdown resulted in a significant reduction in GPR56 mRNA in both THP1 and K562 cell lines (P<0.0005, Figure 4A). GPR56 knockdown resulted in significant increase in apoptosis as shown by increase in Annexin V assay (P<0.01, Figure 4B and 4C) and reduction in cell viability (P<0.05, Figure 4D and 4E) in response to cytarabine at 5μM and 200μM of cytarabine in both the cell lines.
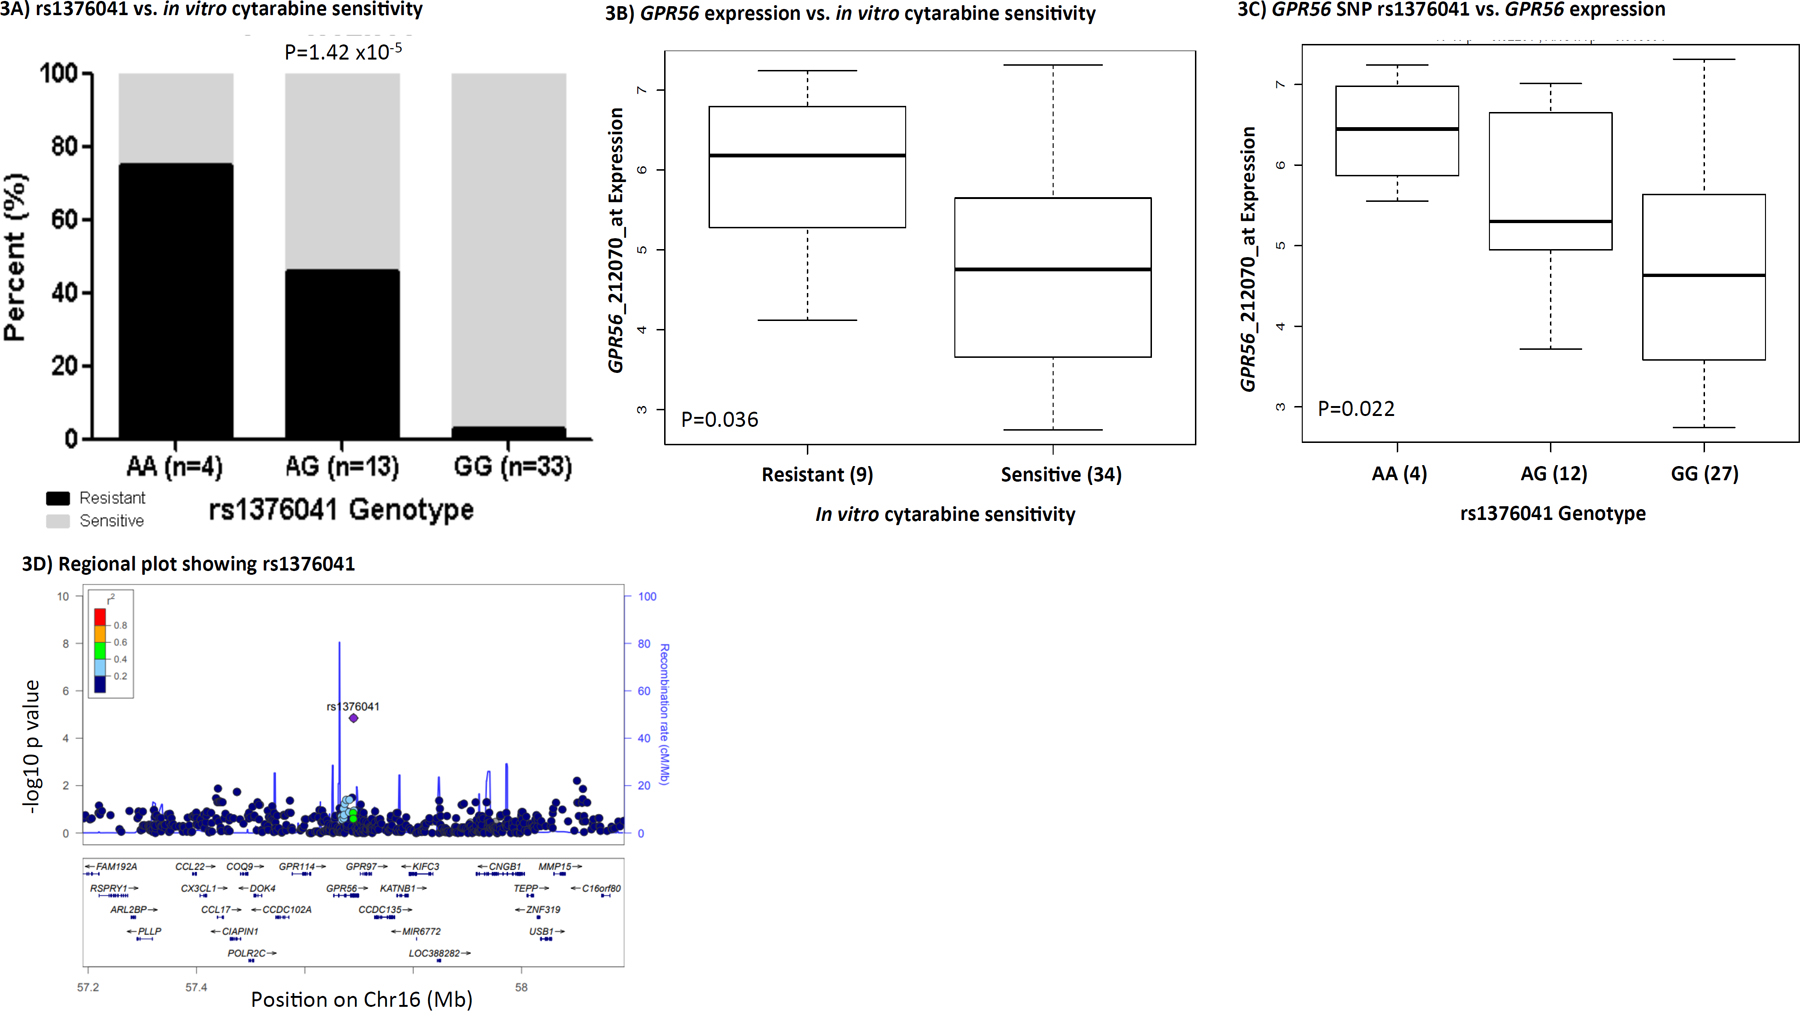
Figure 3: GPR56 and rs1376041. (A) Bar-plot showing the distribution of cytarabine sensitive and resistant cases within genotype groups for rs1376041. (B) Boxplot showing the association of leukemic cell GPR56 gene expression levels between cytarabine sensitive and resistant cases. (C) Boxplot demonstrating association of rs1376041 genotypes with GPR56 gene expression. In boxplots, the y-axis represents natural logarithm of gene expression and the x-axis shows the sensitive/resistant groups or genotype groups. The horizontal line inside the box represents the median value of each group, the lower hinge of the box represents the 25th percentile, the upper hinge represents the 75th percentile and the lower and upper whiskers here display 1.5 times the interquartile range. The outliers are defined as data points that fall outside of the first and third quartiles by more than 1.5 times the interquartile range. (D) Regional plot showing -log10 p-value of the association of SNPs with cytarabine in vitro sensitivity on the y-axis and genes on chromosome 16 within +/- 500kb from rs1376041 on the x-axis. As denoted by the legend with colors indicating linkage disequilibrium, rs1376041 was not in linkage disequilibrium with other SNPs within the region.
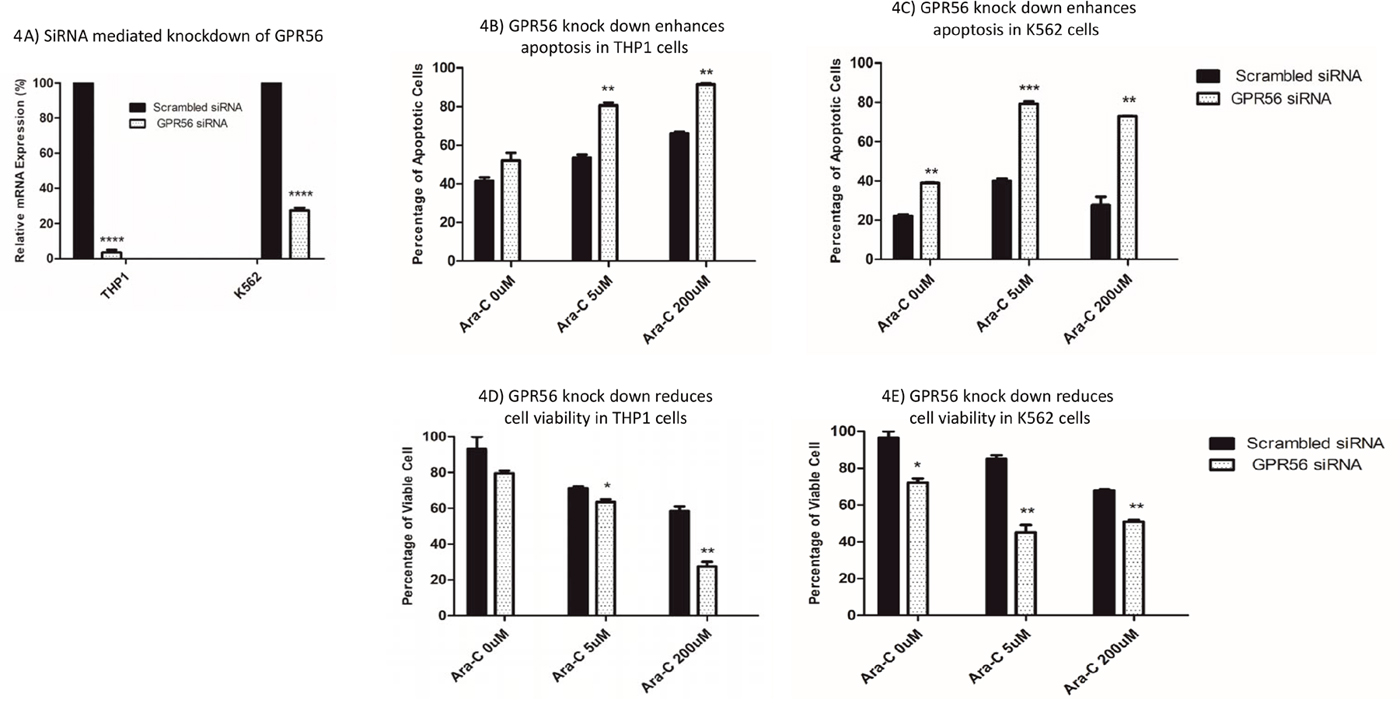
Figure 4: Impact of siRNA mediated knockdown of GPR56 on cytarabine sensitivity in THP1 and K562 cell lines. (A) GPR56 mRNA levels in THP1 and K562 cells transfected with scrambled or GPR56 specific siRNAs. Impact of siRNA mediated knockdown of GPR56 on apoptosis (B and C) and cell viability (D and E) post cytarabine treatment in THP1 and K562 cell lines. *P<0.05, **P<0.01, ***P<0.001, ****P<0.0001.
rs75400242-IGF1R
The second SNP-gene pair of interest is rs74500242- IGF1R, an insulin-like growth factor 1 receptor with tyrosine kinase activity. As shown in Figure 5A, the presence of the minor allele A for rs75400242 was associated with cytarabine resistance (P=2.19x10⁻⁵). Furthermore, IGF1R mRNA expression level within diagnostic leukemic cells was significantly higher in cytarabine resistant cases (P=0.031, Figure 5B). The presence of an A allele for rs75400242 showed a marginally significant association with greater IGF1R expression (P=0.062, Figure 5C). Other genes near rs75400242 include ARRDC4 and FAM169B (Figure 5D).
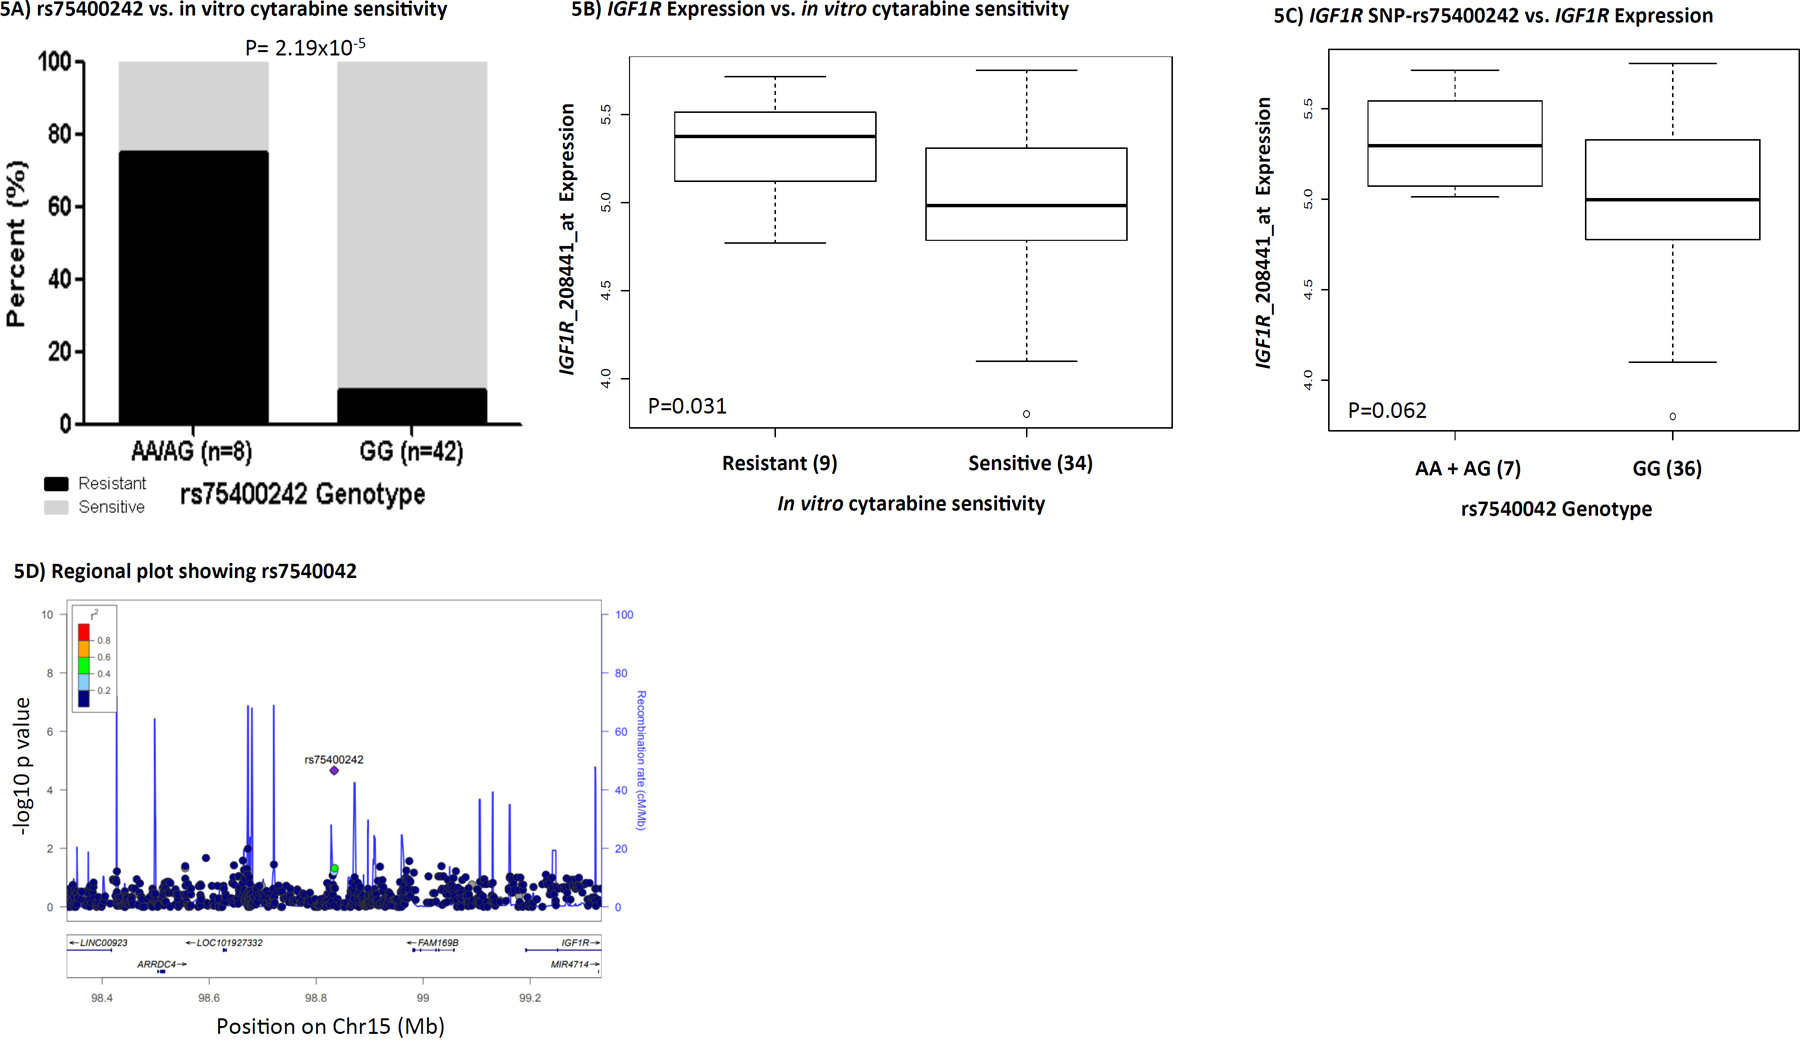
Figure 5: IGF1R and rs75400242. (A) Bar-plot showing distribution of cytarabine sensitive and resistant cases within genotype groups for rs75400242. (B) Boxplot showing association of IGF1R gene expression with cytarabine sensitive and resistant cases. (C) Boxplot demonstrating association of rs75400242 with IGF1R gene expression. In boxplots, the y-axis represents natural logarithm of gene expression and the x-axis shows the sensitive/resistant groups or genotype groups. The horizontal line inside the box represents the median value of each group, the lower hinge of the box represents the 25th percentile, the upper hinge represents the 75th percentile and the lower and upper whiskers here display 1.5 times the interquartile range. The outliers are defined as data points that fall outside of the first and third quartiles by more than 1.5 times the interquartile range. (D) showing -log10 p-value of the association of SNPs with cytarabine in vitro sensitivity on the y-axis and genes on chromosome 15 within +/- 500kb from this rs75400242 on the x-axis. As denoted by the legend with colors indicating linkage disequilibrium, rs75400242 was not in linkage disequilibrium with other SNPs within the region.
We further investigated the impact of siRNA mediated transient knockdown of IGF1R on cellular sensitivity to cytarabine. siRNA mediated knockdown resulted in reduction in IGF1R mRNA in THP1 and K562 cell lines (P<0.05, Figure 6A). IGF1R knockdown enhanced apoptosis and correspondingly had reduced cell viability in response to cytarabine treatment, in THP1 cell lines (Figure 6B and 6D) and K562 cell lines (Figure 6C and 6E).
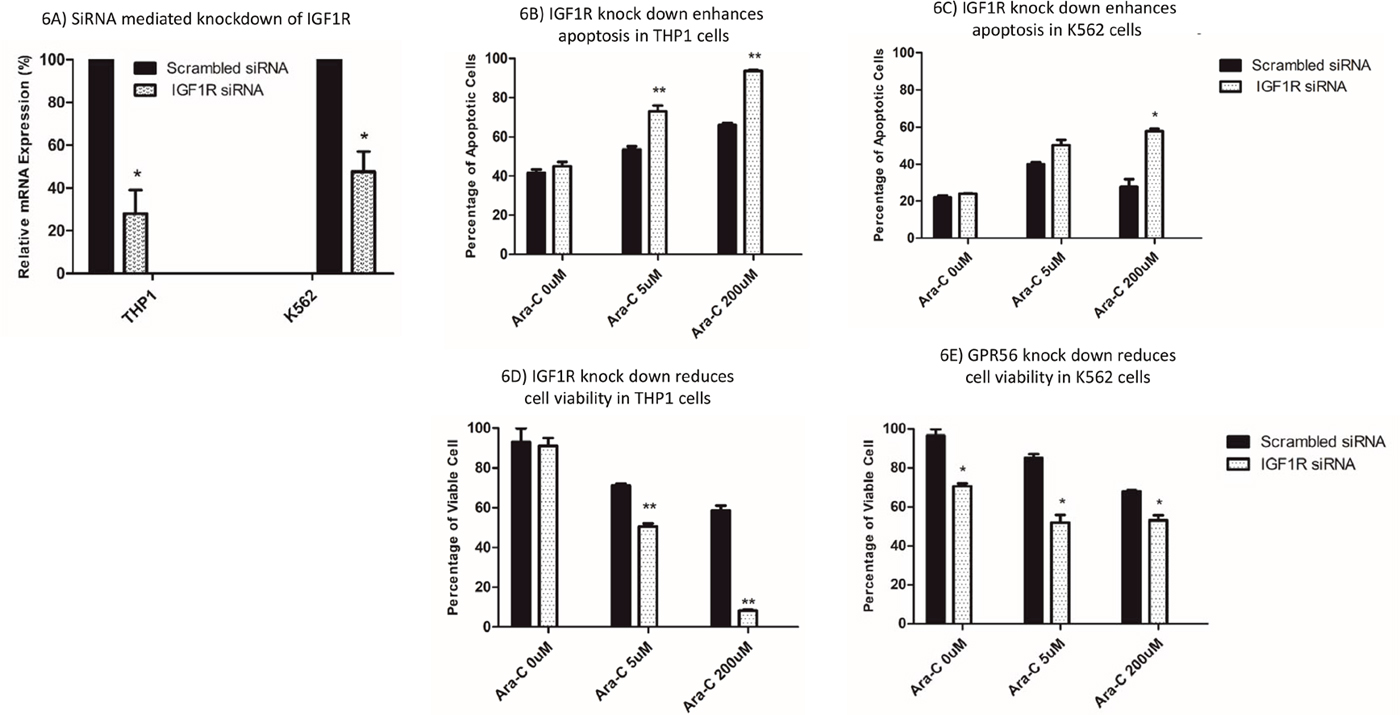
Figure 6: Impact of siRNA mediated knockdown of IGF1R on cytarabine sensitivity in THP1 and K562 cell lines. (A) IGF1R mRNA levels in THP1 and K562 cells transfected with scrambled or IGF1R specific siRNAs. Impact of siRNA mediated knockdown of IGF1R on apoptosis (B and C) and cell viability (D and E) post cytarabine treatment in THP1 and K562 cell lines. *P<0.05, **P<0.01, ***P<0.001, ****P<0.0001.
DISCUSSION
Development of resistance to cytarabine adversely impacts treatment outcome, making it very critical to understand the molecular mechanisms underlying cytarabine resistance. Past efforts to understand factors influencing cytarabine chemosensitivity have focused on the use of lymphoblast cell lines (LCLs) derived from healthy population as a model system or comparing gene-expression differences between parental and cytarabine resistant AML cells lines.[9–12] However, each of these systems have limitations as LCLs do not represent leukemic cells and AML cell lines can undergo changes in culture that might impact gene expression. In this study, we report the first GWAS analysis to identify genomic markers predictive of AML patients’ leukemic cell cellular sensitivity to cytarabine. We identified 113 SNPs associated with cytarabine in vitro sensitivity of leukemic cells obtained from pediatric AML patients. Within 500 kb of these SNPs, there were 38 genes that were differentially expressed between cytarabine sensitive and resistant cases. Nineteen SNP-gene pairs fulfilled the following three criteria: (1) association of SNPs with cytarabine in vitro sensitivity (p< 0.0001), (2) association of gene expression with cytarabine in vitro sensitivity (p<0.05) and (3) association of SNP with gene expression in a consistent direction (p < 0.1). Although this approach highlights significance of some SNPs, it is possible that other significant SNPs impact gene function by mechanisms other than regulating gene expression. Figure 7 summarizes the overall results of the current study. Although in-depth mechanistic investigation of all the 113 SNPs is beyond the scope of this work study, we selected two genes GPR56 and IGF1R for further in vitro validation. Consistent with the SNP and gene-expression results, siRNA mediated knockdown of these genes increased cellular susceptibility to cytarabine. GPR56, also commonly referred to as ADGRG1, encodes for G protein-coupled adhesion molecule and is highly expressed in leukemic stem cells and has been implicated in development of AML.[30] We have previously shown higher expression of GPR56 to be predictive of inferior outcome and more recently our data shows a significant relationship between GPR56 methylation and expression with outcome in pediatric AML.[18], Consistent with our findings, another study investigating DNMT3B as a player in leukemogenesis reported GPR56 as one of the target genes of DNMT3B and in adult AML high expression of GPR56 was associated with inferior overall survival. [31] GPR56 is also part of the 17 gene leukemic stem cell score (LSC17) that has been recently shown to have prognostic significance in predicting therapy resistance and relapse risk.[32] Saito et al. showed greater GPR56 expression in AML samples with high ecotopic viral integration site-1 expression (EVI1high), which is considered a refractory type with poor prognosis. Further, GPR56 knockdown in mice has been shown to result in an increase in cell migration and a decrease in cellular adhesion to the extracellular matrix, resulting in a reduction in cell growth rate and enhanced apoptosis.[20].
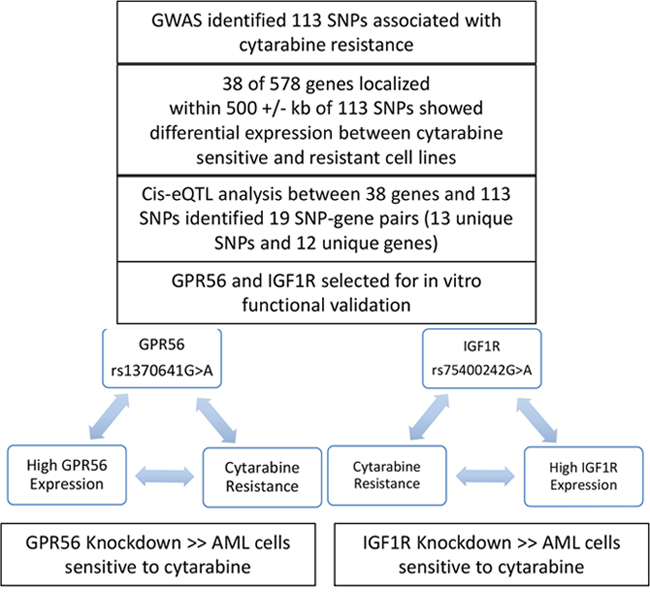
Figure 7: Overall summary of results from the current analysis.
Our results show that the A allele of the GPR56 rs1376041 SNP was associated with cytarabine resistance as well as with higher mRNA expression levels of GPR56 gene, which in turn was associated with greater cytarabine resistance. This result indicates that rs1376041 SNP’s contribution to cytarabine in vitro sensitivity might actually be through its regulation of GPR56 gene expression levels. This adds a unique level of evidence indicating GPR56 rs1376041 SNP to be predictive of its expression and cytarabine chemosensitivity of patient leukemia cells. Further, GPR56 knockdown in AML cell lines increased cytarabine sensitivity, suggesting its potential role in drug resistance and thus inferior outcome. To the best of our knowledge, even though recent data suggests significant role of GPR56 in AML, SNPs in GPR56 have not been studied in context of developing AML or resistance to treatment response.
The second signal, the rs75400242 SNP, is a G>A intronic SNP located 360 kb upstream of IGF1R, a gene encoding a transmembrane receptor protein having tyrosine kinase activity.[33, 34] Upon activation by insulin-like growth factor 1 (IGF-1), the IGF system regulates proliferation and differentiation of hematopoietic cells.[35] Activated IGF1R, can lead to upregulation of phosphoinositide 3 kinase/protein kinase B (PI3K/Akt) signaling, promoting growth and survival of AML cells.[23, 36] Cell growth and survival through IGF1R receptor-mediated activation of the PI3K/Akt signaling pathway has been reported previously [23, 37, 38], however its association with development of drug resistance is limited. Our results show IGF1R to be associated with cytarabine in vitro chemosensitivity and in conjunction with reports of specific targeting of IGF1/IGF1R signaling pathway having potent anti-leukemic activity in AML cells with constitutive PI3K activation, makes it a likely drug target.
Our study clearly adds another level of evidence by mapping a genetic variation that is predictive of leukemic cell cytarabine resistance. Although further studies are warranted to both validate the associations of SNPs identified in our study and to understand the functional underpinnings of the mechanisms contributing to cytarabine resistance, this is difficult due to the lack of such data sets owing to the practical challenges associated with obtaining in vitro drug sensitivity data from primary leukemia cells. To the best of our knowledge, even though limited by the relatively small sample size as compared to other GWAS studies, our study is the largest data set with in vitro cytarabine chemosensitivity in leukemic cells from pediatric AML patients.
In conclusion, although future work in larger clinical cohorts is warranted, our results identified SNPs, mapping to genes of relevance in AML.
MATERIALS AND METHODS
Patient cohort
This study included patients that were treated under the multicenter AML02 clinical trial (ClinicalTrials.gov identifier: NCT00136084). AML02 patients with t[8;21], inv [16], or t[9;11] chromosome abnormalities were classified as having low-risk AML. High-risk AML classification included those with -7, FLT3-ITD mutation, t[6;9], megakaryoblastic AML, treatment-related AML, or AML arising from MDS. Patients lacking low or high-risk group features were classified as standard-risk AML. Details of study population and outcome data has been previously reported.[2] Primary bone marrow samples at diagnosis from 65 patients were available to perform in vitro cytotoxicity study. The mononuclear cells were isolated using Ficoll-Hypaque density-gradient centrifugation within 24 h. Cells were resuspended in modified RPMI-1640 medium supplemented with 20% fetal calf serum, penicillin (100 IU/mL), streptomycin (100 μg/mL) and Fungizone™ (Invitrogen; 0.125 μg/mL), as well as ITS medium supplement containing insulin (5 ng/mL), transferrin (5 μg/mL), and sodium selenite (5 ng/mL), as previously described.[39] In the event the blast count was <80%, samples were enriched to achieve more than 80% blasts using magnetic cell sorting (Miltenyi Biotech, Germany). The sensitivity of leukemic cells to cytarabine was determined in vitro using the 4-day 3-(4,5-dimethylthiazol-2-yl)-2,5-diphenyltetrazolium bromide (MTT) cytotoxicity assay.[18] The leukemic cells were exposed to six different concentrations of cytarabine (ranging from 0.002–2.5 ng/μL) or to culture media (without drug) in a 96-well plate. MTT assay was performed after 96 hrs of drug treatment to determine cytarabine IC50. Fifteen patient samples did not achieve IC50 even at highest drug concentration tested, which was 2.5 ng/μL. Therefore, IC50 values from the 65 samples were dichotomized into those less than 5 ng/μL, which represented the sensitive group (n=50 total, n=40 Caucasians), and those that did not achieve IC50, represented as a resistant group (n=15 total, n=10 Caucasians).
Genotyping
The genomic DNA samples of the AML02 participants were genotyped using the Illumina Omni 2.5M and Exome Beadchip (Illumina, San Diego, CA, USA) at Hussman Institute for Human Genomics, University of Miami, Miami FL, USA. Genotype calling was performed using Illumina's Genome Studio software V2011.1 (Illumina, San Diego, CA, USA).
Gene expression
The mRNA expression levels in diagnostic leukemic blasts from the patient samples were previously determined using the Affymetrix U133A microarray data.[40] All gene expression values were natural log transformed prior to data analysis.
Quality control procedure
QC steps were performed to obtain a high quality dataset for use in statistical analysis. QC is crucial since the capability of a GWAS to reveal true associations and the utility of those GWAS results is dependent on the quality of the data with significant impact on downstream analyses and replication studies.[41]The initial dataset had 2,612,357 variants and 65 participants. Marker QC comprised of filtering out 21,442 low quality SNPs having call rate ≤95% and 578,851 monomorphic SNPs. Of the remaining SNPs, the non-mitochondrial/non-haploid SNPs with MAF>5% were the ones analyzed. Multi-step sample QC procedure included identification and removal of individuals with a large proportion of SNPs failing i.e samples with a call rate ≤95%, individuals with mismatch between genetic and reported sex, related or duplicated individuals and individuals with outlying heterozygosity rate.[41, 42] Sample QC also confirmed the individual’s identified race and if genetic race was not consistent with their reported race, it was reassigned. All the samples passed sample QC steps and none were excluded in the analysis. Details of the QC procedure can be found in the Supplementary Table 2. All QC steps were performed using PLINK 1.9.[43, 44].
Statistical analysis
Given the phenotype of interest, namely cytarabine IC50, was not normally distributed (Supplementarty Figure 1), the patients were classified into two groups: cytarabine sensitive: leukemic cells with IC50 less than 5 ng/μL, (n= 40 Caucasian patients), and cytarabine resistant: leukemic cells that never achieved IC50 and thus were assigned IC50 of 5 ng/μL, (n= 10 Caucasian patients). We utilized Cochran-Armitage trend test to assess SNPs associated with cytarabine sensitive or resistant groups within our white patients.[43, 44] Genome-wide significance was set at an alpha level of 5x10⁻⁸ [45] and a suggestive level was set at 1x10⁻⁴ for follow-up with gene expression data. All GWAS was conducted using PLINK 1.9.[43, 44].
Gene-expression analysis
Differential gene expression for genes within +/-500kb of the significant/suggestive GWAS SNPs was conducted using Wilcoxon test to detect genes differentially expressed between the sensitive and resistant groups. cis eQTL analysis was conducted on candidate SNP-gene pairs identified in the GWAS and differential gene expression analysis above using Wilcoxon and Kruskal-Wallis tests, depending on how many genotype groups are available for each SNP. These analyses were done using R statistical software version 3.4.0.[46].
In vitro functional validation
In vitro validation of two genes identified in GWAS and validated in gene expression analysis was performed using AML cell lines: THP-1, K562 (ATCC, Manassas, VA, USA). The cell lines were maintained in RPMI-1640 (Invitrogen, USA) supplemented with 10% FBS (Invitrogen, USA) at 37°C in a humidified atmosphere containing 5% CO2. The cells were passaged every 2–3 days in order to maintain them in logarithmic growth phase. siRNAs targeting GPR56 and IGF1R as well as scrambled siRNA were procured from Dharmacon (Accell SMARTpool, USA). Just before transfection, the cells were grown in RPMI-1640-medium free of antibiotics. Delivery of siRNA at a final concentration of 50 nM was performed using RNAi Max reagent (Invitrogen, USA) according to the manufacturer's instructions. To monitor the effect of siRNA on gene silencing, transfection (5 × 10⁵ cells/well) was done in 6-well plates for 48 hours. RNA levels of target genes GPR56 and IGF1R as well as house-keeping gene GAPDH was then measured by Taqman gene expression assays (ThermoFisher Scientific, USA). Transfected cells harvested and exposed to cytarabine at 5 μM and 200 μM final concentration for 48 hours. Cells were stained with acridine orange (AO) and propidium iodide (PI) for viability assays and fluorescein isothiocyanate-conjugated Annexin V for apoptosis assays followed by manufacturer’s procedure, (Cellometer Inc., Lawrence, MA, USA). Cell imaging was undertaken by the Cellometer Vision CBA and FCS Express-6 software. In order to measure threshold in the software, it was set to 0% to quantify total fluorescence of each counted cell from the captured images. Based on fluorescence intensities, the results were calculated and converted to FCS file for analysis in the De Novo Software.55.
Abbreviations
AML, Acute Myeloid Leukemia; Ara-C, 1-β-Arabinofuranosylcytosine or cytarabine; CML, Chronic Mylogenous Leukemia; eQTL, Expression Quantitative Trait Loci; EVI1, Ecotropic Viral Integration Site-1; GPR56, G Protein-Coupled Receptor 56; GWAS, Genome-Wide Association Analysis Study; HOXA10 Homeobox A10; HWE, Hardy-Weinberg Equilibrium; IBS/IBD, Identity-By-State/Identity-By-Descent; IC50, Half Maximal (50%) Inhibitory Concentration; IGF1, Insulin-like Growth Factor 1; IGF1R, Insulin like Growth Factor 1 Receptor; LCLs, Lymphoblastoid Cell Lines; LD, Linkage Disequilibrium; LincRNA, Long Intergenic Non-Coding RNA; MAF, Minor Allele Frequency; MN1, Meningioma 1; MRD, Minimal Residual Disease; MTT, 4-day 3-(4,5-dimethylthiazol-2-yl)-2,5-diphenyltetrazolium bromide; OPCML, Opioid Binding Protein/Cell Adhesion Molecule Like; OS, Overall Survival; PC, Principal Component; PCA, Principal Component Analysis; PI3K/Akt, Phosphoinositide 3 Kinase/Protein Kinase B; QC, Quality Control.
ACKNOWLEDGMENTS
This study was supported by NIH grant R01CA132946 (Lamba and Pounds), American Society of Hematology Bridge funding and by the American Lebanese Syrian Associated Charities (ALSAC). We are thankful to Dr. Caitrin McDonough in providing support in Array QC.
CONFLICTS OF INTEREST
The authors declare no conflicts of interest.
REFERENCES
1. Gamis AS, Alonzo TA, Meshinchi S, Sung L, Gerbing RB, Raimondi SC, Hirsch BA, Kahwash SB, Heerema-McKenney A, Winter L, Glick K, Davies SM, Byron P, et al. Gemtuzumab ozogamicin in children and adolescents with de novo acute myeloid leukemia improves event-free survival by reducing relapse risk: results from the randomized phase III Children’s Oncology Group trial AAML0531. J Clin Oncol. 2014; 32:3021–32.
2. Rubnitz JE, Inaba H, Dahl G, Ribeiro RC, Bowman WP, Taub J, Pounds S, Razzouk BI, Lacayo NJ, Cao X, Meshinchi S, Degar B, Airewele G, et al. Minimal residual disease-directed therapy for childhood acute myeloid leukaemia: results of the AML02 multicentre trial. Lancet Oncol. 2010; 11:543–52.
3. Wang JJ, Selawry OS, Vietti TJ, Bodey GP Sr. Prolonged infusion of arabinosyl cytosine in childhood leukemia. Cancer. 1970; 25:1–6.
4. Owens JK, Shewach DS, Ullman B, Mitchell BS. Resistance to 1-beta-D-arabinofuranosylcytosine in human T-lymphoblasts mediated by mutations within the deoxycytidine kinase gene. Cancer Res. 1992; 52:2389–93.
5. Shi JY, Shi ZZ, Zhang SJ, Zhu YM, Gu BW, Li G, Bai XT, Gao XD, Hu J, Jin W, Huang W, Chen Z, Chen SJ. Association between single nucleotide polymorphisms in deoxycytidine kinase and treatment response among acute myeloid leukaemia patients. Pharmacogenetics. 2004; 14:759–68.
6. Lamba JK, Crews K, Pounds S, Schuetz EG, Gresham J, Gandhi V, Plunkett W, Rubnitz J, Ribeiro R. Pharmacogenetics of deoxycytidine kinase: identification and characterization of novel genetic variants. J Pharmacol Exp Ther. 2007; 323:935–45.
7. Fitzgerald SM, Goyal RK, Osborne WR, Roy JD, Wilson JW, Ferrell RE. Identification of functional single nucleotide polymorphism haplotypes in the cytidine deaminase promoter. Hum Genet. 2006; 119:276–83.
8. Yue L, Saikawa Y, Ota K, Tanaka M, Nishimura R, Uehara T, Maeba H, Ito T, Sasaki T, Koizumi S. A functional single-nucleotide polymorphism in the human cytidine deaminase gene contributing to ara-C sensitivity. Pharmacogenetics. 2003; 13:29–38.
9. Hartford CM, Duan S, Delaney SM, Mi S, Kistner EO, Lamba JK, Huang RS, Dolan ME. Population-specific genetic variants important in susceptibility to cytarabine arabinoside cytotoxicity. Blood. 2009; 113:2145–53.
10. Li L, Fridley BL, Kalari K, Jenkins G, Batzler A, Weinshilboum RM, Wang L. Gemcitabine and arabinosylcytosin pharmacogenomics: genome-wide association and drug response biomarkers. PLoS One. 2009; 4:e7765.
11. Gamazon ER, Lamba JK, Pounds S, Stark AL, Wheeler HE, Cao X, Im HK, Mitra AK, Rubnitz JE, Ribeiro RC, Raimondi S, Campana D, Crews KR, et al. Comprehensive genetic analysis of cytarabine sensitivity in a cell-based model identifies polymorphisms associated with outcome in AML patients. Blood. 2013; 121:4366–76.
12. Li L, Fridley BL, Kalari K, Niu N, Jenkins G, Batzler A, Abo RP, Schaid D, Wang L. Discovery of genetic biomarkers contributing to variation in drug response of cytidine analogues using human lymphoblastoid cell lines. BMC Genomics. 2014; 15:93.
13. Galmarini CM, Graham K, Thomas X, Calvo F, Rousselot P, El Jafaari A, Cros E, Mackey JR, Dumontet C. Expression of high Km 5′-nucleotidase in leukemic blasts is an independent prognostic factor in adults with acute myeloid leukemia. Blood. 2001; 98:1922–26.
14. Galmarini CM, Thomas X, Calvo F, Rousselot P, El Jafaari A, Cros E, Dumontet C. Potential mechanisms of resistance to cytarabine in AML patients. Leuk Res. 2002; 26:621–29.
15. Galmarini CM, Thomas X, Graham K, El Jafaari A, Cros E, Jordheim L, Mackey JR, Dumontet C. Deoxycytidine kinase and cN-II nucleotidase expression in blast cells predict survival in acute myeloid leukaemia patients treated with cytarabine. Br J Haematol. 2003; 122:53–60.
16. Abe S, Funato T, Takahashi S, Yokoyama H, Yamamoto J, Tomiya Y, Yamada-Fujiwara M, Ishizawa K, Kameoka J, Kaku M, Harigae H, Sasaki T. Increased expression of insulin-like growth factor i is associated with Ara-C resistance in leukemia. Tohoku J Exp Med. 2006; 209:217–28.
17. Li L, Fridley B, Kalari K, Jenkins G, Batzler A, Safgren S, Hildebrandt M, Ames M, Schaid D, Wang L. Gemcitabine and cytosine arabinoside cytotoxicity: association with lymphoblastoid cell expression. Cancer Res. 2008; 68:7050–58.
18. Lamba JK, Crews KR, Pounds SB, Cao X, Gandhi V, Plunkett W, Razzouk BI, Lamba V, Baker SD, Raimondi SC, Campana D, Pui CH, Downing JR, et al. Identification of predictive markers of cytarabine response in AML by integrative analysis of gene-expression profiles with multiple phenotypes. Pharmacogenomics. 2011; 12:327–39.
19. Lamba JK, Pounds S, Cao X, Crews KR, Cogle CR, Bhise N, Raimondi SC, Downing JR, Baker SD, Ribeiro RC, Rubnitz JE. Clinical significance of in vivo cytarabine-induced gene expression signature in AML. Leuk Lymphoma. 2016; 57:909–20.
20. Saito Y, Kaneda K, Suekane A, Ichihara E, Nakahata S, Yamakawa N, Nagai K, Mizuno N, Kogawa K, Miura I, Itoh H, Morishita K. Maintenance of the hematopoietic stem cell pool in bone marrow niches by EVI1-regulated GPR56. Leukemia. 2013; 27:1637–49.
21. Hizuka N, Sukegawa I, Takano K, Asakawa K, Horikawa R, Tsushima T, Shizume K. Characterization of insulin-like growth factor I receptors on human erythroleukemia cell line (K-562 cells). Endocrinol Jpn. 1987; 34:81–88.
22. Sukegawa I, Hizuka N, Takano K, Asakawa K, Shizume K. Decrease in IGF-I binding sites on human promyelocytic leukemia cell line (HL-60) with differentiation. Endocrinol Jpn. 1987; 34:365–72.
23. Chapuis N, Tamburini J, Cornillet-Lefebvre P, Gillot L, Bardet V, Willems L, Park S, Green AS, Ifrah N, Dreyfus F, Mayeux P, Lacombe C, Bouscary D. Autocrine IGF-1/IGF-1R signaling is responsible for constitutive PI3K/Akt activation in acute myeloid leukemia: therapeutic value of neutralizing anti-IGF-1R antibody. Haematologica. 2010; 95:415–23.
24. Carella C, Bonten J, Sirma S, Kranenburg TA, Terranova S, Klein-Geltink R, Shurtleff S, Downing JR, Zwarthoff EC, Liu PP, Grosveld GC. MN1 overexpression is an important step in the development of inv(16) AML. Leukemia. 2007; 21:1679–90.
25. Heuser M, Beutel G, Krauter J, Döhner K, von Neuhoff N, Schlegelberger B, Ganser A. High meningioma 1 (MN1) expression as a predictor for poor outcome in acute myeloid leukemia with normal cytogenetics. Blood. 2006; 108:3898–905.
26. Maiga A, Lemieux S, Pabst C, Lavallée VP, Bouvier M, Sauvageau G, Hébert J. Transcriptome analysis of G protein-coupled receptors in distinct genetic subgroups of acute myeloid leukemia: identification of potential disease-specific targets. Blood Cancer J. 2016; 6:e431.
27. Yue LZ, Fu R, Wang HQ, Li LJ, Ruan EB, Wang GJ, Qu W, Liang Y, Guan J, Wu YH, Liu H, Song J, Wang XM, et al. Expression of DLK1 Gene in the Bone Marrow Cells of Patients with Myelodysplastic Syndromes and Its Clinical Significance. Cancer Biol Med. 2012; 9:188–91.
28. Hua KT, Lee WJ, Yang SF, Chen CK, Hsiao M, Ku CC, Wei LH, Kuo ML, Chien MH. Vascular endothelial growth factor-C modulates proliferation and chemoresistance in acute myeloid leukemic cells through an endothelin-1-dependent induction of cyclooxygenase-2. Biochim Biophys Acta. 2014; 1843:387–97.
29. Ng SW, Mitchell A, Kennedy JA, Chen WC, McLeod J, Ibrahimova N, Arruda A, Popescu A, Gupta V, Schimmer AD, Schuh AC, Yee KW, Bullinger L, et al. A 17-gene stemness score for rapid determination of risk in acute leukaemia. Nature. 2016; 540:433–37.
30. Daria D, Kirsten N, Muranyi A, Mulaw M, Ihme S, Kechter A, Hollnagel M, Bullinger L, Döhner K, Döhner H, Feuring-Buske M, Buske C. GPR56 contributes to the development of acute myeloid leukemia in mice. Leukemia. 2016; 30:1734–41.
31. Schulze I, Rohde C, Scheller-Wendorff M, Bäumer N, Krause A, Herbst F, Riemke P, Hebestreit K, Tschanter P, Lin Q, Linhart H, Godley LA, Glimm H, et al. Increased DNA methylation of Dnmt3b targets impairs leukemogenesis. Blood. 2016; 127:1575–86.
32. Pabst C, Bergeron A, Lavallée VP, Yeh J, Gendron P, Norddahl GL, Krosl J, Boivin I, Deneault E, Simard J, Imren S, Boucher G, Eppert K, et al. GPR56 identifies primary human acute myeloid leukemia cells with high repopulating potential in vivo. Blood. 2016; 127:2018–27.
33. Ullrich A, Bell JR, Chen EY, Herrera R, Petruzzelli LM, Dull TJ, Gray A, Coussens L, Liao YC, Tsubokawa M, Mason A, Seeburg PH, Grunfeld C, et al. Human insulin receptor and its relationship to the tyrosine kinase family of oncogenes. Nature. 1985; 313:756–61.
34. NCBI Resource Coordinators. Database Resources of the National Center for Biotechnology Information. Nucleic Acids Res. 2017; 45:D12–17.
35. Zumkeller W. The insulin-like growth factor system in hematopoietic cells. Leuk Lymphoma. 2002; 43:487–91.
36. Doepfner KT, Spertini O, Arcaro A. Autocrine insulin-like growth factor-I signaling promotes growth and survival of human acute myeloid leukemia cells via the phosphoinositide 3-kinase/Akt pathway. Leukemia. 2007; 21:1921–30.
37. Grandage VL, Gale RE, Linch DC, Khwaja A. PI3-kinase/Akt is constitutively active in primary acute myeloid leukaemia cells and regulates survival and chemoresistance via NF-kappaB, Mapkinase and p53 pathways. Leukemia. 2005; 19:586–94.
38. Xu Q, Simpson SE, Scialla TJ, Bagg A, Carroll M. Survival of acute myeloid leukemia cells requires PI3 kinase activation. Blood. 2003; 102:972–80.
39. Holleman A, Cheok MH, den Boer ML, Yang W, Veerman AJ, Kazemier KM, Pei D, Cheng C, Pui CH, Relling MV, Janka-Schaub GE, Pieters R, Evans WE. Gene-expression patterns in drug-resistant acute lymphoblastic leukemia cells and response to treatment. N Engl J Med. 2004; 351:533–42.
40. Mitra AK, Crews KR, Pounds S, Cao X, Feldberg T, Ghodke Y, Gandhi V, Plunkett W, Dolan ME, Hartford C, Raimondi S, Campana D, Downing J, et al. Genetic variants in cytosolic 5′-nucleotidase II are associated with its expression and cytarabine sensitivity in HapMap cell lines and in patients with acute myeloid leukemia. J Pharmacol Exp Ther. 2011; 339:9–23.
41. Turner S, Armstrong LL, Bradford Y, Carlson CS, Crawford DC, Crenshaw AT, de Andrade M, Doheny KF, Haines JL, Hayes G, Jarvik G, Jiang L, Kullo IJ, et al. Quality control procedures for genome-wide association studies. Curr Protoc Hum Genet. 2011; Chapter 1:Unit1.19. https://doi.org/10.1002/0471142905.hg0119s68.
42. Anderson CA, Pettersson FH, Clarke GM, Cardon LR, Morris AP, Zondervan KT. Data quality control in genetic case-control association studies. Nat Protoc. 2010; 5:1564–73.
43. Purcell S, Chang C. PLINK [1.9]. (https://www.cog-genomics.org/plink2.
44. Chang CC, Chow CC, Tellier LC, Vattikuti S, Purcell SM, Lee JJ. Second-generation PLINK: rising to the challenge of larger and richer datasets. Gigascience. 2015; 4:7.
45. Pe’er I, Yelensky R, Altshuler D, Daly MJ. Estimation of the multiple testing burden for genomewide association studies of nearly all common variants. Genet Epidemiol. 2008; 32:381–85.
46. R Core Team. (2017). R: A language and environment for statistical computing. R Foundation for Statistical Computing, Vienna, Austria. Available from: https://www.R-project.org/.