
INTRODUCTION
Dementia and obesity are increasing in epidemic proportions among western societies [1, 2]. The total number of people with dementia is expected to rise to 106 million worldwide by 2050 [1]. Alzheimer’s disease (AD) is the main cause of dementia, but there are no current preventive or disease modifying treatments. Therefore, the identification of modifiable risk factors is of major interest.
Obesity is a well-established risk factor for type 2 diabetes (T2D), cardiovascular disease and cancer, and it has also been proposed as an independent risk factor for dementia and AD [3–5]. Mid-life obesity has been consistently identified as a risk factor for dementia and AD in epidemiological studies [3]. Moreover, several pathological alterations associated with obesity, such as insulin resistance, inflammation or mitochondrial dysfunction, have also been related to AD pathological processes [6]. Finally, mid-life obesity has been linked to greater burden of AD neuropathology in the human brain [7]. However, the association between late-life obesity and dementia is inconclusive [8–11]. Some studies have even identified late-life obesity as a protective state for dementia [10], hence the “obesity paradox” on AD risk.
An “obesity paradox” has been described in relation to other health conditions [12, 13], including cardiovascular disease [13], and might be explained by bias [14]. Stokes et al. nicely demonstrated that the “obesity paradox” on cardiovascular mortality is mainly the result of reverse causation, produced by the confounding effect of illness-related weight loss [15]. In this sense, the relationship between dementia and weight loss is widely recognized [16]. More recently, weight loss has been related to preclinical and prodromal AD stages up to 20 years prior to symptom onset [17–19]. This long period of weight loss in preclinical AD might obscure the relationship between late-life obesity and AD, and might explain the “obesity paradox” on AD risk.
Structural MRI has been extensively used to study aging and AD [17, 20–22]. Several studies have evaluated the relationship between obesity and brain structure, with conflicting results [23–36]. Conversely, unintentional weight loss is consistently associated with both cross sectional and longitudinal brain atrophy in healthy elderly [26, 31, 35, 37].
In the present study, we aimed to assess the brain structural changes associated with obesity in healthy elderly from the Alzheimer’s Disease Neuroimaging Initiative (ADNI), taking into account the potential confounding effect of weight loss.
RESULTS
Table 1 summarizes the demographic, biometric and biochemical data according to BMI at baseline. We included 162 subjects (80 female) in the study, with a mean age of 73.3±6.0 years (ranging between 56.2 to 89.0 years) and a mean BMI of 27.4±4.0 Kg/m2. Fifty-two were in the normal-weight category (32.1%), 70 in the overweight category (43.2%) and 40 in the obese category (24.7%). None of the study participants presented a BMI below 20.0 Kg/m2. Triglycerides levels were higher in obese subjects respect the other two groups and in overweight subjects respect normal-weight subjects, but there were no other significant differences. In the follow-up, 36 subjects had a significant weight loss (≥5%). No significant differences in age, sex, BMI, baseline cognitive performance or APOE genotype were observed between those subjects with or without weight loss.
Table 1: Demographic, anthropometric and neuropsychological data according to the weight categories
|
Normal-weight |
Overweight |
Obese |
p |
|---|---|---|---|---|
n |
52 |
70 |
40 |
|
Gender (females), N (%) |
24 (46.2) |
41 (58.6) |
15 (37.5) |
0.089 |
Age (years) |
74.45 (6.07) |
73.15 (6.31) |
72.08 (4.93) |
0.159 |
Weight-Loss group, N (%) |
15 (28.8) |
11 (15.7) |
10 (25.0) |
0.200 |
SBP (mg/dL) |
131.85 (17.57) |
133.01 (14.67) |
135.57 (13.14) |
0.504 |
DBP (mg/dL) |
73.46 (11.38) |
73.89 (9.72) |
76.03 (8.99) |
0.443 |
FPG (mg/dL) |
98.21 (21.70) |
96.26 (13.95) |
103.08 (20.97) |
0.179 |
Cholesterol (mg/dL) |
194.60 (36.91) |
188.37 (38.34) |
193.72 (37.43) |
0.617 |
Triglycerides (mg/dL) |
113.35 (69.68) |
145.81 (75.37) |
161.62 (88.68) |
0.009 |
Education (years) |
16.63 (2.63) |
16.50 (2.35) |
16.50 (2.46) |
0.949 |
ApoE4 carrier, N (%) |
16 (30.8) |
23 (32.9) |
9 (22.5) |
0.507 |
MMSE score |
29.23 (1.10) |
29.00 (1.15) |
29.27 (0.93) |
0.344 |
ADAS-Cog 11 score |
5.69 (2.88) |
5.91 (3.45) |
5.36 (2.42) |
0.659 |
ADAS-Cog 13 score |
8.82 (4.38) |
9.28 (5.08) |
8.16 (3.40) |
0.453 |
Type 2 Diabetes, N (%) |
4 ( 7.7) |
5 ( 7.1) |
6 (15.0) |
0.351 |
Data is expressed as mean (standard deviation). Abbreviations: BMI: body mass index; SBP: systolic blood pressure; DBP: diastolic blood pressure; FPG: fasting plasmatic glucose; MMSE: Minimental score examination; ADAS-Cog Alzheimer’s Disease Scale Assessment.
The association of obesity and brain structure is confounded by weight loss
Figure 1 presents the vertexwise interaction analysis across the whole cortical mantle between BMI and weight loss. Extensive clusters emerged in both hemispheres (Figure 1A). As hypothesized, cortical thinning in relation with BMI occurred only in weight-stable subjects whereas in the weight-loss group increasing BMI was associated with increased cortical thickness. Figure 1B shows the mean CTh values for each subject at the cluster of maximum significance of the interaction term in the insular-temporal cluster of the right hemisphere. Similar results were found in all FWE corrected clusters (results not shown). The interaction analysis on HVa was not significant (p=0.4).
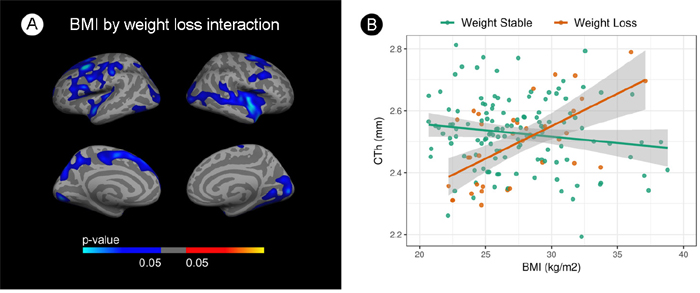
Figure 1: Interaction analysis between body mass index and cortical thickness by weight loss. (A) Vertex wise analysis. Blue areas indicate regions with significant (FWE<0.05) interaction term. (B) Scatterplot showing this interaction. BMI is shown in the X-axes and mean cortical thickness in the y-axes at the insular-temporal cluster of the right hemisphere. Green dots represent weight-stable subjects and orange dots represent weight-loss subjects. The blue gradient color represent the uncorrected p-values (p<0.05) in the FWE surviving clusters only.
We performed stratified vertexwise correlation analyses to further assess whether the relationship between obesity and CTh is modified by weight-loss status (Figure 2). In the weight-stable group, areas of cortical thinning with increasing BMI emerged in both hemispheres, including occipital, inferior temporal and frontal regions (Figure 2B). Conversely, in the weight-loss group, areas of cortical thickening appeared in the superior parietal and frontal regions in both hemispheres and temporal regions in the right hemisphere (Figure 2C). Of note, the association between BMI and brain structure in the whole cohort showed a weak inverse association between BMI and cortical thickness in the inferior temporal region (results not shown).
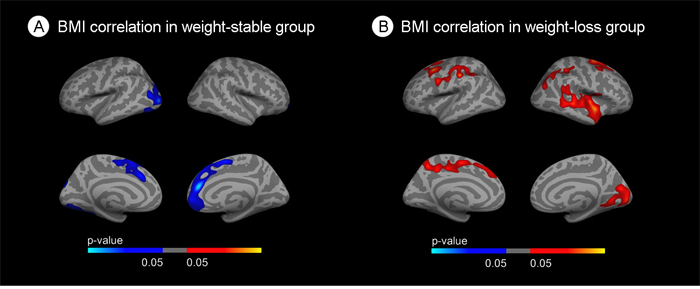
Figure 2: Stratified correlation analysis between body mass index and cortical thickness. (A) Correlation between BMI and cortical thickness in the weight-stable group. (B) Correlation between BMI and cortical thickness in the weight-loss group. Blue areas indicate regions with significant (FWE<0.05) cortical thinning. Red areas represent areas with significant cortical thickening (FWE<0.05). The blue and red gradient colors represent the uncorrected p-values (p<0.05) in the FWE suriving clusters only.
Obesity is associated with brain atrophy in the absence of weight loss, but is a marker of brain health in the weight-loss group
To separatedly assess the impact of obesity in the weight-stable and weight-loss groups we performed BMI group comparisons stratifying by weight-loss. We first analyzed the weight-stable group. In the overweight vs. obese comparison (Figure 3A1) clusters of decreased CTh emerged in frontal areas. In the normal-weight vs obese comparison clusters of decreased CTh in the obese subjects emerged in frontal and occipital regions of both hemispheres (Figure 3A2). Finally, in the overweight vs obese comparison (Figure 3A3), clusters of decreased CTh emerged in occipital regions. There were no significant differences in HVa between the BMI groups in the weight-stable group (p = 0.3).
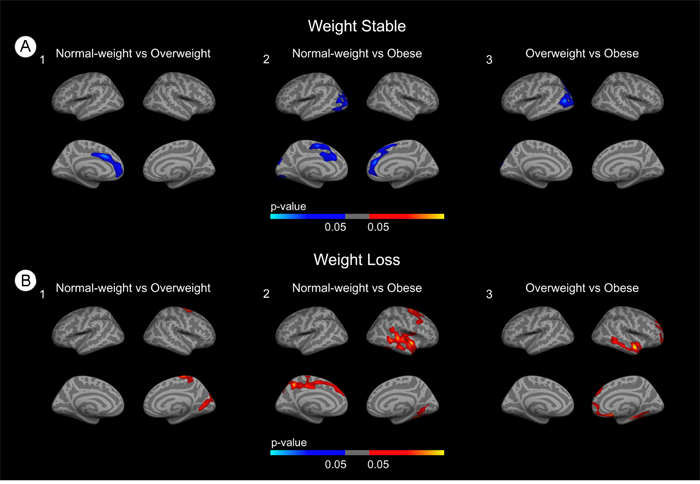
Figure 3: Stratified group comparisons between BMI groups. (A) Group comparisons in the weight-stable group. (B) Group comparisons in the weight-loss group. Blue areas indicate regions with significant (FWE<0.05) cortical thinning. Red areas represent areas with significant cortical thickening (FWE<0.05). The blue and red gradient colors represent the uncorrected p-values (p<0.05) in the FWE surviving clusters only.
We next analyzed the weight loss group. In the normal-weight vs overweight and overweight vs obese comparisons (Figures 3B1 and 3B3) we found clusters of increased CTh in temporal and posterior regions. In the normal-weight vs obese comparison (Figure 3B2) widespread clusters of increased CTh emerged. Of note, in the BMI group comparisons in the whole cohort, overweight participants showed several clusters of increased CTh when compared both with the normal-weight group and with the obese group, but no significant differences were found in the normal-weight vs. obese comparison (results not shown). There were no significant differences in HVa between the BMI groups in the weight-loss group (p = 0.09).
DISCUSSION
In this study, we examined the relationship between late-life obesity and brain structure in healthy elderly taking into account the potential confounding effect of weight loss. Our results suggest that late-life obesity is associated with cortical thinning, but that this relationship is negatively confounded by weight-loss.
Weight loss modifies the effect of late-life obesity on brain structure supporting the hypothesis of reverse causation (the negative confounding effect of AD related weight loss) as an explanation for the obesity paradox on AD risk. We found an inverse association between BMI and CTh in the weight-stable group, but an inverse relationship in the weight-loss group suggesting that obesity promotes cortical atrophy in the absence of weight loss, but could be a marker of brain health in later stages of the disease when weight-loss modifies body composition and more degeneration has occurred. These results are thus in agreement with the concept of mid-life obesity as an established risk factor for AD [3, 7], and as a risk factor for longitudinal cortical thinning in mid-life as shown in a study with 405 middle-aged subjects (mean age 47.2 years) [31, 38]. More recently, weight loss has been identified as a non-cognitive manifestation of preclinical AD [19, 37] and we have previosly shown that weight-loss is associated with cortical atrophy [37]. In short, the weight-loss associated with preclinical AD would change the relationship between BMI and CTh in a slow, but cumulative process leading to reverse causation.
Elderly subjects have a higher prevalence of preclinical AD and longer mean preclinical periods than younger participants [38]. Reverse causation would be thus more evident in elderly subjects, and might help explain the conflicting results found in the literature. In this respect, previous works in younger cohorts have found hippocampal atrophy (mean age 63.2 years) [25] and cortical thinning in the entorhinal cortex and the posterior cingulate (mean age 63 years) in relation with obesity [31]. However, works in older cohorts have found increased hippocampal volume (mean age 74.4) [34] and increased cortical thickness in the precuneus (mean age of 76 years, also using the ADNI cohort) [27]. Our hypothesis could also explain the results by Raji et al. [30]. In this study, the authors showed an inverse correlation between late-life BMI and hippocampal, frontal lobe and anterior cingulate volumes in an older cohort (mean age 77 years). This study, however, excluded those subjects that converted to dementia in the following 5 years after the MRI. The exclusion of these subjects might have minimized reverse causation and might explain the similarities with our stratified analysis. Of note, our differences were restricted to the brain cortex; we did not find significant differences in hippocampal volume related with obesity.
Our study has several limitations. First, weight trajectories previous to MRI were not recorded. Consequently, we assumed that future weight loss is part of a dynamic process that begins at late mid-life and, therefore, before baseline MRI scan. Second, intentional weight loss cannot be differentiated from unintentional weight loss in the ADNI cohort. However, since previous studies have shown that intentional weight loss in healthy obese subjects and in obese MCI patients has beneficial cognitive effects [39–41]. Third, the ADNI cohort excluded participants with a large vascular burden. This selection bias explains the similar metabolic profile across BMI categories in our study and precludes the generalization of our results to broad obese populations. Fourth, body composition analyses or physical activity were not assessed in the ADNI cohort. Finally, these results were mainly derived from a cross-sectional analysis and further longitudinal studies with longer follow-up are necessary to confirm a plausible deleterious effect of late-life obesity on brain health.
In conclusion, weight loss negatively confounds the deleterious effect of adiposity in the brain structure in elderly subjects and might explain the “obesity paradox” on AD risk.
MATERIALS AND METHODS
Study participants
Data used in the preparation of this article were obtained from the Alzheimer’s Disease Neuroimaging Initiative (ADNI) database (http://adni.loni.usc.edu). The ADNI was launched in 2003 by the National Institute on Aging (NIA), the National Institute of Biomedical Imaging and Bioengineering (NIBIB), the Food and Drug Administration (FDA), private pharmaceutical companies and non-profit organizations, as a %60 million, 5-year public-private partnership. The primary goal of ADNI has been to test whether serial magnetic resonance imaging (MRI), positron emission tomography (PET), other biological markers, and clinical and neuropsychological assessment can be combined to measure the progression of mild cognitive impairment (MCI) and early AD. The Principal Investigator of this initiative is Michael W. Weiner, MD, VA Medical Center and University of California – San Francisco. ADNI is the result of efforts of many co-investigators from a broad range of academic institutions and private corporations, and subjects have been recruited from over 50 sites across the U.S. and Canada. More information can be found in the acknowledgements section (see also http://adni-info.org/). We selected all normal cognitive participants with available baseline cerebrospinal fluid data and 3T MRI scan in ADNI. Significant weight loss was defined as relative weight loss ≥5% between the baseline and last follow-up visit, as previously described [37]. To be able to capture weight loss, we only included subjects with a minimum clinical and anthropometrical follow-up of 12 months. Body mass index (BMI) was calculated as weight in kilograms divided by height in meters squared. Individuals were categorized into three groups according to BMI: normal-weight (BMI<25 Kg/m2), overweight (BMI 25-30 Kg/m2) and obese (BMI>30 Kg/m2). One subject presented with outlier BMI value (51.3 Kg/m2) and thus was excluded from the analyses.
MRI analysis
The details of MRI acquisition and pre-processing are available elsewhere (http://adni-info.org/). All structural MRIs were first processed using the cross-sectional cortical reconstruction stream in Freesurfer v5.1.;(http://surfer.nmr.mgh.harvard.edu). The procedures have been described previously [20, 42]. The cortical thickness (CTh) was calculated as the distance from the grey/white matter boundary closest to the grey/CSF boundary at each vertex. Every estimated surface was checked in a slice-by-slice basis to detect possible segmentation errors. Thirty-three subjects of the 195 initially included in the study were excluded because of segmentation errors. Finally, CTh measure was smoothed using a Gaussian kernel of 15mm full-width at half maximum. Furthermore, the hippocampal volumes were extracted using Freesurfer v5.1 and the adjusted hippocampal volume (HVa) was computed [43, 44].
Statistical methods
Group analyses for demographic and biometric data were done using R statistical software (R Core Team 2014. R: A Language and Environment for Statistical Computing, version 3.2.5. Available at: http://www.r-project.org). Comparisons between the BMI categories were made using ANCOVA with Tukey’s post hoc test correction (p<0.05) for continuous variables, and the chi-square test for categorical variables.
To study the interaction between obesity and weight loss and its impact on the brain structure, we used three diferent approaches: interaction, stratified correlation analysis (primary analyses) and group comparison analysis (secondary analyses). First, we conducted a vertexwise analysis across the whole cortical mantle, showing regions with a BMI by weight-loss group interaction. To further study this relationship, we performed a vertexwise stratified correlation analyses with BMI in the weight stable and weight loss groups separately. Furthermore, we analized the interaction between BMI and weight-loss on the HVa. Finally, in a secondary analysis, we conducted group comparisons between the BMI categories. All analyses included age, sex and triglycerides levels as covariates.
We used monte-carlo simulations as implemented in Freesurfer to correct for multiple comparisons in a cluster-size basis (family-wise error [FWE] correction at p<0.05). The figures show only those results that survived FWE correction.
CONFLICTS OF INTEREST
The authors declare no competing financial interests.
FUNDING
This work was supported by research grants from the Carlos III Institute of Health, Spain (PI17/00279 to AJ, PI14/01126, and PI17/01019 to JF; PI13/01532 and PI16/01825 to RB; PI17/01895 to AL) and the CIBERNED program jointly funded by Fondo Europeo de Desarrollo Regional (FEDER), Unión Europea, “Una manera de hacer Europa”. It has also been supported by “Marató TV3” grants (20141210 to JF and 20161431 to AJ and RB), a grant from the Fundació Bancaria La Caixa (DABNI project) to RB and, in part by Generalitat de Catalunya (PERIS subventions SLT006/17/125 to DA, SLT006/17/95 to EV and SLT006/17/00119 to JF) and by Hospital Clinic de Barcelona (grant “Ajut Josep Font” to AP). Data collection and sharing for this project was funded by the Alzheimer’s Disease Neuroimaging Initiative (ADNI) (National Institutes of Health Grant U01 AG024904) and DOD ADNI (Department of Defense award number W81XWH-12-2-0012). ADNI is funded by the National Institute on Aging, the National Institute of Biomedical Imaging and Bioengineering, and through generous contributions from the following: AbbVie, Alzheimer’s Association; Alzheimer’s Drug Discovery Foundation.
REFERENCES
1. Prince M, Bryce R, Albanese E, Wimo A, Ribeiro W, Ferri CP. The global prevalence of dementia: A systematic review and metaanalysis. Alzheimers Dement. 2013; 9:63-75.e2. https://doi.org/10.1016/j.jalz.2012.11.007.
2. Yang L, Colditz GA. Prevalence of Overweight and Obesity in the United States, 2007-2012. JAMA Intern Med. 2015; 175:1412. https://doi.org/10.1001/jamainternmed.2015.2405.
3. Anstey KJ, Cherbuin N, Budge M, Young J. Body mass index in midlife and late-life as a risk factor for dementia: a meta-analysis of prospective studies. Obes Rev. 2011; 12:e426-37. https://doi.org/10.1111/j.1467-789X.2010.00825.x.
4. Calle EE, Thun MJ, Petrelli JM, Rodriguez C, Heath CW. Body-mass index and mortality in a prospective cohort of U.S. adults. N Engl J Med. 1999; 341:1097-105. https://doi.org/10.1056/NEJM199910073411501.
5. Calle EE, Rodriguez C, Walker-Thurmond K, Thun MJ. Overweight, obesity, and mortality from cancer in a prospectively studied cohort of U.S. adults. N Engl J Med. 2003; 348:1625-38. https://doi.org/10.1056/NEJMoa021423.
6. O’Brien PD, Hinder LM, Callaghan BC, Feldman EL. Neurological consequences of obesity. Lancet Neurol. 2017; 16:465-77. https://doi.org/10.1016/S1474-4422(17)30084-4.
7. Chuang YF, An Y, Bilgel M, Wong DF, Troncoso JC, O’Brien RJ, Breitner JC, Ferruci L, Resnick SM, Thambisetty M. Midlife adiposity predicts earlier onset of Alzheimer’s dementia, neuropathology and presymptomatic cerebral amyloid accumulation. Mol Psychiatry. 2016; 21:910-5. https://doi.org/10.1038/mp.2015.129.
8. Dahl AK, Löppönen M, Isoaho R, Berg S, Kivelä SL. Overweight and obesity in old age are not associated with greater dementia risk. J Am Geriatr Soc. 2008; 56:2261-6. https://doi.org/10.1111/j.1532-5415.2008.01958.x.
9. Emmerzaal TL, Kiliaan AJ, Gustafson DR. 2003-2013: a decade of body mass index, Alzheimer’s disease, and dementia. J Alzheimers Dis. 2015; 43:739-55. https://doi.org/10.3233/JAD-141086.
10. Fitzpatrick AL, Kuller LH, Lopez OL, Diehr P, O’Meara ES, Longstreth WT Jr, Luchsinger JA. Midlife and late-life obesity and the risk of dementia: cardiovascular health study. Arch Neurol. 2009; 66:336-42. https://doi.org/10.1001/archneurol.2008.582.
11. Hughes TF, Borenstein AR, Schofield E, Wu Y, Larson EB. Association between late-life body mass index and dementia: The Kame Project. Neurology. 2009; 72:1741-6. https://doi.org/10.1212/WNL.0b013e3181a60a58.
12. Lennon H, Sperrin M, Badrick E, Renehan AG. The Obesity Paradox in Cancer: a Review. Curr Oncol Rep. 2016; 18:56. https://doi.org/10.1007/s11912-016-0539-4.
13. Niedziela J, Hudzik B, Niedziela N, Gąsior M, Gierlotka M, Wasilewski J, Myrda K, Lekston A, Poloński L, Rozentryt P. The obesity paradox in acute coronary syndrome: a meta-analysis. Eur J Epidemiol. 2014; 29:801-12. https://doi.org/10.1007/s10654-014-9961-9.
14. Banack HR, Stokes A. The “obesity paradox” may not be a paradox at all. Int J Obes (Lond). 2017; 41:1162-3. https://doi.org/10.1038/ijo.2017.99.
15. Stokes A, Preston SH. Smoking and reverse causation create an obesity paradox in cardiovascular disease. Obesity (Silver Spring). 2015; 23:2485-90. https://doi.org/10.1002/oby.21239.
16. Albanese E, Taylor C, Siervo M, Stewart R, Prince MJ, Acosta D. Dementia severity and weight loss: a comparison across eight cohorts. The 10/66 study. Alzheimers Dement. 2013; 9:649-56. https://doi.org/10.1016/j.jalz.2012.11.014.
17. Alhurani RE, Vassilaki M, Aakre JA, Mielke MM, Kremers WK, Machulda MM, Geda YE, Knopman DS, Peterson RC, Roberts RO. Decline in Weight and Incident Mild Cognitive Impairment: Mayo Clinic Study of Aging. JAMA Neurol. 2016; 73:439-46. https://doi.org/10.1001/jamaneurol.2015.4756.
18. Gao S, Nguyen JT, Hendrie HC, Unverzagt FW, Hake A, Smith-Gamble V, Hall K. Accelerated weight loss and incident dementia in an elderly African-American cohort. J Am Geriatr Soc. 2011; 59:18-25. https://doi.org/10.1111/j.1532-5415.2010.03169.x.
19. Müller S, Preische O, Sohrabi HR, Gräber S, Jucker M, Dietzsch J, Ringman JM, Martins RN, McDade E, Schofield PR, Ghetti B, Rossor M, Graff-Radford NR, et al. Decreased body mass index in the preclinical stage of autosomal dominant Alzheimer’s disease. Sci Rep. 2017; 7:1225. https://doi.org/10.1038/s41598-017-01327-w.
20. Fortea J, Sala-Llonch R, Bartrés-Faz D, Lladó A, Solé-Padullés C, Bosch B, Antonell A, Olives J, Sanchez-Valle R, Molinuevo JL, Rami L. Cognitively Preserved Subjects with Transitional Cerebrospinal Fluid β-Amyloid 1-42 Values Have Thicker Cortex in Alzheimer Disease Vulnerable Areas. Biol Psychiatry. 2011; 70:183-90.
21. Fortea J, Vilaplana E, Alcolea D, Carmona-Iragui M, Sánchez-Saudinos MB, Sala I, Antón-Aguirre S, González S, Medrano S, Pegueroles J, Morenas E, Clarimón J, Blesa R, et al. Cerebrospinal fluid β-amyloid and phospho-tau biomarker interactions affecting brain structure in preclinical Alzheimer disease. Ann Neurol. 2014; 76:223-30. https://doi.org/10.1002/ana.24186.
22. Pegueroles J, Vilaplana E, Montal V, Sampedro F, Alcolea D, Carmona-Iragui M, Clarimon J, Blesa R, Lleó A, Fortea J; Alzheimer's Disease Neuroimaging Initiative. Longitudinal brain structural changes in preclinical Alzheimer disease. Alzheimers Dement. 2017; 13:499-509. https://doi.org/10.1016/j.jalz.2016.08.010.
23. Boyle CP, Raji CA, Erickson KI, Lopez OL, Becker JT, Gach HM, Longstreth WT Jr, Teverovskiy L, Kuller LH, Carmichael OT, Thompson PM. Physical activity, body mass index, and brain atrophy in Alzheimer’s disease. Neurobiol Aging. 2015; 36:S194-202. https://doi.org/10.1016/j.neurobiolaging.2014.05.036.
24. Brooks SJ, Benedict C, Burgos J, Kempton MJ, Kullberg J, Nordenskjöld R, Kilander L, Nylander R, Larsson EM, Johansson L, Ahlström H, Lind L, Schiöth HB. Late-life obesity is associated with smaller global and regional gray matter volumes: a voxel-based morphometric study. Int J Obes (Lond). 2013; 37:230-6. https://doi.org/10.1038/ijo.2012.13.
25. Cherbuin N, Sargent-Cox K, Fraser M, Sachdev P, Anstey KJ. Being overweight is associated with hippocampal atrophy: the PATH Through Life Study. Int J Obes (Lond). 2015; 39:1509-14. https://doi.org/10.1038/ijo.2015.106.
26. Driscoll I, Gaussoin SA, Wassertheil-Smoller S, Limacher M, Casanova R, Yaffe K, Resnick SM, Espeland MA. Obesity and Structural Brain Integrity in Older Women: The Women’s Health Initiative Magnetic Resonance Imaging Study. J Gerontol A Biol Sci Med Sci. 2016; 71:1216-22. https://doi.org/10.1093/gerona/glw023.
27. Ho AJ, Stein JL, Hua X, Lee S, Hibar DP, Leow AD, Dinov ID, Toga AW, Saykin AJ, Shen L, Foroud T, Pankratz N, Huentelman MJ, et al. A commonly carried allele of the obesity-related FTO gene is associated with reduced brain volume in the healthy elderly. Proc Natl Acad Sci U S A. 2010; 107:8404-9. https://doi.org/10.1073/pnas.0910878107.
28. Jagust W, Harvey D, Mungas D, Haan M. Central obesity and the aging brain. Arch Neurol. 2005; 62:1545-8. https://doi.org/10.1001/archneur.62.10.1545.
29. Kim H, Kim C, Seo SW, Na DL, Kim HJ, Kang M, Shin HY, Cho SK, Park SE, Lee J, Hwang JW, Jeon S, Lee JM, et al. Association between body mass index and cortical thickness: Among elderly cognitively normal men and women. Int Psychogeriatr. 2015; 27:121-30. https://doi.org/10.1017/S1041610214001744.
30. Raji CA, Ho AJ, Parikshak NN, Becker JT, Lopez OL, Kuller LH, Hua X, Leow AD, Toga AW, Thompson PM. Brain structure and obesity. Hum Brain Mapp. 2010; 31:353-64. https://doi.org/10.1002/hbm.20870.
31. Shaw ME, Sachdev PS, Abhayaratna W, Anstey KJ, Cherbuin N. Body mass index is associated with cortical thinning with different patterns in mid- and late-life. Int J Obes (Lond). 2018; 42:455-61. https://doi.org/10.1038/ijo.2017.254.
32. Taki Y, Kinomura S, Sato K, Inoue K, Goto R, Okada K, Uchida S, Kawashima R, Fukuda H. Relationship between body mass index and gray matter volume in 1,428 healthy individuals. Obesity (Silver Spring). 2008; 16:119-24. https://doi.org/10.1038/oby.2007.4.
33. Walther K, Birdsill AC, Glisky EL, Ryan L. Structural brain differences and cognitive functioning related to body mass index in older females. Hum Brain Mapp. 2010; 31:1052-64. https://doi.org/10.1002/hbm.20916.
34. Widya RL, de Roos A, Trompet S, de Craen AJ, Westendorp RG, Smit JW, van Buchem MA, van der Grond J; PROSPER Study Group. Increased amygdalar and hippocampal volumes in elderly obese individuals with or at risk of cardiovascular disease. Am J Clin Nutr. 2011; 93:1190-5. https://doi.org/10.3945/ajcn.110.006304.
35. Bobb JF, Schwartz BS, Davatzikos C, Caffo B. Cross-sectional and longitudinal association of body mass index and brain volume. Hum Brain Mapp. 2014; 35:75-88. https://doi.org/10.1002/hbm.22159.
36. Driscoll I, Beydoun MA, An Y, Davatzikos C, Ferrucci L, Zonderman AB, Resnick SM. Midlife obesity and trajectories of brain volume changes in older adults. Hum Brain Mapp. 2012; 33:2204-10. https://doi.org/10.1002/hbm.21353.
37. Jimenez A, Pegueroles J, Carmona-Iragui M, Vilaplana E, Montal V, Alcolea D, Videla L, Gala II, Pané A, Casajoana A, Belbin O, Clarimón J, Moizé V, et al; Alzheimer'sDisease Neuroimaging Initiative. Weight loss in the healthy elderly might be a non-cognitive sign of preclinical Alzheimer’s disease. Oncotarget. 2017; 8: 104706-104716. https://doi.org/10.18632/oncotarget.22218.
38. Masters CL, Bateman R, Blennow K, Rowe CC, Sperling RA, Cummings JL. Alzheimer’s disease. Nat Rev Dis Primers. 2015; 1:15056. https://doi.org/10.1038/nrdp.2015.56.
39. Boraxbekk CJ, Stomby A, Ryberg M, Lindahl B, Larsson C, Nyberg L, Olsson T. Diet-Induced Weight Loss Alters Functional Brain Responses during an Episodic Memory Task. Obes Facts. 2015; 8:261-72. https://doi.org/10.1159/000437157.
40. Horie NC, Serrao VT, Simon SS, Gascon MR, dos Santos AX, Zambone MA, del Bigio de Freitas MM, Cunha-Neto E, Marques EL, Halpern A, de Melo ME, Mancini MC, Cercato C. Cognitive Effects of Intentional Weight Loss in Elderly Obese Individuals With Mild Cognitive Impairment. J Clin Endocrinol Metab. 2016; 101:1104-12. https://doi.org/10.1210/jc.2015-2315.
41. Siervo M, Arnold R, Wells JC, Tagliabue A, Colantuoni A, Albanese E, Brayne C, Stephan BC. Intentional weight loss in overweight and obese individuals and cognitive function: a systematic review and meta-analysis. Obes Rev. 2011; 12:968-83. https://doi.org/10.1111/j.1467-789X.2011.00903.x.
42. Fischl B, Dale AM. Measuring the thickness of the human cerebral cortex from magnetic resonance images. Proc Natl Acad Sci U S A. 2000; 97:11050-5. https://doi.org/10.1073/pnas.200033797.
43. Jack CR Jr, Wiste HJ, Knopman DS, Vemuri P, Mielke MM, Weigand SD, Senjem ML, Gunter JL, Lowe V, Gregg BE, Pankratz VS, Petersen RC. Rates of β-amyloid accumulation are independent of hippocampal neurodegeneration. Neurology. 2014; 82:1605-12. https://doi.org/10.1212/WNL.0000000000000386.
44. Jack CR Jr, Knopman DS, Weigand SD, Wiste HJ, Vemuri P, Lowe V, Kantarci K, Gunter JL, Senjem ML, Ivnik RJ, Roberts RO, Rocca WA, Boeve BF, Petersen RC. An operational approach to National Institute on Aging-Alzheimer’s Association criteria for preclinical Alzheimer disease. Ann Neurol. 2012; 71:765-75. https://doi.org/10.1002/ana.22628.