
INTRODUCTION
The fibroblast growth factor receptor (FGFR) family comprises four tyrosine kinase receptors (FGFR1-4). The FGFR pathway mediates basic processes in embryogenesis and plays an important role for cellular proliferation, differentiation and angiogenesis in adult tissue [1, 2]. The receptors are activated by 18 FGF ligands acting in a paracrine or endocrine way [1–4]. The ligands bind to heparan sulfate proteoglycans (HPSGs) on the cell surface consolidating the ligand-receptor bond [5]. Specific binding is ensured by means of alternative splicing of the FGFRs, ligand-receptor specificity [6, 7] or by Klotho proteins as co-factors which facilitate the ligand-receptor interaction in the context of endocrine stimulation [8]. After receptor dimerization and autophosphorylation of the cytoplasmic domain the tyrosine kinase interacts with adapter proteins which activate downstream signaling pathways as RAS-RAF-MAPK, STAT and PI3K-AKT [1, 2]. Recently, different types of FGFR alterations have been found in various cancer entities comprising gene amplifications, translocations, gain of function mutations, ligand-dependent activation or overexpression of FGFRs and FGFs [1, 9, 10]. FGFR1 amplification is present in 20% of squamous cell lung cancer,[11, 12] 5% of small cell lung cancer [13] and in 10% of breast cancers,[14, 15] FGFR2 amplifications or mutations in about 5% of gastric cancer,[16] FGFR3 mutations in 10-15% of muscle invasive bladder cancer [17, 18]. FGFR3 translocations occur in 3-7% of glioblastoma [19, 20] and in 15-20% of myelomas [21, 22]. In these entities, FGFR signaling pathway alterations can drive oncogenesis by excessive cell proliferation, migration, neovascularization and thus have a negative prognostic impact [2].
Beside aberrations in the FGFRs, also FGF ligand alterations play a decisive role. Especially the FGF ligands 3, 4 and 19 have been suggested to be of particular importance. Parish et al. reported on a co-amplification of FGF3,4 and 19 in 5.6% of cancers [23]. Amplification of FGF3 has been described in 15-20% of breast cancers and is associated with a more rapid tumor progression [24]. In most cases, FGF3,4 and 19 are co-amplified since they are localized next to each other in one cluster on the long arm of chromosome 11 (11q13). FGF19 is essential for FGFR1 (and FGFR4) signaling [25].
Given the high prevalence of FGF/FGFR aberrations in advanced cancers and in view of its prognostic impact, numerous selective and unselective FGFR inhibitors are currently being tested in phase I and II clinical trials. The multikinase inhibitor nintedanib, an anti-angiogenic inhibitor of VEGFR and PDGFR with anti-FGFR activity, in combination with chemotherapy has shown to be non inferior to bevacizumab-based regimen in metastatic colorectal cancer in a phase II clinical trial. Furthermore, even mCRC patients who were extensively pretreated benefited from nintedanib in terms of longer progression free survival and better quality of life [26]. Several additional multikinase inhibitors such as lucitanib (active against VEGFR1-3, PDGFRα/β and FGFR1-3), lenvatinib (E7080, Eisai; an inhibitor of FGFR, VEGFR, PDGFR, RET and KIT) or dovitinib (FGFR, VEGFR, PDGFR, CSF-1 and c-kit inhibitor) showed promising response rates in several phase I/II trials in breast cancer, solid tumors and renal carcinomas, respectively [27–29].
Selective FGFR inhibitors, however, are thought to target FGFRs even more specifically while causing less side-effects. In FGFR3 mutant bladder/urothelial cancer and FGFR1 amplified NSCLC the selective FGFR1-3 tyrosine kinase inhibitor BGJ398 has shown partial responses and was well tolerated [30]. Anti-tumor effects were also recognized in cholangiocarcinoma harboring a FGFR2 fusion and in FGFR1 amplified breast cancer [31]. Another potent selective FGFR inhibitor is AZD4547, which has been tested in a phase II clinical trial for patients with advanced breast, lung and gastric cancer harboring FGFR1 or FGFR2 amplifications. Published response rates were 33% in FGFR2 amplified gastroesophageal cancer and 12.5% in FGFR1 amplified breast cancer [32]. The pan-FGFR inhibitor JNJ-42756493 showed partial responses in tumors which harbored a translocation of FGFR2 or FGFR3 [33]. In the phase I study with the pan-FGFR inhibitor BAY1163877 seven patients (87.5%) with urothelial bladder cancer experienced a tumor shrinkage [34].
FGFR or FGF 3,4,19 (11q) genomic amplification, gene fusions or mutations have been used as biomarkers in most clinical trials so far [30, 35, 36]. Some of these trials could demonstrate a correlation between therapeutic response and genomic changes such as amplification measured by fluorescence in situ hybridization (FISH). In contrast, in the phase I study of the pan-FGFR inhibitor BAY1163877 elevated mRNA expression levels of FGFR1-3 analyzed by RNA in situ hybridization were proposed for selection of patients [34]. The majority of tumors which responded showed elevated FGFR mRNA levels but no genomic FGFR alteration [34]. Also in lung cancer and head and neck cancer (treated with BGJ 398) mRNA expression level has been suggested as a potential predictor for anti-FGFR effects [37, 38].
Up to now published data on FGFR alterations in colorectal cancer is very sparse. However, there is a clinical need for targeted treatments. When colorectal cancer is diagnosed in a metastatic state, almost 90% of the patients die within five years after diagnosis (based on SEER DataBase). The introduction of anti-EGFR therapy for RAS wildtype CRC, the anti-angiogenic therapy with VEGF antibodies and immune checkpoint inhibitors for microsatellite instable cancers have improved systemic CRC therapy in recent years. However, there is still a significant percentage of metastatic patients who are not eligible for these treatments or do not respond. Thus, the aim of our study was i) to comprehensively analyze FGFR alterations in metastatic and primary CRC, ii) to investigate the prevalence of the potential predictive biomarkers and iii) to analyze their prognostic relevance.
In this study, we focused on oligometastatic CRC, i.e. on patients with a limited number of resectable liver metastases. These patients form a clinically meaningful but heterogeneous group in terms of prognosis. Many of them can be cured by surgery alone but others progress rapidly and need a continuation of systemic treatment. There is a specific clinical need for prognostic markers in these patients. Moreover, personalized treatment options may help to improve therapy for those patients who are at high risk.
We comprehensively investigated alterations at the genomic and expression levels of FGF/FGFR and compared these findings with data from primary tumors. For the first time, we systematically report on prevalence data of predictive biomarkers which may provide the basis for upcoming clinical trials with anti-FGFR drugs in patients with metastatic colorectal cancer. Moreover, we demonstrate that FGFR3 overexpression defines a clinically highly significant subgroup with worse prognosis. We suggest including particularly these patients in ongoing and upcoming clinical trials with anti-FGFR compounds.
RESULTS
RNA overexpression of FGFR1-3
FGFR1 overexpression was found in 8.5% (four out of 47 evaluable cases) of the liver metastases (Table 1) and in 10.1% (10/99) of the evaluable primary tumors (colon n=7, rectum n=3). FGFR2 overexpression occurred in none of the metastases of our cohort, but in 5.5% (5/91) of the primary tumors (colon n=4, rectum n=1). FGFR3 mRNA overexpression was the most frequent finding across all tissues. 14.9% of the liver metastases showed FGFR3 overexpression (7/47, H-score 200-360, Figure 1). Among the primary tumors FGFR3 mRNA overexpression occurred in 16.2% of cases (18/111; colon n=11, rectum n=7).
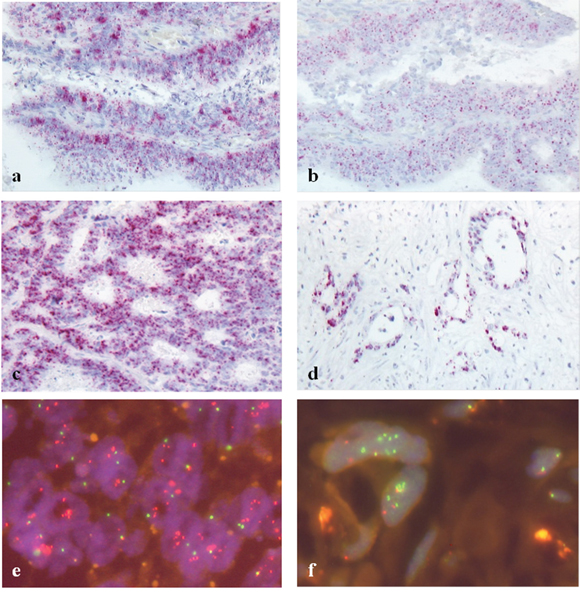
Figure 1: Fibroblast growth factor receptor (FGFR) overexpression (RNA ISH, a-d) and FGFR gene amplification (FISH, e-f) (a+b) FGFR1 (a) and FGFR2 (b) overexpressing colon cancer; H-score 250 and 220, respectively; predominant score 3 for both receptors; (c) FGFR3 overexpressing liver metastasis; H-score 350, predominant score 4; (d) FGFR3 overexpressing liver metastasis; H-score 360, predominant score 4; (e) FGF3,4,19 high-level amplified rectal cancer, (f) FGFR1 high-level amplification in a liver metastasis.
Table 1: FGFR mRNA overexpressing cases, molecular subtypes, gene amplification and clinical data
No. |
RNA ISH |
FISH |
|||||||||
|---|---|---|---|---|---|---|---|---|---|---|---|
Receptor |
Tumor type |
RAS |
PIK3CA |
BRAF |
H-score |
Pred. score |
Ratio |
Average FGF(R) signals (%) |
Cells with ≥5 FGF(R) signals (%) |
Amplification |
|
1 |
FGFR1 |
C |
Mt |
-- |
-- |
250 |
2 |
0.6 |
1.3 |
1.7 |
neg (FGFR1) |
2 |
FGFR1 |
C |
-- |
-- |
-- |
310 |
3 |
1.0 |
2.2 |
1.7 |
neg (FGFR1) |
3 |
FGFR1 |
R |
WT |
-- |
-- |
230 |
2 |
-- |
-- |
-- |
-- |
4 |
FGFR1 |
LM/C |
Mt |
WT |
WT |
200 |
2 |
1.0 |
2.1 |
0 |
neg (FGFR1) |
5 |
FGFR1 |
LM/C |
Mt |
WT |
WT |
210 |
2 |
1.0 |
1.9 |
0 |
neg (FGFR1) |
6 |
FGFR1 |
LM/C |
Mt |
WT |
WT |
210 |
2 |
1.1 |
2.2 |
0 |
neg (FGFR1) |
7 |
FGFR1 |
R |
Mt |
-- |
-- |
230 |
2 |
0.9 |
1.7 |
0 |
neg (FGFR1) |
8 |
FGFR1 |
C |
WT |
-- |
-- |
220 |
2 |
-- |
-- |
-- |
-- |
9 |
FGFR1 |
LM/R |
Mt |
WT |
WT |
260 |
3 |
0.9 |
1.9 |
1.7 |
neg (FGFR1) |
10 |
FGFR2 |
R |
WT |
-- |
-- |
310 |
4 |
1.1 |
2.6 |
8.3 |
neg (FGFR2) |
11 |
FGFR2 |
C |
WT |
-- |
-- |
200 |
2 |
1.0 |
1.9 |
0 |
neg (FGFR2) |
12 |
FGFR3 |
R |
WT |
-- |
-- |
260 |
4 |
1.0 |
1.7 |
0 |
neg (FGFR3) |
13 |
FGFR3 |
LM/R |
WT |
WT |
WT |
325 |
4 |
1.2 |
2.1 |
0 |
neg (FGFR3) |
14 |
FGFR3 |
R |
WT |
-- |
-- |
260 |
4 |
1.2 |
2.0 |
0 |
neg (FGFR3) |
15 |
FGFR3 |
C |
WT |
-- |
-- |
280 |
3 |
1.0 |
1.7 |
2.0 |
neg (FGFR3) |
16 |
FGFR3 |
C |
WT |
-- |
-- |
200 |
2 |
1.1 |
1.7 |
0 |
neg (FGFR3) |
17 |
FGFR3 |
C |
Mt |
-- |
-- |
260 |
2 |
1.1 |
2.2 |
0 |
neg (FGFR3) |
18 |
FGFR3 |
C |
-- |
-- |
-- |
240 |
2 |
-- |
-- |
-- |
-- |
19 |
FGFR3 |
LM/R |
WT |
WT |
WT |
210 |
2 |
1.2 |
2.2 |
6.7 |
neg (FGFR3) |
20 |
FGFR3 |
R |
WT |
-- |
-- |
340 |
4 |
1.0 |
1.7 |
0 |
neg (FGFR3) |
21 |
FGFR3 |
LM/C |
Mt |
WT |
WT |
340 |
4 |
1.1 |
1.8 |
0 |
neg (FGFR3) |
22 |
FGFR3 |
LM/R |
WT |
WT |
WT |
350 |
4 |
1.0 |
1.7 |
0 |
neg (FGFR3) |
23 |
FGFR3 |
LM/R |
Mt |
WT |
WT |
310 |
4 |
1.2 |
1.9 |
0 |
neg (FGFR3) |
24 |
FGFR3 |
LM/C |
Mt |
WT |
WT |
200 |
2 |
1.1 |
2.2 |
0 |
neg (FGFR3) |
25 |
FGFR3 |
R |
-- |
-- |
-- |
310 |
4 |
0.9 |
1.9 |
0 |
neg (FGFR3) |
26 |
FGFR3 |
C |
WT |
-- |
-- |
300 |
3 |
0.9 |
1.7 |
0 |
neg (FGFR3) |
27 |
FGFR3 |
C |
WT |
-- |
-- |
220 |
3 |
1.0 |
1.5 |
0 |
neg (FGFR3) |
28 |
FGFR1 |
C |
WT |
-- |
-- |
250 |
3 |
1.2 |
4.1 |
45 |
neg (FGFR1) |
29 |
FGFR1 |
C |
WT |
-- |
-- |
220 |
2 |
1.2 |
2.9 |
5 |
neg (FGFR1) |
30 |
FGFR1 |
R |
-- |
-- |
-- |
210 |
2 |
1.0 |
2.4 |
1.7 |
neg (FGFR1) |
31 |
FGFR1 |
C |
WT |
-- |
-- |
340 |
3 |
1.6 |
2.0 |
0 |
neg (FGFR1) |
32 |
FGFR1 |
C |
-- |
-- |
-- |
250 |
3 |
-- |
-- |
-- |
-- |
33 |
FGFR2 |
C |
Mt |
-- |
-- |
220 |
3 |
1.1 |
2.0 |
0 |
neg (FGFR2) |
34 |
FGFR2 |
C |
Mt |
-- |
-- |
200 |
2 |
1.0 |
2.1 |
1.7 |
neg (FGFR2) |
35 |
FGFR3 |
LM/R |
WT |
WT |
WT |
360 |
4 |
1.2 |
2.3 |
3.3 |
neg (FGFR3) |
36 |
FGFR3 |
R |
WT |
-- |
-- |
310 |
4 |
1.1 |
2.2 |
0 |
neg (FGFR3) |
37 |
FGFR3 |
R |
WT |
-- |
-- |
310 |
4 |
0.9 |
1.6 |
0 |
neg (FGFR3) |
Overview over all cases with any FGFR mRNA overexpression, based on high RNA ISH levels (cut-off: H-score ≥200). Pred. Score, predominant score; M, male; F, female;
Tumor types: C, primary colonic cancer; R, primary rectal cancer; LM/C, liver metastasis with primary tumor in the colon; LM/R, liver metastasis with primary tumor in the rectum; Pred. score, predominant score; Mt, mutation; WT, wildtype; neg, negative; pos, positive; --, data not available HL, high level; LL, low level.
RNA overexpression was measured by in situ hybridization and defined by an H-score ≥200. We also evaluated the predominant score as another criterion for mRNA overexpression (positive cases defined based on the cut-off ≥3). For FGFR3, the two scores correlated highly significantly in metastases (p≤0.001). In primary tumors, both scoring approaches correlated highly significantly for FGFR1, FGFR2 and FGFR3 (p≤0.001).
Analysis of gene amplification of FGF receptors and ligands, gene translocations and cases with multiple aberrations
We found a high-level amplification of FGFR1 in 4.8% (two out of 42 evaluable cases) among liver metastases (Table 2, Figure 1). One of those cases originated from a rectum cancer, the other from a colon carcinoma. The primary tumor as well as a lymph node metastasis of the latter case could also be investigated. Both of these materials did not formally reach the high level of amplification but were quite close to it (FGFR1/CEN8 ratio 1.9; see case no. 4.1, Table 3 , for details). This particular patient had received chemotherapy within 6 months before resection of the metastasis.
Table 2: FISH positive cases, corresponding molecular subtypes, RNA ISH and clinical data
No. |
FISH |
RNA ISH |
|||||||||
|---|---|---|---|---|---|---|---|---|---|---|---|
Receptor/ |
Tumor type |
RAS |
PIK3CA |
BRAF |
Ratio |
Average FGF(R) signals (%) |
Cells with ≥5 FGF(R) signals (%) |
Ampli-fication level |
H-score |
Result |
|
1 |
FGFR1 |
C |
WT |
-- |
-- |
1.8 |
5.7 |
60 |
Low |
100 |
neg (FGFR1) |
2*(36) |
FGFR1 |
R |
WT |
-- |
-- |
1.2 |
5.5 |
66.7 |
Low |
101 |
neg (FGFR1) |
3 |
FGFR1 |
R |
WT |
-- |
-- |
3.0 |
4.7 |
56.7 |
High |
101 |
neg (FGFR1) |
4 |
FGFR1 |
R |
Mt |
-- |
-- |
4.4 |
11.4 |
95 |
High |
180 |
neg (FGFR1) |
5 |
FGFR1 |
R |
WT |
-- |
-- |
2.1 |
3.2 |
33.3 |
High |
101 |
neg (FGFR1) |
6 |
FGFR1 |
LM/C |
WT |
WT |
WT |
2.0 |
3.6 |
35.0 |
High |
105 |
neg (FGFR1) |
7*(35) |
FGFR1 |
LM/R |
WT |
WT |
WT |
2.4 |
4.9 |
48.3 |
High |
135 |
neg (FGFR1)pos (FGFR3) |
8*(37) |
FGF3,4,19 |
R |
WT |
-- |
-- |
2.9 |
5.1 |
45.0 |
High |
310 |
pos (FGFR3) |
9*(28) |
FGF3,4,19 |
C |
WT |
-- |
-- |
12.9 |
29.9 |
100 |
High |
250 |
pos (FGFR1) |
*(X), number of the same case in Table 1 ; M, male; F, female; tumor types: C, primary colonic cancer; R, primary rectal cancer; LM/C, liver metastasis with primary tumor in the colon; LM/R, liver metastasis with primary tumor in the rectum; Mt, mutation; WT, wildtype; neg, negative; pos, positive; --, data not available.
Table 3: Patients with multiple synchronous or metachronous metastases, cases where multiple tumor manifestations were investigated
No. |
RNA overexpression |
Gene amplification |
Molecular |
||||
|---|---|---|---|---|---|---|---|
Origin of primary tumor |
Time period from first metastasis to subsequent metastases (months) |
FGFR1 (result) |
FGFR2 |
FGFR3 |
FGFR1 |
RAS/ |
|
1.1 |
R |
0 |
0 |
100 |
160 |
1.2/2.4 |
WT |
1.2 |
8 |
100 |
45 |
140 |
1.2/2.5 |
WT |
|
1.3 |
10 |
120 |
100 |
320 |
1.2/2.5 |
WT |
|
1.4 |
10 |
100 |
100 |
260 |
1.1/2.1 |
WT |
|
1.5*(22) |
10 |
20 |
100 |
350 |
1.3/2.5 |
WT |
|
2.1 |
R |
0 |
NA |
NA |
NA |
1.1/2.0 |
WT |
2.2 |
0 |
NA |
100(neg) |
140 |
1.0/1.8 |
WT |
|
2.3 |
0 |
NA |
NA |
NA |
1.2/2.3 |
WT |
|
2.4 |
0 |
NA |
100 |
100 |
1.0/2.0 |
WT |
|
3.1 |
C+R1 |
0 |
105 |
110 |
130 |
0.5/1.2 |
Mt |
3.2 |
NA |
0 |
130 |
140 |
0.5/1.1 |
Mt |
|
4.12§(6) |
C |
0 |
105 |
100 |
130 |
2.0/3.6 |
WT |
*(X), number of the same case in Table 1 ; §(X), number of the same case in Table 2 ; C, colon; R, rectum; WT, wildtype; Mt, mutation; GCN, average gene copy number; neg, negative; pos, positive; NA, not available.
1This patient had a colon (cecum) and a rectal carcinoma simultaneously, hence it remains unclear, which carcinoma caused the metastases.
2 The primary tumor as well as a lymph node metastasis did not show FGFR1 high-level amplification, but low-level amplifications (colon carcinoma: FGFR1 ratio 1.9, avGCN 5.0, cells with ≥5 FGFR1 signals: 50%; lymph node metastasis: FGFR1 ratio 1.9, avGCN 5.7, cells with ≥5 FGFR1 signals: 65%).
6.3% of evaluable primary tumors (5/80) showed an amplification of FGFR1 and 2.2% harbored a FGF3,4,19 amplification (2/89). One FGF3,4,19 amplified colon carcinoma showed an extraordinary high amplification pattern with a FGF-3,4,19/CEN11 ratio of 12.9 and an average gene copy number of 29.9. Among metastases no FGF-3,4,19 amplified cases were seen. Neither amplifications of FGFR2, FGFR3 or FGFR4 nor any gene rearrangements of FGFR1 or FGFR3 were observed.
In summary, twelve metastases and 30 primary tumors harbored any alteration in the FGFR pathway regardless of the type of aberration or the affected receptor. For both cohorts FGFR3 overexpression was the most frequent aberration in this context.
Moreover, we also recognized tumors with multiple FGFR aberrations (one of the liver metastases and 9 primary tumors; among them 6 colon carcinomas, mostly right-sided, n=5, 3 rectal carcinomas; Table 1, Figure 2). FGF3,4,19 amplification was always associated with mRNA overexpression, either of FGFR1 or FGFR3. FGFR1 amplification appeared either independently or in two cases in association with FGFR3 overexpression. Overexpression of more than one type of FGFR mRNA occurred in various cases.
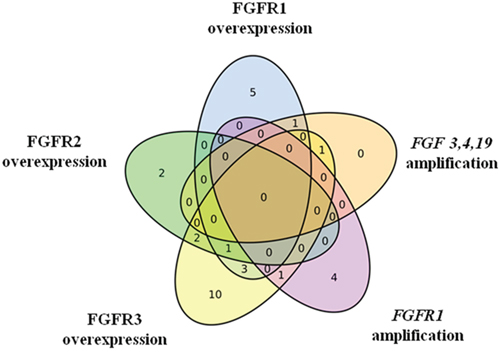
Figure 2: FGFR aberrations in primary tumors. Venn diagram shows that many tumors harbor multiple alterations but FGFR3 overexpression is by far the most common event.
We could investigate more than one metastasis of three patients. One of these patients (patient 1 in Table 3 ) underwent subsequent resection of five metastases. Interestingly, only the three metastases that occurred the latest showed an overexpression of FGFR3 whereas the two earlier lesions harbored no aberration in the FGFRs. This might indicate that FGFR alterations might be a late event in tumor progression. The patient had received chemotherapy in combination with EGFR antibodies prior to occurrence of the FGFR3 positive metastases. We did not find significant differences in two more patients with multiple synchronous or metachronous metastatic lesions (Table 3).
Correlation of amplification and mRNA overexpression with clinico-pathologic data and molecular subtypes
In metastatic lesions, we found a significant correlation between overall and cancer specific survival and FGFR alterations. FGFR3 mRNA overexpression was significantly associated with reduced overall survival (p=0.0152, HR=3.14 [1.19-8.31]; Figure 3, Table 4 ) and worse cancer specific survival (p=0.00497, HR=3.8 [1.4-10.35]; not shown) in metastasized CRC. In view of FGFR3 as a potential therapeutic option, it is noteworthy that less than 50% of the liver metastases with FGFR3 overexpression were associated with RAS mutations (see below). BRAF and PIK3CA were wildtype in all FGFR3 overexpressing cases.
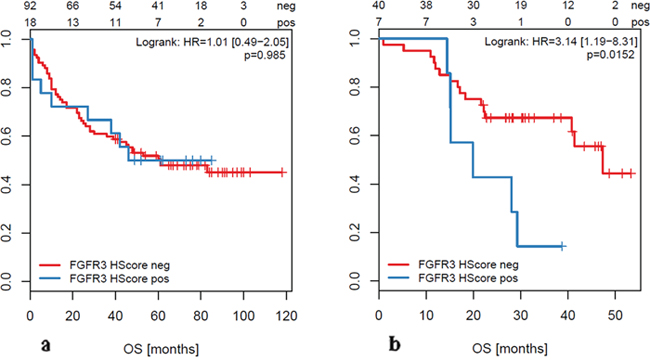
Figure 3: Overall Survival (OS) of patients with FGFR3 overexpression (based on H-score ≥200) measured in primary tumors (a) and in metastases (b).
Table 4: Prognostic significance of FGF/FGFR gene amplification and FGFR overexpression in primary and oligometastatic CRC
Lesion |
Receptor/ ligand |
Status |
Events/total |
Median overall survival in months (95%CI) |
Log rank test |
|---|---|---|---|---|---|
Primary tumors |
|||||
FGFR1 |
Amplified |
3/5 |
38 (3-NA) |
||
non-amplified |
33/73 |
NA (42-NA) |
P= 0.404 |
||
FGF 3,4,19 |
amplified |
2/2 |
11.5 (10-NA) |
||
non-amplified |
41/85 |
NA (38-NA) |
P= 0.059 |
||
FGFR1 |
Overexpression |
7/10 |
28 (7-NA) |
||
no overexpression |
47/88 |
53 (38-NA) |
P= 0.228 |
||
FGFR2 |
Overexpression |
3/5 |
46 (42-NA) |
||
no overexpression |
47/85 |
53 (28-NA) |
P= 0.99 |
||
FGFR3 |
Overexpression |
9/18 |
46 (27-NA) |
||
no overexpression |
48/92 |
61 (39-NA) |
P= 0.985 |
||
Metastases |
FGFR1 |
Amplified |
2/2 |
12.6 (5.24-NA) |
|
non-amplified |
15/40 |
47.4 (40.79-NA) |
P= 0.00111 |
||
FGF 3,4,19 |
Amplified |
0 |
NA |
||
non-amplified |
24/51 |
41.4 (28.1-NA) |
NA |
||
FGFR1 |
Overexpression |
1/4 |
NA (22.2-NA) |
||
no overexpression |
21/43 |
40.8 (28.1-NA) |
P= 0.428 |
||
FGFR2 |
Overexpression |
0 |
NA |
||
no overexpression |
21/45 |
41.4 (28.1-NA) |
NA |
||
FGFR3 |
Overexpression |
6/7 |
19.9 (15.1-NA) |
||
no overexpression |
16/40 |
47.4 (40.8-NA) |
P= 0.0152 |
Gene amplification was measured by FISH, overexpression by RNA ISH, based on H-score; CI, confidence interval; NA, not available.
Furthermore, we also recognized an association between FGFR1 amplification and overall survival (p=0.00111, HR=8.83 [1.82−42.95]) in metastatic patients (Table 4). However, since there were only two FGFR1 amplified metastases in our cohort, the number of positive cases is too small and larger case numbers would be required to confirm this finding.
For metastases, there was no association between FGFR overexpression or amplification and age of the patient, gender, localization of the primary tumor (colon vs. rectum, right-sided vs. left-sided colon), microsatellite instability as well as molecular subtypes.
We did not find any significant association between FGFR alterations and clinico-pathologic data such as age, gender, size or location of the tumor (right-sided vs. left-sided), lymph node or distant metastases, microsatellite instability, KRAS mutation and overall survival in primary tumors. In sharp contrast to the cohort of oligo-metastatic CRC, there was no positive correlation between FGFR3 overexpression and survival in primary CRC (p=0.985, HR=1.01 [0.49-2.05]; Figure 3). Among our cohort of primary tumors, there were 33 (23.6%) metastatic cases. Also in this subgroup, there was no correlation between FGFR3 overexpression (measured in the primary tumor) and overall survival (log rank test; p=0.992). Comparing primary tumors with and without metastases in terms of FGFR amplification or mRNA overexpression we did not see any significant difference between the two groups.
FGFR3 overexpression occurred against a background of RAS wildtype in 57.1% of metastases (Table 1). All of them were wildtype for BRAF and PIK3CA. The metastases showing FGFR1 overexpression (n=4) were all RAS mutated, whereas BRAF and PIK3CA were wildtype. FGFR1 amplified liver metastases (n=2) were both RAS, BRAF and PIK3CA wildtype (Table 2). Statistically, we did not find a significant correlation between FGFR amplification or overexpression and the mutational status of RAS, BRAF and PIK3CA in the cohort of metastases. Only three primary tumors with FGFR3 overexpression were RAS mutated. The percentages of RAS mutated cases were 50% and 29% among primary cancer with FGFR2 and FGFR1 overexpression, respectively. Concerning the FGFR1 amplified primary tumors (n=5) only one harbored a RAS mutation. Both FGF 3,4,19 amplified primary tumors were RAS wildtype (Table 2). In primary tumors which harbored more than one FGFR aberration a significantly higher frequency of RAS mutations could not be recognized in comparison to those with single changes.
DISCUSSION
Colorectal cancer is one of the leading causes of cancer related deaths worldwide. According to the Surveillance, Epidemiology and End Results (SEER) DataBase the incidence of colorectal cancer is 135,430 in the US for 2017 and more than 50,000 patients are estimated to die of this disease annually. 39% of colorectal tumors are diagnosed in a localized stage and have an excellent prognosis with a 5-year-relative-survival of 89.9%. Even if the tumor has metastasized to the regional lymph nodes, the 5-year-survival is still 71.3% if an adequate therapy is applied. However, the occurrence of distant metastases defines a clinically fatal event in many cases. In a metastatic state, accounting for 21% of all CRC patients, the 5-year-relative-survival rate drops dramatically to 13.9% (SEER Database). Despite of multimodal up-to-date treatment regimens consisting of local intervention including surgery of metastases, chemotherapy in combination with monoclonal EGFR and VEGF antibodies, many patients still experience tumor recurrence and have a poor outcome. Novel innovative, personalized therapies may contribute to improved treatments. Oligometastatic patients with a limited number of liver metastases form a distinct clinical subgroup of CRC patients. Clinical outcome varies strongly within this group and efficient therapies are limited. Many of these patients have already received chemotherapy with or without antibody treatment prior to metastatic disease. Some of them can be cured by surgery or benefit from continuation of systemic treatment but others suffer from a progressive and often deadly disease. Currently, biomarkers have not yet been comprehensively established which allow prognostication and therapy selection in this clinically relevant subgroup.
All data that have been published on FGFR aberrations in CRC so far focused solely on primary tumors. Only few publications have described alterations of FGFR1 [39, 40] or other FGFR genes [41], [42] up to now which are basically in line with our findings in primary colorectal cancers. However, in a very recent publication no gene amplifications of FGFR 1-4 have been found [43]. A systematic overview over FGF/FGFR alterations in CRC has not yet been published.
In this study, we provide the first comprehensive data set on the prevalence of alterations in the FGFR1-4 genes and the FGF ligands FGF3,4 and 19 in oligometastatic CRC patients. We demonstrate that both gene amplification and overexpression occur in a subset of these patients. Moreover, we provide first evidence that FGFR3 overexpression (measured by RNA in situ hybridization in metastatic tissue) defines a specific subgroup with a significantly worse outcome (median overall survival 19.9 vs. 47.4 months, hazard ratio 3.14). In contrast, FGFR3 overexpression in primary tumors was not correlated with survival even if patients had synchronous distant metastases. Although only rarely observed, FGFR1 amplification was significantly associated with a shortened overall survival in oligometastatic patients (median OS 12.6 vs. 47.4 months, HR=8.83).
In contrast to other tumor entities we could not demonstrate any FGFR gene fusions in our cohort. This may indicate that these changes play a minor role in colorectal cancer. However, we detected a number of gene copy number changes along with RNA overexpression. In our cohort, we could demonstrate FGFR1 gene amplification, FGFR1 and FGFR3 overexpression in 4.8%, 8.5% and 14.9% of the liver metastases, respectively. FGFR2 overexpression and FGF3,4,19 gene amplification were seen in primary tumors but not in our series of metastases indicating that these changes play probably a minor role in metastatic disease. Occasionally, tumors showed even multiple aberrations in the FGFR axis. We observed one case with multiple metachronous metastases where only the most recent lesions were FGFR3 positive. This might point towards the fact that FGFR3 overexpression may also evolve during tumor progression under treatment.
FGFRs and their ligands constitute a group of potential therapeutic targets in human cancers. A number of selective and non-selective tyrosine kinase inhibitors are currently studied in clinical trials in various tumor entities. Since FGFR signaling can be activated by different mechanisms, i.e. activating gene mutations, translocations, amplifications, overexpression or a combination of alterations, selection of the most appropriate predictive biomarker is crucial. To the best of our knowledge, activating FGFR mutations have never been described to play a significant role in colorectal cancer so far. Therefore, we focused on gene amplification and mRNA overexpression of FGF receptors and selected ligands which are most likely to occur in carcinomas and to represent potential therapeutic targets also in colorectal cancer. In our work, we studied extensively the prevalence of FGFR and FGF3,4,19 alterations in primary CRC and metastatic lesions and describe methods of biomarker evaluation. The most frequent change was an overexpression of FGFR3 which has not yet been described in this entity. This change was directly measured in tumor cells by applying an in situ approach. The used technology is readily applicable to clinical samples under routine conditions and is probably superior to immunohistochemistry. We decided against the usage of immunohistochemistry since stainings with currently available antibodies provided predominantly disappointing results and do not reach the level of quality and standardization required for routine applications. In a well conducted comprehensive study on FGFR3 alterations in bladder cancer Guancial et al. failed to demonstrate any clinically meaningful correlation of FGFR IHC. The authors themselves conclude that IHC staining does not appear to have prognostic or predictive value [44]. Therefore we preferred to apply RNA-ISH, a novel technique, which has also been used for patient selection in a recent phase I trial [34]. The preliminary response data from that early trial together with our findings on prevalence and prognostic impact make FGFR3 overexpression a potential therapeutic target also in metastatic colorectal cancer. Especially those oligometastatic CRC patients with worse prognosis might benefit from an anti-FGFR3 treatment. Therefore, we provide a possible rationale for future clinical research in that field and suggest including this subgroup in upcoming clinical trials with such drugs.
Limitations of our study were its retrospective nature and the small number of analyzed cases. Subsequent studies and larger cohorts will be required to confirm our results. These upcoming studies should also include further locations of metastases such as e.g. lung, since also the hepatic tumor environment comprising hepatocytes, stellate cells and Kupffer cells might have an influence on tumor behavior. However, in this study we intended to focus on liver metastases of oligometastatic CRC in order to present a rather homogenous cohort.
Furthermore, FGFR changes, especially FGFR3 overexpression are likely to occur also in more advanced colorectal cancers which we did not include in our investigation, i.e. tumors with metastases at multiple sites. Thus, we suggest analyzing these cases in future studies, too. In this study tumors and metastases were analyzed by using tissue microarrays. Therefore, we suppose that the number of cases with FGFR alterations might be even higher due to intratumoral heterogeneity which we did not fully capture.
Despite these limitations we provide first evidence that FGFR aberrations might represent potential therapeutically tractable events in a subset of colorectal cancer patients with FGFR3 mRNA overexpression being the most frequent alteration. The latter change, if measured in metastatic tissue, defines a subgroup with poor outcome in metastatic CRC. Thus, our data might serve as a basis for future clinical trials with FGFR-targeted therapies.
MATERIALS AND METHODS
Patients’ samples
This study has been carried out with tumor tissue of 195 patients. We investigated two cohorts: i) 140 primary colorectal tumors, thereof 70 colonic and 70 rectum carcinomas; ii) 63 liver metastases of CRC (55 patients, among them three with multiple lesions). Primary tumors and metastases originated from different patients. All samples derived from surgical specimens of either primary cancers or metastatic lesions and have been diagnosed by experienced pathologists. Metastases have been collected between 2011 and 2014 from liver surgery of oligometastatic patients. The patient cohort was characterized in terms of demographics, clinical baseline data, and treatment regimens. Follow-up examinations were performed according to individual physicians’ discretion and data were obtained either from the local clinical cancer registry or the treating physician. Overall survival (OS) after primary surgical treatment (OS primary tumor) was defined as the interval between the surgical resection of the primary tumor and cancer-related death. Baseline patients’ characteristics are summarized in Supplementary Table 1.
All tumor samples were examined by using tissue microarrays (TMAs) with a core needle diameter of 1 mm. This project was approved by the local ethics committee (application number 21/3/11).
Fluorescence in situ hybridization (FISH)
All tumor samples were analyzed with fluorescence in situ hybridization (FISH) using a set of appropriate FISH probes for the detection of gene amplifications and chromosomal translocations (ZytoLight SPEC FGFR1/CEN 8 Dual Color Probe, ZytoLight SPEC FGFR2/CEN10 Dual Color Probe, ZytoLight SPEC FGFR3/CEN4 Dual Color Probe, ZytoLight SPEC FGF3,4,19/CEN 11 Dual Color Probe, ZytoLight SPEC FGFR1 Dual Color Break Apart Probe (ZytoVision, Bremerhaven, Germany), Poseidon FGFR4 (5q35)/5q11.2 Probe (Kreatech, Amsterdam, Netherlands), Agilent Sure FISH FGFR3 (BA) probe (Agilent Technologies, CA, USA)). Hybridization and evaluation were performed as previously published [45]. Sixty tumor cell nuclei were analyzed in each tumor by counting green and orange signals of gene amplification probes. Break apart probes for the detection of rearrangements were evaluated in 50 contiguous tumor cell nuclei where tumors with ≥15% split orange and green signals were considered positive as previously described [46, 47]. In 10 cases with insufficient tissue or signal quality we accepted a minimum of 20 evaluable tumor cells.
In terms of gene amplification assays tumors were evaluated by applying a scoring system which has been established previously [45] and categorized into following groups:
high-level amplification was defined as
target gene/centromere ratio ≥2.0 or
average target gene copy number per cell of ≥6.0 or
the percentage of tumor cells containing ≥15 target signals or large clusters is ≥10%;
low-level amplification was defined as the percentage of tumor cells containing ≥5 target gene signals is ≥50%
all other tumors were classified as negative.
RNA in situ hybridization (RNA ISH)
RNA in situ hybridization for semi-quantitative determination of mRNA expression levels of FGFR1-3 was performed by using the ACD RNAscope Assay red detection kit (Advanced cell diagnostics, CA, USA) following the protocols suggested by the manufacturer. Briefly, 4μm thin formalin-fixed and paraffin-embedded TMA sections (FFPE) mounted on superfrost plus slides (Menzel Gläser, Thermo Scientific, Germany) underwent pretreatment with heat and protease. Afterwards, FGFR1-3 specific RNA probes were hybridized to the target RNA. Scoring of FGFR mRNA expression has been made according to the manufacturer’s recommendations: score 0, no staining or less than 1 dot to every 10 cells (40x magnification); score 1, 1-3 dots/cell (visible at 20-40x magnification); score 2, 4-10 dots/cell, very few dot clusters (visible at 20-40x magnification); score 3, >10 dots/cell, less than 10% positive cells have dot clusters (visible at 20x magnification); score 4, >10 dots/cell, more than 10% of signals are organized in clusters (visible at 20x magnification) [48]. On the basis of these scores the H-score is calculated according to the following equation: Score 0*0 + score 1*1 + score 2*2 + score 3*3 +score 4*4. Thus, the result ranged from 0 to 400 maximum, whereas mRNA overexpression was defined by an H-score of ≥200. Besides that, we also applied the predominant score as a criterion for mRNA overexpression with score ≥3 defining mRNA overexpression. The H-score and the predominant score were correlated afterwards. For subsequent statistical analysis, cases were considered as “RNA overexpression positive” based on the H-score with the cut-off at ≥200.
Molecular subtyping of cases
All primary tumors were analyzed for KRAS exon 2 mutations. For metastases, molecular analyses of KRAS, NRAS and BRAF were carried out by using the Qiagen therascreen kits (therascreen BRAF Pyro Kit, therascreen RAS Extension Pyro Kit, therascreen KRAS Pyro Kit, therascreen NRAS Pyro Kit) as previously described [49]. PIK3CA was analyzed by applying high resolution melting analysis (HRM), mutations were confirmed by Sanger sequencing as described beforehand [50]. Mismatch repair deficiency/microsatellite instability (MSI) was evaluated by means of immunohistochemistry following the locally established protocol with the ready to use antibodies MLH1 (Clon ES05), MSH2 (Clon FE11), MSH6 (Clon Epi 49) and PMS2 (Clon EP51) (Dako, Agilent technologies, Glostrup, Denmark).
Statistical analysis
FGFR aberration numbers in primary tumors were visualized with the R package 'VennDiagram' (version 1.6.17). Survival analysis on time-to-event data was conducted with the R package 'survival' (version 2.40) [51]. Kaplan-Meier curves of overall survival were compared using the log rank test. Data analyses were performed with the statistical computing software R, version 3.2.2 and with the SPSS 22.0 software (IBM, Armonk, NY, USA). Fisher’s Exact and chi-square test were applied to compare FGFR positive and FGFR negative cases with regard to clinicopathologic parameters and molecular subtypes. T-tests were applied to compare the age of patients with FGFR positive and negative lesions. All tests were two-sided; p<0.05 was considered positive.
Abbreviations
(av)GCN: (average) Gene Copy Number; CEN: Centromere; CI: Confidence Interval; CSF-1: Colony Stimulating Factor-1; EGFR: Epidermal Growth Factor Receptor; FFPE: Formalin Fixed and Paraffin Embedded; FGF(R): Fibroblast Growth Factor (Receptor); FISH: Fluorescence in situ hybridization; HPSGs: Heparan Sulfate Proteoglycans; HR: Hazard Ratio; HRM: High Resolution Melting (Analysis); (K)RAS: (Kirsten) Rat Sarcoma; LM: Liver Metastasis; MAPK: Mitogen-activated Protein Kinase; (m)CRC: (metastatic) Colorectal Cancer; (m)OS: median Overall Survival; (m)RNA: (messenger) Ribonucleic Acid; MSI: Microsatellite Instability; NSCLC: Non-Small Cell Lung Cancer; PDGFR: Platelet Derived Growth Factor Receptor; PI3K: Phosphoinositide-3-Kinase; PIK3CA:Phosphatidylinositol-4,5-Bisphosphate 3-Kinase Catalytic Subunit Alpha; RNA ISH: RNA in situ hybridization; SEER (Database): Surveillance, Epidemiology and End Results; STAT: Signal Transducers and Activators of Transcription; TMAs: Tissue Microarrays; VEGFR: Vascular Endothelial Growth Factor Receptor; WT: Wild Type.
Author contributions
HUS, TB and AB planned the work. AK, MG, DZ, TH, SH, LL, KRJ performed assays and participated in data acquisition. LCC, KH, JR, PS, MG and AB participated in clinico-pathologic data generation. JEF, KS, KRJ and HUS performed molecular analyses. AW, AB, LCC, JEF and TB participated in statistical evaluation of data. JEF, HUS, AB wrote the manuscript draft. All authors approved the final manuscript.
CONFLICTS OF INTEREST
The authors declare that there are no competing interests.
FUNDING
This work has been supported by the e:BIO initiative of the German Ministry of Education and Research (BMBF). TB, AB and HUS were funded by the MetastaSys consortium (0316173A) within that e:BIO initiative. HUS was supported by a grant from Novartis Oncology. This funding body had no role in the design of the study and collection, analysis, and interpretation of data and in writing the manuscript.
REFERENCES
1. Eswarakumar VP, Lax I, Schlessinger J. Cellular signaling by fibroblast growth factor receptors. Cytokine Growth Factor Rev. 2005; 16:139-49. https://doi.org/10.1016/j.cytogfr.2005.01.001.
2. Turner N, Grose R. Fibroblast growth factor signalling: from development to cancer. Nat Rev Cancer. 2010; 10:116-29. https://doi.org/10.1038/nrc2780.
3. Beenken A, Mohammadi M. The FGF family: biology, pathophysiology and therapy. Nat Rev Drug Discov. 2009; 8:235-53. https://doi.org/10.1038/nrd2792.
4. Goetz R, Mohammadi M. Exploring mechanisms of FGF signalling through the lens of structural biology. Nat Rev Mol Cell Biol. 2013; 14:166-80. https://doi.org/10.1038/nrm3528.
5. Ori A, Wilkinson MC, Fernig DG. The heparanome and regulation of cell function: structures, functions and challenges. Front Biosci. 2008; 13:4309-38.
6. Zhang X, Ibrahimi OA, Olsen SK, Umemori H, Mohammadi M, Ornitz DM. Receptor specificity of the fibroblast growth factor family. The complete mammalian FGF family. J Biol Chem. 2006; 281:15694-700. https://doi.org/10.1074/jbc.M601252200.
7. Mohammadi M, Olsen SK, Ibrahimi OA. Structural basis for fibroblast growth factor receptor activation. Cytokine & Growth Factor Reviews. 2005; 16:107-37. https://doi.org/10.1016/j.cytogfr.2005.01.008.
8. Kurosu H, Ogawa Y, Miyoshi M, Yamamoto M, Nandi A, Rosenblatt KP, Baum MG, Schiavi S, Hu MC, Moe OW, Kuro-o M. Regulation of fibroblast growth factor-23 signaling by klotho. J Biol Chem. 2006; 281:6120-3. https://doi.org/10.1074/jbc.C500457200.
9. Dienstmann R, Rodon J, Prat A, Perez-Garcia J, Adamo B, Felip E, Cortes J, Iafrate AJ, Nuciforo P, Tabernero J. Genomic aberrations in the FGFR pathway: opportunities for targeted therapies in solid tumors. Ann Oncol. 2014; 25:552-63. https://doi.org/10.1093/annonc/mdt419.
10. Grose R, Dickson C. Fibroblast growth factor signaling in tumorigenesis. Cytokine Growth Factor Rev. 2005; 16:179-86. https://doi.org/10.1016/j.cytogfr.2005.01.003.
11. Preusser M, Berghoff AS, Berger W, Ilhan-Mutlu A, Dinhof C, Widhalm G, Dieckmann K, Wohrer A, Hackl M, von Deimling A, Streubel B, Birner P. High rate of FGFR1 amplifications in brain metastases of squamous and non-squamous lung cancer. Lung Cancer. 2014; 83:83-9. https://doi.org/10.1016/j.lungcan.2013.10.004.
12. Weiss J, Sos ML, Seidel D, Peifer M, Zander T, Heuckmann JM, Ullrich RT, Menon R, Maier S, Soltermann A, Moch H, Wagener P, Fischer F, et al. Frequent and focal FGFR1 amplification associates with therapeutically tractable FGFR1 dependency in squamous cell lung cancer. Sci Transl Med. 2010; 2:62ra93. https://doi.org/10.1126/scitranslmed.3001451.
13. Schultheis AM, Bos M, Schmitz K, Wilsberg L, Binot E, Wolf J, Buttner R, Schildhaus HU. Fibroblast growth factor receptor 1 (FGFR1) amplification is a potential therapeutic target in small-cell lung cancer. Mod Pathol. 2014; 27:214-21. https://doi.org/10.1038/modpathol.2013.141.
14. Courjal F, Cuny M, Simony-Lafontaine J, Louason G, Speiser P, Zeillinger R, Rodriguez C, Theillet C. Mapping of DNA amplifications at 15 chromosomal localizations in 1875 breast tumors: definition of phenotypic groups. Cancer Res. 1997; 57:4360-7.
15. Reis-Filho JS, Simpson PT, Turner NC, Lambros MB, Jones C, Mackay A, Grigoriadis A, Sarrio D, Savage K, Dexter T, Iravani M, Fenwick K, Weber B, et al. FGFR1 emerges as a potential therapeutic target for lobular breast carcinomas. Clin Cancer Res. 2006; 12:6652-62. https://doi.org/10.1158/1078-0432.CCR-06-1164.
16. Jung EJ, Jung EJ, Min SY, Kim MA, Kim WH. Fibroblast growth factor receptor 2 gene amplification status and its clinicopathologic significance in gastric carcinoma. Hum Pathol. 2012; 43:1559-66. https://doi.org/10.1016/j.humpath.2011.12.002.
17. Touat M, Ileana E, Postel-Vinay S, Andre F, Soria JC. Targeting FGFR Signaling in Cancer. Clin Cancer Res. 2015; 21:2684-94. https://doi.org/10.1158/1078-0432.CCR-14-2329.
18. Al-Ahmadie HA, Iyer G, Janakiraman M, Lin O, Heguy A, Tickoo SK, Fine SW, Gopalan A, Chen YB, Balar A, Riches J, Bochner B, Dalbagni G, et al. Somatic mutation of fibroblast growth factor receptor-3 (FGFR3) defines a distinct morphological subtype of high-grade urothelial carcinoma. J Pathol. 2011; 224:270-9. https://doi.org/10.1002/path.2892.
19. Singh D, Chan JM, Zoppoli P, Niola F, Sullivan R, Castano A, Liu EM, Reichel J, Porrati P, Pellegatta S, Qiu K, Gao Z, Ceccarelli M, et al. Transforming fusions of FGFR and TACC genes in human glioblastoma. Science. 2012; 337:1231-5. https://doi.org/10.1126/science.1220834.
20. Parker BC, Annala MJ, Cogdell DE, Granberg KJ, Sun Y, Ji P, Li X, Gumin J, Zheng H, Hu L, Yli-Harja O, Haapasalo H, Visakorpi T, et al. The tumorigenic FGFR3-TACC3 gene fusion escapes miR-99a regulation in glioblastoma. J Clin Invest. 2013; 123:855-65. https://doi.org/10.1172/JCI67144.
21. Dieci MV, Arnedos M, Andre F, Soria JC. Fibroblast growth factor receptor inhibitors as a cancer treatment: from a biologic rationale to medical perspectives. Cancer Discov. 2013; 3:264-79. https://doi.org/10.1158/2159-8290.CD-12-0362.
22. Chesi M, Nardini E, Brents LA, Schrock E, Ried T, Kuehl WM, Bergsagel PL. Frequent translocation t(4;14)(p16.3;q32.3) in multiple myeloma is associated with increased expression and activating mutations of fibroblast growth factor receptor 3. Nat Genet. 1997; 16:260-4. https://doi.org/10.1038/ng0797-260.
23. Parish A, Schwaederle M, Daniels G, Piccioni D, Fanta P, Schwab R, Shimabukuro K, Parker BA, Helsten T, Kurzrock R. Fibroblast growth factor family aberrations in cancers: clinical and molecular characteristics. Cell Cycle. 2015; 14:2121-8. https://doi.org/10.1080/15384101.2015.1041691.
24. Wesche J, Haglund K, Haugsten EM. Fibroblast growth factors and their receptors in cancer. Biochem J. 2011; 437:199-213. https://doi.org/10.1042/BJ20101603.
25. Yang C, Jin C, Li X, Wang F, McKeehan WL, Luo Y. Differential specificity of endocrine FGF19 and FGF21 to FGFR1 and FGFR4 in complex with KLB. PLoS One. 2012; 7:e33870. https://doi.org/10.1371/journal.pone.0033870.
26. Rossi A, Latiano TP, Parente P, Chiarazzo C, Limosani F, Di Maggio G, Maiello E. The Potential Role of Nintedanib in Treating Colorectal Cancer. Expert Opin Pharmacother. 2017; 18:1153-1162. https://doi.org/10.1080/14656566.2017.1346086.
27. Soria JC, DeBraud F, Bahleda R, Adamo B, Andre F, Dienstmann R, Delmonte A, Cereda R, Isaacson J, Litten J, Allen A, Dubois F, Saba C, et al. Phase I/IIa study evaluating the safety, efficacy, pharmacokinetics, and pharmacodynamics of lucitanib in advanced solid tumors. Ann Oncol. 2014; 25:2244-51. https://doi.org/10.1093/annonc/mdu390.
28. Chae YK, Ranganath K, Hammerman PS, Vaklavas C, Mohindra N, Kalyan A, Matsangou M, Costa R, Carneiro B, Villaflor VM, Cristofanilli M, Giles FJ. Inhibition of the fibroblast growth factor receptor (FGFR) pathway: the current landscape and barriers to clinical application. Oncotarget. 2017; 8:16052-74. https://doi.org/10.18632/oncotarget.14109.
29. Hong DS, Kurzrock R, Wheler JJ, Naing A, Falchook GS, Fu S, Kim KB, Davies MA, Nguyen LM, George GC, Xu L, Shumaker R, Ren M, et al. Phase I Dose-Escalation Study of the Multikinase Inhibitor Lenvatinib in Patients with Advanced Solid Tumors and in an Expanded Cohort of Patients with Melanoma. Clin Cancer Res. 2015; 21:4801-10. https://doi.org/10.1158/1078-0432.CCR-14-3063.
30. Nogova L, Sequist LV, Perez Garcia JM, Andre F, Delord JP, Hidalgo M, Schellens JH, Cassier PA, Camidge DR, Schuler M, Vaishampayan U, Burris H, Tian GG, et al. Evaluation of BGJ398, a Fibroblast Growth Factor Receptor 1-3 Kinase Inhibitor, in Patients With Advanced Solid Tumors Harboring Genetic Alterations in Fibroblast Growth Factor Receptors: Results of a Global Phase I, Dose-Escalation and Dose-Expansion Study. J Clin Oncol. 2017; 35:157-65.
31. Sequist LV, Cassier P, Varga A, Tabernero J, Schellens JH, Delord JP, LoRusso P, Camidge DR, Medina MH, Schuler M, Campone M, Tian GG, Wong S, et al. Abstract CT326: Phase I study of BGJ398, a selective pan-FGFR inhibitor in genetically preselected advanced solid tumors. Cancer Research. 2014; 74: CT326-CT. https://doi.org/10.1158/1538-7445.am2014-ct326.
32. Smyth EC, Turner NC, Peckitt C, Pearson A, Brown G, Chua S, Gillbanks A, Johnston SRD, Tarazona N, Cutts R, Kilgour E, Rooney C, Smith NR, et al. Phase II multicenter proof of co ncept study of AZD4547 in FGFR amplified tumours. Journal of Clinical Oncology. 2015; 33:2508.
33. Tabernero J, Bahleda R, Dienstmann R, Infante JR, Mita A, Italiano A, Calvo E, Moreno V, Adamo B, Gazzah A, Zhong B, Platero SJ, Smit JW, et al. Phase I Dose-Escalation Study of JNJ-42756493, an Oral Pan-Fibroblast Growth Factor Receptor Inhibitor, in Patients With Advanced Solid Tumors. J Clin Oncol. 2015; 33:3401-8. https://doi.org/10.1200/JCO.2014.60.7341.
34. Joerger M, Schuler MH, Cassier PA, Hildebrandt S, Behre S, Helmbrecht C, Kerpen S, Zielinski D, Ince S, Ocker M, Ellinghaus P. Patient selection using novel RNA-based approaches: Early experience from a phase I study with the pan-FGFR inhibitor BAY 1163877 in patients with urothelial bladder cancer. Journal of Clinical Oncology. 2017; 35:386. https://doi.org/10.1200/JCO.2017.35.6_suppl.386.
35. Guffanti F, Chila R, Bello E, Zucchetti M, Zangarini M, Ceriani L, Ferrari M, Lupi M, Jacquet-Bescond A, Burbridge MF, Pierrat MJ, Damia G. In Vitro and In Vivo Activity of Lucitanib in FGFR1/2 Amplified or Mutated Cancer Models. Neoplasia. 2016; 19:35-42. https://doi.org/10.1016/j.neo.2016.11.008.
36. Kaibori M, Sakai K, Ishizaki M, Matsushima H, De Velasco MA, Matsui K, Iida H, Kitade H, Kwon AH, Nagano H, Wada H, Haji S, Tsukamoto T, et al. Increased FGF19 copy number is frequently detected in hepatocellular carcinoma with a complete response after sorafenib treatment. Oncotarget. 2016; 7:49091-8. https://doi.org/10.18632/oncotarget.10077.
37. Goke F, Franzen A, Hinz TK, Marek LA, Yoon P, Sharma R, Bode M, von Maessenhausen A, Lankat-Buttgereit B, Goke A, Golletz C, Kirsten R, Boehm D, et al. FGFR1 Expression Levels Predict BGJ398 Sensitivity of FGFR1-Dependent Head and Neck Squamous Cell Cancers. Clin Cancer Res. 2015; 21:4356-64. https://doi.org/10.1158/1078-0432.CCR-14-3357.
38. Wynes MW, Hinz TK, Gao D, Martini M, Marek LA, Ware KE, Edwards MG, Bohm D, Perner S, Helfrich BA, Dziadziuszko R, Jassem J, Wojtylak S, et al. FGFR1 mRNA and protein expression, not gene copy number, predict FGFR TKI sensitivity across all lung cancer histologies. Clin Cancer Res. 2014; 20:3299-309. https://doi.org/10.1158/1078-0432.CCR-13-3060.
39. Kwak Y, Nam SK, Seo AN, Kim DW, Kang SB, Kim WH, Lee HS. Fibroblast Growth Factor Receptor 1 Gene Copy Number and mRNA Expression in Primary Colorectal Cancer and Its Clinicopathologic Correlation. Pathobiology. 2015; 82:76-83. https://doi.org/10.1159/000398807.
40. Goke F, Goke A, von Massenhausen A, Franzen A, Sharma R, Kirsten R, Bohm D, Kristiansen G, Stenzinger A, Wynes M, Hirsch FR, Weichert W, Heasley L, et al. Fibroblast growth factor receptor 1 as a putative therapy target in colorectal cancer. Digestion. 2013; 88:172-81. https://doi.org/10.1159/000355018.
41. Jang JH, Shin KH, Park JG. Mutations in fibroblast growth factor receptor 2 and fibroblast growth factor receptor 3 genes associated with human gastric and colorectal cancers. Cancer Res. 2001; 61:3541-3.
42. Cancer Genome Atlas Network. Comprehensive molecular characterization of human colon and rectal cancer. Nature. 2012; 487:330-7. https://doi.org/10.1038/nature11252.
43. Karkera JD, Martinez Cardona G, Bell K, Gaffney D, Portale JC, Santiago-Walker A, Moy C, King P, Sharp M, Bahleda R, Luo FR, Alvarez JD, Lorenzi MV, et al. Oncogenic Characterization and Pharmacologic Sensitivity of Activating Fibroblast Growth Factor Receptor (FGFR) Genetic Alterations to the Selective FGFR Inhibitor Erdafitinib. Mol Cancer Ther. 2017; 16:1717-1726. https://doi.org/10.1158/1535-7163.MCT-16-0518.
44. Guancial EA, Werner L, Bellmunt J, Bamias A, Choueiri TK, Ross R, Schutz FA, Park RS, O'Brien RJ, Hirsch MS, Barletta JA, Berman DM, Lis R, et al. FGFR3 expression in primary and metastatic urothelial carcinoma of the bladder. Cancer Med. 2014; 3:835-44. https://doi.org/10.1002/cam4.262.
45. Schildhaus HU, Heukamp LC, Merkelbach-Bruse S, Riesner K, Schmitz K, Binot E, Paggen E, Albus K, Schulte W, Ko YD, Schlesinger A, Ansen S, Engel-Riedel W, et al. Definition of a fluorescence in-situ hybridization score identifies high- and low-level FGFR1 amplification types in squamous cell lung cancer. Mod Pathol. 2012; 25:1473-80. https://doi.org/10.1038/modpathol.2012.102.
46. Finelli P, Fabris S, Zagano S, Baldini L, Intini D, Nobili L, Lombardi L, Maiolo AT, Neri A. Detection of t(4;14)(p16.3;q32) chromosomal translocation in multiple myeloma by double-color fluorescent in situ hybridization. Blood. 1999; 94:724-32.
47. Turkmen S, Binder A, Gerlach A, Niehage S, Theodora Melissari M, Inandiklioglu N, Dorken B, Burmeister T. High prevalence of immunoglobulin light chain gene aberrations as revealed by FISH in multiple myeloma and MGUS. Genes Chromosomes Cancer. 2014; 53:650-6. https://doi.org/10.1002/gcc.22175.
48. Wang F, Flanagan J, Su N, Wang LC, Bui S, Nielson A, Wu X, Vo HT, Ma XJ, Luo Y. RNAscope: a novel in situ RNA analysis platform for formalin-fixed, paraffin-embedded tissues. J Mol Diagn. 2012; 14:22-9. https://doi.org/10.1016/j.jmoldx.2011.08.002.
49. Jo P, Konig A, Schirmer M, Kitz J, Conradi LC, Azizian A, Bernhardt M, Wolff HA, Grade M, Ghadimi M, Strobel P, Schildhaus HU, Gaedcke J. Heterogeneity of KRAS Mutation Status in Rectal Cancer. PLoS One. 2016; 11:e0153278. https://doi.org/10.1371/journal.pone.0153278.
50. Ney JT, Froehner S, Roesler A, Buettner R, Merkelbach-Bruse S. High-resolution melting analysis as a sensitive prescreening diagnostic tool to detect KRAS, BRAF, PIK3CA , and AKT1 mutations in formalin-fixed, paraffin-embedded tissues. Arch Pathol Lab Med. 2012; 136:983-92. https://doi.org/10.5858/arpa.2011-0176-OA.
51. Therneau T. A Package for Survival Analysis in S. version 2.38. 2015.