
INTRODUCTION
TAZ (WWTR1 is the gene) and YAP (YAP1 is the gene) are developmentally important transcriptional coactivators [1, 2] that have emerged as central oncoproteins in a number of carcinomas including breast [3, 4], colon [5], liver [6], lung [7, 8], pancreas [9], and thyroid cancers [10]. TAZ (transcriptional coactivator with PDZ-binding motif) and YAP (yes associated protein) do not contain DNA binding domains of their own, and must complex with other transcription factors that contain DNA binding domains via their TEAD binding domain or WW domain [11–15]. The TEA domain (TEAD) family of transcription factors have been demonstrated to be the dominant transcription factors with regards to mediating the TAZ and YAP transcriptional programs [16, 17]. TAZ and YAP are negatively regulated by the Hippo pathway, a series of serine/threonine kinases including the STE20-like protein 1 and 2 (MST1/2) [18–20] and the large tumor suppressor 1 and 2 (LATS1/2) [21, 22]. The MOB1A/B [23] and Salvador proteins [20, 24] have been shown to form a scaffold for the above kinases. Cell confluence [2] and detachment [25] activate the Hippo pathway, causing LATS1/2 to phosphorylate TAZ and YAP on several serines, including serine 89 on TAZ and serine 127 on YAP. Phosphorylation of these serines leads to binding of 14-3-3 proteins, ultimately resulting in translocation of TAZ/YAP from the nucleus into the cytoplasm, where they undergo ubiquitin-mediated degradation [1, 2].
A number of different signal transduction pathways have been identified that modulate the activity of the Hippo kinases or TAZ and YAP directly. The Wnt signaling pathway has been shown to activate TAZ and YAP directly via their interaction with β-catenin [26, 27]. The PI3 kinase pathway activates TAZ by inhibiting glycogen synthase kinase-3 [28] and activates YAP by promoting the dissolution of the Hippo kinase signaling cascade [29]. G protein coupled receptors have been shown to activate TAZ and YAP by dampening activity of the LATS1 and LATS2 kinases [30–32]. This has led to a paradigm that TAZ and YAP are activated predominantly via cross-talk with other signal transduction pathways.
In contrast, primary lesions affecting the Hippo kinases have been rarely identified. Although TAZ and YAP have been shown to be activated oncoproteins in a number of carcinomas [33, 34] and sarcomas [35], genetic alterations are rare with the exception of the WWTR1-CAMTA1 [36–38] and YAP1-TFE3 gene fusions in epithelioid hemangioendothelioma (EHE) [39]. Mutations in the upstream Hippo kinases, MST1, MST2, LATS1, and LATS2 have also been rare. Occasional mutations have been identified in the scaffolding proteins MOB1A/B [33]. In silico studies have suggested that copy number changes (deletions) of genes upstream of the Hippo kinases (e.g. NF2) may result inactivation of TAZ and YAP [40], however the frequency of these genomic alterations is incompletely understood. More recently, the Itch ubiquitin ligase has been shown to reduce expression of the LATS1 kinase [41, 42]. Scattered reports indicate the presence of promoter hypermethylation of several of the Hippo kinases, although evaluation of how promoter hypermethylation affects expression levels and functional activity of the kinases is incomplete [43–45]. In summary, although various lines of evidence indicate the presence of primary lesions of the Hippo pathway, their true frequency and significance is incompletely understood. To address this, we performed a comprehensive evaluation of expression of the Hippo kinases in sarcomas, a group of cancers that have recently been shown to harbor frequent activation of the TAZ and YAP oncoproteins [35].
RESULTS
Expression of the Hippo kinases is lost in TAZ/YAP activated clinical sarcoma samples
We have recently demonstrated that TAZ and YAP are constitutively activated and located within the nucleus of the majority of sarcoma clinical samples. Evaluating expression of TAZ and YAP in multiple histological types of sarcoma revealed that approximately 50% of sarcoma clinical samples demonstrate activated YAP, while 66% demonstrate activated TAZ. (Figure 1A) [35]. Mutations within components of the Hippo pathway have reported to be rare [33]. Evaluation of 259 sarcomas in The Cancer Genome Atlas demonstrated a mutation rate ranging from 0% for MST2 and LATS1 to 0.8% for LATS2 (Supplementary Figure 1A). Several lines of evidence indicate that silencing of the Hippo kinases is necessary for activation of TAZ and YAP. The TAZ-CAMTA1 fusion protein has been demonstrated to negate inhibition from the Hippo pathway [38]. Other lines of evidence indicate that the Hippo pathway is silenced secondarily via interactions with other pathways [26–29]. Some reports have addressed the possibility that the Hippo pathway is primarily silenced through promoter hypermethylation [43–45] or ubiquitin mediated degradation [41, 42], however this has not been investigated in a comprehensive manner.
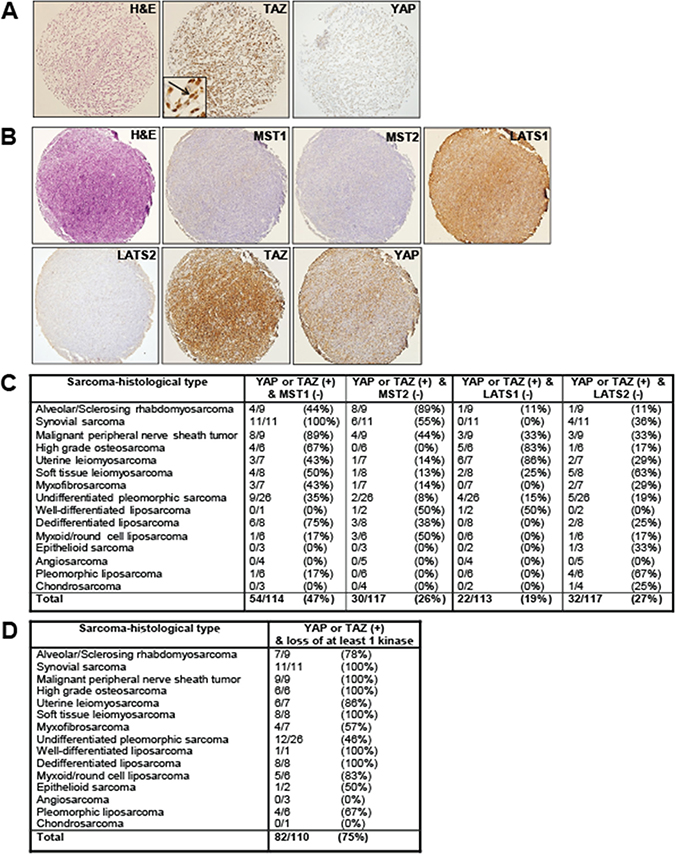
Figure 1: Expression of the Hippo kinases in clinical samples. Immunohistochemical evaluation of MST1, MST2, LATS1, and LATS2 in a sarcoma tissue microarray. (A) Myxofibrosarcoma demonstrating diffuse and strong expression and nuclear localization (activation) of TAZ, and a lack of expression of YAP. (B) Synovial sarcoma demonstrating a lack of expression of MST1, MST2, and LATS2 in a sarcoma with activated TAZ and YAP. LATS1 expression is maintained. (C) Table demonstrating range of Hippo kinase loss in YAP or TAZ activated sarcomas. Loss of expression ranged from 19% (LATS1) to 47% (MST1). (D) Table demonstrating the frequency of loss of at least one Hippo kinase as a function of sarcoma histological type in sarcomas demonstrating activated TAZ or YAP.
One mechanism by which the Hippo pathway could be primarily silenced is through loss of expression of the Hippo kinases. To assess this possibility, we evaluated expression of the Hippo kinases in an unbiased way through immunohistochemistry for MST1, MST2, LATS1, and LATS2 on the tissue microarray (Figure 1B and 1C). Normal smooth muscle was utilized as a positive control (Supplementary Figure 1B). TAZ and YAP activated sarcomas, defined as sarcomas demonstrating intermediate level intensity of staining and greater than 70% of cells showing nuclear localization of TAZ or YAP were previously identified [38]. At least 113 TAZ/YAP activated sarcomas were available for evaluation. Within these TAZ/YAP activated sarcomas, 47% (54/114) demonstrated loss of MST1 expression, 26% (30/117) demonstrated loss of MST2 expression, 19% (22/113) of the sarcomas demonstrated loss of LATS1 expression, and 27% (32/117) of the sarcomas demonstrated loss of LATS2 expression (Figure 1C). Hippo kinase expression loss in all sarcomas (regardless of TAZ or YAP activation status) was similar. Approximately 49% of sarcomas (73/148) demonstrate loss of MST1, 31% of sarcomas (46/148) demonstrate loss of MST2, 23% of sarcomas (34/148) demonstrate loss of LATS1 expression, and 29% of sarcomas (45/153) demonstrate loss of LATS2 (Supplementary Figure 1C). The similar frequency of loss of the Hippo kinases in TAZ/YAP activated sarcomas versus all sarcomas regardless of TAZ/YAP activation status indicates that loss of the Hippo kinases is associated with TAZ/YAP activation the majority of the time.
We next determined the frequency at which at least one of the Hippo kinases was lost among a panel of 110 sarcomas. Approximately 75% of the sarcomas demonstrate a loss of expression of at least one of the Hippo kinases (Figure 1D). All of the synovial sarcomas, malignant peripheral nerve sheath tumors, high grade osteosarcomas, soft tissue leiomyosarcomas, well-differentiated liposarcoma, and dedifferentiated liposarcomas demonstrated loss of expression of at least one of the Hippo kinases. The frequency of loss of expression in the remaining sarcomas ranged from 46% (12/26) in undifferentiated pleomorphic sarcoma to 86% (6/7) in uterine leiomyosarcoma (Figure 1D). No angiosarcomas or chondrosarcomas were noted to exhibit loss of the Hippo kinases, but the sample sizes of these sarcomas were small.
We then looked at other combinations of loss of the Hippo kinases in YAP or TAZ activated sarcomas in an effort to ascertain what combinations of the Hippo kinases are required for activation of TAZ/YAP to occur. Loss of expression of MST1 and MST2 was identified in 15% (17/114) of sarcomas. Loss of expression of LATS1 and LATS2 was noted in 8% (9/113) of sarcomas. Loss of expression of all four Hippo kinases was identified in 1 of 110 (1%) of all sarcomas (Supplementary Figure 1D).
Expression of the Hippo kinases is lost in TAZ/YAP activated sarcoma cell lines
As we have previously shown, TAZ and YAP are constitutively activated and located within the nucleus of sarcoma cell lines (Figure 2A, Supplementary Figures 2 and 3). Essentially all of the sarcoma cell lines assayed demonstrate nuclear localization of TAZ and YAP when grown to confluence (Supplementary Figures 2 and 3), consistent with a lack of negative regulation by the Hippo pathway. With the exception of MOB1A/B [33], mutations in the upstream Hippo kinases (especially MST1/2) have been reported to be extremely rare. Mutations in TAZ and YAP have also been shown to be extremely rare, with the exception of the WWTR1-CAMTA1 and YAP1-TFE3 gene fusions which are disease defining genetic alterations found in essentially all epithelioid hemangioendotheliomas [37–39]. In the majority of cancers, WWTR1 and YAP1 have been reported to lack mutations [33]. To confirm this is the case in sarcomas, we performed targeted PCR-based Sanger sequencing of 12 sarcoma cell lines and GCT (giant cell tumor) for the presence of mutations in the serines in TAZ (S66, 89, 117, and 311) [46] and YAP (S61, 109, 127, 164, and 381) [2] phosphorylated by LATS1/2. GCT is an immortalized, non-sarcoma mesenchymal cell line, and expression of the Hippo kinases appeared to be similar as compared to MCF10A, an immortalized but non-transformed cell line commonly utilized as a negative control epithelial cell line in the field [3, 47] (Supplementary Figure 4A). For this reason, this cell line was used as a control in the subsequent experiments. None of the 13 cell lines evaluated by Sanger sequencing demonstrated mutations in the above mentioned serine residues (Supplementary Figure 4B).
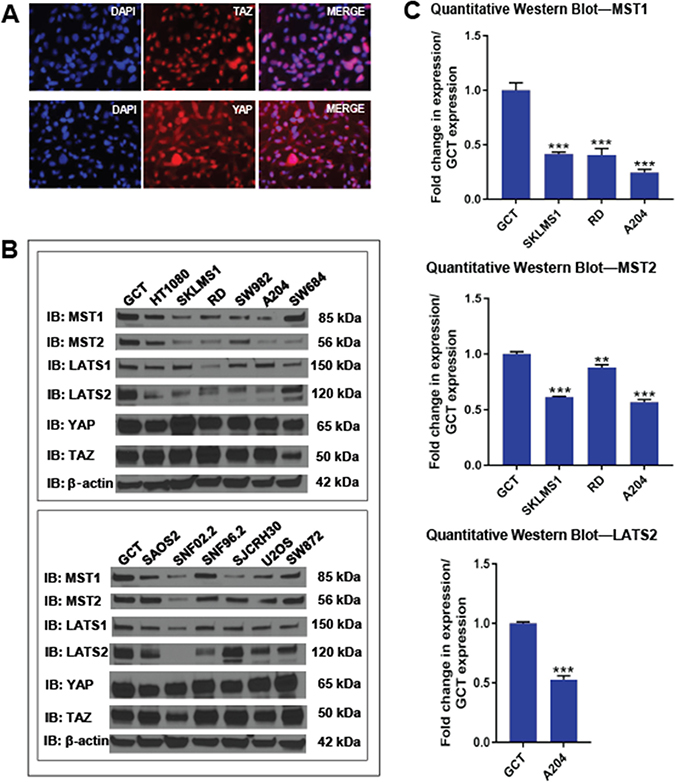
Figure 2: Expression of the Hippo kinases in vitro. (A) Immunofluorescence demonstrating constitutive nuclear localization of TAZ and YAP in A204 cells grown to confluence. (B) Western blot demonstrating a loss of expression of Hippo kinases relative to GCT (giant cell tumor) cell line. (C) Quantitative western blot for MST1, MST2 and LATS2 (the most commonly lost kinases) in the SKLMS1, RD, and A204 cell lines and compared to GCT. The SKLMS1, RD, and A204 cell lines showed a stastically significant decrease in expression in MST1 and MST2 as compared to GCT. Of these three lines, only A204 demonstrated a significant decrease in expression of LATS2. Statistical significance determined by two-tailed t-test. * indicates p < 0.05; ** indicates p < 0.01; *** indicates p < 0.001.
Expression levels of the Hippo kinases were then evaluated at the protein level by western blot. Qualitatively, expression of at least one of the Hippo kinases was reduced by approximately 2-fold in 10 of the 12 sarcoma cell lines (83%) compared to GCT (Figures 2B and 7A), closely approximating the 75% of clinical samples that had lost at least one of the Hippo kinases (Figure 1D). Quantitative loss of the MST1, MST2, and LATS2 kinases, the kinases whose expression was most commonly lost, was confirmed in a sampling of 3 cell lines, SKLMS1, RD, and A204 (Figure 2C and Supplementary Figure 5A).
Protein expression levels can be regulated at multiple levels, including altered protein turnover. To test the hypothesis that protein degradation could play a role in Hippo kinase expression, the 12 sarcoma cell lines were treated with 10 μM MG132 for 12 hours. After 12 hours, MG132 was shown to quantitatively increase expression of MST2 in 3 of the 12 cell lines (25%) (Figure 3 and Supplementary Figure 5B), indicating that enhanced proteosomal degradation leads to decreased Hippo kinase expression in sarcoma cell lines. None of the other Hippo kinases showed evidence of increased proteosomal degradation. In some cell lines in which MST2 expression increased with MG132 treatment, LATS2 expression was found to demonstrate the opposite relationship and decreased.

Figure 3: Evaluation of proteosomal degradation of the Hippo kinases in vitro. Cell lines were treated with 10 μM MG132 for 12 hrs. A 1.5-fold or greater accumulation of protein was considered indicative of proteosomal degradation. (A) Western blot demonstrates accumulation of MST2, but not MST1, LATS1, or LATS2 with treatment with 10 μM MG132. This was validated quantitatively in 3 cell lines (SKLMS1, A204, and SJCRH30) in part (B). These three lines are indicated by an asterisk in part (A). Statistical significance determined by two-tailed t-test. * indicates p < 0.05; ** indicates p < 0.01; *** indicates p < 0.001.
Copy number changes (deletions) of the Hippo kinases are not a common event in sarcomas
To evaluate the possibility that loss of expression was occurring due to alterations at the genomic level, copy number changes/deletions were evaluated utilizing data from The Cancer Genome Atlas data set. Prior studies in sarcomas have highlighted in silico data emphasizing deletions in NF2 (merlin), a regulatory protein upstream of the Hippo pathway [40]. Potential genomic deletions in the Hippo kinases themselves have not been thoroughly investigated. In silico analysis demonstrated that 0.8% of sarcomas demonstrated genomic deletions of MST2 and LATS2 combined, indicating that deletions are not a common mechanism by which loss of expression of the Hippo kinases occurs (Figure 4A). To confirm the in silico data, we performed fluorescence in situ hybridization (FISH) for MST1, MST2, LATS1, and LATS2 on cell lines (Figure 4B–4G).
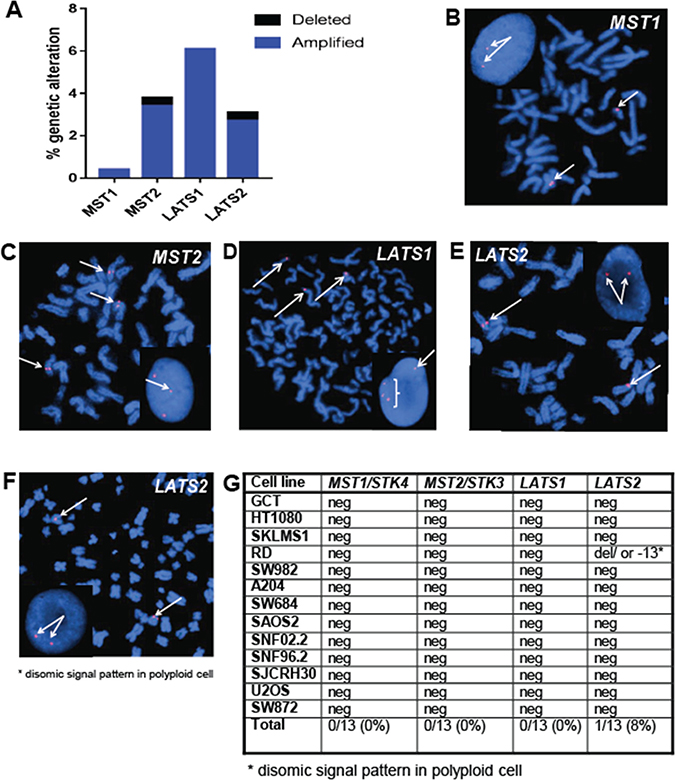
Figure 4: The Hippo kinases are rarely deleted in sarcomas. (A) Evaluation of The Cancer Genome Atlas data set revealed less than 1% of sarcomas demonstrate deletions of MST2 and LATS2. (B–D) Fluorescence in situ hybridization (FISH) utilizing fluorescent labeled BAC probes hybridizing to metaphase chromosomes and interphase nuclei (inset). (B) FISH probes for MST1 (20q13) demonstrating two signals in metaphase chromosomes and two signals in the interphase nucleus in the A204 cell line, indicating no deletions of the MST1 gene region are present. (C) FISH probes for MST2 (8q22) demonstrating polyploidy, but no deletions of the MST2 gene region. (D) FISH probes for LATS1 (6q25) demonstrate polyploidy, but no deletions of the LATS1 gene region (E) FISH probes for LATS2 (13q12) demonstrate a normal disomic pattern in both the metaphase chromosomes and the interphase nucleus in the A204 cell line, indicating no deletions of the LATS2 gene region (F) FISH for LATS2 in the RD cell line, demonstrating disomic signal pattern in a polyploid cell. Although a deletion or loss of chromosome 13 is present, two copies of LATS2 are still present. (G) Table summarizing FISH results. No deletions were observed in MST1, MST2, or LATS1. A deletion was noted in RD, however the cell line is polyploid, and two copies of LATS2 were still present.
No genomic deletions of the Hippo kinases were identified by FISH in the sarcoma cell lines, with the exception of the RD cell line. The RD cell line demonstrated a disomic signal for LATS2 in a polyploid cell, indicating a deletion or loss of chromosome 13. Given that the LATS2 copy number is still two, the contribution to LATS2 expression is unclear.
Expression of MST1 and MST2 is reduced at the RNA level in sarcoma cell lines
Since genomic alterations/deletions of the Hippo kinases was not responsible for decreased expression of the Hippo kinases, and only MST2 appears to be regulated at a protein level, we asked whether the Hippo kinases expression were regulated at a transcriptional level. To test this hypothesis, we evaluated whether decreased expression of the Hippo kinases at the protein level was due to decreased expression of the Hippo kinases at the RNA level. Quantitative RT-PCR was performed on all 12 sarcoma cell lines and expression normalized to GCT. Approximately 42% of cell lines demonstrated loss of expression of MST1 at the RNA level, while 25% of cell lines demonstrated loss of expression of MST2 at the RNA level (Figure 5A). In contrast, loss of expression of the LATS1 and LATS2 kinases at the RNA level was less frequently observed. Approximately 8% of sarcoma cell lines demonstrated loss of expression of LATS1 at the RNA level, while no cell lines demonstrated loss of expression of LATS2 at the RNA level.
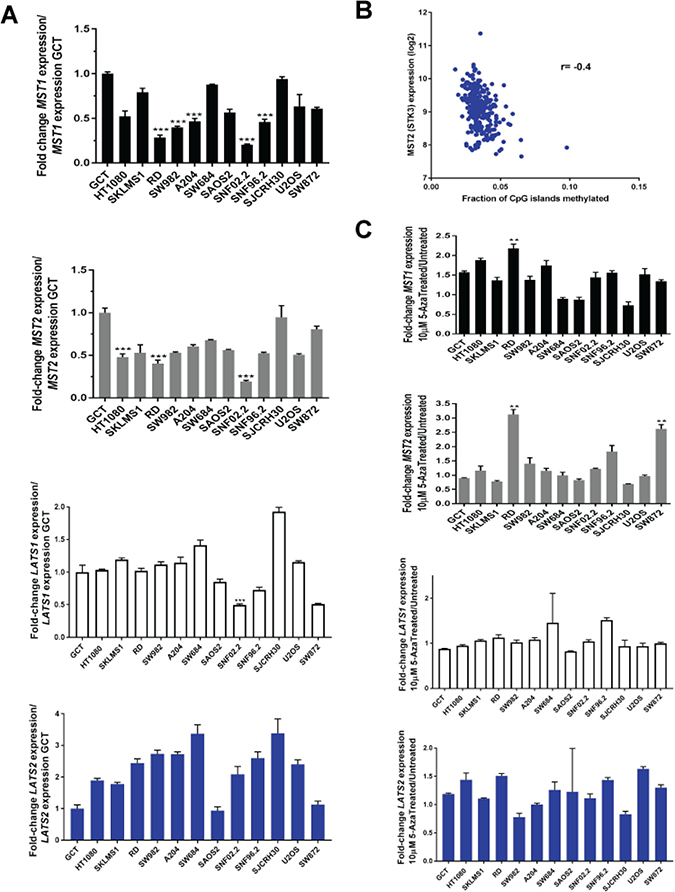
Figure 5: Loss of expression of the Hippo kinases at the RNA level and reconstitution with 5-azacytidine in sarcoma cell lines evaluated by quantitative RT-PCR. Loss of expression was defined as a two-fold or greater decrease of expression of the Hippo kinases (0.5 fold decrease in expression as compared to GCT). Increase in expression was defined as a two-fold or greater increase in expression after treatment with 10 μM 5-azacytidine. (A) MST1 expression is decreased at the RNA level in 5 of 12 sarcoma cell lines (42%). MST2 expression is decreased in 3 of 12 sarcoma cell lines (25%). LATS1 expression is decreased in 1 of 12 sarcoma cell lines (8%). No decrease in LATS2 expression is detected (0%). (B) TCGA data demonstrating that MST2 expression is inversely proportional to CpG island methylation (Spearman’s correlation coefficient r = −0.4). (C) MST1 expression is increased after treatment with 5-azacytidine in 1 of 12 cell lines (8%). MST2 expression is increased after treatment in 2 of 12 cell lines (17%). Neither LATS1 nor LATS2 expression is increased in any (0%) of the cell lines after treatment with 5-azacytidine. Statistical analysis is shown for cell lines demonstrating a two-fold or greater decrease in expression. Statistical significance determined by two-tailed t-test. * indicates p < 0.05; ** indicates p < 0.01; *** indicates p < 0.001.
Expression of MST1 and MST2 are modestly regulated by promoter hypermethylation
The above findings suggest that loss of expression of MST1 and MST2 are regulated at a transcriptional level, while loss of expression of LATS1 and LATS2 are regulated by other mechanisms. Several authors have noted promoter hypermethylation of MST1, MST2, LATS1, and LATS2 in various cancers [43–45]. However evaluation of how promoter methylation affects expression has not been comprehensively evaluated. To determine whether promoter hypermethylation affected expression of the Hippo kinases, we evaluated TCGA methylation data acquired from Firebrowse.org [48] (Supplementary Figure 6). A modest negative correlation was identified between methylation of CpG islands and RNA expression for MST2 (r = −0.4) (Figure 5B).
To begin addressing whether hypermethylation of these promoters is functionally significant, we treated sarcoma cell lines with 10 μM 5-azacytidine (a covalent inhibitor of DNA methyltransferase I [49]) for 4 days. Quantitative RT-PCR demonstrated 6 cell lines that approximated at least a 1.5 fold increase in expression, however, only the RD cell line demonstrated a fold change increase greater than 2 in expression of MST1. Similarly, treatment with 5-azacytidine demonstrated 2 cell lines, RD and SW872, that had a greater than 2-fold increase in expression of MST2. Altogether, the data demonstrate that expression of MST1 and MST2 are modestly regulated by methylation of DNA, mirroring the TCGA in silico data. None of the cell lines demonstrated a two-fold increase in expression of LATS1 or LATS2 with treatment with 5-azacytidine (Figure 5C).
Expression of MST1 and MST2 is silenced by histone deacetylation
Since treatment with 5-azacytidine (AZA) did not significantly rescue expression of MST1 and MST2 in many sarcoma cell lines, it suggested that promoter hypermethylation was not the predominant transcriptional mechanism regulating expression of MST1 and MST2. Promoter hypermethylation is linked structurally to histone acetylation. Histone deacetylases are known to bind to methylated DNA via the MBD2/3 and MeCP2 adaptor proteins [50, 51].
This suggested that the promoter hypermethylation might coordinately regulate expression of the MST1 and MST2 kinases with histone deacetylation. To determine more directly whether promoter hypermethylation and histone deacetylation work in conjunction with one another to regulate expression of the Hippo kinases, we treated cells with 5 μM 5-azacytidine (AZA) for 4 days followed by treatment with 500 nM trichostatin A (inhibits class I, II, and IV histone deactylases (HDACs) by interacting with the Zn(II) in the catalytic site [52]) for 12 h (Figure 6A–6D). A lower concentration of 5-azacytidine was used in the majority of cell lines, rather than 10 μM as in previous experiments, so that addition of trichostatin A could be tolerated in the cell lines. Some lines could only tolerate lower levels of trichostatin A, including SJCRH30 (0.125 μM trichostatin A) and SNF02.2 (0.25 μM trichostatin A). The HT1080, SKLMS1, and SW982 cell lines could only tolerate 1 μM 5-azacytidine in combination with trichostatin A. Trichostatin A (TSA) and AZA treatment alone controls were included. Seven of the 12 sarcoma cell lines (58%) demonstrated a two-fold or greater increase in expression of MST1 with treatment with TSA. TSA and AZA had a statistically significant additive effect in the HT1080 cell line only (Figure 6A). TSA stimulated an increase in expression of MST2 in 8 of 12 sarcoma cell lines (67%) (Figure 6B). No increase in expression of LATS1 was seen with TSA alone (Figure 6C). TSA promoted an increase of expression of LATS2 in 1 of 12 sarcoma cell lines (8%). A statistically significant additive effect was seen with regards to LATS2 expression in the HT1080 and RD cell lines with simultaneous treatment with trichostatin A (TSA) and 5-azacytidine (AZA) (Figure 6D).
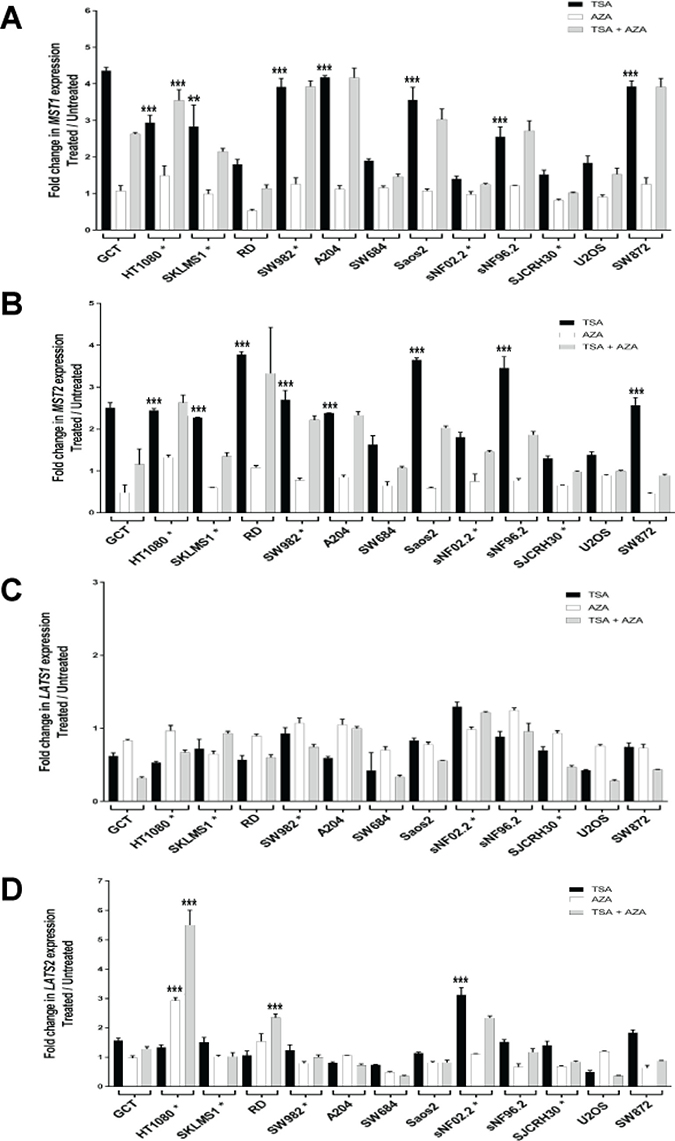
Figure 6: Increase in expression of the Hippo kinases after treatment with trichostatin-A (0.5 μM), 5-azacytidine (5 μM), and trichostatin-A (0.5 μM) plus 5-azacytidine (5 μM) unless indicated by asterisk. SJCRH30* cell line was treated with 0.125 μM trichostatin-A, SNF02.2* was treated with 0.25 μM trichostatin-A. HT1080*, SKLMS1*, and SW982* cell lines were treated with 1 μM 5-azacytidine. Increase in expression after treatment with trichostatin-A and/or 5-azacytidine is defined as a two-fold or greater increase in expression after treatment. (A) Trichostatin-A (TSA) stimulated an increase in expression of MST1 in 7 of 12 sarcoma cell lines (58%). 5-azacytidine (AZA) at 5 μM did not cause an increase in expression of MST1. TSA and AZA had a statistically significant additive effect in the HT1080 cell line only. (B) Trichostatin-A (TSA) stimulated an increase in expression of MST2 in 8 of 12 sarcoma cell lines (67%). At 5 μM 5-azacytidine, there is no increase in expression of MST2. No additive effect of adding 5-azacytidine and trichostatin-A was identified in the sarcoma cell lines. (C) No increase in expression in LATS1 was identified with TSA, AZA, or TSA plus AZA. (D)TSA drove an increase in expression of LATS2 in 1 of 12 sarcoma cell lines (8%). AZA caused an increase in expression of LATS2 in the HT1080 cell line. A statistically significant additive effect was seen in the HT1080 and RD cell lines with simultaneous treatment with trichostatin A and 5-azacytidine. Statistical analysis is shown for cell lines/conditions demonstrating a two-fold or greater decrease in expression with TSA or AZA treatment alone. Stastistical analysis is also shown for cell lines demonstrating an additive effect with treatment with TSA and AZA. Statistical significance determined by two-tailed t-test. * indicates p < 0.05; ** indicates p < 0.01; *** indicates p < 0.001.
The effectiveness of TSA in the above experiments in promoting histone acetylation was validated in three cell lines, RD, Saos2, and sNF96.2 that demonstrated an increase in expression of MST1 and MST2. These three lines were treated with 0.5 μM TSA for 24 hours. Lysates were then probed with a pan-acetyl histone H3 antibody recognizing acetylated K9, K14, K18, K23, and K27 (Supplementary Figure 7A) confirming an increase in pan-acetylation of histone H3. To further validate the reversal in expression of MST1 and MST2 seen with treatment with TSA, we treated with a different HDAC inhibitor, N-(2-Aminophenyl)-4- [N-(pyridine-3ylmethoxycarbonyl)aminomethyl]benzamide (MS-275) in the same above three lines. Treatment with 1 μM MS-275 for 24 hours resulted in at least a 1.5 fold increase in expression of MST1 and MST2 in the three cell lines (Supplementary Figure 7B and 7C), confirming that reversal of expression with treatment with TSA was not an off-target effect but due to HDAC inhibition.
DISCUSSION
Although TAZ and YAP have been acknowledged as central oncoproteins in multiple cancers including breast, colon, liver, lung, pancreatic, and thyroid cancers [33], the dominant paradigm is that these two oncoproteins are activated relatively late in tumor progression. This is due to the observation that few mutations of TAZ and YAP or the upstream Hippo kinases are activated. Challenging this paradigm has been the discovery of the TAZ-CAMTA1 [36–38] and YAP-TFE3 [39] fusion proteins in epithelioid hemangioendothelioma (EHE), a vascular sarcoma. EHE contains a t(1;3)(p36;q25) [36–38] or t(X;11) [39]chromosomal translocations encoding the TAZ-CAMTA1 and YAP-TFE3 fusion proteins, respectively. EHE contains few other cytogenetic alterations other than the above mentioned chromosomal translocations, indicating that these chromosomal translocations and gene fusions are the initiating event. The TAZ-CAMTA1 fusion protein [38] and presumably the YAP-TFE3 fusion protein function by constitutively activating the N terminal portion of TAZ and YAP so that they are no longer negatively regulated by the Hippo pathway. Expression of the TAZ-CAMTA1 fusion protein has been demonstrated to transform cells and promote various hallmarks of cancer [38], demonstrating that activated TAZ and YAP can serve as the initiating oncoproteins in cancers.
The question of whether TAZ and YAP serve as the initiating oncoproteins in other cancers is still largely unresolved. Because the preponderance of evidence indicates that the Hippo kinases are inactivated and that TAZ and YAP are activated by a complex interaction with multiple signal transduction pathways, the dominant view is that they must be activated later in tumor progression due to the time required for mutations to occur in other signal transduction pathways [53]. The above paradigm focuses on post-translational mechanisms by which the Hippo kinases, TAZ, and YAP can be regulated. In this study we identified several mechanisms via which the Hippo kinases can directly be down-regulated, suggesting that TAZ and YAP might be activated earlier in tumor initiation/progression than previously stipulated.
Herein, utilizing an unbiased approach with clinical samples, we showed in sarcomas that the Hippo kinases can be primarily dysregulated by a variety of mechanisms resulting in their loss of expression (Figure 7A, 7B). Loss of expression of the Hippo kinases was identified in clinical sarcoma samples demonstrating activated TAZ and YAP at a relatively high level, ranging from 19% (LATS1) to 47% (MST1). The majority of TAZ/YAP activated clinical sarcoma samples (75%) demonstrated loss of expression of one of the Hippo kinases, while other combinations of loss of expression of the Hippo kinases was much less frequent, suggesting that loss of expression of one of the Hippo kinases may be sufficient to activate TAZ or YAP. These findings were mirrored in sarcoma cell lines that demonstrated constitutive activation of TAZ/YAP which demonstrated a similar frequency with regards to loss of expression of at least one of the Hippo kinases (83%) (Figure 7A).
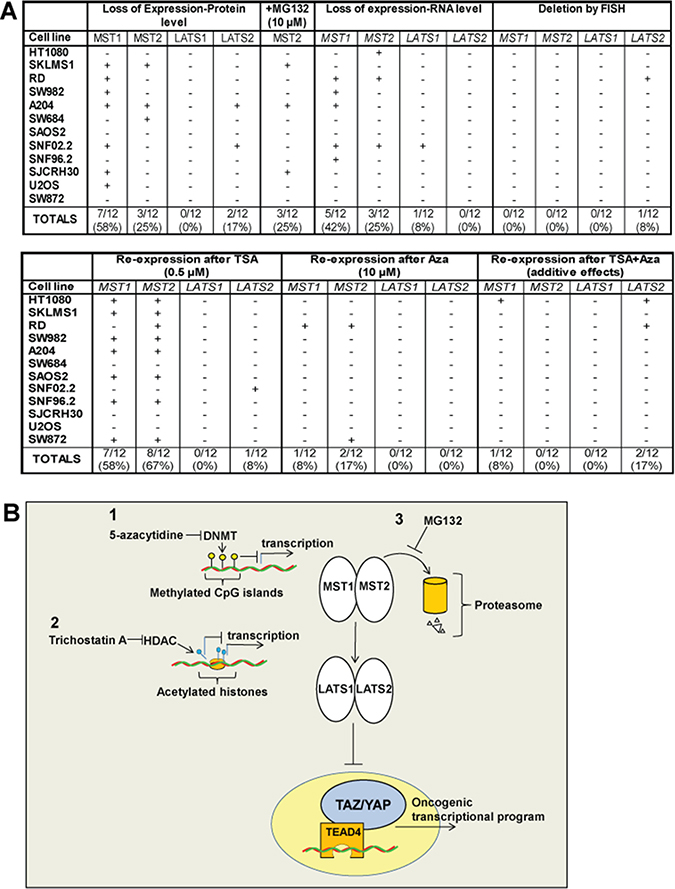
Figure 7: (A) Summary of cell lines diagram. Expression of the Hippo kinases was lost at the protein level in 0% (LATS1) to 58% (MST1) of the sarcoma cell lines, indicated by (+). Accumulation of the Hippo kinases with treatment with MG132, indicated by (+), was noted only for MST2, indicating that proteosomal degradation is an important mechanism by which MST2 expression is lost. Loss of expression at the RNA level was identified for MST1 (42%) and MST2 (25%) of sarcoma cell lines. Loss of expression at the RNA level for LATS1 and LATS2 was negligible. Deletions of the Hippo kinases were essentially absent from the sarcoma cell lines with the exception of LATS2, where 1 of the 12 sarcoma cell lines (8%) demonstrated a deletion. Treatment with 10 μM 5-azacytidine resulted in a modest increase in expression in 8–17% of the sarcoma cell lines. Treatment with 0.5 μM TSA resulted in a reversal of expression in a higher percentage of cell lines, predominantly with MST1 and MST2. Treatment with TSA and 5-azacytidine showed an additive effect with regards to re-expressing the Hippo kinases in some cell lines. (B) Expression of the Hippo kinases is regulated by at least three different mechanisms shown in this model, potentially targetable by different therapeutic interventions. Promoter (CpG island) hypermethylation is one mechanism that appears to modestly regulate the expression of predominantly MST1 and MST2. Histone deacetylation can also promote silencing the expression of the Hippo kinases, again particularly MST1 and MST2, and to a lesser degree LATS2. Proteosomal degradation plays a role in in regulating the expression of MST2 and could be targeted as well.
Identifying sarcoma cell lines that demonstrated loss of expression of the Hippo kinases allowed us to identify various mechanisms by which this loss of expression was occurring. These mechanisms include: regulation by ubiquitin-mediated degradation, as well as two distinct methods of epigenetic regulation, promoter hypermethylation and histone deacetylation (Figure 7B). The Itch E3 ubiquitin protein ligase has already been implicated in regulation of LATS1 [41, 42], we also identify that MST2’s expression is negatively regulated by a ubiquitin ligase in several sarcoma cell lines. Additional studies to identify this ubiquitin ligase is needed. The finding that LATS2 expression decreased with MG132 treatment in some sarcoma cell lines suggests that treatment with proteosomal inhibitors for sarcomas with decreased MST2 expression may not be effective. Additional pre-clinical studies to study these potentially competing effects are warranted.
The presence of promoter hypermethylation in the Hippo kinases, including all four of the Hippo kinases has been noted for some time in sarcomas, astrocytomas, and breast cancer [43–45]. Although some studies showed a correlation between mRNA levels and the degree of promoter hypermethylation, it was unclear how tightly promoter hypermethylation regulated Hippo kinase expression. Our in silico analysis and in vitro experiments demonstrate that promoter hypermethylation modestly regulates Hippo kinase expression, but that it can be reversed in some contexts with DNA methyltransferase inhibitors such as 5-azacytidine. Because the effects of treatment with 5-azacytidine was modest, it suggested that other epigenetic mechanisms may be responsible for regulating expression of the Hippo kinases. Since promoter hypermethylation and histone deacetylation are tightly linked processes, due to the presence of adaptor proteins that are present, we hypothesized that histone deacetylation may play a role in negatively regulating the expression of the Hippo kinases. Indeed, inhibition of histone deactylase by trichostatin A resulted in a greater than 2 fold increase in MST1 and MST2 expression in the majority of cell lines, confirming that histone deacetylation plays a role in the regulation of MST1 and MST2. This data suggests a new mechanism of dampening MST1 and MST2 expression by histone deacetylation.
Additional preclinical studies are required to evaluate the feasibility of upregulating expression of the Hippo kinases in patients with TAZ/YAP activated sarcomas by modulating proteosomal degradation of MST2, and potentially inhibiting DNA methyltransferases and histone deacetylases.
MATERIALS AND METHODS
Bioinformatics analysis
The Cancer Genome Atlas (TCGA) methylation data (acquired from Firebrowse.org) [48], utilized the following methylation array platforms: Illumina Infinium HumanMethylation27, Illumina Infinium HumanMethylation450, Illumina DNA Methylation OMA002, Illumina DNA Methylation OMA003, and the following gene expression platforms: Agilent 244K Gene Expression G4502A-07-1, Agilent 244K Gene Expression G4502A-07-2, Agilent 244K Gene Expression G4502A-07-3, Affymetrix Human Exon 1.0 ST Array, Affymetrix HT Human Genome U133 Array. Analysis included 259 sarcomas.
Tissue microarray construction
A total of 159 untreated sarcomas were retrieved from the University of Iowa Department of Pathology with previous approval from the Institutional Review Board. The tissue microarray was constructed by arraying 1.0 mm cores taken from formalin fixed paraffin embedded tissue and assembled using a MTA-1 tissue arrayer from Beecher Instruments (Sun Prairie, WI) as previously described [35]. Sarcomas were classified according to World Health Organization criteria [54].
Antibodies
Anti-TAZ (mouse monoclonal 1H9; catalog # LS-C173295) utilized for immunohistochemistry (1:50) and immunofluorescence (1:100) was obtained from LifeSpan BioSciences (Seattle, WA, USA). Anti-YAP (rabbit polyclonal, catalog #sc-15407) utilized for immunohistochemistry (1:100) and immunofluorescence (1:100) was obtained from Santa Cruz Biotechnology (Santa Cruz, CA, USA). Anti-TAZ (rabbit polyclonal, catalog# HPA007415) utilized for Western blot was obtained from Sigma-Aldrich (St. Louis, MO, USA). Anti-YAP (D8H1X XP; catalog #14074) utilized for Western blot was obtained from Cell Signaling (Danvers, MA, USA). A pan-acetyl histone H3 antibody (rabbit polyclonal, catalog# ab47915) was obtained from Abcam (Cambridge, MA, USA).
Anti-MST1 (rabbit monoclonal [EPR6207], catalog# ab124787) utilized for immunohistochemistry (1:200) and western blot (1:1000) was obtained from Abcam. Anti-MST2 (rabbit monoclonal [EP1466Y], catalog# ab52641) utilized for western blot (1:1000) was obtained from Abcam (Cambridge, MA, USA). Anti-MST2 (rabbit polyclonal, catalog# PA5-17691) utilized for immunohistochemistry (1:2000) was obtained from ThermoFisher Scientific (Waltham, MA, USA). Anti-LATS1 (goat polyclonal, catalog# sc-12494) utilized for immunohistochemistry (1:100) and western blot (1:200) was obtained from Santa Cruz (Santa Cruz, CA, USA). Anti-LATS2 (rabbit polyclonal, catalog# 20276-1-AP) utilized for western blot (1:500) was obtained from ProteinTech (Rosemont, IL, USA). Anti-LATS2 (rabbit polyclonal, catalog# ab70565) utilized for immunohistochemistry (1:100) was obtained from Abcam (Cambridge, MA, USA). Antigen retrieval using TRIS buffer (pH 9) was done on immunohistochemistry samples.
Anti-β-actin (AC-15; catalog #A5441) was obtained from Sigma-Aldrich (St. Louis, MO, USA). Alexa 568 conjugated secondary antibody (catalog# A11031 or A11036) was obtained from Invitrogen-Life Technologies (Grand Island, NY, USA). Horseradish peroxidase-conjugated secondary antibodies used for western blots were obtained from Santa Cruz Biotechnology (catalog# sc-2055, sc-2054, or sc-2033).
Western blot
Harvested cells were lysed in radioimmunoprecipitation assay (RIPA) complete lysis buffer with the addition of Complete Protease Inhibitor Cocktail (Roche) and PhosSTOP Phosphatase Inhibitor Cocktail (Roche) according to the manufacturer’s instructions. Total protein concentration was measured using Pierce BCA™ Protein Assay Kit (ThermoFisher Scientific, Waltham, MA). Proteins were transferred to a polyvinylidene difluoride (PVDF) membrane and probed with antibodies described above. Immediately after transfer, membranes were stained with 10 mLs of Ponceau S (0.1% (w/v) in 5% acetic acid) (Sigma-Aldrich, catalog# P7170) [55].
Quantitation of Western blots
Samples utilized for quantiative Western blot were run in triplicate. Western blot images were exported as tiff files and converted to grey scale jpeg images with Photoshop. The images were then quantitated in Image J using “Grey Mean Value” measured using a previous described protocol [56]. A region of interest was defined and used across blots. Protein of interest and Ponceau S loading control values were acquired, densities were inverted and background values were subtracted. Net protein/net loading control ratios were calculated for each protein. The ratios were then normalized to an internal control (cell line or cell line/treatment condition) on each blot.
Immunofluorescence staining
Cell lines were fixed with 4% paraformaldehyde (in 1X PBS) for 15 min. After washing with PBS, cells were permeabilized and blocked with 0.3% Triton X-100 and 3% fetal bovine serum for 30 min. Cells were incubated with anti-TAZ and anti-YAP antibody diluted (1:100) in 3% fetal bovine serum at 4° C overnight in a humidity chamber. The primary antibody was removed, cells washed, then incubated with Alexa Fluor 488-conjugated secondary antibody (Invitrogen-Life Technologies) for 45 minutes to 1 hr at room temperature. Immunofluorescence was visualized using a Nikon Eclipse E600 microscope (Tokyo, Japan) with SPOT imaging software or an Olympus BX-61 microscope (Tokyo, Japan) with cellSens imaging software.
Cell culture
Sarcoma cell lines were obtained from the American Type Culture Collection (ATCC, Manassas, VA, USA) and were cultured in DMEM, RPMI, or McCoy’s media (according to ATCC recommendations) containing 10% Fetal Bovine Serum (Invitrogen-Life Technologies), 1 mM sodium pyruvate, and 50μg/mL pen/strep. All cells were cultured at 37° C and 5% CO2. To detect proteosomal degradation, 10 μM MG132 was added to cells for 12 hours. To detect reconstitution of the Hippo kinases, either 5 or 10 μM 5-azacytidine (Sigma-Aldrich) was added to cell lines for 4 days. When 5-azacytidine and trichostatin A (Sigma-Aldrich) were combined, 0.125 μM, 0.25 μM, or 0.5 μM trichostatin A (maximal amount tolerated in combination with 5-azacytidine) was added for 12 hours on day 4 of the 5-azacytidine treatment. 1 μM MS-275 (Tocris, Minneapolis, MN), an additional HDAC inhibitor, was added to cell lines for 24 hours.
Fluorescence in situ hybridization
Bacterial artificial chromosome (BAC) clones that hybridized to MST1(STK4) (20q13.12), MST2(STK3) (8q22.2), LATS1 (6q25.1), and LATS2 (13q12.11) were obtained from Children’s Hospital Oakland Research Institute (Oakland, CA). For MST1(STK4) the BAC utilized was RP11-844G5 (195 kb), for MST2(STK3) the BACs utilized were RP11-208K6 (167 kb), RP11-825F16 (187 kb), and RP11-159A16 (213 kb), for LATS1 the BAC utilized was RP11-69I17 (159 kb), for LATS2 the BAC utilized was RP11-45A5 (154 kb) and RP11-22J15 (202 kb). BACs were isolated utilizing the QIAGEN Large-Construct Kit (Qiagen, Germantown, MD). 1 μg of BAC DNA was nick translated utilizing the Nick Translation Kit (Abbott Molecular Inc., Des Plaines, IL) and Spectrum Orange dUTP (Abbott Molecular Inc.). Unincorporated fluorescent labeled nucleotides were cleaned up using NucAway Spin Columns (Invitrogen by ThermoScientific, Carlsbad, CA), according to the manufacturer’s instructions. An ethanol precipitation of the eluant was performed, and probes were resuspended in 10μL molecular grade H2O. FISH studies were carried out using the above mentioned probes. Hybridizations were performed on ThermoBrite at a melt temperature of 75° C for 2 minutes. After overnight hybridization at 37° C, the slides were washed in 0.4XSSC/0.3% NP-40 for 2 minutes at 76° C and in 2XSSC/0.1% NP-40 for 1 minute at room temperature. The slides were then counterstained with DAPI. Slides were analyzed and images acquired through the CytoVision computerized imaging system (Leica, USA). 100 interphase nuclei were counted for each probe. Metaphase analysis was performed to confirm hybridization of FISH probes to the appropriate chromosome.
Quantitative reverse transcription polymerase chain reaction
Total RNA was isolated from sarcoma cell lines using TRIzol reagent (Invitrogen-Life Technologies). Total RNA was treated with DNase (Invitrogen-Life Technologies), and then column purified using the PureLink RNA mini kit (Ambion-Thermo Fisher Scientific). 1 μg of DNase treated RNA was converted to cDNA using Superscript III Reverse Transcriptase (Invitrogen-Life Technologies) and 50 ng of random primers (Promega, Madison, WI USA). PCR amplification was performed in technical triplicates on the Applied Biosystems QuantStudio 3 Real-Time PCR System (Applied Biosystems-Life Technologies). Relative quantitation was performed utilizing the delta-delta CT method and the geometric mean of ACTB (β-actin) and POLR2A (RNA Polymerase II) CT values as the reference control. The TaqMan Universal PCR Master Mix (Applied Biosystems-Life Technologies) was utilized as well as PrimeTime standard qPCR primer/probe sets from Integrated DNA Technologies (Iowa City, IA, USA). The Taqman based approach utilized the following primers and probes:
MST1(STK4)-F 5′-TTGACACTCCTTTGGCACTC-3′; MST1(STK4)-R 5′-CCTCCCACATTCCGAAAACC-3′; MST1(STK4) Probe 5′-CAGCTCCTGCAGCACCCAT TTG-3′; MST2(STK3)-F 5′-GATTTAAGAATGGTTGCAAT TTCATCT-3′ MST2(STK3)-R 5′-GACCTCTGGATTGTTA TGGAG T-3′; MST2(STK3) Probe 5′-TGGCGCTGGCTC TGTCTCA-3′;LATS1 -F 5′-GTGAAGAGATGTTTGC CAGTTG-3′; LATS1-R 5′-AGTTGTGTGATTGGTGGA GTG-3′; LATS1 Probe 5′-TGTTTGTGCCAAGAAAGGAGGTTGTC-3′; LATS2-F 5′-ACACCGACAGTTAGACA CATC-3′; LATS2-R 5′-AACTCACAGATTTCGGCCTC-3′; LATS2 Probe 5′-ACAGGACAGCATGGAGCCCAG-3′; ACTB-F 5′-ACCTTCTACAATGAGCTGCG-3′; ACTB-R 5′-CCTGGATAGCAACGTACATGG-3′; ACTB Probe 5′-ATCTGGGTCATCTTCTCGCGGTTG-3′; POLR2A-F 5′-TCAGCATGTTGGACTCGATG-3′; POLR2A-R 5′-CGTATTCGCATCATGAACAGC-3′; POLR2A- Probe 5′-ACCACCTCTTCCTCCTCTTGCATCT-3′; The following qPCR cycling conditions were used: 95° C10:00(95° C0:15, 60° C1:00)40.
PCR amplification and sequencing of WWTR1(TAZ) and YAP1
Genomic DNA was isolated from sarcoma cell lines utilizing the DNeasy Blood and Tissue Kits (Qiagen) according to the manufacturer′s instructions. 20 ng of genomic DNA was amplified utilizing GoTaq DNA polymerase (Promega, Madison, WI) and the following PCR cycling conditions: 95° C2:00(95° C0:30, 63° C0:30, 72° C0:30)35 72° C10:00. The following PCR primers were utilized:
WWTR1 Exon 2-F 5′-GCCTAGCTCGTGGCGGAAGAAGATCCTGC-3′; WWTR1 Exon 2-R 5′-GCAGTGGCAGCTCGTCGGTCACG-3′; WWTR1 Exon 6-F 5′-GCAGCATGGCACAACTGCACTAG-3′; WWTR1 Exon 6-R 5′-CTACCTGTATCCATCTCATCCA CATTGCTG-3′; YAP1 Exon 1-F 5′-CGCCGGGCATCA GATCGTGC-3′; YAP1 Exon 1-R 5′-GGACGACTCCA GTTCCACTTCGC-3′; YAP1 Exon 2-F 5′-GCACCCA TAACTGCACTGACCTC-3′; YAP1 Exon 2-R 5′-GTCTTTGCCATCTCCCAACCTGC-3′; YAP1 Exon 7-F 5′-GTCTCTGTGCCACCACCACCTGGAG-3′; YAP1 Exon 7-R 5′-CTGTATCCATCTCATCCACACTGTTCAGG-3′.
Statistics
Standard deviation for the quantitative western blots was calculated from fold change expression derived from different western blot experiments. For quantitative RT-PCR, standard deviation was calculated from fold change values from each triplicate. Correlation between fraction methylation of CpG islands and expression of the Hippo kinases (RSEM [log2]) was calculated by Spearman’s correlation coefficient.
Author contributions
NM was involved in conceptualization, formal analysis, data curation, writing, review, and editing. CF, SH, QQ, CD, JT, and AM were involved in data curation. AD was involved in data curation, formal analysis, writing, review, and editing. BD was involved in data curation, formal analysis, writing, review, and editing. MT was involved in conceptualization, project administration, formal analysis, data curation, writing, review, and editing.
ACKNOWLEDGMENTS
The authors would like to acknowledge use of the University of Iowa Central Microscopy Research Facility, a core resource supported by the Vice President for Research & Economic Development, the Holden Comprehensive Cancer Center and the Carver College of Medicine. The authors would also like to acknowledge the Cancer Center support grant P30CA086862. We also thank Keith Garcia (University of Iowa) for critical review of the manuscript.
CONFLICTS OF INTEREST
The authors do not have any conflicts of interest to report.
GRANT SUPPORT
This study was funded by a grant from the Veterans Health Administration Merit Review Program (1 I01 BX003644-01). This work was also funded in part by a pilot grant from the University of Iowa Sarcoma Foundation and start-up funds from the University of Iowa.
REFERENCES
1. Dong J, Feldmann G, Huang J, Wu S, Zhang N, Comerford SA, Gayyed MF, Anders RA, Maitra A, Pan D. Elucidation of a universal size-control mechanism in Drosophila and mammals. Cell. 2007; 130:1120–1133.
2. Zhao B, Wei X, Li W, Udan RS, Yang Q, Kim J, Xie J, Ikenoue T, Yu J, Li L, Zheng P, Ye K, Chinnaiyan A, et al. Inactivation of YAP oncoprotein by the Hippo pathway is involved in cell contact inhibition and tissue growth control. Genes Dev. 2007; 21:2747–2761.
3. Chan SW, Lim CJ, Guo K, Ng CP, Lee I, Hunziker W, Zeng Q, Hong W. A role for TAZ in migration, invasion, and tumorigenesis of breast cancer cells. Cancer Res. 2008; 68:2592–2598.
4. Zhao D, Zhi X, Zhou Z, Chen C. TAZ antagonizes the WWP1-mediated KLF5 degradation and promotes breast cell proliferation and tumorigenesis. Carcinogenesis. 2012; 33:59–67.
5. Wang L, Shi S, Guo Z, Zhang X, Han S, Yang A, Wen W, Zhu Q. Overexpression of YAP and TAZ is an independent predictor of prognosis in colorectal cancer and related to the proliferation and metastasis of colon cancer cells. PLoS One. 2013; 8:e65539.
6. Zender L, Spector MS, Xue W, Flemming P, Cordon-Cardo C, Silke J, Fan ST, Luk JM, Wigler M, Hannon GJ, Mu D, Lucito R, Powers S, et al. Identification and validation of oncogenes in liver cancer using an integrative oncogenomic approach. Cell. 2006; 125:1253–1267.
7. Zhou Z, Hao Y, Liu N, Raptis L, Tsao MS, Yang X. TAZ is a novel oncogene in non-small cell lung cancer. Oncogene. 2011; 30:2181–2186.
8. Xie M, Zhang L, He CS, Hou JH, Lin SX, Hu ZH, Xu F, Zhao HY. Prognostic significance of TAZ expression in resected non-small cell lung cancer. J Thorac Oncol. 2012; 7:799–807.
9. Zhang W, Nandakumar N, Shi Y, Manzano M, Smith A, Graham G, Gupta S, Vietsch EE, Laughlin SZ, Wadhwa M, Chetram M, Joshi M, Wang F, et al. Downstream of mutant KRAS, the transcription regulator YAP is essential for neoplastic progression to pancreatic ductal adenocarcinoma. Sci Signal. 2014; 7:ra42.
10. de Cristofaro T, Di Palma T, Ferraro A, Corrado A, Lucci V, Franco R, Fusco A, Zannini M. TAZ/WWTR1 is overexpressed in papillary thyroid carcinoma. Eur J Cancer. 2011; 47:926–933.
11. Kanai F, Marignani PA, Sarbassova D, Yagi R, Hall RA, Donowitz M, Hisaminato A, Fujiwara T, Ito Y, Cantley LC, Yaffe MB. TAZ: a novel transcriptional co-activator regulated by interactions with 14-3-3 and PDZ domain proteins. EMBO J. 2000; 19:6778–6791.
12. Sudol M, Bork P, Einbond A, Kastury K, Druck T, Negrini M, Huebner K, Lehman D. Characterization of the mammalian YAP (Yes-associated protein) gene and its role in defining a novel protein module, the WW domain. J Biol Chem. 1995; 270:14733–14741.
13. Varelas X, Sakuma R, Samavarchi-Tehrani P, Peerani R, Rao BM, Dembowy J, Yaffe MB, Zandstra PW, Wrana JL. TAZ controls Smad nucleocytoplasmic shuttling and regulates human embryonic stem-cell self-renewal. Nat Cell Biol. 2008; 10:837–848.
14. Hong JH, Hwang ES, McManus MT, Amsterdam A, Tian Y, Kalmukova R, Mueller E, Benjamin T, Spiegelman BM, Sharp PA, Hopkins N, Yaffe MB. TAZ, a transcriptional modulator of mesenchymal stem cell differentiation. Science. 2005; 309:1074–1078.
15. Murakami M, Nakagawa M, Olson EN, Nakagawa O. A WW domain protein TAZ is a critical coactivator for TBX5, a transcription factor implicated in Holt-Oram syndrome. Proceedings of the National Academy of Sciences of the United States of America. 2005; 102:18034–18039.
16. Zhao B, Ye X, Yu J, Li L, Li W, Li S, Yu J, Lin JD, Wang CY, Chinnaiyan AM, Lai ZC, Guan KL. TEAD mediates YAP-dependent gene induction and growth control. Genes Dev. 2008; 22:1962–1971.
17. Zhang H, Liu CY, Zha ZY, Zhao B, Yao J, Zhao S, Xiong Y, Lei QY, Guan KL. TEAD transcription factors mediate the function of TAZ in cell growth and epithelial-mesenchymal transition. J Biol Chem. 2009; 284:13355–13362.
18. Harvey KF, Pfleger CM, Hariharan IK. The Drosophila Mst ortholog, hippo, restricts growth and cell proliferation and promotes apoptosis. Cell. 2003; 114:457–467.
19. Udan RS, Kango-Singh M, Nolo R, Tao C, Halder G. Hippo promotes proliferation arrest and apoptosis in the Salvador/Warts pathway. Nat Cell Biol. 2003; 5:914–920.
20. Wu S, Huang J, Dong J, Pan D. hippo encodes a Ste-20 family protein kinase that restricts cell proliferation and promotes apoptosis in conjunction with salvador and warts. Cell. 2003; 114:445–456.
21. Justice RW, Zilian O, Woods DF, Noll M, Bryant PJ. The Drosophila tumor suppressor gene warts encodes a homolog of human myotonic dystrophy kinase and is required for the control of cell shape and proliferation. Genes Dev. 1995; 9:534–546.
22. Xu T, Wang W, Zhang S, Stewart RA, Yu W. Identifying tumor suppressors in genetic mosaics: the Drosophila lats gene encodes a putative protein kinase. Development. 1995; 121:1053–1063.
23. Lai ZC, Wei X, Shimizu T, Ramos E, Rohrbaugh M, Nikolaidis N, Ho LL, Li Y. Control of cell proliferation and apoptosis by mob as tumor suppressor, mats. Cell. 2005; 120:675–685.
24. Pantalacci S, Tapon N, Leopold P. The Salvador partner Hippo promotes apoptosis and cell-cycle exit in Drosophila. Nat Cell Biol. 2003; 5:921–927.
25. Zhao B, Li L, Wang L, Wang CY, Yu J, Guan KL. Cell detachment activates the Hippo pathway via cytoskeleton reorganization to induce anoikis. Genes Dev. 2012; 26:54–68.
26. Azzolin L, Zanconato F, Bresolin S, Forcato M, Basso G, Bicciato S, Cordenonsi M, Piccolo S. Role of TAZ as mediator of Wnt signaling. Cell. 2012; 151:1443–1456.
27. Azzolin L, Panciera T, Soligo S, Enzo E, Bicciato S, Dupont S, Bresolin S, Frasson C, Basso G, Guzzardo V, Fassina A, Cordenonsi M, Piccolo S. YAP/TAZ incorporation in the beta-catenin destruction complex orchestrates the Wnt response. Cell. 2014; 158:157–170.
28. Huang W, Lv X, Liu C, Zha Z, Zhang H, Jiang Y, Xiong Y, Lei QY, Guan KL. The N-terminal phosphodegron targets TAZ/WWTR1 protein for SCFbeta-TrCP-dependent degradation in response to phosphatidylinositol 3-kinase inhibition. J Biol Chem. 2012; 287:26245–26253.
29. Fan R, Kim NG, Gumbiner BM. Regulation of Hippo pathway by mitogenic growth factors via phosphoinositide 3-kinase and phosphoinositide-dependent kinase-1. Proceedings of the National Academy of Sciences of the United States of America. 2013; 110:2569–2574.
30. Yu FX, Zhao B, Panupinthu N, Jewell JL, Lian I, Wang LH, Zhao J, Yuan H, Tumaneng K, Li H, Fu XD, Mills GB, Guan KL. Regulation of the Hippo-YAP pathway by G-protein-coupled receptor signaling. Cell. 2012; 150:780–791.
31. Yu FX, Luo J, Mo JS, Liu G, Kim YC, Meng Z, Zhao L, Peyman G, Ouyang H, Jiang W, Zhao J, Chen X, Zhang L, et al. Mutant Gq/11 promote uveal melanoma tumorigenesis by activating YAP. Cancer Cell. 2014; 25:822–830.
32. Feng X, Degese MS, Iglesias-Bartolome R, Vaque JP, Molinolo AA, Rodrigues M, Zaidi MR, Ksander BR, Merlino G, Sodhi A, Chen Q, Gutkind JS. Hippo-independent activation of YAP by the GNAQ uveal melanoma oncogene through a trio-regulated rho GTPase signaling circuitry. Cancer Cell. 2014; 25:831–845.
33. Harvey KF, Zhang X, Thomas DM. The Hippo pathway and human cancer. Nat Rev Cancer. 2013; 13:246–257.
34. Mo JS, Park HW, Guan KL. The Hippo signaling pathway in stem cell biology and cancer. EMBO Rep. 2014; 15:642–656.
35. Fullenkamp CA, Hall SL, Jaber OI, Pakalniskis BL, Savage EC, Savage JM, Ofori-Amanfo GK, Lambertz AM, Ivins SD, Stipp CS, Miller BJ, Milhem MM, Tanas MR. TAZ and YAP are frequently activated oncoproteins in sarcomas. Oncotarget. 2016; 7:30094–30108. https://doi.org/10.18632/oncotarget.8979.
36. Errani C, Zhang L, Sung YS, Hajdu M, Singer S, Maki RG, Healey JH, Antonescu CR. A novel WWTR1-CAMTA1 gene fusion is a consistent abnormality in epithelioid hemangioendothelioma of different anatomic sites. Genes Chromosomes Cancer. 2011; 50:644–653.
37. Tanas MR, Sboner A, Oliveira AM, Erickson-Johnson MR, Hespelt J, Hanwright PJ, Flanagan J, Luo Y, Fenwick K, Natrajan R, Mitsopoulos C, Zvelebil M, Hoch BL, et al. Identification of a disease-defining gene fusion in epithelioid hemangioendothelioma. Sci Transl Med. 2011; 3:98ra82.
38. Tanas MR, Ma S, Jadaan FO, Ng CK, Weigelt B, Reis-Filho JS, Rubin BP. Mechanism of action of a WWTR1(TAZ)-CAMTA1 fusion oncoprotein. Oncogene. 2016; 35:929–938.
39. Antonescu CR, Le Loarer F, Mosquera JM, Sboner A, Zhang L, Chen CL, Chen HW, Pathan N, Krausz T, Dickson BC, Weinreb I, Rubin MA, Hameed M, et al. Novel YAP1-TFE3 fusion defines a distinct subset of epithelioid hemangioendothelioma. Genes Chromosomes Cancer. 2013; 52:775–784.
40. Eisinger-Mathason TS, Mucaj V, Biju KM, Nakazawa MS, Gohil M, Cash TP, Yoon SS, Skuli N, Park KM, Gerecht S, Simon MC. Deregulation of the Hippo pathway in soft-tissue sarcoma promotes FOXM1 expression and tumorigenesis. Proceedings of the National Academy of Sciences of the United States of America. 2015; 112:E3402–3411.
41. Ho KC, Zhou Z, She YM, Chun A, Cyr TD, Yang X. Itch E3 ubiquitin ligase regulates large tumor suppressor 1 stability [corrected]. Proceedings of the National Academy of Sciences of the United States of America. 2011; 108:4870–4875.
42. Salah Z, Melino G, Aqeilan RI. Negative regulation of the Hippo pathway by E3 ubiquitin ligase ITCH is sufficient to promote tumorigenicity. Cancer Res. 2011; 71:2010–2020.
43. Takahashi Y, Miyoshi Y, Takahata C, Irahara N, Taguchi T, Tamaki Y, Noguchi S. Down-regulation of LATS1 and LATS2 mRNA expression by promoter hypermethylation and its association with biologically aggressive phenotype in human breast cancers. Clin Cancer Res. 2005; 11:1380–1385.
44. Jiang Z, Li X, Hu J, Zhou W, Jiang Y, Li G, Lu D. Promoter hypermethylation-mediated down-regulation of LATS1 and LATS2 in human astrocytoma. Neurosci Res. 2006; 56:450–458.
45. Seidel C, Schagdarsurengin U, Blumke K, Wurl P, Pfeifer GP, Hauptmann S, Taubert H, Dammann R. Frequent hypermethylation of MST1 and MST2 in soft tissue sarcoma. Mol Carcinog. 2007; 46:865–871.
46. Lei QY, Zhang H, Zhao B, Zha ZY, Bai F, Pei XH, Zhao S, Xiong Y, Guan KL. TAZ promotes cell proliferation and epithelial-mesenchymal transition and is inhibited by the hippo pathway. Mol Cell Biol. 2008; 28:2426–2436.
47. Cordenonsi M, Zanconato F, Azzolin L, Forcato M, Rosato A, Frasson C, Inui M, Montagner M, Parenti AR, Poletti A, Daidone MG, Dupont S, Basso G, et al. The Hippo transducer TAZ confers cancer stem cell-related traits on breast cancer cells. Cell. 2011; 147:759–772.
48. www.firebrowse.org.
49. Stresemann C, Lyko F. Modes of action of the DNA methyltransferase inhibitors azacytidine and decitabine. Int J Cancer. 2008; 123:8–13.
50. Nan X, Ng HH, Johnson CA, Laherty CD, Turner BM, Eisenman RN, Bird A. Transcriptional repression by the methyl-CpG-binding protein MeCP2 involves a histone deacetylase complex. Nature. 1998; 393:386–389.
51. Ng HH, Zhang Y, Hendrich B, Johnson CA, Turner BM, Erdjument-Bromage H, Tempst P, Reinberg D, Bird A. MBD2 is a transcriptional repressor belonging to the MeCP1 histone deacetylase complex. Nat Genet. 1999; 23:58–61.
52. Codd R, Braich N, Liu J, Soe CZ, Pakchung AA. Zn(II)-dependent histone deacetylase inhibitors: suberoylanilide hydroxamic acid and trichostatin A. Int J Biochem Cell Biol. 2009; 41:736–739.
53. Mohamed AD, Tremblay AM, Murray GI, Wackerhage H. The Hippo signal transduction pathway in soft tissue sarcomas. Biochim Biophys Acta. 2015; 1856:121–129.
54. Fletcher CDM, Krishna Unni K, Martens F. Pathology and Genetics of Tumours of Soft Tissue and Bone. (Lyon, France: IARC Press). 2013.
55. Romero-Calvo I, Ocon B, Martinez-Moya P, Suarez MD, Zarzuelo A, Martinez-Augustin O, de Medina FS. Reversible Ponceau staining as a loading control alternative to actin in Western blots. Anal Biochem. 2010; 401:318–320.