

INTRODUCTION
Brain aging and related neural degenerative diseases have become a serious health issue with the continuing growth of the elder population [1–3]. Therefore, an increasing amount attention has been drawn to research areas where new tools for investigating brain aging process are studied [4–6]; with the purpose of unraveling its underlying mechanism and discovering treatments that could effectively prevent and slow down the progression of brain aging. Development, maturity and aging of brain tissue are extremely complex processes involving morphological and structural changes [7]. The development of non-invasive in vivo imaging techniques such as MRI [8, 9], DTI [10–12] have greatly improved our ability in evaluating the structural and functional changes caused by brain aging. Although DTI can evaluate the micro-structural characteristics of a tissue, it responds less accurately to areas with more nerve fibers and complex structures. Recently, DKI has emerged as a powerful imaging technique as an extension DTI [13, 14]. DKI aims to describe the non-Gaussian aspects of water diffusion and which can more realistically and objectively reflect tissue micro-structure. In this study, in vivo DKI experiments were performed on normal SD rats to analyze the water diffusion values in different brain regions including CT, EC and CPu and to reveal the relationship between the changes in these values and brain aging. This study was designed to further explore the physiological and pathological changes related to normal aging of brain tissue by employing DKI technique and to lay the foundation for studies of age-related degenerative diseases.
Data analysis
Regions of interest (ROIs) were manually defined in a DKI map at Figure 1 according to the anatomical landmarks identified from the standard rat brain atlas [15], including three regions: the CT, EC and CPu region. Two standard diffusion kurtosis metrics, MK and radial K⊥, were measured for each region. MK and K⊥ were measured again at one week and one month, and the average values were recorded as the corresponding diffusion values.
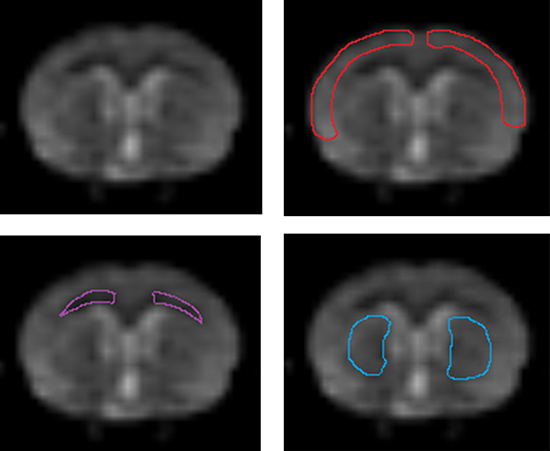
Figure 1: DKI images, and the cerebral cortex, outer capsule, and caudate putamen displayed at the corresponding location in the DKI image.
Using SPSS 17.0, we evaluated the differences in diffusion values between the left and right side of the CT, EC and CPu region using paired-sample T tests. Additionally, we tested the significance of differences in diffusion values based on brain regions and age groups using one-way ANOVA followed by the LSD test. Finally, we analyzed the relationships of different age groups with the diffusion values for each examined brain region and plotted these values against age groups.
RESULTS
The results of measurement and statistical analysis of the MK and K⊥ values for the left and right CT, EC and CPu are shown in Table 1. The results from paired-samples T tests indicated no laterality of the MK and K⊥ values was found for the CT, EC or CPu brain region (P < 0.05). Subsequently, the diffusion values were analyzed separately for each hemisphere to detect hemisphere-specific differences.
Table 1: The results of measurement and statistical analysis of the MK and K⊥values for the left and right CT, EC and CPu
Brain area |
Month |
MK |
K⊥ |
||||||
|---|---|---|---|---|---|---|---|---|---|
Left |
Right |
t |
P |
Left |
Right |
t |
P |
||
CT |
3 |
0.685 ± 0.064 |
0.664 ± 0.074 |
0.679 |
0.514 |
0.617 ± 0.065 |
0.638 ± 0.059 |
-0.778 |
0.456 |
6 |
0.713 ± 0.174 |
0.696 ± 0.076 |
0.380 |
0.713 |
0.644 ± 0.139 |
0.649 ± 0.126 |
-0.104 |
0.919 |
|
10 |
0.670 ± 0.092 |
0.692 ± 0.061 |
–1.059 |
0.317 |
0.646 ± 0.099 |
0.659 ± 0.094 |
-0.381 |
0.712 |
|
13 |
0.403 ± 0.074 |
0.417 ± 0.135 |
–0.436 |
0.673 |
0.482 ± 0.111 |
0.490 ± 0.140 |
-0.167 |
0.871 |
|
EC |
3 |
0.771 ± 0.076 |
0.753 ± 0.088 |
1.217 |
0.255 |
0.714 ± 0.074 |
0.694 ± 0.095 |
0.492 |
0.634 |
6 |
0.867 ± 0.140 |
0.819 ± 0.115 |
1.614 |
0.141 |
0.833 ± 0.092 |
0.810 ± 0.132 |
0.600 |
0.564 |
|
10 |
0.839 ± 0.096 |
0.842 ± 0.077 |
–0.089 |
0.931 |
0.805 ± 0.105 |
0.787 ± 0.080 |
0.448 |
0.665 |
|
13 |
0.440 ± 0.102 |
0.461 ± 0.080 |
-0.854 |
0.415 |
0.508 ± 0.102 |
0.545 ± 0.077 |
–1.717 |
0.120 |
|
CPu |
3 |
0.796 ± 0.105 |
0.777 ± 0.070 |
0.974 |
0.355 |
0.729 ± 0.117 |
0.752 ± 0.118 |
–0.774 |
0.459 |
6 |
0.928 ± 0.152 |
0.900 ± 0.190 |
0.565 |
0.586 |
0.878 ± 0.135 |
0.895 ± 0.191 |
–0.241 |
0.815 |
|
10 |
0.863 ± 0.054 |
0.854 ± 0.083 |
-0.255 |
0.799 |
0.859 ± 0.104 |
0.847 ± 0.112 |
0.476 |
0.645 |
|
13 |
0.709 ± 0.125 |
0.670 ± 0.105 |
1.294 |
0.228 |
0.676 ± 0.138 |
0.648 ± 0.124 |
0.750 |
0.472 |
|
The results of measurement and statistical analysis of the MK values in the CT, EC and CPu region for four age groups are summarized at Figure 2. The results showed that the MK values at the both hemispheres of CT and EC regions varied significantly among different age groups. The MK values at the CPu region were significantly different between M3 and M6, between M6 and M13, and between M10 and M13.
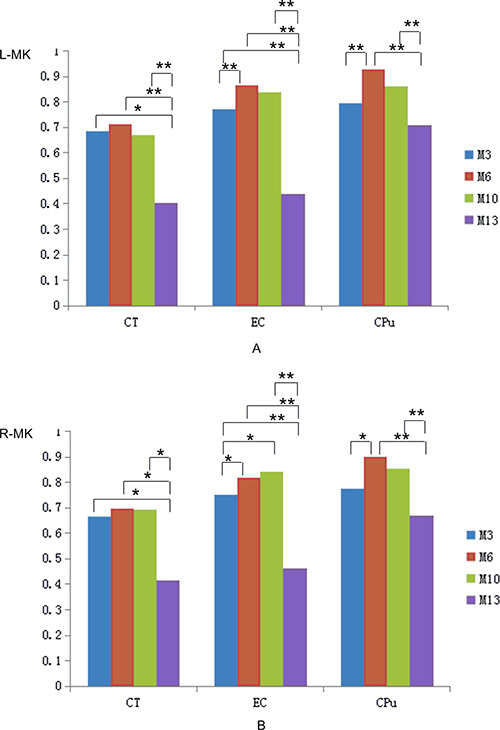
Figure 2: Comparison of the MK values for the CT, the EC and the CPu among different age groups. “*”P < 0.05; “**”P < 0.01. (A) Left. (B) Right.
The results of measurement and statistical analysis of the K⊥ values in the CT, the EC and the CPu regions for four age groups are summarized at Figure 3. The results showed that the K⊥ value at the CT region for M13 age group was significantly smaller than that for M3, M6 and M10 age group. The K⊥ values at the EC and CPu region in both hemispheres varied among all age groups.
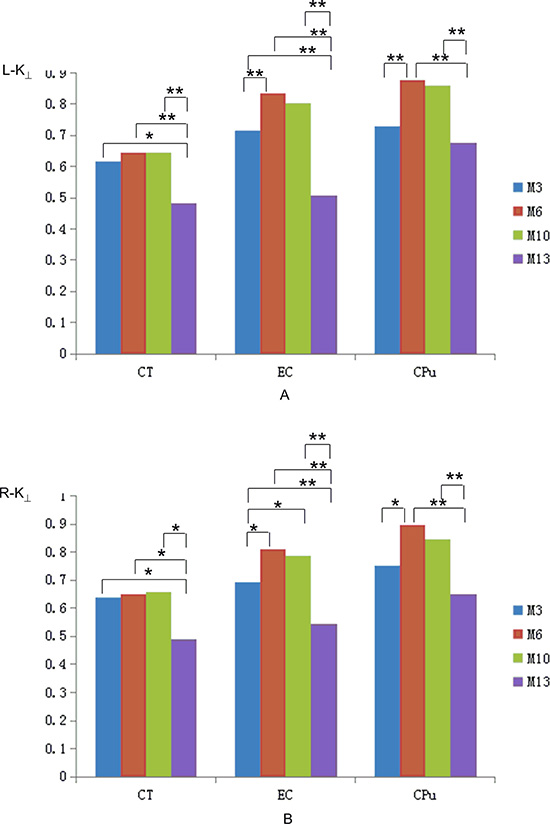
Figure 3: Comparison of the K⊥ values for the CT, the EC and the CPu among different age groups. “*”P < 0.05; “**”P < 0.01. (A) Left. (B) Right.
The scatter diagrams of the MK and K⊥ values for each brain region over time showed a nonlinear relationship. To further evaluate the correlation between the diffusion values and age groups, four models, exponential, logarithmic, quadratic and cubic models, were assessed for curve fitting of the MK and K⊥ values. The results showed that the MK and K⊥ values of the CT, EC and CPu in both hemispheres over time can best fit a parabolic curve, the peak of which corresponded to an age of approximately 6 months.
The quadratic functions of the MK and K⊥ values for the CT, EC and CPu in both hemispheres were as follows:
MK:
Left CT: Y = 0.477+0.086X-0.007X2(R2 = 0.57, P = 0.000),
Right CT: Y = 0.426+0.096X-0.007X2(R2 = 0.599, P = 0.000),
Left EC: Y = 0.382+0.159X-0.012X2(R2 = 0.712, P = 0.000),
Right EC: Y = 0.387+0.146X-0.011X2(R2 = 0.688, P = 0.000),
Left CPu: Y = 0.565+0.099X-0.007X2(R2 = 0.351, P = 0.000), and
Right CPu: Y = 0.524+0.106X-0.007X2(R2 = 0.365, R2 = 0.000);
K⊥:
Left CT: Y = 0.486+0.054X-0.004X2(R2 = 0.307, R2 = 0.001),
Right CT: Y = 0.515+0.05X-0.004X2(R2 = 0.282, R2 = 0.002),
Left EC: Y = 0.394+0.133X-0.01X2(R2 = 0.675, R2 = 0.000),
Right EC: Y = 0.388+0.126X-0.009X2(R2 = 0.547, R2 = 0.000),
Left CPu: Y = 0.473+0.108X-0.007X2(R2 = 0.321, R2 = 0.001), and
Right CPu: Y = 0.467+0.12X-0.008X2(R2 = 0.337, R2 = 0.001).
The results of measurement and statistical analysis of the MK values for M3, M6, M10 and M13 age groups at each brain region are summarized in Figure 4. It was found that MK values for M3, M6 and M10 age groups vary across the three brain regions examined. Whereas the MK value for M13 group was only significantly different between the CPu and both the CT and the EC.
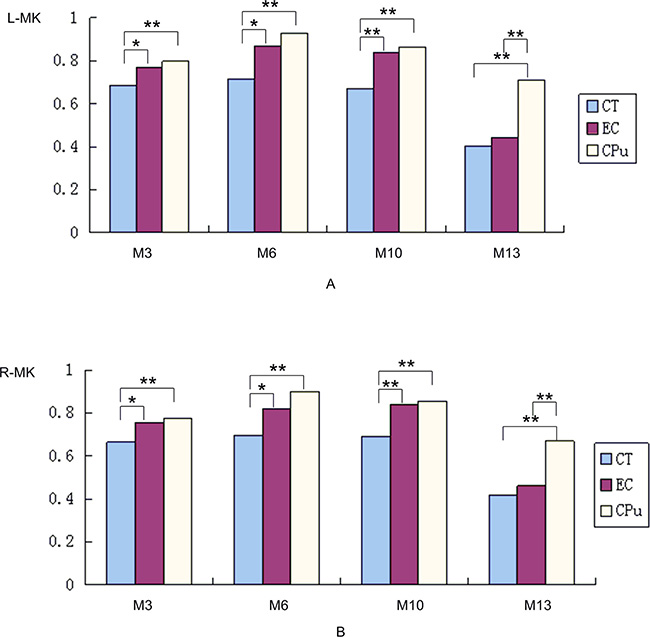
Figure 4: Comparison of the MK values at M3, M6, M10 and M13 among different brain regions. *P < 0.05; **P < 0.01. (A) Left. (B) Right.
The results of measurement and statistical analysis of the K⊥ values at M3, M6, M10 and M13 age groups for each brain region are summarized in Figure 5. No significant difference in the K⊥ values was observed among the examined brain regions in the left hemisphere for M3 age group. In contrast, significant differences in the K⊥ values were observed between the CT and both the EC and the CPu in the right hemisphere for M3 age group in both hemispheres at M6 and M10. Lastly, the K⊥ value at the CPu region was different from that for the CT and the EC for M13 age group.
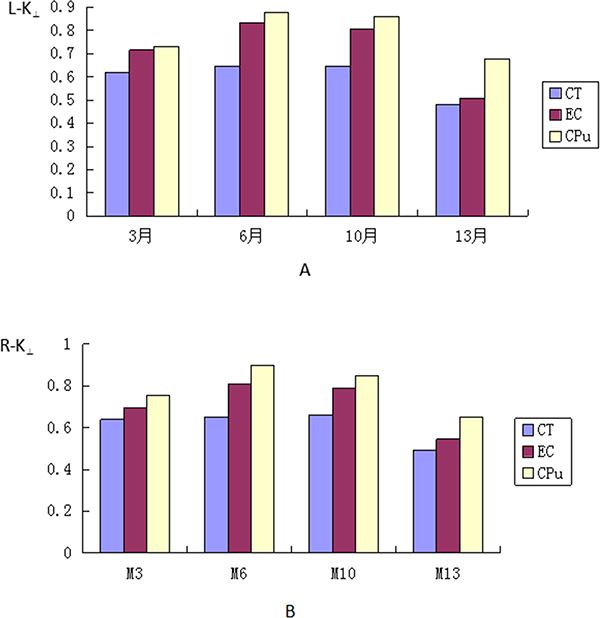
Figure 5: Comparison of the K⊥ values at M3, M6, M10 and M13 among different brain regions. “*”P < 0.05; “**”P < 0.01. (A) Left. (B) Right.
The average MK and K⊥ values at M3, M6, M10 and M13 varied from maximum to minimum in the following order: CPu>EC>CT.
DISCUSSION
The focus of this study was to explore the age-related changes in SD rats by taking advantage of the DKI technique and analyzing the tissue diffusion values. To exclude the effects of gender, only male SD rats were selected for this study.
Comparing the age of rats to the age of humans
A comprehensive comparison of rat age versus human age was described in a previous article: sexual maturity occurs in rats at about six weeks old and in humans at approximately 12 to 13 years old [16]. Social maturity is attained at five to six months of age in rats and between 18 and 20 years in humans. A rat at 12 months old is equivalent to a human at 35 to 40 years old, and a 24–month-old rat is equivalent to a 65- to 70-year-old human. This study used SD rats of three, six, ten, and thirteen months old, which are equivalent to humans at the stages of development and maturity.
The laterality of the CT, EC and CPu for each parameter
The left and right cerebral hemispheres are unified, but their functions are not exactly identical. One study found that the left and right hemispheres were asymmetrical in terms of both structure and function; specifically, the cerebral volume and the gray matter to white matter ratio of the left hemisphere exceed those of the right hemisphere [17]. To determine whether diffusion values displayed laterality, this study analyzed the laterality of the MK and K⊥ values for multiple brain regions. The results indicated no laterality of the MK and K⊥ values at the EC, CT or CPu region. One previous voxel-based DTI analysis of the whole brain by Inano S and colleagues also found no significant difference in diffusion values between hemispheres, and the lack of laterality does not change with age [18].
Both MK and K⊥ values reflect the diffusion properties of water molecules within a structure. Therefore, the factors that affect the diffusion of water molecules can alter the MK and K⊥ values. One study reported no significant laterality in the total volume of cerebral white matter, the total volume, the total length, length density, volume density or average diameter of myelinated nerve fibers in white matter, or the number of oligodendroglia. In addition, that study demonstrated that the number of neurons in the cortex did not decrease appreciably over time. All of the above results can effectively explain why no significant difference in diffusion parameters was found between the left and right cerebral hemispheres.
Comparison of the diffusion parameters between age groups and their correlation with age
In this study, the MK values for the CT, the EC and the CPu in both hemispheres differed among age groups, although not between every two age groups based on the LSD test. In particular, a greater difference in the MK values for different brain regions was found between 13 months and the rest age groups. MK can be regarded as an index of tissue microstructural complexity. The results showing a difference in MK values between age groups emphasize that the organizational microstructure of the brain is continually developing. Age-related analysis and curve fitting revealed that the MK values for all examined brain regions first positively correlated and then negatively correlated with age, fitting a parabolic function. Cheung et al. [19] reported that MK in rodents gradually increased from birth to maturity, as reflected by increasing region of the parabola. Alternatively, the downward stage corresponded to the results of Lätt et al. [20]. Regarding the subjects examined, Cheung et al. selected normal SD rats of 3 different ages: postnatal days 13, 31 and 120; these time points extended to only maturity. In contrast, Lätt et al. exclusively examined normal adults over 20 years old as subjects. By comparison, the present study combined the design of the above two reports. Thus, our results provide a more accurate and comprehensive description of the development of normal brain tissues.
From the physiological perspective, the period from birth to maturity is an important stage of brain tissue development. White matter maturation processes include increasing the density of fiber bundles and axons, the diameter of axons and the number of neurofibrils, altering axonal membrane permeability, [21–25] and enhancing the complexity of the extracellular matrix and microtubule-associated proteins [22, 24, 25]. In gray matter, aside from the addition of basal dendrites and the modification of tissue water content and cell packing density, changes in cortical cytoarchitecture are known to affect water diffusion behavior [22, 26, 27]. Therefore, the MK values positively correlate with age during this stage. With further increases in age, nerve fibers become damaged, myelin breaks down and the total length, number of nodes, number of dendritic spines, and density of dendritic spines decrease, all of which reduce the impedance of water diffusion [28, 29]. Therefore, the MK values negatively correlate with age at this stage.
MK corresponds to the apparent kurtosis coefficient averaged over all directions, just as the mean diffusivity corresponds to the diffusion coefficient averaged over all directions. The radial direction is the maximum limited direction for water molecular diffusion; thus, the K⊥ value is considered as its primary influencing factor. Identical to MK, K⊥ displayed parabolic changes against age. A possible explanation for this finding is that K⊥ is related to the integrity of nerve fibers and during the stages of brain development and maturity, the K⊥ values increase due to the processes of myelination and dense axon fiber packing, which greatly restrict diffusion in the radial direction. The subsequent decrease in K⊥ results from myelinoclasis and debris formation, which reduce the impedance of water diffusion. The same with MK, which was affected by age, K⊥ initially increased in a pattern that was identical to the results of Cheung et al. and then decreased in a manner that was identical to the results of Lätt et al. In pathological cases, in which myelin breakdown and debris formation are observed, K⊥ will decrease. As the K⊥ value reflects the integrity of nerve fibers in a structure, many clinical investigators have used K⊥ to evaluate a variety of central nervous system diseases, especially leukodystrophy, aiming to more rapidly detect demyelinating diseases.
Comparison of the MK and K⊥ values among different brain regions
The magnitude of the mean MK and K⊥ values displayed the following pattern from maximum to minimum: CPu>EC>CT. Because MK is regarded as an index of tissue microstructural complexity, based on these results, we propose that the structure of the CPu is the most complex, followed by the EC and, finally, the CT. The authors hypothesize that these differences are related to the structural characteristics of these three organizational structures. The EC, a white matter tissue, is composed of neurites encapsulated by myelin into myelinated nerve fibers. Circular phospholipids of myelin sheath, the outer layer of nerve fibers, clearly limit the diffusion of water molecules. The CT is a gray matter structure that is composed of the cell bodies of neurons. The CPu contains a complex mixture of gray matter and white matter; thus, the properties of water molecule diffusion in the CPu are affected by the diffusion properties of both gray matter and white matter.
In addition, research has shown that the ApoEε4 gene can significantly reduce the complexity of tissue structure, and destroy the integrity of nerve fibers. The microstructure change of the normal human brain that carry this gene will be more obvious [30]. Whether the difference of the MK or K⊥ values in different regions in this study was related to ApoEε4 gene needed to be explored further.
METHODS
Animal preparation
All animal experiments, using a total of 50 male SD rats (20 at nine weeks old, 10 at six months old, 10 at ten months old, and 20 at ten months old), were approved by Beijing Vital River Laboratory Animal Technology Co., Ltd. The animals were housed in standard polypropylene cages with wired-net tops in a controlled room (temperature 21 ± 2° C, 12 h light-dark cycle) and were allowed free access to a standard laboratory pellet diet and water throughout the experiment. The animals were assigned to age groups of 3 months (M3), 6 months (M6), 10 months (M10) and 13 months (M13). The study received approval from the ethics committee of the Second Hospital of Hebei Medical University.
The inclusion and exclusion criteria were as follows: (1) no dysplasia, (2) no abnormal signals discovered by routine MRI examination, (3) exclusion of unsatisfactory images by image post-processing. The following table shows the specific groups (Table 2).
Table 2: The allocation of animals
Group |
Months old |
Gender |
Number of animals |
|---|---|---|---|
1 |
3 |
male |
10 |
2 |
6 |
male |
10 |
3 |
10 |
male |
10 |
4 |
13 |
male |
10 |
Data collection
Imaging was performed using a horizontal 3.0 Tesla MR system (GE HD750) equipped with a 50 mm inner diameter coil. The animals were anesthetized with 10% chloral hydrate via intraperitoneal injection at 0.3 ml/100 g. Then, all animals underwent conventional MRI, including coronal T1WI and coronal, sagittal and axial T2WI and DKI. The acquisition parameters were as follows: coronal T1WI: TR/TE = 2833.3/24 ms, data matrix = 256 × 192, number of excitations (NEX) = 3, FOV = 60 mm, slice thickness = 3 mm, slice gap = 0 mm, and angle = 111 degrees; coronal T2WI: TR/TE = 1500/25.5 ms, data matrix = 512 × 512, NEX = 10, FOV = 60 mm, slice thickness = 3 mm, slice gap = 0 mm, and angle = 111 degrees; sagittal T2WI: TR/TE = 1545/44.7 ms, data matrix = 512 × 512, NEX = 10, FOV = 60 mm, slice thickness = 3 mm, slice gap = 0 mm, and angle = 111 degrees; axial T2WI: TR/TE = 2303/46.8 ms, data matrix = 512 × 512, NEX = 10, FOV = 60 mm, slice thickness = 3 mm, slice gap = 0 mm, and angle = 111 degrees; and DKI pulse sequence: a subsaturation zone covering the respiratory tract to reduce image artifacts, a shim of 6 cm × 6 cm in size covering the entire brain, TR/TE = 2000/97.3 ms, data matrix = 64 × 64, FOV = 60 mm, slice thickness = 4 mm, slice gap = 0 mm, NEX = 2, number of diffusion-encoding gradient directions = 25, number of b0 = 5, and b-values (0, 1000, and 2000 s/mm2) applied along each direction.
CONCLUSIONS
In conclusion, we have studied the changes of the water diffusion values in different brain regions among different age groups based on DKI results using rodents model. We subsequently determined the correlations of these values with age, and plotted these values in various brain regions against age groups. Our studies have covered a relative full spectrum of subject age groups and are complementary to the existing studies. DKI has been used as an efficient tool for evaluating brain aging process and this method will lay a foundation and provide new concepts for further studies of normal brain aging and neurodegenerative diseases. However, due to the limited numbers of age groups and experimental subjects, the observation of significant results is yet to be further supported by more extensive experimentations. Selecting a longitudinal study design would yield additional information about brain aging. Study of greater numbers of subjects and age groups will enable us to obtain equation coefficients for improved accuracy and produce more reliable conclusions. With the wide application of DKI in scientific research and clinical practice, we believe that DKI will facilitate the study of normal aging-related and pathological changes in brain tissue.
Author contributions
Xuefang Han: study design, data acquisition and analysis, manuscript drafting and revising; Zuojun Geng: study design, data analysis, manuscript drafting and revising; Qingfeng Zhu and Zhenhu Song: study design, data acquisition, and manuscript revising; Huandi Lv: study design, data acquisition, manuscript drafting and revising. All authors read and approved the final manuscript.
CONFLICTS OF INTEREST
The authors declare that they have no competing interests.
REFERENCES
1. Thal DR, Del Tredici K, Braak H. Neurodegeneration in normal brain aging and disease. Science's SAGE KE. 2004; 2004:26.
2. Ferreira LK, Busatto GF. Resting-state functional connectivity in normal brain aging. Neuroscience & Biobehavioral Reviews. 2013; 37:384–400.
3. Jagust W, Gitcho A, Sun F, Kuczynski B, Mungas D, Haan M. Brain imaging evidence of preclinical Alzheimer's disease in normal aging. Annals of neurology. 2006; 59:673–681.
4. Ge Y, Grossman RI, Babb JS, Rabin ML, Mannon LJ, Kolson DL. Age-related total gray matter and white matter changes in normal adult brain. Part I: volumetric MR imaging analysis. American journal of neuroradiology. 2002; 23:1327–1333.
5. Angelie E, Bonmartin A, Boudraa A, Gonnaud PM, Mallet JJ, Sappey-Marinier D. Regional differences and metabolic changes in normal aging of the human brain: proton MR spectroscopic imaging study. American Journal of Neuroradiology. 2001; 22:119–127.
6. Lockhart SN, DeCarli C. Structural imaging measures of brain aging. Neuropsychology review. 2014; 24:271–289.
7. Mukherjee P, Miller JH, Shimony JS, Conturo TE, Lee BC, Almli CR, Mckinstry RC. Normal brain maturation during childhood: developmental trends characterized with diffusion-tensor MR Imaging. Radiology. 2001; 221:349–358.
8. Courchesne E, Chisum HJ, Townsend J, Cowles A, Covington J, Egaas B, Harwood M, Hinds S, Press GA. Normal brain development and aging: quantitative analysis at in vivo MR imaging in healthy volunteers. Radiology. 2000; 216:672–682.
9. Gunning-Dixon FM, Brickman AM, Cheng JC, Alexopoulos GS. Aging of cerebral white matter: a review of MRI findings. International journal of geriatric psychiatry. 2009; 24:109–117.
10. Moseley M. Diffusion tensor imaging and aging–a review. NMR in Biomedicine. 2002; 15:553–560.
11. Assaf Y, Pasternak O. Diffusion tensor imaging (DTI)-based white matter mapping in brain research: a review. Journal of molecular neuroscience. 2008; 34:51–61.
12. Madden DJ, Bennett IJ, Song AW. Cerebral white matter integrity and cognitive aging: contributions from diffusion tensor imaging. Neuropsychology review. 2009; 19:415.
13. Falangola MF, Jensen JH, Babb JS, Hu C, Castellanos FX, Martino AD, Ferris SH, Helpern JA. Age-related non-Gaussian diffusion patterns in the prefrontal brain. Journal of Magnetic Resonance Imaging. 2008; 28:1345–1350.
14. Steven AJ, Zhuo J, Melhem ER. Diffusion kurtosis imaging: an emerging technique for evaluating the microstructural environment of the brain. American Journal of Roentgenology. 2014; 202:W26–W33.
15. Paxinos G, Watson C. The Rat Brain in Stereotaxic Coordinates 5th Edn New York. NY: Academic Press. 2005.
16. Andreollo NA, Santos EF, Araújo MR, Lopes LR. Rat's age versus human's age: what is the relationship? ABCD. Arquivos Brasileiros de Cirurgia Digestiva (São Paulo). 2012; 25:49–51.
17. Takao H, Abe O, Yamasue H, Aoki S, Sasaki H, Kasai K, Yoshioka N, Ohtomo K. Gray and white matter asymmetries in healthy individuals aged 21–29 years: A voxel-based morphometry and diffusion tensor imaging study. Human brain mapping. 2011; 32:1762–1773.
18. Inano S, Takao H, Hayashi N, Abe O, Ohtomo K. Effects of age and gender on white matter integrity. American Journal of Neuroradiology. 2011; 32:2103–2109.
19. Cheung MM, Hui ES, Chan KC, Helpern JA, Qi L, Wu EX. Does diffusion kurtosis imaging lead to better neural tissue characterization? A rodent brain maturation study. Neuroimage. 2009; 45:386–392.
20. Lätt J, Nilsson M, Wirestam R, Stahlberg F, Karlsson N, Cand M, Johansson M, Sundgren PC, Westen DV. Regional values of diffusional kurtosis estimates in the healthy brain. Journal of Magnetic Resonance Imaging. 2013; 37:610–618.
21. Dubois J, Hertz-Pannier L, Dehaene-Lambertz G, Cointepas Y, Le Bihan D. Assessment of the early organization and maturation of infants' cerebral white matter fiber bundles: a feasibility study using quantitative diffusion tensor imaging and tractography. Neuroimage. 2006; 30:1121–1132.
22. Hüppi PS, Dubois J. Diffusion tensor imaging of brain development. Paper presented at: Seminars in Fetal and Neonatal Medicine. 2006.
23. Larvaron P, Boespflug-Tanguy O, Renou JP, Bonny JM. In vivo analysis of the post-natal development of normal mouse brain by DTI. NMR in biomedicine. 2007; 20:413–421.
24. Neil J, Miller J, Mukherjee P, Hüppi PS. Diffusion tensor imaging of normal and injured developing human brain-a technical review. NMR in Biomedicine. 2002; 15:543–552.
25. Suzuki Y, Matsuzawa H, Kwee IL, Nakada T. Absolute eigenvalue diffusion tensor analysis for human brain maturation. NMR in Biomedicine. 2003; 16:257–260.
26. Bockhorst KH, Narayana PA, Liu R, Ahobila-Vijjula P, Ramu J, Kamel M, Wosik J, Bockhorst T, Hahn K, Hasan KM, Perez-Polo JR. Early postnatal development of rat brain: in vivo diffusion tensor imaging. Journal of neuroscience research. 2008; 86:1520–1528.
27. Sizonenko SV, Camm EJ, Garbow JR, Maier SE, Inder TE, Williams CE, Neil JJ, Huppi PS. Developmental changes and injury induced disruption of the radial organization of the cortex in the immature rat brain revealed by in vivo diffusion tensor MRI. Cerebral cortex. 2007; 17:2609–2617.
28. Duan H, Wearne SL, Rocher AB, Macedo A, Morrison JH, Hof PR. Age-related dendritic and spine changes in corticocortically projecting neurons in macaque monkeys. Cerebral Cortex. 2003; 13:950–961.
29. Page TL, Einstein M, Duan H, He Y, Flores T, Rolshud D, Erwin JM, Wearne SL, Morrison JH, Hof PR. Morphological alterations in neurons forming corticocortical projections in the neocortex of aged Patas monkeys. Neuroscience letters. 2002; 317:37–41.
30. Smith JC, Lancaster MA, Nielson KA, Woodard JL, Seidenberg M, Durgerian S, Sakaie K, Rao SMl. Interactive effects of physical activity and APOE-ε4 on white matter tract diffusivity in healthy elders. Neuroimage. 2016; 131:102–112.