
INTRODUCTION
Recent studies have shown that many cancers are caused by somatic mutations, which occur randomly in the DNA over the course of an individual’s lifetime [1, 2]. From several hundreds to thousands of mutations, with the prevalence of somatic mutations, have been reported in various cancers [2–8]. To date, a number of genome sequencing studies have revealed that many cancers, including breast cancer, have somatic mutation spectra, mainly including base rearrangement from cytosine (C) to thymine (T) (complementary chain, guanine [G] →adenine [A]) [4, 5, 9, 10]. Most of these mutations are sometimes clustered [6, 11].
APOBEC3B is shown to be significantly contributed to a source of the above somatic mutation for several types of cancer including breast cancer [9, 10, 12–15]. APOBEC3B mutation signature is specifically enriched (C to T transition) in six types of cancers, including cervix, bladder, lung (adeno and squamous cell), head and neck, and breast cancers [9, 10]. APOBEC3B is a gene editing enzyme having cytidine deaminase activity, and the protein family comprises eleven members in humans: activation-induced cytidine deaminase (AID) and APOBEC1 (genes located on chromosome 12), APOBEC2 (gene located on chromosome 6), seven APOBEC3 proteins (APOBEC3A/B/C/D/F/G/H; genes located on chromosome 22) and APOBEC4 (gene located on chromosome 1) [16, 17]. APOBEC family members have been identified as intracellular antiviral factors, are normally part of the innate immune system and protect against viral pathogens (retrovirus and retrotransposon propagation, such as restricting HIV-1 viral reverse transcription) [17, 18]. However, specific mutations in cancer (APOBEC mutagenesis) may mainly induce C to T mutation pattern and have a role in carcinogenesis [12, 19, 20]. This mutagenesis is due to cytidine deaminase activity of APOBEC3B, which deaminates cytosine in DNA and RNA and leads to C to T transition mutation.
In breast cancer, the C to T transition mutation of TCA or TCT sequences by APOBEC3B has been observed frequently [6, 9, 10, 19]. Several studies showed that the expression levels of APOBEC3B in tumor tissue were higher compared with normal tissue [19, 21, 22]. In addition, APOBEC3B may contribute to canceration and progression of breast cancer due to accumulation of mutations. High expression of APOBEC3B has been reported in advanced cases and cases with poor prognosis [10, 23]. Recently, it has also been shown that APOBEC3B influences metastasization, prognosis and endocrine therapy resistance in estrogen receptor (ER) -positive breast cancer [22–25].
Despite these findings, there are no reports comparing APOBEC3B and therapeutic effect of chemotherapy. Previous studies have shown that NAC for primary breast cancer has the same recurrence suppression effect as postoperative chemotherapy [26, 27]. Therefore, NAC has been one of the standard treatment strategies for breast cancer patients. In particular, NAC has several advantages, such as tumor shrinkage, improvement of surgical outcome and monitoring of response to systemic therapy. The patients with acquired pCR by NAC have a good prognosis, and pCR is considered as a surrogate prognostic marker for breast cancer [28–34]. It is very important to examine the relationship between pCR and APOBEC3B in NAC. In the present study, we examined the relationship between APOBEC3B mRNA expression and sensitivity to NAC or prognosis of patients receiving NAC by performing real-time quantitative reverse transcription PCR (RT-qPCR) on formalin-fixed paraffin-embedded (FFPE) specimens.
RESULTS
Patient characteristics and APOBEC3B gene expression in FFPE breast cancer specimens
One hundred and seventy-three FFPE specimens (63.1%) of the total 274 cases were shown individually to contain detectable levels of all 4 housekeeping genes and APOBEC3B gene at a Ct < 40 and were selected for this study. The remaining 101 samples were considered technical failures because RNA extraction was not successful in 36 samples, 13 samples had 1 or 2 abnormal Ct values for housekeeping genes, and 52 samples had abnormal Ct values for APOBEC3B gene (Supplementary Figure 1). The median relative quantification of APOBEC3B mRNA expression in the FFPE samples was 0.016 (range 0.00023–0.61). The clinicopathological factors of the 173 cases are summarized in the Supplementary Table 1. The median age at diagnosis was 53 years (range 24–78). pCR rate of 173 cases was 36.4% (n = 63). The patients were followed up postoperatively every 3 months if they had no recurrence. The median follow-up period was 57 months (range 4–158). Tumor subtypes were defined according to the expression of ER, progesterone receptor (PgR), and human epidermal growth factor receptor 2 (HER2); luminal (ER+ and/or PgR+, HER2-), luminal-HER2 (ER+ and/or PgR+, HER2+), HER2-enriched (ER- and PgR-, HER2+), and triple-negative (ER-, PgR- and HER2-).
Association of APOBEC3B mRNA expression with clinicopathological characteristics
We examined the relationship between APOBEC3B mRNA expression and clinicopathological features (Table 1). APOBEC3B mRNA expression positively correlated with pCR (P ≤ 0.0001). Moreover, we examined the association A3B mRNA expression with the four main molecular subtypes (luminal, luminal-HER2, HER2-enriched and triple negative) (Supplementary Figure 2). High A3B mRNA expression was related to triple negative subtype (P ≤ 0.0001). We divided the samples into two groups using the cut-off value of the ROC analysis of pCR; 107 cases (61.8%) were defined as the high expression group and 66 cases (38.2%) were defined as the low expression group. The high expression group had higher rate of pCR (47.7%: 51/107) than the low expression group (18.2%: 12/66) (P ≤ 0.0001). Higher levels of APOBEC3B mRNA were associated with high nuclear grade (grade 3; P = 0.0027), high Ki67 labeling index (≥20%; P = 0.0022), negative ER status (P ≤ 0.0001) and subtype (triple-negative; P ≤ 0.0001). Likewise, the high expression group of APOBEC3B classification also positively correlated with the corresponding parameters. There were no correlations between APOBEC3B expression level and age, menopausal status, or nodal status.
Table 1: Relationship between APOBEC3B mRNA expression and clinicopathological characteristics
Characteristics |
Number of patients (%) |
APOBEC3B mRNA expression levels |
||||
|---|---|---|---|---|---|---|
Median (25%, 75%) |
P-value |
High (n = 107) |
Low (n = 66) |
P-value |
||
Age |
||||||
<50 |
71 (41.0%) |
0.018 (0.0071, 0.037) |
0.25 |
48 (44.9%) |
23 (34.9%) |
0.19 |
≥50 |
102 (59.0%) |
0.014 (0.0054, 0.048) |
59 (55.1%) |
43 (65.1%) |
||
Menopause |
||||||
Premenopausal |
72 (41.6%) |
0.017 (0.0061, 0.31) |
0.95 |
48 (44.9%) |
24 (36.4%) |
0.27 |
Postmenopausal |
101 (58.4%) |
0.016 (0.0058, 0.047) |
59 (55.1%) |
42 (63.6%) |
||
Tumor size (mm) |
||||||
<20 |
29 (16.8%) |
0.013 (0.0044, 0.028) |
0.37 |
17 (15.9%) |
12 (18.2%) |
0.69 |
≥20 |
144 (83.2%) |
0.017 (0.0062, 0.040) |
90 (84.1%) |
54 (81.8%) |
||
Nuclear Grade |
||||||
1 |
34 (19.7%) |
0.0092 (0.0054, 0.019) |
0.0027 |
15 (14.0%) |
19 (28.8%) |
0.0078 |
2 |
63 (36.4%) |
0.013 (0.0034, 0.033) |
36 (33.6%) |
27 (40.9%) |
||
3 |
76 (43.9%) |
0.023 (0.0091, 0.070) |
56 (52.3%) |
20 (30.3%) |
||
Ki67 labeling index |
||||||
<20 |
26 (15.0%) |
0.0081 (0.0026, 0.017) |
0.0022 |
10(9.4%) |
16 (24.2%) |
0.0087 |
≥20 |
147 (85.0%) |
0.018 (0.0070, 0.045) |
97 (90.7%) |
50 (75.8%) |
||
Nodal status |
||||||
Negative |
51 (29.5%) |
0.017 (0.0058, 0.039) |
0.88 |
33 (30.8%) |
18 (27.3%) |
0.62 |
Positive |
122 (70.5%) |
0.016 (0.0058, 0.040) |
74 (69.2%) |
48 (72.7%) |
||
Stage |
||||||
I |
12 (7.8%) |
0.0083 (0.0024, 0.090) |
0.39 |
5 (4.7%) |
7 (10.6%) |
0.0042 |
II |
108 (64.1%) |
0.017 (0.0075, 0.039) |
77 (72.0%) |
31 (47.0%) |
||
III |
53 (28.1%) |
0.0095 (0.0095, 0.035) |
25 (13.4%) |
28 (42.4%) |
||
ER |
||||||
- |
70 (40.5) |
0.032 (0.011, 0.073) |
<0.0001 |
56 (52.3%) |
14 (21.2%) |
<0.0001 |
+ |
103 (59.5%) |
0.010 (0.0041, 0.22) |
51 (47.7%) |
52 (78.8%) |
||
PgR |
||||||
- |
85 (49.1%) |
0.029 (0.010, 0.072) |
<0.0001 |
65 (60.8%) |
20 (30.3%) |
<0.0001 |
+ |
88 (50.9%) |
0.0095 (0.0041, 0.021) |
42 (39.3%) |
46 (69.7%) |
||
HER2 |
||||||
- |
120 (69.3%) |
0.014 (0.0047, 0.038) |
0.082 |
68 (63.6%) |
52 (78.8%) |
0.032 |
+ |
53 (30.6%) |
0.020 (0.0088, 0.042) |
39 (36.5%) |
14 (21.2%) |
||
Tumor subtype |
||||||
Luminal |
79 (45.6%) |
0.0090 (0.0035, 0.021) |
<0.0001 |
35 (32.7%) |
44 (66.7%) |
0.0001 |
Luminal-HER2 |
24 (13.9%) |
0.018 (0.0075, 0.061) |
16 (15.0%) |
8 (12.1%) |
||
HER2-enriched |
29 (16.8%) |
0.020 (0.010, 0.042) |
23 (21.5%) |
6 (9.1%) |
||
Triple negative |
41 (23.7%) |
0.044 (0.014, 0.12) |
33 (30.8%) |
8 (12.1%) |
||
pCR status |
||||||
pCR |
63 (36.4%) |
0.021 (0.0028, 0.61) |
<0.0001 |
51 (47.7%) |
12 (18.2%) |
<0.0001 |
non-pCR |
110 (63.6%) |
0.011 (0.00023, 0.34) |
56 (52.3%) |
54 (81.8%) |
||
Abbreviations: ER; estrogen receptor, PgR; progesteron receptor, HER2; human epidermal growth factor 2, pCR; pathological complete response. Luminal (ER+ and/or PgR+, HER2-), Luminal-HER2 (ER+ and/or PgR+, HER2+), HER2-enriched (ER- and PgR-, HER2+), Triple negative (ER-, PgR- and HER2-).
Univariate and multivariate analyses for predictive pCR
We examined the relationship between pCR status and clinicopathological characteristics (Table 2). The patients with small tumor size (P = 0.024), high nuclear grade (P = 0.0038), negative ER and PgR status (P ≤ 0.0001), positive HER2 status (P = 0.032) and subtype (HER2-enriched, triple-negative; P ≤ 0.0001) were more likely to achieve pCR. Next, we evaluated the association between APOBEC3B and pCR when stratified by each breast cancer subtype (Figure 1). We observed a significant correlation between APOBEC3B classification and pCR in two groups (negative HER2; OR = 7.9, P ≤ 0.0001, triple-negative; OR = 12.25, P = 0.0068).
Table 2: Relationship between pCR status and clinicopathological characteristics
Characteristics |
Number of patients (%) |
pCR status |
||
|---|---|---|---|---|
non-pCR (n = 110) |
pCR (n = 63) |
P-value |
||
Age |
||||
<50 |
71 (41.0%) |
47 (42.7%) |
24 (38.1%) |
0.55 |
≥50 |
102 (59.0%) |
63 (57.3%) |
39 (61.9%) |
|
Menopause |
||||
Premenopausal |
72 (41.6%) |
51 (46.3%) |
21 (33.3%) |
0.092 |
Postmenopausal |
101 (58.4%) |
59 (53.6%) |
42 (66.7%) |
|
Tumor size (mm) |
||||
<20 |
29 (16.8%) |
13 (11.8%) |
16 (25.4%) |
0.024 |
≥20 |
144 (83.2%) |
97 (88.2%) |
47 (74.6%) |
|
Nuclear Grade |
||||
1 |
34 (19.7%) |
6 (9.5%) |
28 (25.5%) |
0.0038 |
2 |
63 (36.4%) |
20 (31.8%) |
43 (39.1%) |
|
3 |
76 (43.9%) |
37 (58.7%) |
39 (35.4%) |
|
Ki67 labeling index |
||||
<20 |
26 (15.0%) |
24 (21.8%) |
2 (3.2%) |
0.0003 |
≥20 |
147 (85.0%) |
86 (78.3%) |
61 (96.8%) |
|
Nodal status |
||||
Negative |
51 (29.5%) |
24 (21.8%) |
27 (42.9%) |
0.0038 |
Positive |
122 (70.5%) |
86 (78.2%) |
36 (57.1%) |
|
Stage |
||||
I |
12 (6.9%) |
5 (4.6%) |
7 (11.1%) |
0.0026 |
II |
108 (62.4%) |
62 (56.4%) |
46 (73.0%) |
|
III |
53 (30.6%) |
43 (39.0%) |
10 (15.9%) |
|
ER |
||||
- |
70 (40.5) |
25 (22.7%) |
45 (71.4%) |
<0.0001 |
+ |
103 (59.5%) |
85 (77.3%) |
18 (28.6%) |
|
PgR |
||||
- |
85 (49.1%) |
35 (31.8%) |
50 (79.4%) |
<0.0001 |
+ |
88 (50.9%) |
75 (68.2%) |
13 (20.6%) |
|
HER2 |
||||
- |
120 (69.3%) |
89 (80.9%) |
31 (49.2%) |
0.032 |
+ |
53 (30.6%) |
21 (19.1%) |
32 (50.8%) |
|
Tumor subtype |
||||
Luminal |
79 (45.6%) |
70 (63.6%) |
9 (14.3%) |
<0.0001 |
Luminal-HER2 |
24 (13.9%) |
15 (13.6%) |
9 (14.3%) |
|
HER2-enriched |
29 (16.8%) |
6 (5.5%) |
23 (36.5%) |
|
Triple negative |
41 (23.7%) |
19 (17.3%) |
22 (34.9%) |
|
Abbreviations: ER; estrogen receptor, PgR; progesteron receptor, HER2; human epidermal growth factor 2, pCR; pathological complete response. Luminal (ER+ and/or PgR+, HER2-), Luminal-HER2 (ER+ and/or PgR+, HER2+), HER2-enriched (ER- and PgR-, HER2+), Triple negative (ER-, PgR- and HER2-).
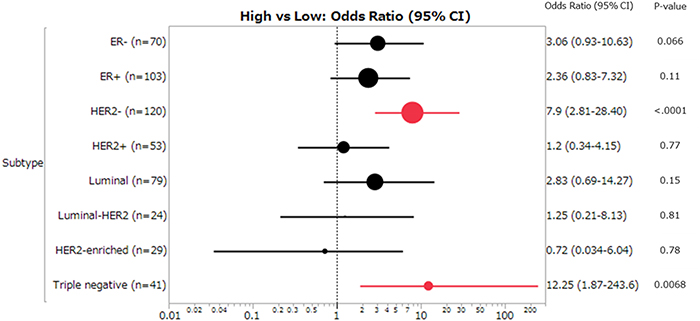
Figure 1: Forest plot of the odds ratios (ORs) and 95% confidence intervals (CIs) on the association between pCR and APOBEC3B mRNA expression (high vs low). The size of the black circle is proportional to the sample size. The horizontal line shows 95% CI of the OR. Luminal (ER+ and/or PgR+, HER2-), Luminal-HER2 (ER+ and/or PgR+, HER2+), HER2-enriched (ER- and PgR-, HER2+), Triple negative (ER-, PgR- and HER2-).
We evaluated the contribution of clinical variables at baseline to pCR prediction using logistic regression analysis (Table 3). Small tumor size, no involvement of axillary lymph nodes, high nuclear grade, low stage, negative ER and PgR status, positive HER2 status, high Ki67 labeling index (≥20%) and high APOBEC3B status were all significant in univariate analysis. In multivariate analysis, ER status (P ≤ 0.0001), HER2 status (P = 0.0013), and APOBEC3B classification (P = 0.037) remained significant and were independent predictive factor for pCR. Next, we evaluated the correlation between APOBEC3B mRNA expression and pCR in HER2- and triple-negative subtypes. APOBEC3B classification remained significant and was an independent predictive factor for pCR in both subtypes (Table 3).
Table 3: Univariate and multivariate analysis of factors associated with pCR
Factors |
Univariate analysis |
multivariate analysis |
|||||
|---|---|---|---|---|---|---|---|
OR |
95% CI |
P-value |
OR |
95% CI |
P-value |
||
All cases (n = 173) |
|||||||
Age |
<50 vs ≥50 |
0.82 |
0.44–1.55 |
0.55 |
|||
Menopause |
Pre vs Post |
0.58 |
0.30–1.10 |
0.092 |
|||
Tumor size (mm) |
<20 vs ≥20 |
2.54 |
1.13–5.80 |
0.024 |
3.86 |
1.36–11.9 |
0.011 |
Nodal status |
Negative vs Positive |
2.68 |
1.37–5.31 |
0.0038 |
1.67 |
0.55–3.51 |
0.48 |
Nuclear Grade |
1,2 vs 3 |
0.39 |
0.20–0.72 |
0.003 |
1.15 |
0.48–2.83 |
0.76 |
Stage |
I, II vs III |
0.29 |
0.13–0.62 |
0.001 |
2.39 |
0.87–7.11 |
0.094 |
ER status |
- vs + |
8.5 |
4.27–17.6 |
<0.0001 |
5.74 |
2.46–14.1 |
<0.0001 |
PgR status |
- vs + |
8.2 |
4.07–17.7 |
<0.0001 |
|||
HER2 status |
- vs + |
0.23 |
0.11–0.45 |
<0.0001 |
0.28 |
0.11–0.59 |
0.0013 |
Ki67 labeling index |
<20 vs ≥20 |
0.11 |
0.027–0.52 |
0.0003 |
0.34 |
0.036–1.23 |
0.094 |
APOBEC3B mRNA |
High vs Low |
4.1 |
1.97–8.52 |
<0.0001 |
2.7 |
1.1–7.0 |
0.037 |
HER2- cases (n = 120) |
|||||||
Age |
<50 vs ≥50 |
1.15 |
0.50–2.64 |
0.73 |
|||
Menopause |
Pre vs post |
0.85 |
0.36–1.92 |
0.69 |
|||
Tumor size (mm) |
<20 vs ≥20 |
3.9 |
1.48–10.4 |
0.0064 |
5.65 |
1.59–23.2 |
0.007 |
Nodal status |
Negative vs Positive |
3.03 |
1.27–7.30 |
0.013 |
1.24 |
0.34–4.34 |
0.73 |
Nuclear Grade |
1, 2 vs 3 |
0.25 |
0.10–0.59 |
0.0013 |
1.26 |
0.35–5.00 |
0.73 |
Stage |
I, II vs III |
5.03 |
1.78–18.1 |
0.0015 |
4.02 |
0.99–20.4 |
0.0509 |
ER status |
- vs + |
9 |
3.68–23.8 |
<0.0001 |
6.43 |
1.92–24.4 |
0.0022 |
PgR status |
- vs + |
6.97 |
2.86–18.5 |
<0.0001 |
|||
Ki67 labeling index |
<20 vs ≥20 |
0.21 |
0.032–0.78 |
0.017 |
0.39 |
0.045–2.32 |
0.31 |
APOBEC3B mRNA |
High vs Low |
7.9 |
2.81–28.4 |
<0.0001 |
7.24 |
1.83–39.1 |
0.0037 |
Triple negative cases (n = 41) |
|||||||
Age |
<50 vs ≥50 |
1.6 |
0.43–6.46 |
0.49 |
|||
Menopause |
Pre vs post |
1.6 |
0.43–6.46 |
0.49 |
|||
Tumor size(mm) |
<20 vs ≥20 |
1.41 |
0.33–6.44 |
0.024 |
4.63 |
0.68–92.8 |
0.13 |
Nodal status |
Negative vs Positive |
1.38 |
0.40–4.84 |
0.61 |
|||
Nuclear Grade |
1,2 vs 3 |
1.05 |
0.26–4.37 |
0.95 |
|||
Stage |
I, II vs III |
2.63 |
0.65–11.9 |
0.18 |
|||
Ki67 labeling index |
<20 vs ≥20 |
0.86 |
0.032–22.7 |
0.92 |
|||
APOBEC3B mRNA |
High vs Low |
12.25 |
1.87–243.6 |
0.0068 |
26.29 |
2.80–915.6 |
0.0021 |
Abbreviations: ER; estrogen receptor, PgR; progesteron receptor, HER2; human epidermal growth factor 2, pCR; pathological complete response, OR; odds ratio, CI; confidence interval, Pre; premenopausal, Post; postmenopausal. Triple negative; ER-, PgR- and HER2-.
Prognostic relevance of APOBEC3B mRNA expression and pCR
Finally, we investigated prognostic relevance of APOBEC3B classification (high/low) and pCR for all patients receiving NAC. In the analysis of relapse-free survival (RFS), local recurrences and distant metastases were considered as events (median follow-up 63 months). Among 20 recurrent cases, there were 12 cases of distant metastases and 8 cases of local recurrence. Seven patients died as a result of breast cancer, and these were regarded as events when analyzing breast cancer–specific survival (BCSS). There was no correlation between patient outcome and APOBEC3B mRNA expression (Supplementary Figure 3). We found no statistically significant association between RFS (P = 0.24) or BCSS (P = 0.61) and APOBEC3B expression (Figure 2). Similarly, there was no statistically significant correlation between RFS or BCSS and APOBEC3B expression among the different breast cancer subtypes (Figures 3, 4).
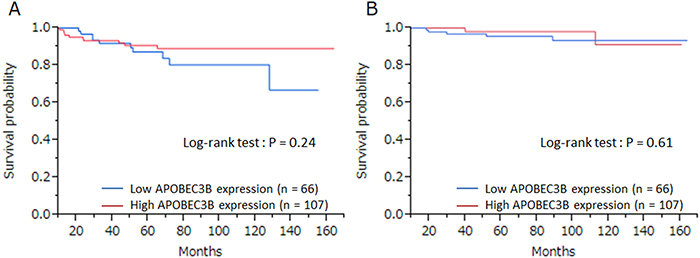
Figure 2: The relationship between APOBEC3B mRNA expression and prognosis. Kaplan–Meier plots showing the association of APOBEC3B mRNA expression with (A) relapse-free survival and (B) breast cancer–specific survival in all cases.
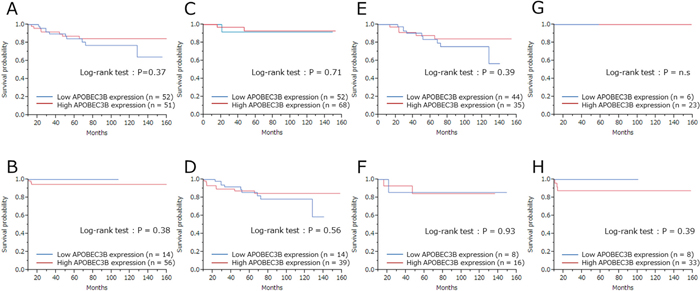
Figure 3: Relapse-free survival (RFS) according to APOBEC3B mRNA expression among the different subtypes. Kaplan–Meier plots showing the association of APOBEC3B mRNA expression with RFS. (A) ER+ cases, (B) ER- cases, (C) HER2+ cases, (D) HER2- cases, (E) Luminal (ER+ and/or PgR+, HER2-) cases, (F) Luminal-HER2 (ER+ and/or PgR+, HER2+), (G) HER2-enriched (ER- and PgR-, HER2+), (H) triple-negative (ER-, PgR- and HER2-) cases.
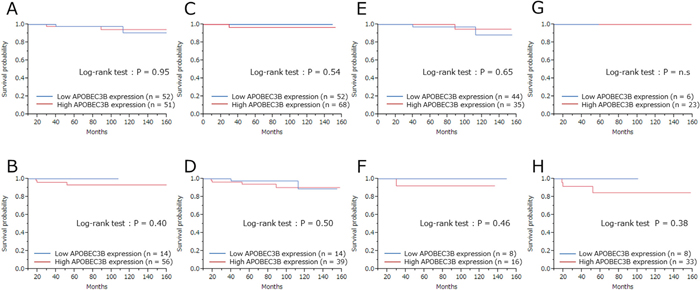
Figure 4: Breast cancer–specific survival (BCSS) according to APOBEC3B mRNA expression among the different subtypes. Kaplan-Meier plots showing the association of APOBEC3B mRNA expression with BCSS. (A) ER+ cases, (B) ER- cases, (C) HER2+ cases, (D) HER2- cases, (E) Luminal (ER+ and/or PgR+, HER2-) cases, (F) Luminal-HER2 (ER+ and/or PgR+, HER2+), (G) HER2-enriched (ER- and PgR-, HER2+), (H) triple-negative (ER-, PgR- and HER2-) cases.
DISCUSSION
In this study, we found that APOBEC3B mRNA expression levels correlated with the efficacy of chemotherapy. Moreover, high APOBEC3B mRNA expression was a predictive factor for pCR and APOBEC3B mRNA expression level did not correlate with breast cancer prognosis for patients receiving NAC.
Predicting pCR is very important for patient prognosis and for a therapy plan. To date, several multigene assays like Oncotype Dx [35], PAM50 [36, 37], MammaPrint [38] and 95 GC [39] have been developed and reconstructed for predicting prognosis and deciding adjuvant chemotherapy to improve prognosis, but predictors of pCR have not yet been established. In our study, high APOBEC3B mRNA expression levels positively correlated with pCR. This is the first report showing the correlation between APOBEC3B mRNA expression and therapeutic sensitivity to NAC. Furthermore, multivariate analysis showed APOBEC3B as an independent predictive factor for pCR as well as ER status and HER2 status. In stratified analysis, APOBEC3B was also a significant predictive factor for pCR in HER2- and triple negative subgroups (Table 3). According to our findings, ER and HER2 status were reported as predictive factors for pCR [40–44]. Ki-67 labeling index has also been reported as a predictor of pCR in several studies [28, 45–47]. Although a significant association was found in univariate analysis in our study, its significance was lost in multivariate analysis (Table 3), probably due to a positive correlation between Ki-67 labelling index and APOBEC3B (Spearman coefficient = 0.39; P = <.0001). Since APOBEC3B is related to tumor proliferation (Ki-67 labelling index) [21], tumors with high APOBEC3B expression might be sensitive to chemotherapy. The mechanism correlating tumor proliferation and APOBEC3B with chemotherapy efficacy has not been elucidated in our study and future research is required.
Recently, a difference has been shown in pCR rate after NAC in breast cancer by the intrinsic subtypes; patients with HER2-enriched or triple-negative tumors are more likely to achieve pCR than those with a luminal-type tumor [32, 33]. In our study, we observed a substantial difference in pCR rate among tumor subtypes, which was almost consistent with the results of other published studies [32, 33]. Therefore, predicting pCR by APOBEC3B expression in luminal type offers a useful opportunity for NAC selection. However, in our study APOBEC3B mRNA expression was not associated with pCR in luminal type. Obtaining pCR for luminal type is difficult because of the hormone susceptibility and the low proliferative potential [48]. In our study, ER expression inversely correlated with Ki67 (Spearman coefficient = -0.45; P = <.0001) and APOBEC3B expression (Spearman coefficient = -0.41; P = <.0001). The association between pCR and APOBEC3B might have been low for luminal type.
Then we evaluated the relationship between APOBEC3B mRNA expression and clinicopathological characteristics. High APOBEC3B mRNA expression was significantly related to high nuclear grade, high Ki67 labeling index, negative ER status and positive HER2 status, as reported in recent studies (Table 1). These parameters are progressive factors, and this result is consistent with previous studies showing high APOBEC3B mRNA expression in many progressive cases. Previous studies have shown that high APOBEC3B mRNA expression was associated with poor prognosis [21-25, 49, 50]. In particular, it was reported that high APOBEC3BmRNA expression was an independent prognostic factor for ER+ and lymph node-negative cases [21, 23, 25]. However, our study could not reveal the association between APOBEC3B mRNA expression levels and prognosis, in part because of the difference in patient population among trials. Also, we think that the prognosis of patients with high APOBEC3B mRNA expression might be improved by NAC because those patients had higher sensitivity to chemotherapy. Although there are reports showing similar results in terms of prognosis between preoperative chemotherapy and postoperative chemotherapy, the discrepancy could be attributed to the fact that all patients in our study received NAC but not all the patients in the other studies received NAC [26, 27].
Our study has some limitations. First, this is a retrospective study. When we selected the patients, who were candidate to receive adjuvant chemotherapy at diagnosis, patients with high responsiveness to chemotherapy might have been selected and the result might have been affected by the selection bias. We need to confirm and validate this result using data from other facilities. Second, discrepancies of prognosis between our study and previous ones were due to the timing of adjuvant chemotherapy. Because previous studies had examined the prognosis of postoperative patients with adjuvant therapy but not with NAC, there is no study comparing prognosis of patients with neoadjuvant chemotherapy and that of patients with adjuvant chemotherapy in terms of APOBEC3B mRNA expression.
In conclusion, here we demonstrate the relationship between APOBEC3B mRNA expression and sensitivity to NAC, and its role as a predictive factor for pCR in breast cancer patients receiving NAC. This is a novel finding about APOBEC3B and its potential use as a surrogate marker for pCR. Although APOBEC3B mRNA expression was not associated with breast cancer prognosis, the prognosis of patients with high APOBEC3B mRNA expression might be improved by NAC. We believe that our findings are relevant for planning an effective therapy.
PATIENTS AND METHODS
Patients and tumor material
Breast tumor specimens from 274 female patients with primary invasive breast carcinoma (stage I, II and III) who received treatment and surgery at Kumamoto University Hospital between 2004 and 2016 were included in this study. The median age of the patients was 53 years (range 20–78) and median duration of follow-up was 63 months. Informed consent was obtained from all patients. The ethics committee of Kumamoto University Graduate School of Medical Sciences approved this study protocol. All patients had undergone pretreatment biopsies using core needle biopsy or vacuum assisted biopsy with a 14G needle and were diagnosed with invasive breast carcinoma before NAC. Biomarkers were analyzed using pretreatment specimens, and the patients were treated with at least 4 courses (commonly up to 8 courses) of NAC such as anthracycline and/or taxane-containing regimens. Neoadjuvant treatment was administered depending on clinical practice guidelines of the Japanese Breast Cancer Society on the primary therapy of early breast cancer according to tumor biology (ER, PR, HER2, Ki67 labeling index) [51, 52]. We based our evaluation on the Reporting Recommendations for Tumor Marker Prognostic Studies (REMARK) criteria [53]. The representative regimens of chemotherapy were as follows: FEC (5-fluorouracil 500 mg/m2, epirubicin 100 mg/m2, and cyclophosphamide 500 mg/m2, every 3 weeks) followed by docetaxel (75 mg/m2, every 3 weeks) or paclitaxel (80 mg/m2, every week) each for 4 cycles; EC (epirubicin 90 mg/m2, and cyclophosphamide 600 mg/m2, every 3 weeks) followed by docetaxel (75 mg/m2, every 3 weeks) or paclitaxel (80 mg/m2, every week) each for 4 cycles; TC (docetaxel 75 mg/m2 and cyclophosphamide 600 mg/m2, every 3 weeks) for 6 cycles and FEC for 6 cycles. Trastuzumab was added in combination with chemotherapy in 71.7% of all HER2-positive patients.
Evaluation of treatment response
The response of primary breast cancer during NAC was evaluated using clinical diagnostic imaging (ultrasound and magnetic resonance imaging). The achievement of pCR on postoperative specimens was defined as no evidence of residual invasive tumor in the breast or axillary lymph nodes. Noninvasive breast residuals were allowed (pCR: ypT0/ypTis).
Total RNA extraction, real-time quantitative reverse-transcription polymerase chain reaction (RT-qPCR)
All tissue samples had previously been fixed in 10% neutral-buffered formalin for up to a maximum of 24 h. Total RNA was extracted from 4 FFPE sections (5 μm); the tumor compartment was selectively hollowed out with a sterilized blade, using the AllPrep DNA/RNA/miRNA Universal Kit (QIAGEN, Venlo, the Netherlands) in accordance with the manufacturer’s instructions. Total RNA quantification was measured by a NanoDrop 2000 spectrophotometer (Nano-Drop Technologies, Wilmington, DE, USA), determined based on the A260/A280 absorbance ratio. Total RNA (0.5 μg) was reverse-transcribed to complementary DNA (cDNA) by using PrimeScript® RT Master Mix (Takara Bio, Otsu, Japan), in accordance with the manufacturer’s procedure. RT-qPCR was performed using the comparative method based on the Taq-Man chemistry on the ABI 7900HT Fast System (Applied Biosystems, Foster City, CA, USA). RT-qPCR was carried out in a solution containing 5.0 μL of 2X TaqMan® Fast Advanced Master Mix (Applied Biosystems), 0.5 μL of TaqMan Gene Expression Assay (APOBEC3B: Hs00358981_m1, b-Actin: Hs01060665_g1, PUM1: Hs00982775_m1, TAF-10: Hs00359540_g1, FKBP15: Hs00910471_m1; all the primers and probes were purchased from Applied Biosystems), 3.5μL of nuclease-free water and 1.0 μL of cDNA sample (10 ng/μL) in a total volume of 10 μL. The maximum cycle threshold (Ct) value was set at 40. Negative controls were included in each run. Relative mRNA levels were determined from the threshold cycle for amplification using the ΔΔCt method by SDS 2.2 software (Applied Biosystems). Determination of Ct values was performed in duplicate and normalized to the Ct values of simultaneous duplicate measurements of the expression of 4 housekeeping genes (b-Actin, PUM1, TAF-10 and FKBP15 from the same samples) by Data Assist_ software (Applied Biosystems). These housekeeping genes were selected based on our previous study [54].
Immunohistochemical analysis
All tissue samples had previously been fixed in 10% neutral-buffered formalin for up to a maximum of 72 h. Histological sections (4 μm) were deparaffinized and incubated for 10 min in methanol containing 0.3% hydrogen peroxide to block endogenous peroxidase. They were then immunostained with rabbit monoclonal antibodies against ERα (SP1, Ventana Japan, Tokyo, Japan), PgR (1E2, Ventana Japan) and HER2 (4B5, Ventana Japan). To detect the expression of these antibodies, we used the NexES IHC Immunostainer (Ventana Medical Systems, Tucson, AZ, USA) in accordance with the manufacturer’s instructions. ER and PgR were evaluated by percentage of nuclear staining (0–100%), and samples were considered positive when more than 1% of the nucleus was stained. HER2 expression was determined by IHC staining and evaluated using the same method as the HercepTest (Dako Japan, Tokyo, Japan); membranous staining was scored on a scale of 0 to 3+. According to the 2013 ASCO/CAP guidelines, we considered a tumor to be HER2+ when the specimen either scored ≥3+ by IHC or showed a HER2/CEP17 ratio with more than 2.0-fold increase in HER2 gene amplification (determined by dual color in situ hybridization using Ventana Inform HER2 Dual ISH HER2 kits [Roche Diagnostics Japan, Tokyo, Japan]) according to the manufacturer’s instructions [55, 56]. Ki67 was scored according to the percentage of nuclear stained cells out of all cancer cells in the hot spot of the tumor, regardless of the intensity, in a ×400 high-power field (Ki67 labeling index [57]). We counted between 500 and 1,000 tumor cells as recommended by the International Ki67 in Breast Cancer Working Group [58].
Statistical analysis
The nonparametric Wilcoxon test was adopted for statistical analysis of association between APOBEC3B mRNA expression and pCR status. The best cut-off point of pCR for APOBEC3B mRNA expression levels was determined through a receiver operating characteristics (ROC) curve and used for classification of APOBEC3B mRNA expression. The association between APOBEC3B mRNA expression status and clinicopathological factors was evaluated using Chi-square or Fisher’s exact test. Logistic regression methods were also adopted for univariate and multivariate analyses to assess the associations of clinical and biological parameters with pCR. Odds ratios (ORs) and 95% confidence intervals (CIs) were calculated. Relapse-free survival and breast cancer–specific survival curves were calculated according to the Kaplan–Meier method and verified by the log-rank test. A statistically significant difference was defined at P < 0.05. All statistical analyses were performed using JMP software version 11 for Windows (SAS Institute Japan, Tokyo, Japan).
Author contributions
YF participated in the design of the study and performed APOBEC3B mRNA analysis and statistical analysis. YY participated in the design and coordination, and helped to draft the manuscript. RG, MT, TT and MYI helped to draft the manuscript. HI conceived the study, participated in its design and coordination and helped to draft the manuscript. All authors read and approved the final manuscript.
ACKNOWLEDGMENTS
The authors are grateful to I. Suzu for excellent technical support, to M. Suematsu and M. Kawakami for clinical data management.
CONFLICTS OF INTEREST
The authors have declared no conflicts of interest. No external sources of funding were used for this study.
REFERENCES
1. Loeb LA. Mutator phenotype may be required for multistage carcinogenesis. Cancer Res. 1991; 51:3075-9.
2. Hanahan D, Weinberg RA. Hallmarks of cancer: the next generation. Cell. 2011; 144:646-74. https://doi.org/10.1016/j.cell.2011.02.013.
3. Stephens P, Edkins S, Davies H, Greenman C, Cox C, Hunter C, Bignell G, Teague J, Smith R, Stevens C, O'Meara S, Parker A, Tarpey P, et al. A screen of the complete protein kinase gene family identifies diverse patterns of somatic mutations in human breast cancer. Nat Genet. 2005; 37:590-2. https://doi.org/10.1038/ng1571.
4. Sjoblom T, Jones S, Wood LD, Parsons DW, Lin J, Barber TD, Mandelker D, Leary RJ, Ptak J, Silliman N, Szabo S, Buckhaults P, Farrell C, et al. The consensus coding sequences of human breast and colorectal cancers. Science. 2006; 314:268-74. https://doi.org/10.1126/science.1133427.
5. Greenman C, Stephens P, Smith R, Dalgliesh GL, Hunter C, Bignell G, Davies H, Teague J, Butler A, Stevens C, Edkins S, O'Meara S, Vastrik I, et al. Patterns of somatic mutation in human cancer genomes. Nature. 2007; 446:153-8. https://doi.org/10.1038/nature05610.
6. Nik-Zainal S, Alexandrov LB, Wedge DC, Van Loo P, Greenman CD, Raine K, Jones D, Hinton J, Marshall J, Stebbings LA, Menzies A, Martin S, Leung K, et al, and Breast Cancer Working Group of the International Cancer Genome Consortium. Mutational processes molding the genomes of 21 breast cancers. Cell. 2012; 149:979-93. https://doi.org/10.1016/j.cell.2012.04.024.
7. Stephens PJ, Tarpey PS, Davies H, Van Loo P, Greenman C, Wedge DC, Nik-Zainal S, Martin S, Varela I, Bignell GR, Yates LR, Papaemmanuil E, Beare D, et al, and Oslo Breast Cancer Consortium (OSBREAC). The landscape of cancer genes and mutational processes in breast cancer. Nature. 2012; 486:400-4. https://doi.org/10.1038/nature11017.
8. Alexandrov LB, Nik-Zainal S, Wedge DC, Aparicio SA, Behjati S, Biankin AV, Bignell GR, Bolli N, Borg A, Børresen-Dale AL, Boyault S, Burkhardt B, Butler AP, et al, and Australian Pancreatic Cancer Genome Initiative, and ICGC Breast Cancer Consortium, and ICGC MMML-Seq Consortium, and ICGC PedBrain. Signatures of mutational processes in human cancer. Nature. 2013; 500:415–21. https://doi.org/10.1038/nature12477.
9. Burns MB, Temiz NA, Harris RS. Evidence for APOBEC3B mutagenesis in multiple human cancers. Nat Genet. 2013; 45:977-83. https://doi.org/10.1038/ng.2701.
10. Roberts SA, Lawrence MS, Klimczak LJ, Grimm SA, Fargo D, Stojanov P, Kiezun A, Kryukov GV, Carter SL, Saksena G, Harris S, Shah RR, Resnick MA, et al. An APOBEC cytidine deaminase mutagenesis pattern is widespread in human cancers. Nat Genet. 2013; 45:970-6. https://doi.org/10.1038/ng.2702.
11. Cancer Genome Atlas Network. Comprehensive molecular portraits of human breast tumours. Nature. 2012; 490:61-70. https://doi.org/10.1038/nature11412.
12. Taylor BJ, Nik-Zainal S, Wu YL, Stebbings LA, Raine K, Campbell PJ, Rada C, Stratton MR, Neuberger MS. DNA deaminases induce break-associated mutation showers with implication of APOBEC3B and 3A in breast cancer kataegis. eLife. 2013; 2:e00534. https://doi.org/10.7554/eLife.00534.
13. Shinohara M, Io K, Shindo K, Matsui M, Sakamoto T, Tada K, Kobayashi M, Kadowaki N, Takaori-Kondo A. APOBEC3B can impair genomic stability by inducing base substitutions in genomic DNA in human cells. Sci Rep. 2012; 2:806. https://doi.org/10.1038/srep00806.
14. Cescon DW, Haibe-Kains B. DNA replication stress: a source of APOBEC3B expression in breast cancer. Genome Biol. 2016; 17:202. https://doi.org/10.1186/s13059-016-1069-y.
15. Nik-Zainal S, Wedge DC, Alexandrov LB, Petljak M, Butler AP, Bolli N, Davies HR, Knappskog S, Martin S, Papaemmanuil E, Ramakrishna M, Shlien A, Simonic I, et al. Association of a germline copy number polymorphism of APOBEC3A and APOBEC3B with burden of putative APOBEC-dependent mutations in breast cancer. Nat Genet. 2014; 46:487-91. https://doi.org/10.1038/ng.2955.
16. Rebhandl S, Huemer M, Greil R, Geisberger R. AID/APOBEC deaminases and cancer. Oncoscience. 2015; 2:320-33. https://doi.org/10.18632/oncoscience.155.
17. Refsland EW, Harris RS. The APOBEC3 family of retroelement restriction factors. Curr Top Microbiol Immunol. 2013; 371:1-27. https://doi.org/10.1007/978-3-642-37765-5_1.
18. Harris RS, Liddament MT. Retroviral restriction by APOBEC proteins. Nat Rev Immunol. 2004; 4:868-77. https://doi.org/10.1038/nri1489.
19. Burns MB, Lackey L, Carpenter MA, Rathore A, Land AM, Leonard B, Refsland EW, Kotandeniya D, Tretyakova N, Nikas JB, Yee D, Temiz NA, Donohue DE, et al. APOBEC3B is an enzymatic source of mutation in breast cancer. Nature. 2013; 494:366-70. https://doi.org/10.1038/nature11881.
20. Lada AG, Dhar A, Boissy RJ, Hirano M, Rubel AA, Rogozin IB, Pavlov YI. AID/APOBEC cytosine deaminase induces genome-wide kataegis. Biol Direct. 2012; 7:47; discussion https://doi.org/10.1186/1745-6150-7-47.
21. Cescon DW, Haibe-Kains B, Mak TW. APOBEC3B expression in breast cancer reflects cellular proliferation, while a deletion polymorphism is associated with immune activation. Proc Natl Acad Sci U S A. 2015; 112:2841-6. https://doi.org/10.1073/pnas.1424869112.
22. Tsuboi M, Yamane A, Horiguchi J, Yokobori T, Kawabata-Iwakawa R, Yoshiyama S, Rokudai S, Odawara H, Tokiniwa H, Oyama T, Takeyoshi I, Nishiyama M. APOBEC3B high expression status is associated with aggressive phenotype in Japanese breast cancers. Breast Cancer. 2016; 23:780-8. https://doi.org/10.1007/s12282-015-0641-8.
23. Sieuwerts AM, Willis S, Burns MB, Look MP, Meijer-Van Gelder ME, Schlicker A, Heideman MR, Jacobs H, Wessels L, Leyland-Jones B, Gray KP, Foekens JA, Harris RS, Martens JW. Elevated APOBEC3B correlates with poor outcomes for estrogen-receptor-positive breast cancers. Horm Cancer. 2014; 5:405-13. https://doi.org/10.1007/s12672-014-0196-8.
24. Periyasamy M, Patel H, Lai CF, Nguyen VT, Nevedomskaya E, Harrod A, Russell R, Remenyi J, Ochocka AM, Thomas RS, Fuller-Pace F, Gyorffy B, Caldas C, et al. APOBEC3B-Mediated Cytidine Deamination Is Required for Estrogen Receptor Action in Breast Cancer. Cell Reports. 2015; 13:108–21. https://doi.org/10.1016/j.celrep.2015.08.066.
25. Tokunaga E, Yamashita N, Tanaka K, Inoue Y, Akiyoshi S, Saeki H, Oki E, Kitao H, Maehara Y. Expression of APOBEC3B mRNA in Primary Breast Cancer of Japanese Women. PLoS One. 2016; 11:e0168090. https://doi.org/10.1371/journal.pone.0168090.
26. Wolmark N, Wang J, Mamounas E, Bryant J, Fisher B. Preoperative chemotherapy in patients with operable breas t cancer: nine-year results from National Surgical Adjuvant Breast and Bowel Project B-18. J Natl Cancer Inst Monogr. 2001;30:96-102.
27. van der Hage JA, van de Velde CJ, Julien JP, Tubiana-Hulin M, Vandervelden C, Duchateau L. Preoperative chemotherapy in primary operable breast cancer: results from the European Organization for Research and Treatment of Cancer trial 10902. J Clin Oncol. 2001; 19:4224-37. https://doi.org/10.1200/JCO.2001.19.22.4224.
28. Sueta A, Yamamoto Y, Hayashi M, Yamamoto S, Inao T, Ibusuki M, Murakami K, Iwase H. Clinical significance of pretherapeutic Ki67 as a predictive parameter for response to neoadjuvant chemotherapy in breast cancer: is it equally useful across tumor subtypes? Surgery. 2014; 155:927-35. https://doi.org/10.1016/j.surg.2014.01.009.
29. Smith IC, Heys SD, Hutcheon AW, Miller ID, Payne S, Gilbert FJ, Ah-See AK, Eremin O, Walker LG, Sarkar TK, Eggleton SP, Ogston KN. Neoadjuvant chemotherapy in breast cancer: significantly enhanced response with docetaxel. J Clin Oncol. 2002; 20:1456-66. https://doi.org/10.1200/JCO.2002.20.6.1456.
30. Bear HD, Anderson S, Smith RE, Geyer CE Jr, Mamounas EP, Fisher B, Brown AM, Robidoux A, Margolese R, Kahlenberg MS, Paik S, Soran A, Wickerham DL, Wolmark N. Sequential preoperative or postoperative docetaxel added to preoperative doxorubicin plus cyclophosphamide for operable breast cancer:National Surgical Adjuvant Breast and Bowel Project Protocol B-27. J Clin Oncol. 2006; 24:2019-27. https://doi.org/10.1200/JCO.2005.04.1665.
31. Rastogi P, Anderson SJ, Bear HD, Geyer CE, Kahlenberg MS, Robidoux A, Margolese RG, Hoehn JL, Vogel VG, Dakhil SR, Tamkus D, King KM, Pajon ER, et al. Preoperative chemotherapy: updates of National Surgical Adjuvant Breast and Bowel Project Protocols B-18 and B-27. J Clin Oncol. 2008; 26:778-85. https://doi.org/10.1200/JCO.2007.15.0235.
32. von Minckwitz G, Untch M, Blohmer JU, Costa SD, Eidtmann H, Fasching PA, Gerber B, Eiermann W, Hilfrich J, Huober J, Jackisch C, Kaufmann M, Konecny GE, et al. Definition and impact of pathologic complete response on prognosis after neoadjuvant chemotherapy in various intrinsic breast cancer subtypes. J Clin Oncol. 2012; 30:1796-804. https://doi.org/10.1200/JCO.2011.38.8595.
33. Cortazar P, Zhang L, Untch M, Mehta K, Costantino JP, Wolmark N, Bonnefoi H, Cameron D, Gianni L, Valagussa P, Swain SM, Prowell T, Loibl S, et al. Pathological complete response and long-term clinical benefit in breast cancer: the CTNeoBC pooled analysis. Lancet. 2014; 384:164-72. https://doi.org/10.1016/S0140-6736(13)62422-8.
34. Kong X, Moran MS, Zhang N, Haffty B, Yang Q. Meta-analysis confirms achieving pathological complete response after neoadjuvant chemotherapy predicts favourable prognosis for breast cancer patients. Eur J Cancer. 2011; 47:2084-90. https://doi.org/10.1016/j.ejca.2011.06.014.
35. Paik S, Shak S, Tang G, Kim C, Baker J, Cronin M, Baehner FL, Walker MG, Watson D, Park T, Hiller W, Fisher ER, Wickerham DL, et al. A multigene assay to predict recurrence of tamoxifen-treated, node-negative breast cancer. N Engl J Med. 2004; 351:2817-26. https://doi.org/10.1056/NEJMoa041588.
36. Nielsen TO, Parker JS, Leung S, Voduc D, Ebbert M, Vickery T, Davies SR, Snider J, Stijleman IJ, Reed J, Cheang MC, Mardis ER, Perou CM, et al. A comparison of PAM50 intrinsic subtyping with immunohistochemistry and clinical prognostic factors in tamoxifen-treated estrogen receptor-positive breast cancer. Clin Cancer Res. 2010; 16:5222-32. https://doi.org/10.1158/1078-0432.CCR-10-1282.
37. Parker JS, Mullins M, Cheang MC, Leung S, Voduc D, Vickery T, Davies S, Fauron C, He X, Hu Z, Quackenbush JF, Stijleman IJ, Palazzo J, et al. Supervised risk predictor of breast cancer based on intrinsic subtypes. J Clin Oncol. 2009; 27:1160-7. https://doi.org/10.1200/JCO.2008.18.1370.
38. van 't Veer LJ, Dai H, van de Vijver MJ, He YD, Hart AA, Mao M, Peterse HL, van der Kooy K, Marton MJ, Witteveen AT, Schreiber GJ, Kerkhoven RM, Roberts C, et al. Gene expression profiling predicts clinical outcome of breast cancer. Nature. 2002; 415:530-6. https://doi.org/10.1038/415530a.
39. Naoi Y, Kishi K, Tanei T, Tsunashima R, Tominaga N, Baba Y, Kim SJ, Taguchi T, Tamaki Y, Noguchi S. Development of 95-gene classifier as a powerful predictor of recurrences in node-negative and ER-positive breast cancer patients. Breast Cancer Res Treat. 2011; 128:633-41. https://doi.org/10.1007/s10549-010-1145-z.
40. Faneyte IF, Schrama JG, Peterse JL, Remijnse PL, Rodenhuis S, van de Vijver MJ. Breast cancer response to neoadjuvant chemotherapy: predictive markers and relation with outcome. Br J Cancer. 2003; 88:406-12. https://doi.org/10.1038/sj.bjc.6600749.
41. Petit T, Wilt M, Velten M, Millon R, Rodier JF, Borel C, Mors R, Haegele P, Eber M, Ghnassia JP. Comparative value of tumour grade, hormonal receptors, Ki-67, HER-2 and topoisomerase II alpha status as predictive markers in breast cancer patients treated with neoadjuvant anthracycline-based chemotherapy. Eur J Cancer. 2004; 40:205–11. https://doi.org/10.1016/S0959-8049(03)00675-0.
42. Colleoni M, Viale G, Zahrieh D, Pruneri G, Gentilini O, Veronesi P, Gelber RD, Curigliano G, Torrisi R, Luini A, Intra M, Galimberti V, Renne G, et al. Chemotherapy is more effective in patients with breast cancer not expressing steroid hormone receptors: a study of preoperative treatment. Clin Cancer Res. 2004; 10:6622-8. https://doi.org/10.1158/1078-0432.CCR-04-0380.
43. Jankowski C, Guiu S, Cortet M, Charon-Barra C, Desmoulins I, Lorgis V, Arnould L, Fumoleau P, Coudert B, Rouzier R, Coutant C, Reyal F. Predictive factors of pathologic complete response of HER2-positive breast cancer after preoperative chemotherapy with trastuzumab: development of a specific predictor and study of its utilities using decision curve analysis. Breast Cancer Res Treat. 2017; 161:73-81. https://doi.org/10.1007/s10549-016-4040-4.
44. Goorts B, van Nijnatten TJ, de Munck L, Moossdorff M, Heuts EM, de Boer M, Lobbes MB, Smidt ML. Clinical tumor stage is the most important predictor of pathological complete response rate after neoadjuvant chemotherapy in breast cancer patients. Breast Cancer Res Treat. 2017; 163:83–91. https://doi.org/10.1007/s10549-017-4155-2.
45. Pohl G, Rudas M, Taucher S, Stranzl T, Steger GG, Jakesz R, Pirker R, Filipits M. Expression of cell cycle regulatory proteins in breast carcinomas before and after preoperative chemotherapy. Breast Cancer Res Treat. 2003; 78:97–103. https://doi.org/10.1023/A:1022165715043.
46. Fasching PA, Heusinger K, Haeberle L, Niklos M, Hein A, Bayer CM, Rauh C, Schulz-Wendtland R, Bani MR, Schrauder M, Kahmann L, Lux MP, Strehl JD, et al. Ki67, chemotherapy response, and prognosis in breast cancer patients receiving neoadjuvant treatment. BMC Cancer. 2011; 11:486. https://doi.org/10.1186/1471-2407-11-486.
47. Nishimura R, Osako T, Okumura Y, Hayashi M, Arima N. Clinical significance of Ki-67 in neoadjuvant chemotherapy for primary breast cancer as a predictor for chemosensitivity and for prognosis. Breast Cancer. 2010; 17:269-75. https://doi.org/10.1007/s12282-009-0161-5.
48. Jones RL, Salter J, A'Hern R, Nerurkar A, Parton M, Reis-Filho JS, Smith IE, Dowsett M. Relationship between oestrogen receptor status and proliferation in predicting response and long-term outcome to neoadjuvant chemotherapy for breast cancer. Breast Cancer Res Treat. 2010; 119:315-23. https://doi.org/10.1007/s10549-009-0329-x.
49. Zhang Y, Delahanty R, Guo X, Zheng W, Long J. Integrative genomic analysis reveals functional diversification of APOBEC gene family in breast cancer. Hum Genomics. 2015; 9:34. https://doi.org/10.1186/s40246-015-0056-9.
50. Yamamoto Y, Ibusuki M, Nakano M, Kawasoe T, Hiki R, Iwase H. Clinical significance of basal-like subtype in triple-negative breast cancer. Breast Cancer. 2009; 16:260-7. https://doi.org/10.1007/s12282-009-0150-8.
51. Mukai H, Aihara T, Yamamoto Y, Takahashi M, Toyama T, Sagara Y, Yamaguchi H, Akabane H, Tsurutani J, Hara F, Fujisawa T, Yamamoto N, Ohsumi S, and Japanese Breast Cancer Society. The Japanese Breast Cancer Society Clinical Practice Guideline for systemic treatment of breast cancer. Breast Cancer. 2015; 22:5-15. https://doi.org/10.1007/s12282-014-0563-x.
52. Aihara T, Toyama T, Takahashi M, Yamamoto Y, Hara F, Akabane H, Fujisawa T, Ishikawa T, Nagai S, Nakamura R, Tsurutani J, Ito Y, Mukai H. The Japanese Breast Cancer Society Clinical Practice Guideline for systemic treatment of breast cancer, 2015 edition. Breast Cancer. 2016; 23:329-42. https://doi.org/10.1007/s12282-016-0670-y.
53. Altman DG, McShane LM, Sauerbrei W, Taube SE. Reporting Recommendations for Tumor Marker Prognostic Studies (REMARK): explanation and elaboration. PLoS Med. 2012; 9:e1001216. https://doi.org/10.1371/journal.pmed.1001216.
54. Ibusuki M, Fu P, Yamamoto S, Fujiwara S, Yamamoto Y, Honda Y, Iyama K, Iwase H. Establishment of a standardized gene-expression analysis system using formalin-fixed, paraffin-embedded, breast cancer specimens. Breast Cancer. 2013; 20:159-66. https://doi.org/10.1007/s12282-011-0318-x.
55. Wolff AC, Hammond ME, Hicks DG, Dowsett M, McShane LM, Allison KH, Allred DC, Bartlett JM, Bilous M, Fitzgibbons P, Hanna W, Jenkins RB, Mangu PB, et al, and American Society of Clinical Oncology, and College of American Pathologists. Recommendations for human epidermal growth factor receptor 2 testing in breast cancer: American Society of Clinical Oncology/College of American Pathologists clinical practice guideline update. J Clin Oncol. 2013; 31:3997-4013. https://doi.org/10.1200/JCO.2013.50.9984.
56. Wolff AC, Hammond ME, Hicks DG, Dowsett M, McShane LM, Allison KH, Allred DC, Bartlett JM, Bilous M, Fitzgibbons P, Hanna W, Jenkins RB, Mangu PB, et al, and American Society of Clinical Oncology, and College of American Pathologists. Recommendations for human epidermal growth factor receptor 2 testing in breast cancer: American Society of Clinical Oncology/College of American Pathologists clinical practice guideline update. Arch Pathol Lab Med. 2014; 138:241-56. https://doi.org/10.5858/arpa.2013-0953-SA.
57. Yamamoto S, Ibusuki M, Yamamoto Y, Fu P, Fujiwara S, Murakami K, Iwase H. Clinical relevance of Ki67 gene expression analysis using formalin-fixed paraffin-embedded breast cancer specimens. Breast Cancer. 2013; 20:262-70. https://doi.org/10.1007/s12282-012-0332-7.
58. Dowsett M, Nielsen TO, A’Hern R, Bartlett J, Coombes RC, Cuzick J, Ellis M, Henry NL, Hugh JC, Lively T, McShane L, Paik S, Penault-Llorca F, et al, and International Ki-67 in Breast Cancer Working Group. Assessment of Ki67 in breast cancer: recommendations from the International Ki67 in Breast Cancer working group. J Natl Cancer Inst. 2011; 103:1656-64. https://doi.org/10.1093/jnci/djr393.