
INTRODUCTION
Identification of reliable and accurate molecular markers of cancer remains one the major challenges of contemporary biomedicine. Thousands of reports have been published communicating new RNA, protein and non-protein biochemical biomarkers sensitive to cancer development [1–7]. Most of these markers represent products of individual gene expression at the RNA or protein levels. Some of them are widely used in clinical practice, but there remains an overall unsolved problem of finding new cancer biomarkers with enhanced specificity and sensitivity scores compared to the existing ones. Another aspect of the same problem deals with the shortage of the cancer type-specific molecular markers, e.g. melanoma-specific, bladder or pancreatic cancer-specific, etc. Association of the marker expression with the success of the medical treatment may provide clues to a more efficient, patient-oriented cancer treatment therapy [8].
Recently, we developed a new bioinformatic technique termed OncoFinder. This novel program enables the user to quantatively measure the activation of intracellular signaling pathways in a number of cell/tissue physiological and pathological conditions including cancer. Signaling pathways regulate all major cellular events in health and disease [9–11].
OncoFinder takes transcriptome-wide gene expression levels, including microarray and next-generation sequencing (NGS) data as input and calculates a quantitative measure of the signaling pathway activation strength (PAS) for the signaling pathways under investigation. The PAS is a measure of the cumulative value of perturbations of a signaling pathway and it may serve as a distinct indicator of pathological changes in the intracellular signalization machine at the cellular, tissue or organ levels.
The formula for PAS calculations include gene expression data and the information of the protein interactions in the pathway under investigation, namely, the protein activator or repressor of the pathway [12]; for the pathway p, . Here the summation is done over all the gene products in a pathway, which represents the signal through a pathway p. The relative role of a gene product in signal transduction is reflected by a discrete flag activator/repressor role (ARR) which equals to 1 for an activator gene product; -1 for a repressor, and intermediate values -0,5; 0,5 and 0 for the gene products that have rather repressor, activator or unknown roles, respectively. The CNRn value (case-to-normal ratio) is the ratio of the expression level of a gene n in the sample under investigation, to the average expression level in the sampling used as the norm for this comparison. The positive value of PAS indicates abnormal activation of a signaling pathway, and the negative value – its repression. With the exception of pediatric oncology, the majority of cancers are age-related [13]. The methods for calculating PAS, CNR and the drug score in cancer were proposed in the study of aging [12, 14]. In the investigations with the experimentally-tracked data on the signaling pathway activation, we have previously confirmed the robustness of this formula and its adequacy to the analysis of intracellular signalization [12]. The above formula for PAS calculation was shown to dramatically diminish the discrepencies between the microarray and deep sequencing data obtained using various experimental platforms [15].
Calculations were made that take into account the relative importance of certain genes and their products according to the results of parameter sensitivity [16] and/or stiffness/sloppiness analysis [17] in terms of total concentrations of certain proteins using an approved kinetic model of signaling pathway activation [18].
Here, we investigated if the PAS value itself may serve as the biomarker for cancer, and compared it with “traditional” molecular markers based on the expression of individual genes. We applied OncoFinder to gene expression datasets for the nine human cancer types including bladder cancer, basal cell carcinoma, glioblastoma, hepatocellular carcinoma, lung adenocarcinoma, oral tongue squamous cell carcinoma, primary melanoma, prostate cancer and renal cancer. This covers 292 cancer and 128 normal tissue samples from the Gene expression omnibus (GEO) repository [19]. We profiled the activation of 82 signaling pathways that involve ~2700 individual gene products. For 9/9 of these cancer types, the SPA values showed significantly better area-under-the-curve (AUC) scores compared to the individual genes enclosing each of the pathways. These results provide evidence that the SPA values calculated using OncoFinder algorithm can be used as a new type of cancer biomarkers, superior to the traditional gene expression biomarkers.
RESULTS AND DISCUSSION
Profiling pathway activation strength (PAS) for cancer transcriptomes
Using the recently published algorithm for calculating PAS values [12] we profiled the large-scale transcriptomic data obtained for the nine types of human cancer and for the matching normal tissues (Table 1). In total we analized 292 cancer and 128 matching normal transcriptomes from the Gene expression omnibus (GEO) repository. This covered the following cancers; bladder cancer, basal cell carcinoma, glioblastoma, hepatocellular carcinoma, lung adenocarcinoma, oral tongue squamous cell carcinoma, primary melanoma, prostate cancer and renal cancer. All the transcriptomic datasets were synthesized using the same microarray platform Affymetrix Human Genome U133 Plus 2.0 [20–27].
We interrogated a total of 82 intracellular signaling pathways encompassing the products of ~2700 human genes (Supplementary dataset 1). Basing on the comparison of the cancer vs normal tissue transcriptomic data, we obtained the PAS profiles characteristic of the above cancer types (Supplementary datasets 2, 3). Positive and negative PAS scores reflect upregulated and downregulated signaling pathways, respectively, whereas zero PAS scores represent unaffected pathways acting similarly in cancer and in normal tissues.
We next calculated the area-under-curve (AUC) values [28] for the PAS scores of each of the pathways under investigation. The AUC value is the universal characteristics of biomarker robustness and it is dependent on the sensitivity and specificity of a biomarker. It correlates positively with the biomarker quality and may vary in an interval from 0.5 till 1. The AUC threshold for discriminating good and bad biomarkers is typically 0.7 or 0.75. The entries having greater AUC score are considered good-quality biomarkers and vice-versa [29]. The AUC values were calculated when comparing each cancer type against the remaining eight cancer types. Enhanced AUC values here meant that the corresponding signaling pathway is a good biomarker distinguishing an individual cancer type from the others (Supplementary dataset 4). This kind of AUC score will be referred here as AUC1 (Supplementary dataset 4). In parallel, we also calculated the analogous AUC scores for the individual gene products (namely, for the values of lg CNR for them, Supplementary dataset 5) including those involved in each signaling pathway. For these individual gene products involved in the pathways (a total of 2726 human gene products), we next calculated the average AUC scores characteristic of each signaling pathway/cancer type, referred here as AUC2 (Supplementary dataset 4). The AUC2 value for pathway p and cancer type n is the average of the cancer n-associated AUC scores for all the gene products involved in the pathway p. The outline of the data analysis is shown on the Figure 1.
Table 1: Transcriptomic datasets extracted from the GEO repository.
Cancer type |
Number of cancer samples |
Number of normal samples |
Reference |
GEO dataset number |
Basal cell carcinoma |
15 |
4 |
[19] |
GSE7553 |
Bladder cancer |
52 |
40 |
[20] |
GSE31189 |
Glioblastoma |
34 |
13 |
[21] |
GSE50161 |
Hepatocellular carcinoma |
10 |
10 |
[22] |
GSE29721 |
Lung adenocarcinoma |
86 |
13 |
[23] |
GSE30219 |
Oral tongue squamous cell carcinoma |
26 |
12 |
[24] |
GSE9844 |
Primary melanoma |
14 |
4 |
[19] |
GSE7553 |
Prostate cancer (well differentialed) |
20 |
20 |
[25] |
GSE32448 |
Renal cancer |
35 |
12 |
[26] |
GSE7023 |
Comparison of the AUC scores calculated for the pathway activation strength and for the individual gene expression levels
AUC1 reflects the quality of PAS as the biomarker for a given signaling pathway, and AUC2 is the integral characteristics of the biomarker quality for the expression of the genes which are involved in the same pathway. The results of the AUC calculations (Supplementary dataset 4) showed that among the good-quality biomarkers (AUC cut-off value 0.7 or 0.75) the values for AUC1 were higher than for the AUC2 for all cancer types (Table 2). For example, for the cut-off value 0.75 in all cancer types there were only 14 AUC2 (gene expression) markers, in contrast to 160 AUC1 (pathway activation) markers (Table 2). Moreover, for ten of these fourteen AUC2 markers, the corresponding AUC1 values were greater (Table 2), thus suggesting the stronger biomarker potential of the AUC1 (pathway activation) markers.
Importantly, these data show that the pathway activation strength (PAS) – based biomarkers may serve efficiently to distinguish the different cancer types. Among the 82 signaling pathways profiled in this assay, 75 showed a potential to serve as the strong cancer type-specific biomarkers with the AUC > 0.75 (Supplementary dataset 4). For each cancer type, the number of these PAS biomarkers (AUC > 0.75) varied from 2 till 59 (Table 2). The quality of these biomarkers was typically stronger than for the biomarkers purely based on the gene expression levels, as reflected by the comparison of AUC1 vs AUC2 scores (Table 2). This suggests that during cancer progression the signaling pathway regulation is a more uniform process rather than the activation of certain individual genes. Indeed, an intracellular signaling pathway is a complex regulatory network that may include hundreds of different gene products [30–31]. Theoretically, expression of every gene in this network may have an influence on the overall functioning of the signaling pathway. Alterations in the expression profiles of many different genes can, therefore, lead to a similar result of a pathway activation or suppression during cancer development [32].
In this study, we for the first time quantitatively profiled the signaling pathway activation features in 292 human cancer samples. The profiles obtained here for the bladder cancer, basal cell carcinoma, glioblastoma, hepatocellular carcinoma, lung adenocarcinoma, oral tongue squamous cell carcinoma, primary melanoma, prostate cancer and renal cancer are available in the Supplementary dataset 2. Further thourough analysis of these data is underway in our laboratory and will be published elsewhere. In this report, we want to discuss the pathway activation features that may serve to distinguish the different types of cancer (see the Supplementary dataset 6). These signaling pathways can be either upregulated or suppressed, with the characteristic values of PAS used as the distinguishing features. For example, with the AUC cut-off threshold 0.75, downregulation of the ATM pathway (average PAS~ -2) characterizes hepatocellular carcinoma, whereas its upregulation (avg PAS~3.7) is typical for the melanoma cells. Strong increase in Notch signaling (avg PAS~9) denotes glioma, mild upregulation of RNA polymerase II complex activity (avg PAS~1.4) – basal cell carcinoma, moderate decrease in IP3 signaling (avg PAS~ -1.9) – lung adenocarcinoma, et cetera. It may be seen that any investigated tissue type has its unique profile of statistically significant pathway activation features, which provides a potent instrument for further analysis and specific targeting of various cancer types in the future.
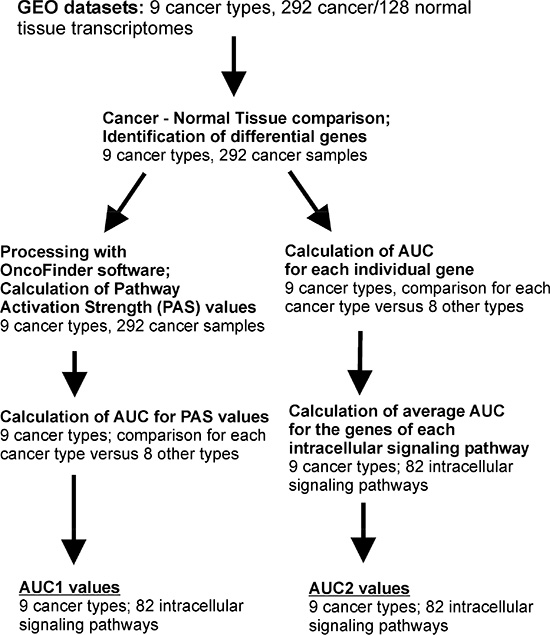
Figure 1: Outline of the bioinformatics procedures used to calculate AUC1 and AUC2 values.
Table 2: Comparison of the AUC1 and AUC2 scores calculated for 81 intracellular signaling pathways for nine human cancer types basing on the transcriptomic data
Cancer type |
AUC1 > 0.7a |
AUC2 > 0.7b |
AUC1/2 > 0.7; |
AUC1/2 > 0.7; AUC2 > AUC1d |
AUC1 > 0.75e |
AUC2 > 0.75f |
AUC1/2 > 0.75; |
AUC1/2 > 0.75; |
Basal cell carcinoma |
40 |
5 |
40 |
1 |
23 |
0 |
23 |
0 |
Bladder cancer |
20 |
23 |
15 |
15 |
10 |
9 |
8 |
4 |
Glioblastoma |
66 |
68 |
66 |
12 |
59 |
5 |
59 |
0 |
Hepatocellular |
17 |
0 |
17 |
0 |
7 |
0 |
7 |
0 |
Lung adenocarcinoma |
32 |
2 |
32 |
1 |
21 |
0 |
21 |
0 |
Oral tongue squamous cell carcinoma |
5 |
0 |
5 |
0 |
2 |
0 |
2 |
0 |
Primary melanoma |
25 |
0 |
25 |
0 |
13 |
0 |
13 |
0 |
Prostate cancer |
28 |
8 |
28 |
5 |
16 |
0 |
16 |
0 |
Renal cancer |
19 |
10 |
19 |
6 |
10 |
0 |
10 |
0 |
aNumber of signaling pathways where AUC1 > 0.7
bNumber of signaling pathways where AUC2 > 0.7
cNumber of signaling pathways where AUC1/2 > 0.7, and AUC1 > AUC2
dNumber of signaling pathways where AUC1/2 > 0.7, and AUC2 > AUC1
eNumber of signaling pathways where AUC1 > 0.75
fNumber of signaling pathways where AUC2 > 0.75
gNumber of signaling pathways where AUC1/2 > 0.75, and AUC1 > AUC2
hNumber of signaling pathways where AUC1/2 > 0.75, and AUC2 > AUC1
It was shown previously that many intracellular signaling pathways actively participate in tumorigenesis [33–36]. Other pathways, in turn, are silenced in the transformed cells and tissues [37–38]. Intracellular regulation is also implicated in metastasing, drug resistance and tumor invasiveness [39–42]. We propose that the current bioinformatic approach based on the OncoFinder algorithm opens broad perspectives for finding tight associations of signaling pathway activation with the prognosis of disease progression and with the efficiency of anticancer treatment.
CONCLUSION
In this study, we provide evidence that the signaling pathway activation strength (PAS) values may serve as the biomarkers of different cancer types, frequently superior than the traditional molecular markers based on the expression of individual genes. We applied our original bioinformatical algorithm OncoFinder to gene expression datasets for the nine human cancer types. This includes 292 cancer and 128 normal tissue samples taken from the Gene expression omnibus (GEO) repository. We profiled the activation of 82 signaling pathways that involve ~2700 individual gene products. For 9/9 of the cancer types, the SPA values showed significantly stronger area-under-the-curve (AUC) scores compared to the individual genes whose products are involved in the respective pathways. These results show that the SPA values calculated using OncoFinder algorithm may be used as a new type of cancer biomarker, superior to the traditional gene expression biomarkers. We also, for the first time, publish characteristic intracellular signaling pathway activation profiles for nine human types of cancer.
METHODS
Source datasets
Gene expression data used in this study were downloaded from the Gene Expression Omnibus (GEO) repository of transcriptomic information (http://www.ncbi.nlm.nih.gov/geo/). All the dataset were obtained using the microarray platform Affymetrix Human Genome U133 Plus 2.0 Array. The datasets used are listed on the Table 1. The normal tissue samples from each dataset were used as the controls in further calculations.
The signalome knowledge base developed by SABiosciences (http://www.sabiosciences.com/pathwaycentral.php) was used to determine structures of intracellular pathways, which was used for the computational algorithm OncoFinder exactly as described previously [12, 14, 43]. For all the datasets, the data on gene expression levels for cancer and normal tissues were quantile-normalized. For each cancer sample, the logarithmic value of lg CNR was used for every gene in further calculations.
Functional annotation of gene expression data
We applied our original algorithm OncoFinder [12] for the functional annotation of the primary expression data and for the calculation of the PAS scores. The extracted raw microarray expression data were quantile normalized according to [44]. Our approach to the transcriptome-wide gene expression analysis applies processing of these results with the signalome knowledge base developed by SABiosciences (http://www.sabiosciences.com/pathwaycentral.php). The algorithm utilizes a scheme that takes into account the overall impact of each gene product in the signaling pathway but ignores its position in the pathway graph. The formula used to calculate the pathway activation strength (PAS) for a given sample and a given pathway p is as follows:
Here the case-to-normal ratio, CNRn , is the ratio of expression levels for a gene n in the sample under investigation to the same average value for the control group of samples. The Boolean flag of BTIF (beyond tolerance interval flag) equals zero when the CNR value has passed simultaneously the two criteria that demark the significantly perturbed expression level from essentially normal. The first criterion is the expression level for the sample lies within the tolerance interval, where p>0.05. The second criterion is the discrete value of ARR (activator / repressor role) equals to the following fixed values: -1, when the gene/protein n is a repressor of pathway excitation; 1, if the gene/protein n is an activator of pathway excitation; 0, when the gene/protein n can be both an activator and a repressor of the pathway; 0.5 and -0.5, respectively, if the gene/protein n is rather an activator or repressor of the signaling pathway p, respectively. The results for the 82 pathways were obtained for each sample (listed in the Supplementary dataset 2). The area-under-curve (AUC) values were calculated according to [28]. Statistical tests were done using the R software package.
ACKNOWLEDGEMENTS
This work was supported by the Russian Foundation for Basic Research grant 12-04-33094 and the Program of the Presidium of the Russian Academy of Sciences “Dynamics and Conservation of Genomes”. The authors thank The First Oncology Research and Advisory Center (Moscow, Russia) and “UMA Foundation” (Moscow) for their support in preparation of the manuscript and Dr. Kristen Swithers of Yale University for editing the manuscript.
REFERENCES
1. Koepke J.A. Molecular marker test standardization. Cancer. 1992; 69:1578–1581.
2. Bast RC, Xu FJ, Yu YH, Barnhill S, Zhang Z, Mills GB. CA 125: the past and the future. Int J Biol Markers. 1998; 13:179–187.
3. Krishnan STM, Philipose Z, Rayman G. Lesson of the week: Hypothyroidism mimicking intra-abdominal malignancy. BMJ. 2002; 325:946–947.
4. Keshaviah A, Dellapasqua S, Rotmensz N, Lindtner J, Crivellari D, Collins J, Colleoni M, Thürlimann B, Mendiola C, Aebi S, Price KN, Pagani O, Simoncini E, Castiglione Gertsch M, Gelber RD, Coates AS, Goldhirsch A. CA15-3 and alkaline phosphatase as predictors for breast cancer recurrence: A combined analysis of seven International Breast Cancer Study Group trials. Annals of Oncology. 2006; 18:701–708.
5. Mathivanan S, Periaswamy B, Gandhi TK, Kandasamy K, Suresh S, Mohmood R, Ramachandra YL, Pandey A. An evaluation of human protein-protein interaction data in the public domain. BMC Bioinformatics. 2006; 7:S1.
6. Bagan P, Berna P, Assouad J, Hupertan V, le Pimpec-Barthes F, Riquet M. Value of cancer antigen 125 for diagnosis of pleural endometriosis in females with recurrent pneumothorax. Eur Respir J. 2008; 3:140–142.
7. Kilpatrick ES, Lind M J. Appropriate requesting of serum tumour markers. BMJ. 2009; 339:b3111.
8. Blagosklonny MV. Common drugs and treatments for cancer and age-related diseases: revitalizing answers to NCI's provocative questions. Oncotarget. 2012; 3:1711–1724.
9. Blagosklonny MV. MTOR-driven quasi-programmed aging as a disposable soma theory: blind watchmaker vs. intelligent designer. Cell Cycle. 2013; 12:1842–1847.
10. Demidenko ZN, Blagosklonny MV. The purpose of the HIF-1/PHD feedback loop: to limit mTOR-induced HIF-1α. Cell Cycle. 2011; 10:1557–1556.
11. Blagosklonny MV. The power of chemotherapeutic engineering: arresting cell cycle and suppressing senescence to protect from mitotic inhibitors. Cell Cycle. 2011; 10:2295–2298.
12. Buzdin AA, Zhavoronkov AA, Korzinkin MB, Venkova LS, Zenin AA, Smirnov PhYu, Borisov NM. OncoFinder, a new method for the analysis of intracellular signaling pathway activation using transcriptomic data. Frontiers in Genetics: Bioinformatics and Computational Biology. 2014; 5:55.
13. Zhavoronkov A, Cantor CR. Methods for Structuring Scientific Knowledge from Many Areas Related to Aging Research. PLoS ONE. 2011; 6:e22597.
14. Zhavhavoronkov A, Buzdin AA, Garazha AV, Borisov NM, Moskalev AA. Signaling pathway cloud regulation for in silico screening and ranking of the potential geroprotective drugs. Frontiers in Genetics of Aging. 2014; 5:4.
15. Buzdin AA, Zhavoronkov AA, Korzinkin MB, Roumiantsev SA, Aliper AM, Venkova LS, Smirnov PhYu, Borisov NM. The OncoFinder algorithm for minimizing the errors introduced by the high-throughput methods of transcriptome analysis. Frontiers in Molecular Biosciences. 2014; 1:89.
16. Kholodenko B, Kiyatkin A, Bruggeman F, Sontag E, Westerhof HV, Hoek JB. Untangling the wires: a strategy to trace functional inter actions in signaling and gene networks. PNAS. 2003; 20:12841–12846.
17. Daniels BC, Chen YJ, Sethna JP, Gutenkunst RN, Myers CR. Sloppiness, robustness and evolvability in systems biology. Curr Opin Biotechnol. 2008; 19:389–395.
18. Kuzmina NB, Borisov NM. Handling complex rule-based models of mitogenic cell signaling (On the example of ERK activation upon EGF stimulation). Intl Proc Chem Biol Envir Engng. 2011; 5:76–82.
19. GEO Profiles, a National Center of Biotechnology Information database. URL: http://www.ncbi.nlm.nih.gov/geoprofiles.
20. Riker AI, Enkemann SA, Fodstad O, Liu S, Ren S, Morris C, Xi Y, Howell P, Metge B, Samant RS, Shevde LA, Li W, Eschrich S, Daud A, Ju J, Matta J. The gene expression profiles of primary and metastatic melanoma yields a transition point of tumor progression and metastasis. BMC Med Genomics. 2008; 1:13.
21. Urquidi V, Goodison S, Cai Y, Sun Y, Rosser CJ. A candidate molecular biomarker panel for the detection of bladder cancer. Cancer Epidemiol Biomarkers Prev. 2012; 21:2149–2158.
22. Griesinger AM, Birks DK, Donson AM, Amani V, Hoffman LM, Waziri A, Wang M, Handler MH, Foreman NK. Characterization of distinct immunophenotypes across pediatric brain tumor types. J Immunol. 2013; 191:4880–4888.
23. Stefanska B, Huang J, Bhattacharyya B, Suderman M, Hallett M, Han ZG, Szyf M. Definition of the landscape of promoter DNA hypomethylation in liver cancer. Cancer Res. 2011; 71:5891–5903.
24. Rousseaux S, Debernardi A, Jacquiau B, Vitte AL, Vesin A, Nagy-Mignotte H, Moro-Sibilot D, Brichon PY, Lantuejoul S, Hainaut P, Laffaire J, de Reyniès A, Beer DG, Timsit JF, Brambilla C, Brambilla E, Khochbin S. Ectopic activation of germline and placental genes identifies aggressive metastasis-prone lung cancers. Sci Transl Med. 2013; 5:186ra66.
25. Ye H, Yu T, Temam S, Ziober BL, Wang J, Schwartz JL, Mao L, Wong DT, Zhou X. Transcriptomic dissection of tongue squamous cell carcinoma. BMC Genomics. 2008; 9:69.
26. Derosa CA, Furusato B, Shaheduzzaman S, Srikantan V, Wang Z, Chen Y, Seifert M, Ravindranath L, Young D, Nau M, Dobi A, Werner T, McLeod DG, Vahey MT, Sesterhenn IA, Srivastava S, Petrovics G. Elevated osteonectin/SPARC expression in primary prostate cancer predicts metastatic progression. Prostate Cancer Prostatic Dis. 2012; 15:150–156.
27. Furge KA, Chen J, Koeman J, Swiatek P, Dykema K, Lucin K, Kahnoski R, Yang XJ, Teh BT. Detection of DNA copy number changes and oncogenic signaling abnormalities from gene expression data reveals MYC activation in high-grade papillary renal cell carcinoma. Cancer Res. 2007; 67:3171–3176.
28. Green DM, Swets JA. Signal detection theory and psychophysics. (New York: John Wiley & Sons Ltd, 1966. ISBN 0-471-32420-5.
29. Boyd JC. Mathematical tools for demonstrating the clinical usefulness of biochemical markers. Scand J Clin Lab Invest Suppl. 1997; 227:46–63.
30. Munshi A, Ramesh R. Mitogen-activated protein kinases and their role in radiation response. Genes Cancer. 2013; 4:401–408.
31. Demchenko YN, Brents LA, Li Z, Bergsagel LP, McGee LR, Kuehl MW. Novel inhibitors are cytotoxic for myeloma cells with NFkB inducing kinase-dependent activation of NFkB. Oncotarget. 2014, Jun 23.
32. Morgenroth A, Vogg AT, Ermert K, Zlatopolskiy B, Mottaghy FM. Hedgehog signaling sensitizes Glioma stem cells to endogenous nano-irradiation. Oncotarget. 2014, Jun 20.
33. Ferrari L, Pistocchi A, Libera L, Boari N, Mortini P, Bellipanni G, Giordano A, Cotelli F, Riva P. FAS/FASL are dysregulated in chordoma and their loss-of-function impairs zebrafish notochord formation. Oncotarget. 2014; 5:5712–5724.
34. Thakur N, Gudey SK, Marcusson A, Fu JY, Bergh A, Heldin CH, Landström M. TGFβ-induced invasion of prostate cancer cells is promoted by c-Jun-dependent transcriptional activation of Snail1. Cell Cycle, 2014; 13:Jun 19.
35. Davis NM, Sokolosky M, Stadelman K, Abrams SL, Libra M, Candido S, Nicoletti F, Polesel J, Maestro R, D'Assoro A, Drobot L, Rakus D, Gizak A, Laidler P, Dulińska-Litewka J, Basecke J, Mijatovic S, Maksimovic-Ivanic D, Montalto G, Cervello M, Fitzgerald TL, Demidenko Z, Martelli AM, Cocco L, Steelman LS, McCubrey JA. Deregulation of the EGFR/PI3K/PTEN/Akt/mTORC1 pathway in breast cancer: possibilities for therapeutic intervention. Oncotarget. 2014; 5:4603–4650.
36. Yap YS, McPherson JR, Ong CK, Rozen SG, Teh BT, Lee AS, Callen DF. The NF1 gene revisited - from bench to bedside. Oncotarget. 2014, Jul 9.
37. Geng J, Fan J, Ouyang Q, Zhang X, Zhang X, Yu J, Xu Z, Li Q, Yao X, Liu X, Zheng J. Loss of PPM1A expression enhances invasion and the epithelial-to-mesenchymal transition in bladder cancer by activating the TGF-β/Smad signaling pathway. Oncotarget. 2014; 5:5700–5711.
38. Vignarajan S, Xie C, Yao M, Sun Y, Simanainen U, Sved P, Liu T, Dong Q. Loss of PTEN stabilizes the lipid modifying enzyme cytosolic phospholipase A2α via AKT in prostate cancer cells. Oncotarget. 2014, Jul 9.
39. Patil AA, Sayal P, Depondt ML, Beveridge RD, Roylance A, Kriplani DH, Myers KN, Cox A, Jellinek D, Fernando M, Carroll TA, Collis SJ. Oncotarget. 2014, Jul 16.
40. Li Q, Li J, Wen T, Zeng W, Peng C, Yan S, Tan J, Yang K, Liu S, Guo A, Zhang C, Su J, Jiang M, Liu Z, Zhou H, Chen X. Overexpression of HMGB1 in melanoma predicts patient survival and suppression of HMGB1 induces cell cycle arrest and senescence in association with p21 (Waf1/Cip1) up-regulation via a p53-independent, Sp1-dependent pathway. Oncotarget. 2014, Jul 15.
41. Bao YN, Cao X, Luo DH, Sun R, Peng LX, Wang L, Yan YP, Zheng LS, Xie P, Cao Y, Liang YY, Zheng FJ, Huang BJ, Xiang YQ, Lv X, Chen QY, Chen MY, Huang PY, Guo L, Mai HQ, Guo X, Zeng YX, Qian CN. Urokinase-type plasminogen activator receptor signaling is critical in nasopharyngeal carcinoma cell growth and metastasis. Cell Cycle. 2014; 13:1958–1969.
42. Sokolosky M, Chappell WH, Stadelman K, Abrams SL, Davis NM, Steelman LS, McCubrey JA. Inhibition of GSK-3β activity can result in drug and hormonal resistance and alter sensitivity to targeted therapy in MCF-7 breast cancer cells. Cell Cycle. 2014; 13:820–833.
43. Spirin PV, Lebedev TD, Orlova NN, Gornostaeva AS, Prokofjeva MM, Nikitenko NA, Dmitriev SE, Buzdin AA, Borisov NM, Aliper AM, Garazha AV, Rubtsov PM, Stocking C, Prassolov VS. Silencing AML1-ETO gene expression leads to simultaneous activation of both pro-apoptotic and proliferation signaling. Leukemia. 2014, Apr 14.
44. Bolstad BM, Irizarry RA, Astrand M, Speed TP. A comparison of normalization methods for high density oligonucleotide array data based on variance and bias. Bioinformatics. 2003; 19:185–193.