
INTRODUCTION
Although gastrointestinal stromal tumors (GISTs) comprise <1% of all gastrointestinal tumors occurring in patients, they are the most common primary mesenchymal tumor of the digestive tract, with a prevalence of 15 to 20 per 1,000,000 [1, 2]. GISTs arise predominantly in the stomach (60% of cases), small intestine (25%), rectum (5%), esophagus (2%), and various other locations [3]. GISTs are characterized by activating mutations in genes encoding the KIT Proto-Oncogene Receptor Tyrosine Kinase (KIT) or the platelet-derived growth factor receptor alpha (PDGFRA) [3]. Pfetin (potassium channel tetramerization domain containing 12), encoded by the KCTD12 gene, was identified as an auxiliary subunit of GABAB receptors that directly influences the biophysical and pharmacological properties of the receptor responses [4, 5]. Using a proteomic approach, our group has previously reported that pfetin is a strong prognostic biomarker for GIST [6], and this conclusion has been confirmed by numerous several follow-up studies [7–9]. Although the specific function of pfetin in GIST tumorigenesis and progression remains unknown, it is likely that pfetin has an important tumor-suppressive role in GISTs. Numerous genetic analyses of tumor suppressor genes have been performed, and correlations between the mutational status, risk of cancer, prognostic outcome, and chemo-sensitivity have been thoroughly detailed [10–14]. Furthermore, genetic alterations in specific regions of the tumor suppressor genes/oncogenes are known to change molecular structures and affect their function of the encoded protein [15, 16]. Therefore, the ability to correlate genetic mutations with clinical information is an important strategy to characterize genes whose functions remain unknown. Recently, an integrated genomic analysis of ovarian carcinoma revealed a genetic mutation in KCTD12 in one case of high-grade serous ovarian adenocarcinoma (HGS-OvCa) [17]. The prognostic value of KCTD12 mutations in serous OvCa remains unknown, as the KCTD12 mutation was detected only in a single case of a large HGS-OvCa study cohort. It is therefore pertinent to examine the genetic alterations of KCTD12 in GISTs and to compare these with protein expression levels and patient prognosis, because high expression of pfetin correlates with a favorable prognostic outcome. In this study, we first investigated the genetic alterations of KCTD12 in GISTs to ascertain their clinical impact upon patient survival. In addition, we also performed an analysis of pfetin function to elucidate its hypothesized tumor suppressive role, with a particular emphasis on its relationship to KIT expression.
RESULTS
KCTD12 mutations frequently occur in GIST; however, their presence does not affect patient prognosis
In the cohort of GIST patient cases examined in this study, pfetin expression significantly affected the disease-free survival and overall survival of the patients as we previously demonstrated (Supplementary Figure 1A–1D). In this series, pfetin expression was judged as negative in 15 cases (Supplementary Table 1), and loss of pfetin expression was associated with higher mitotic rate (>5/50HPFs: p = 0.029 Supplementary Table 2). There was also a trend between presence of necrosis and loss of pfetin expression, but this was not statistically significant (p = 0.09). It is known that KIT downstream signal activity is different depending on KIT genotype, however, no correlation was observed between KIT genotype and pfetin expression level. Furthermore, pfetin expression status did not correlate with immunohistochemically determined c-kit expression level (Supplementary Table 2).
We detected many instances of KCTD12 mutations as somatic mutations (Table 1). In total, 35 KCTD12 mutations were found in samples of 22 out of 76 patients (Figure 1A–1D), among which only three cases showed decreased pfetin expression. All mutations were missense mutations, and no frameshift or nonsense mutations were identified. The presence of KCTD12 mutations did not correlate with the immunohistochemically determined pfetin expression level or with the tumor location (expression level; p = 0.923 Supplementary Table 2, tumor location; p = 0.870 Supplementary Table 3). Furthermore, the presence of KCTD12 mutations did not affect patients’ overall or recurrence-free survival (data not shown).
Table 1: KCTD12 mutations in GISTs
Patient# |
Pfetin IHC |
KCTH12 mutation |
|---|---|---|
6 |
(+) |
Codon134 (CAG to TAG) |
13 |
(−) |
Codon160 (GGC to AGC) |
17 |
(+) |
Codon136 (GGC to GAC) |
Codon138 (GGG to GAG) |
||
25 |
(−) |
Codon136 (GGC to GAC) |
26 |
(−) |
Codon141 (CCC to CTC) |
Codon140 (CCG to CTG) |
||
27 |
(+) |
Codon270 (TAT to TGT) |
Codon139 (CCG to TCG) |
||
30 |
(+) |
Codon150 (GGC to GAC) |
Codon245 (GCC to CCC) |
||
31 |
(+) |
Codon138 (GGG to GAG) |
32 |
(+) |
Codon132 (CCC to CTC) |
Codon248 (GTG to ATG) |
||
33 |
(+) |
Codon124 (GAG to AAG) |
Codon228 (GCC to ACC) |
||
Codon272 (CTC to TTC) |
||
34 |
(+) |
Codon139 (CCG to CTG) |
35 |
(+) |
Codon131 (GCG to ACG) |
Codon240 (GGA to GAA) |
||
Codon28 (GAG to GGG) |
||
39 |
(+) |
Codon40 (GTG to ATG) |
Codon134 (CAG to TAG) |
||
Codon143 (CGG to TGG) |
||
45 |
(+) |
Codon138 (GGG to AGG) |
Codon195 (CTC to TTC) |
||
Codon206 (CGC to TGC) |
||
46 |
(+) |
Codon191 (GCG to GTG) |
54 |
(+) |
Codon185 (AGT to AAT) |
60 |
(+) |
Codon126 (GTG to ATG) |
63 |
(+) |
Codon132 (CCC to CTC) |
65 |
(+) |
Codon134 (CAG to CAT) |
73 |
(+) |
Codon14 (GGC to AGC) |
74 |
(+) |
Codon4 (GCG to GTG) |
77 |
(+) |
Codon123 (CGC to CTC) |
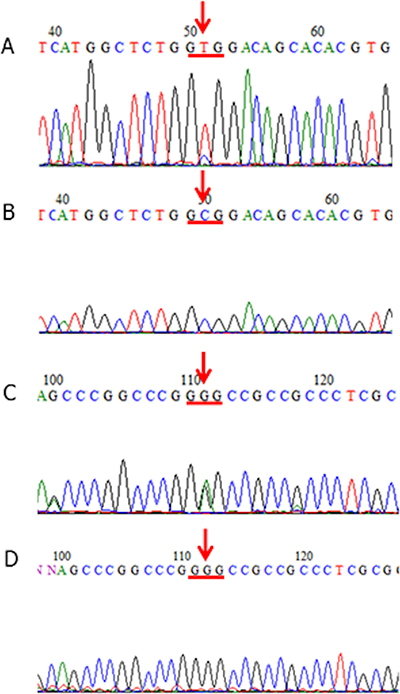
Figure 1: KCTD12 mutations in GISTs. (A, B) A patient case of GIST (Case #75) that harbored a mutation at codon 4 of the KCTD12 gene (GCG (Ala) to GTG (Val)) (A: tumor-derived DNA, B: corresponding normal tissue-derived DNA). The tissue samples from this patient case showed immunohistochemically detected pfetin expression (not shown). (C, D) A patient case of GIST (Case #32) that harbored a mutation at codon 138 of the KCTD12 gene (GGG (Gly) to GAG (Glu)) (C: tumor-derived DNA, D: corresponding normal tissue-derived DNA). The tissue samples from this patient case showed immunohistochemically detected pfetin expression (not shown).
Knockdown of KCTD12 accelerated cell growth in the GIST T1 cell line
First, we confirmed that the GIST T1 cell line did not harbor any genetic alterations of KCTD12. We successfully knocked down KCTD12 expression in the GIST T1 cell line by using two different siRNAs. We found that following KCTD12 knockdown, cell proliferation rates were significantly increased in the period from 24 to 96 h after transfection (Figure 2). This finding suggests a possibility that pfetin has a tumor suppressor function and controls proliferation of the GIST T1 cells. However, knockdown of KCTD12 by two siRNAs did not affect GIST T1 cell invasiveness (data not shown). Furthermore, KIT knockdown was also performed in the GIST T1 cells. As expected, this manipulation drastically decreased T1 cell proliferation (Figure 2).
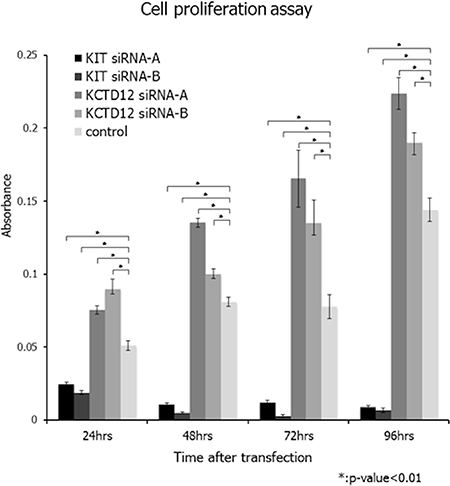
Figure 2: Effects of KCTD12 and KIT knockdown in GIST T1 cells. Knockdown of KCTD12 in the GIST T1 cell line resulted in significantly increased cell proliferation rates at 24–96 h after transfection. Furthermore, KIT knockdown was also performed in T1 cells. As expected, the knockdown of KIT drastically decreased T1 cell proliferation at 24–96 h after transfection.
KIT knockdown increased KCTD12 expression at both the mRNA and protein level in the GIST T1 cell line
To determine the relationship between KIT and KCTD12 in GIST, we first performed knockdown of KIT in the GIST T1 cell line. Both protein (Figure 3A, Supplementary Figure 2) and mRNA (Figure 3B) expression levels of KCTD12 were significantly increased by the knockdown of KIT. In turn, the knockdown of KCTD12 seemed to reduce the protein expression level of KIT only slightly (Figure 3A, Supplementary Figure 2). The decrease in the KIT mRNA level was also minimal, although it was statistically significant (Figure 3C). Global gene expression changes (72 h after siRNA transfection) following knockdown of KIT or KCTD12 were assessed by the microarray analysis (Affymetrix GeneChip Human Genome U133 Pus 2.0) and this inverse relationship was confirmed regarding KIT and KCTD12 expression levels. These results are included in the supplementary data section. These findings suggest a model, in which KIT negatively regulates KCTD12.
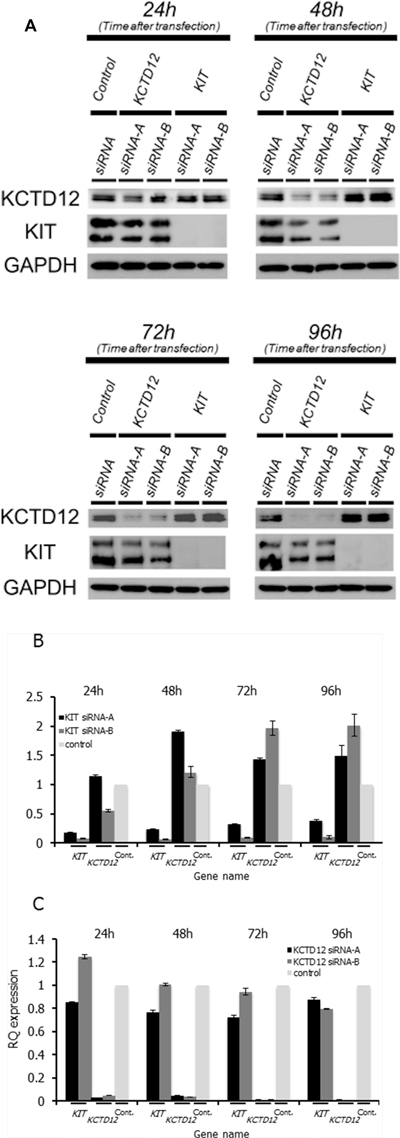
Figure 3: The relationship between the KIT and KCTD12 protein expression levels in GIST T1 cells. (A) Western blotting was performed at 24–96 h after transfection with corresponding siRNAs. Protein expression levels of KCTD12 increased at 24–96 h after KIT knockdown. In contrast, the knockdown of KCTD12 reduced KIT protein expression in the same period. (B) Expression levels of KCTD12 mRNA increased approximately 1.5–2-fold at 72–96 h after the transfection with KIT siRNA. (C) Expression levels of KIT mRNA showed slight but gradual reduction after the transfection with KCTD12 siRNA.
Microarray analysis
Global gene expression changes after KIT knockdown were larger than that in the case of KCTD12 knockdown (Supplementary Table 4). As expected, many genes involved in the cell cycle were downregulated by KIT knockdown, reflecting a drastic decrease in cell proliferation. In contrast, genes involved in the regulation of cell adhesion and extracellular matrix were upregulated by KIT knockdown. A finding of increase of the KCTD12 mRNA expression by real-time PCR after KIT knockdown was confirmed by this microarray analysis, although it was slight (ratios: 1.16 and 1.05). Knockdown of KCTD12 upregulated the genes associated with extracellular matrix, chemotaxis and lipid metabolism and downregulated genes associated with translational regulations such as RNA modification and processing. A slight decrease in KIT mRNA expression after KCTD12 knockdown observed in real-time PCR assay was also confirmed in this microarray analysis (ratio: 0.93).
DISCUSSION
Pfetin is an auxiliary GABAB receptor subunit that distinctly influences the biophysical and pharmacological properties of the receptor response [4, 5]. Left–right differences in habenular neuropil formation in the brain are closely correlated with asymmetric expression of pfetin, and a KCTD12 mutation has been found to cause excess neuropil elaboration [18]. However, the role of pfetin in tumorigenesis and tumor progression has not been previously described. We have previously demonstrated the prognostic value of pfetin expression in GISTs, and validation studies from numerous clinical facilities have confirmed that pfetin expression is a reliable prognostic biomarker [7–9]. In the present study, pfetin expression also significantly correlated with the duration of disease-free survival of GIST patients.
Although we have demonstrated a decreased pfetin expression in a subset of GISTs with poor clinical outcomes, the mechanisms that regulate pfetin expression remain unclear. In a genome-wide mutation screening, a mutation of KCTD12 has been reported in a case of high-grade serous ovarian carcinoma [17]. In the process of acquiring highly malignant properties, such as metastasis, invasion, and peritoneal dissemination, GISTs are thought to exhibit secondary genetic alterations [19]. We hypothesized that KCTD12 mutations might be associated with a loss of the tumor suppressor function of pfetin, leading to the acquisition of aggressive phenotypes by the tumor, similarly to the phenomenon that occurs with other tumor suppressor genes, e.g., CDH1 and TP53 [20, 21]. KCTD12 mutations were frequently observed in GIST patients. However, they were not associated with immunohistochemically determined changes in pfetin expression. Furthermore, they did not affect the prognosis of GIST patients. In this study, all changes in the KCTD12 sequence were missense mutations, and no frameshift or nonsense mutations were identified. This finding might explain, in part, intact pfetin expression in GIST samples. In addition, tumor heterogeneity might also partially account for this observation. We defined pfetin expression as immunohistochemically positive when more than 20% of tumor cells were stained for pfetin [6]. Therefore, it is possible that these mutations were limited to pfetin-immunohistochemically-negative tumor cells that indeed failed to express pfetin. Furthermore, pfetin switching by epigenetic regulation of KCTD12 may contribute to the level of overall pfetin expression.
It has been shown previously that approximately two-thirds of GISTs with KIT/PDGFRA mutations show either monosomy 14 or partial loss of chromosome 14q [22–24]. At the same time, tumor suppressor genes that are important in early GIST development are thought to be located within this region [23, 25]. A loss of the long arm of chromosome 22 is observed in approximately half of all GIST cases and is associated with the progression to borderline/malignant GIST [23, 26–28]. In contrast, a loss of the long arm of chromosome 13, where KCTD12 is located, is seldom reported [25, 26, 28–30]. To elucidate associations between KCTD12 mutations and KIT expression, we performed clinicopathological analyses using KCTD12/pfetin (mutation and protein expression), KIT (protein expression and genotype) and the other pathological factors. With respect to pfetin expression, pfetin expression showed no statistically significant associations with KIT expression level (+ vs 2+/3+) (p = 1.000), KIT genotype (p = 0.706) and risk classification (p = 0.651) (Supplementary Table 2). Only higher mitotic index (>5/50HPFs) was associated with decreased pfetin expression (p = 0.029). Regarding KCTD12 mutation, we found no statistically significant associations (KIT expression level (p = 0.608), KIT genotype (p = 0.918), Mitosis index (p = 0.789), size (P = 0.685), necrosis (p = 0.666) and risk classification (p = 0.084)) (Supplementary Table 3). In addition, our findings suggest that decreased pfetin expression in GIST is not associated with the putative loss of function caused by genetic alterations, because there was no correlation between KCTD12 mutation and decreased pfetin expression.
To elucidate the tumor suppressor function of pfetin and possible regulatory mechanisms of KCTD12 in GIST further, we employed RNA interference in cultures of GIST T1 cells. As expected, the cell proliferation rates increased following KCTD12 knockdown in GIST T1 cells, pointing to a possible mechanism, by which pfetin expression confers a favorable patient prognosis in GIST. This finding is consistent with clinicopathological correlation between loss of pfetin expression and higher proliferative activity in our series of GISTs. Furthermore, knockdown of KIT drastically decreased cell proliferation, confirming the central role for KIT in the tumorigenesis of GISTs. GISTs usually present as macroscopically well-circumscribed tumors, although vascular, but not lymphatic, invasions are observed in a subset of cases [31]. The vascular invasion observed in these tumors is associated with liver metastasis and has an adverse prognostic impact for GIST patients [31]. In the present study, we did not observe a clear relationship between pfetin expression and GIST invasiveness. However, it would be too early to conclude that pfetin is not involved in the tumor invasion process. Type III collagen is the main component of collagen in the vascular wall, whereas the invasion assay employed in this study measures the activity of matrix metalloproteinase-2 and matrix metalloproteinase -9, which mainly target type IV collagen predominantly expressed in the basal membrane.
The KIT mutations that lead to overexpression of the protein are “driver mutations” in GISTs. Nonetheless, proteomic analysis revealed that pfetin expression is a strong prognostic factor for GISTs. However, the relationship between expression levels of these two proteins remains unknown. Notably, knockdown of KIT, which decreased the cell proliferating rate in the GIST T1 cell line, upregulated pfetin expression at both the mRNA and protein level, suggesting that KCTD12 expression is negatively influenced by KIT. These findings led us to hypothesize that high expression of pfetin in GIST clinical samples might be indicative of lower expression levels of KIT. In translocation sarcomas, such as Ewing’s sarcoma and synovial sarcoma, in which the chimeric fusion protein genes are thought to be oncogenes that play a central role in tumorigenesis, it has been shown that knockdown of those fusion genes decreased cell proliferation and induced apoptosis [32–34]. In GISTs, KIT may have the same function as the chimeric fusion proteins in these tumors. Pfetin expression in GIST may be indicative of lower KIT expression levels, and thus, could be considered a useful prognostic marker. However, because gene expression changes associated with KIT knock down would be stronger, a possibility remains that pfetin upregulation would simply be reflecting this global effect.
Finally, knockdown of KCTD12, which increased the cell proliferation rate in GIST T1 cells, reduced KIT expression at both the mRNA and protein level. These paradoxical relationships are currently difficult to explain. However, it is possible that these two proteins might collectively control the malignant potential of GISTs by regulating the cell proliferating rate in such a way that excessive GIST growth is limited, and GIST cells are prevented from excessive cell death and apoptosis.
In summary, pfetin functions as a tumor suppressor in GISTs, potentially by affecting the rate of cell proliferation. Pfetin expression in GIST is regulated by KIT and higher expression of pfetin was found to be indicative of lower KIT expression levels. Because KIT has a central role in GIST tumorigenesis, the expression level of pfetin is a promising prognostic marker.
MATERIALS AND METHODS
Patients
In total, 76 patient reports of primary GISTs were obtained from the files of the Department of Human Pathology, Juntendo University Hospital, Tokyo, Japan. These consecutive patients had been treated at the Juntendo University Hospital in the period between 2000 and 2010. With one exception, all patients were successfully treated surgically and were not given adjuvant treatments, such as imatinib mesylate before surgery. In the case 26, only a partial resection was performed due to large tumor size. Diagnosis was based on the WHO classification system for soft-tissue tumors [35]. In addition, diagnosis of GIST was confirmed by the immunohistochemical analysis with antibodies against the following proteins: c-kit (CD117 antibody, DAKO Japan Corp., Tokyo, Japan), CD34 (QBEnd/10, Leica Biosystems, New Castle, UK), DOG1 (K9, Leica Biosystems, New Castle, UK), and SDHB (21A11AE7, Abcam, Cambridge, UK). We used the following parameters for the risk classification: tumor site, tumor size, presence of necrosis, and mitotic rate [36]. Clinicopathological data of the 76 patient cases of GISTs are summarized in Supplementary Table 6. The institutional review board of Juntendo University hospital approved this study (permission No. 2012118). All experiments were performed in accordance with relevant guidelines and regulations. The methods were carried out in “accordance” with the approved guidelines. Written informed consent was obtained from all subjects.
Mutational analysis of the KCTD12 gene
Genomic DNA was extracted from each formalin-fixed paraffin-embedded (FFPE) tumor tissue-containing block. The primary tumor samples were selected for the aforementioned immunohistochemical and mutation analysis, where it was possible. Mutational analysis was performed for the entire region of the open reading frame of KCTD12 in all 76 cases. We used the GeneRead DNA FFPE Kit (Qiagen) for DNA extraction to minimize the artificial effects derived from FFPE samples. In addition, when the mutations were detected, we confirmed the reproducibility of the results by second PCR amplification and sequencing. Furthermore, for the cases in which KCTD12 mutations were detected, genomic DNA was also extracted from the corresponding non-tumor tissue surrounding the tumor in order to investigate whether these mutations were somatic. Primer sequences used in this study are described in Supplementary Table 5.
Immunohistochemical analysis
Pfetin and KIT expression was examined immunohistochemically using paraffin-embedded tissues as described previously [6]. Briefly, tissue sections (4-mm thick) were autoclaved in a 10 mM citrate buffer (pH 6.0) at 121° C for 30 min and then incubated with our self-designed No. 10-4 anti-pfetin antibody (1:1000 dilution) [7] and anti-c-kit antibody (CD117 antibody, DAKO Japan Corp., Tokyo, Japan. 1:200 dilution). Immunostaining was performed according to the universal immunoperoxidase polymer method using Envision+ system-HRP (DAKO, Glostrup, Denmark). Two of the authors (T.O. and T.S.) examined the stained tissues and were blind to the clinical data. Any discrepancies were resolved by re-evaluation to reach a consensus. Regarding pfetin expression, as in our previous report [6], tumor cells were classified as stained if the pfetin staining intensity was higher than that of the vascular endothelial cells that served as an internal positive control in the same tissue section. Samples in which >20% of tumor cells were stained were considered to be pfetin-positive. Regarding the evaluation of c-kit expression level, focal/weak expression was scored as +; diffuse/weak expression as 2+; diffuse/strong expression as 3+.
Knockdown of KCTD12 and KIT in the GIST T1 cell line
To evaluate the function of endogenous pfetin and its possible cooperative action with KIT in GIST, we performed RNA interference experiments using siRNA duplexes against KCTD12 and KIT. The GIST T1 cell line was kindly provided by Dr. T. Taguchi [37]. This cell line has a 57-bp deletion in exon 11 of KIT [37] and we confirmed the authenticity of this T1 cell line with 57-bp deletion. Briefly, 24 h before transfection, cells at 80% confluence were trypsinized and diluted with fresh medium without antibiotics to a concentration of 3 × 10⁵ cells/mL and then were transferred into either 6-well plates (2.5 mL/well) or a 96-well plate (0.1 mL/well). Transfection with 2 different siRNAs for each target: KIT (SASI_Hs01_00088058, SASI_Hs01_00088060, Sigma-Aldrich, MO, USA), KCTD12 (SASI_Hs01_00206464, SASI_Hs01_00206465, Sigma-Aldrich), and a scrambled siRNA as a negative control (Sigma-Aldrich) was carried out using Lipofectamine™ RNAiMAX reagent (Invitrogen, CA, USA) and 30 pmol of each siRNA duplex. Cells were harvested at 24, 48, 72, and 96 h after transfection and then analyzed by western blotting and the proliferation assay.
RNA extraction and real-time PCR
Total RNA was extracted from cell pellets using TRIzol Reagent (Gibco/BRL, Tokyo, Japan) according to the manufacturer’s protocol. Five micrograms of RNA of each sample were used for the subsequent reverse transcription reaction (SuperScriptII) (Thermo Fisher Scientific, CA, USA). A semi-quantitative PCR was performed for KIT and KCTD12 using a StepOne Real-Time PCR System (Applied Biosystems, CA, USA) and the predeveloped TaqMan assay reagents for KIT (Hs00174029_m1, Applied Biosystems CA, USA) and KCTD12 (Hs00540818_s1, Applied Biosystems CA, USA). Human TBP was used as an endogenous control (Human TBP Endogenous Control, 4333769F, Applied Biosystems CA, USA). The comparative CT (ΔΔCT) method was used for the semi-quantification of the PCR samples. The mRNA expression levels were normalized to that of the control sample after normalization by TBP at each time point.
Mutation analysis of the KIT
Genomic DNA was extracted from each of the XX formalin-fixed and paraffin-embedded GIST samples. Mutation analysis of KIT was performed from exons 9, 11, 13, and 17 by PCR and direct sequencing. PCR cycle conditions were as follows: 94° C for 2 min followed by 40 cycles of 94° C for 30 s, 55° C for 30 s, and 72° C for 30 s, and a final hold at 72° C for 2 min. The primer sequences used are listed in Supplementary Table 5.
Cell proliferation assay
Cell counting at each time point was performed in triplicate using Cell Counting Kit-8 (Dojindo, Tokyo, Japan) according to the manufacturer’s protocol.
Invasion assay
The invasion assays were performed using 24-well BD BioCoat Matrigel Invasion Chambers (BD Biosciences, NY, USA) according to the manufacturer’s protocol. T1 cell suspensions were prepared at a density of 3 × 10⁵ cells/mL in 0.5 mL of the serum-free medium and added to the gel chamber insert. In 48 h after transfection with KCTD12 siRNA, non-invading cells were removed with cotton swabs, invading cells were stained using Diff-Quick reagent (Sysmex, Hyogo Prefecture, Japan), and then the number of invading cells was counted.
Microarray analysis
cDNA microarray analysis (Affymetrix GeneChip Human Genome U133 Plus 2.0 Array) was also performed to examine the global gene expression changes caused by the knockdown of KIT and KCTD12 by using total RNA extracted 72 h after siRNA transfection. Lists of genes commonly up- or downregulated by the two different siRNAs were made for KIT and KCTD12, respectively. The gene ontology (GO) analysis was performed to evaluate the gene expression changes by each functional category.
Western blot
Western blotting was performed after preparation of cell lysates in the radioimmunoprecipitation assay buffer. Nitrocellulose membranes were pre-incubated with 5% non-fat dry milk in Tris-buffered saline and Tween 20 (TBS-T) before their incubation with specific primary antibodies for 2 h. Bound molecules were visualized with horseradish peroxidase-conjugated anti-mouse or anti-rabbit secondary antibodies and enhanced chemiluminescence (Amersham Biosciences, Buckinghamshire, UK). We used primary antibodies against the following proteins: c-kit (sc-168, 1:500, Santa Cruz Biotechnology, Inc., TX, USA), KCTD12 (sc-84335, 1:500, Santa Cruz Biotechnology, Inc.), GAPDH (sc-32233, 1:1000, Santa Cruz Biotechnology, Inc.).
Statistical analysis
The chi-square test (χ2) was used to establish an association between the presence of any KCTD12 genetic mutation and corresponding protein expression. The impact of the KCTD12 mutation and pfetin expression on the disease-free or overall survival was calculated using the Kaplan–Meier analysis with the log-rank test. The Mann–Whitney U-test was used to assess the relationship between the expression levels of KCTD12 and KIT.
Author contributions
YS, TO, KK, and TS were involved in developing the concept and design of this study. TO, MT, TH, YK and TS were responsible for the mutation analysis and interpretation of the data. K Mitani performed immunohistochemical staining for pfetin. TO, HM, DK, TY and TS were responsible for immunohistochemical scoring. KA, K Mukaihara, AKA, MTI, YT, and DK performed experiments with siRNA in the cultured cell line. TO, YS, TS, and TY wrote the manuscript. KM performed microarray analysis. KK provided critical comments on the text of the manuscript. All authors have read, commented on, and approved the final version of the manuscript.
ACKNOWLEDGMENTS AND FUNDING
We thank Dr. Masahiro Gotoh (Division of Molecular Pathology, National Cancer Center Research Institute) for providing a monoclonal antibody against pfetin. This work was supported, in part, by Grants-in-Aid for General Scientific Research from the Ministry of Education, Science, Sports, and Culture (#15H04964 to Yoshiyuki Suehara, #17K08704 to Takashi Yao, and #17K08730 to Tsuyoshi Saito), Tokyo, Japan. This study was financially supported in part through grants from the Practical Research for Innovative Cancer Control under Grant Number JP18am0001009 and JP18ck0106252 from the Japan Agency for Medical Research and Development, AMED.
CONFLICTS OF INTEREST
None.
REFERENCES
1. Joensuu H, Kindblom LG. Gastrointestinal stromal tumors-a review. Acta Orthop Scand Suppl. 2004; 75:62–71.
2. Miettinen M, El-Rifai W, H L Sobin L, Lasota J. Evaluation of malignancy and prognosis of gastrointestinal stromal tumors: a review. Hum Pathol. 2002; 33:478–83.
3. Corless CL, Fletcher JA, Heinrich MC. Biology of Gastrointestinal Stromal Tumors. J Clin Oncol. 2004; 22:3813–25.
4. Metz M, Gassmann M, Fakler B, Schaeren-Wiemers N, Bettler B. Distribution of the auxiliary GABAB receptor subunits KCTD8, 12, 12b, and 16 in the mouse brain. J Comp Neurol. 2011; 519:1435–54.
5. Schwenk J, Metz M, Zolles G, Turecek R, Fritzius T, Bildl W, Tarusawa E, Kulik A, Unger A, Ivankova K, Seddik R, Tiao JY, Rajalu M, et al. Native GABA (B) receptors are heteromultimers with a family of auxiliary subunits. Nature. 2010; 465:231–5.
6. Suehara Y, Kondo T, Seki K, Shibata T, Fujii K, Gotoh M, Hasegawa T, Shimada Y, Sasako M, Shimoda T, Kurosawa H, Beppu Y, Kawai A, et al. Pfetin as a prognostic biomarker of gastrointestinal stromal tumors revealed by proteomics. Clin Cancer Res. 2008; 14:1707–17.
7. Kikuta K, Gotoh M, Kanda T, Tochigi N, Shimoda T, Hasegawa T, Katai H, Shimada Y, Suehara Y, Kawai A, Hirohashi S, Kondo T. Pfetin as a prognostic biomarker in gastrointestinal stromal tumor: novel monoclonal antibody and external validation study in multiple clinical facilities. Jpn J Clin Oncol. 2010; 40:60–72.
8. Kubota D, Orita H, Yoshida A, Gotoh M, Kanda T, Tsuda H, Hasegawa T, Katai H, Shimada Y, Kaneko K, Kawai A, Kondo T. Pfetin as a prognostic biomarker for gastrointestinal stromal tumor: validation study in multiple clinical facilities. Jpn J Clin Oncol. 2011; 41:1194–202.
9. Kubota D, Okubo T, Saito T, Suehara Y, Yoshida A, Kikuta K, Tsuda H, Katai H, Shimada Y, Kaneko K, Kawai A, Kondo T. Validation Study on Pfetin and ATP-dependent RNA Helicase DDX39 as Prognostic Biomarkers in Gastrointestinal Stromal Tumour. Jpn J Clin Oncol. 2012; 42:730–41.
10. Rubin SC. BRCA-related ovarian carcinoma: Another piece of the puzzle. Cancer. 2003; 97:2127–9.
11. Rubin SC, Benjamin I, Behbakht K, Takahashi H, Morgan MA, LiVolsi VA, Berchuck A, Muto MG, Garber JE, Weber BL, Lynch HT, Boyd J. Clinical and pathological features of ovarian cancer in women with germ-line mutations of BRCA1. N Engl J Med. 1996; 335:1413–6.
12. Minde DP, Anvarian Z, Rüdiger SG, Maurice MM. Messing up disorder: how do missense mutations in the tumor suppressor protein APC lead to cancer? Mol Cancer. 2011; 10:101.
13. Safra T, Borgato L, Nicoletto MO, Rolnitzky L, Pelles-Avraham S, Geva R, Donach ME, Curtin J, Novetsky A, Grenader T, Lai WC, Gabizon A, Boyd L, et al. BRCA mutation status and determinant of outcome in women with recurrent epithelial ovarian cancer treated with pegylated liposomal doxorubicin. Mol Cancer Ther. 2011; 10:2000–7.
14. Foulkes WD. BRCA1 and BRCA2: chemosensitivity, treatment outcomes and prognosis. Fam Cancer. 2006; 5:135–42.
15. Quaresima B, Faniello MC, Baudi F, Crugliano T, Di Sanzo M, Cuda G, Costanzo F, Venuta S. Missense mutations of BRCA1 gene affect the binding with p53 both in vitro and in vivo. Oncol Rep. 2006; 16:811–5.
16. Aoki K, Taketo MM. Adenomatous polyposis coli (APC): a multi-functional tumor suppressor gene. J Cell Sci. 2007; 120:3327–35.
17. Bell D, Berchuck A, Birrer M, Chien J, Cramer DW, Dao F, Dhir R, DiSaia P, Gabra H, Glenn P, Godwin AK, Gross J, Hartmann L, et al, and Cancer Genome Atlas Research Network. Integrated genomic analyses of ovarian carcinoma. Nature. 2011; 474:609–15. https://doi.org/10.1038/nature10166.
18. Taylor RW, Qi JY, Talaga AK, Ma TP, Pan L, Bartholomew CR, Klionsky DJ, Moens CB, Gamse JT. Asymmetric inhibition of Ulk2 causes left-right differences in habenular neuropil formation. J Neurosci. 2011; 31:9869–78.
19. Liegl-Atzwanger B, Fletcher JA, Fletcher CDM. Gastrointestinal stromal tumors. Virchows Arch. 2010; 456:111–127.
20. Vogelstein B, Kinzler KW. p53 function and dysfunction. Cell. 1992; 70:523–6.
21. Takeichi M. Cadherin cell adhesion receptors as a morphogenetic regulator. Science. 1991; 251:1451–5.
22. Heinrich MC, Corless CL, Duensing A, McGreevey L, Chen CJ, Joseph N, Singer S, Griffith DJ, Haley A, Town A, Demetri GD, Fletcher CD, Fletcher JA. PDGFRA activating mutations in gastrointestinal stromal tumors. Science. 2003; 299:708–10.
23. Debiec-Rychter M, Lasota J, Sarlomo-Rikala M, Kordek R, Miettinen M. Chromosomal aberrations in malignant gastrointestinal stromal tumors: correlation with c-KIT gene mutation. Cancer Genet Cytogenet. 2001; 128:24–30.
24. Fukasawa T, Chong JM, Sakurai S, Koshiishi N, Ikeno R, Tanaka A, Matsumoto Y, Hayashi Y, Koike M, Fukayama M. Allelic loss of 14q and 22q, NF2 mutation, and genetic instability occur independently of c-kit mutation in gastrointestinal stromal tumor. Jpn J Cancer Res. 2000; 91:1241–9.
25. el-Rifai W, Sarlomo-Rikala M, Miettinen M, Knuutila S, Andersson LC. DNA copy number losses in chromosome 14: an early change in gastrointestinal stromal tumors. Cancer Res. 1996; 56:3230–3.
26. Bergmann F, Gunawan B, Hermanns B, Höer J, Schumpelick V, Füzesi L. Cytogenetic and morphologic characteristics of gastrointestinal stromal tumors. Recurrent rearrangement of chromosome 1 and losses of chromosomes 14 and 22 as common anomalies. Verh Dtsch Ges Pathol. 1998; 82:275–8.
27. Kim NG, Kim JJ, Ahn JY, Seong CM, Noh SH, Kim CB, Min JS, Kim H. Putative chromosomal deletions on 9P, 9Q and 22Q occur preferentially in malignant gastrointestinal stromal tumors. Int J Cancer. 2000; 85:633–8.
28. Lasota J, vel Dobosz AJ, Wasag B, Wozniak A, Kraszewska E, Michej W, Ptaszynski K, Rutkowski P, Sarlomo-Rikala M, Steigen SE, Schneider-Stock R, Stachura J, Chosia M, et al. Presence of homozygous KIT exon 11 mutations is strongly associated with malignant clinical behavior in gastrointestinal stromal tumors. Lab Invest. 2007; 87:1029–41.
29. El-Rifai W, Sarlomo-Rikala M, Andersson LC, Miettinen M, Knuutila S. High-resolution deletion mapping of chromosome 14 in stromal tumors of the gastrointestinal tract suggests two distinct tumor suppressor loci. Genes Chromosomes Cancer. 2000; 27:387–91.
30. Schurr P, Wolter S, Kaifi J, Reichelt U, Kleinhans H, Wachowiak R, Yekebas E, Strate T, Kalinin V, Simon R, Sauter G, Schaefer H, Izbicki J. Microsatellite DNA alterations of gastrointestinal stromal tumors are predictive for outcome. Clin Cancer Res. 2006; 12:5151–7.
31. Yamamoto H, Kojima A, Miyasaka Y, Imamura M, Nakamura N, Yao T, Tsuneyoshi M, Oda Y. Prognostic impact of blood vessel invasion in gastrointestinal stromal tumor of the stomach. Hum Pathol. 2010; 41:1422–3.
32. Tanaka K, Iwakuma T, Harimaya K, Sato H, Iwamoto Y. EWS-Fli1 antisense oligodeoxynucleotide inhibits proliferation of human Ewing’s sarcoma and primitive neuroectodermal tumor cells. J Clin Invest. 1997; 99:239–47.
33. Hu-Lieskovan S, Heidel JD, Bartlett DW, Davis ME, Triche TJ. Sequence-specific knockdown of EWS-FLI1 by targeted, nonviral delivery of small interfering RNA inhibits tumor growth in a murine model of metastatic Ewing’s sarcoma. Cancer Res. 2005; 65:8984–92.
34. Xie Y, Skytting B, Nilsson G, Gasbarri A, Haslam K, Bartolazzi A, Brodin B, Mandahl N, Larsson O. SYT-SSX is critical for cyclin D1 expression in synovial sarcoma cells: a gain of function of the t(X;18)(p11.2;q11.2) translocation. Cancer Res. 2002; 62:3861–7.
35. Fletcher CD, Bridge JA, Hogendoorn PC, Mertens F. WHO Classification of Tumours of Soft Tissue and Bone. Lyon: International Agency for Research on Cancer. 2013.
36. Joensuu H. Risk stratification of patients diagnosed with gastrointestinal stromal tumor. Hum Pathol. 2008; 39:1411–1419.
37. Taguchi T, Sonobe H, Toyonaga S, Yamasaki I, Shuin T, Takano A, Araki K, Akimaru K, Yuri K. Conventional and molecular cytogenetic characterization of a new human cell line, GIST-T1, established from gastrointestinal stromal tumor. Lab Invest. 2002; 82:663–5.