
INTRODUCTION
Breast cancer is the most common cancer in women, with over 1.7 million cases diagnosed worldwide in 2012 [1]. The female sex hormone, oestrogen (17β-oestradiol; E2), has an important role in breast cancer development and progression, with effects mediated through nuclear oestrogen receptors (ERα and ERβ) which act directly as transcription factors to regulate the expression of genes able to alter cell survival and growth.
G protein-coupled oestrogen receptor 1 (GPER) or G protein-coupled receptor 30 (GPR30) is a G protein-coupled receptor first cloned in 1996 [2] and first described in breast cancer in the ER positive MCF-7 cell line [3]. GPER has a potential role in breast cancer although controversies exist over its subcellular localisation, and mechanism of receptor activation [4–6]. GPER has been shown to bind E2 to initiate short term, non-genomic, signalling events both in vitro [7–9] and in vivo [10]. Expression of GPER has also been shown to be associated with ER expression and status in a number of studies [11] and to attenuate the growth of ER positive breast cancer [11]. Tamoxifen has been shown to act as a GPER agonist, and GPER has been implicated in tamoxifen resistance via its upregulation in a tamoxifen resistant breast cancer cell line which results in the activation of epidermal growth factor receptor (EGFR) [12].
GPER activation upregulates interleukin-1 receptor-1 (IL1R1) expression on breast cancer cells and interleukin (IL)-1β expression on cancer associated fibroblasts in a signalling loop to encourage invasive features of breast cancer [13]. GPER also supresses migration and angiogenesis of ER negative triple negative breast cancer by inhibiting nuclear factor (NF)-κB/interleukin (IL)-6 signals [14].
GPER expression in breast cancer has been assessed in a number of studies; however, these have proved ambiguous. High GPER protein expression is associated with increased distant disease free survival in ER-positive lymph node negative disease [15], presence of metastasis [16] and adverse relapse free survival of patients treated with tamoxifen [17]. GPER mRNA expression is significantly lower in tumour tissue in comparison to normal tissue, indicating that GPER acts as a tumour suppressor [18, 19]. Recently, a large assessment of GPER mRNA expression in 781 primary breast tumours demonstrated that high GPER expression is associated with favourable overall survival and that GPER silencing may be due to hyper-methylation of the flanking regions of the upstream CpG island [19]. However a smaller study of 167 breast cancer patients showed no association between mRNA expression and patient survival [20].
This study sought to investigate the expression levels of GPER mRNA and protein in large well characterised cohorts of breast cancer patients and assess for association with survival.
RESULTS
GPER protein staining location and frequency
GPER expression was observed in both the nucleus and the cytoplasm of tumour cells. Staining varied from weak to intense, with heterogeneity observed between adjacent tumour cells. Representative photomicrographs are shown in Figure 1. Cytoplasmic GPER expression had a median H-score of 10 and ranged from 0-290. Nuclear GPER expression had a median score of 0 and ranged from 0-100. X-tile was used to generate cut points for assessment based on breast cancer specific survival with a cut point of 25 for cytoplasmic GPER expression with 73.6% of cases (916/1244) demonstrating low expression; nuclear GPER expression had a cut point of 5 with 70.0% of cases (869/1241) demonstrating low expression. A proportion of cores within the tissue microarray could not be assessed as they were missing or cores had insufficient tumour cells.
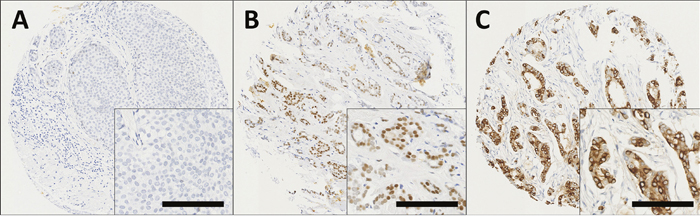
Figure 1: Representative photomicrographs following immunohistochemical staining of (A) negative nuclear and cytoplasmic GPER staining; (B) positive nuclear staining; (C) positive cytoplasmic staining in breast cancer specimens. Photomicrographs are shown at 100x magnification with 200x magnification inset box where the scale bar represents 100μm.
Relationship between GPER protein expression and clinicopathological variables
High nuclear GPER expression was significantly associated with smaller tumours (χ2=22.5; d.f.=1; P<0.001), lower tumour grade (χ2=23.6; d.f.=2; P<0.001), lower NPI value (χ2=22.0; d.f.=2; P<0.001), ER positive tumours (χ2=4.8; d.f.=1; P=0.029); and with tumour stage (χ2=7.5; d.f.=2; P=0.024) (Table 1). No significant associations between cytoplasmic GPER expression and clinicopathological variables were observed (Table 1).
Table 1: Associations between the expression of cytoplasmic and nuclear GPER determined by immunohistochemistry with clinicopathological variables
Cytoplasmic GPER |
Nuclear GPER |
||||||
|---|---|---|---|---|---|---|---|
low |
high |
P value |
low |
high |
P value |
||
Patient age |
40 years or less |
86 (6.9%) |
30 (2.4%) |
0.893 |
87 (7.0%) |
29 (2.3%) |
0.224 |
Above 40 years |
829 (66.7%) |
298 (24.0%) |
782 (63.1%) |
342 (27.6%) |
|||
Tumour size |
2cm or less |
538 (43.5%) |
203 (16.4%) |
0.349 |
480 (38.9) |
259 (21.0%) |
<0.001 |
Greater than 2cm |
372 (30.1%) |
124 (10.0%) |
384 (31.1%) |
111 (9.0%) |
|||
Tumour stage |
1 |
559 (45.2%) |
195 (15.8%) |
0.608 |
516 (41.8%) |
235 (19.0%) |
0.024 |
2 |
267 (21.6%) |
105 (8.5%) |
279 (22.6%) |
94 (7.6%) |
|||
3 |
84 (6.8%) |
27 (2.2%) |
69 (5.6%) |
41 (3.3%) |
|||
Tumour grade |
1 |
135 (10.9%) |
64 (5.2%) |
0.131 |
116 (9.4%) |
83 (6.7%) |
<0.001 |
2 |
308 (24.9%) |
107 (8.6%) |
278 (22.5%) |
135 (10.9%) |
|||
3 |
467 (37.8%) |
156 (12.6%) |
470 (38.1%) |
152 (12.3%) |
|||
NPI |
less than 3.4 |
262 (21.2%) |
106 (8.6%) |
0.336 |
223 (18.1%) |
144 (11.7%) |
<0.001 |
3.4-5.4 |
469 (14.3%) |
636 (51.5%) |
465 (37.7%) |
169 (13.7%) |
|||
Greater than 5.4 |
177 (14.3%) |
231 (18.7%) |
175 (14.2%) |
56 (4.5%) |
|||
Basal status |
Non basal |
668 (57.6%) |
244 (21.1%) |
0.807 |
646 (55.8%) |
264 (22.8%) |
0.868 |
Basal |
179 (15.4%) |
68 (5.9%) |
174 (15.0%) |
73 (6.3%) |
|||
ER status |
Negative |
233 (19.4%) |
94 (7.8%) |
0.229 |
244 (20.3%) |
82 (6.8%) |
0.029 |
Positive |
655 (54.4%) |
222 (18.4%) |
598 (49.8%) |
277 (23.1%) |
|||
PgR status |
Negative |
373 (31.8%) |
135 (11.5%) |
0.979 |
369 (31.5%) |
139 (11.9%) |
0.218 |
Positive |
488 (41.6%) |
176 (15.0%) |
459 (39.2%) |
203 (17.4%) |
|||
HER2 status |
Negative |
771 (63.6%) |
276 (22.8%) |
0.805 |
725 (60.0%) |
320 (26.5%) |
0.105 |
Positive |
120 (9.9%) |
45 (3.7%) |
124 (10.3%) |
40 (29.8%) |
|||
The P values are resultant from Pearson χ2 test of association. ER is oestrogen receptor and PgR is progesterone receptor.
Association between GPER protein expression and survival
Low expression of cytoplasmic GPER was significantly associated with adverse breast cancer-specific survival (P=0.002) (Figure 2A). In multivariate Cox regression cytoplasmic GPER expression remained significantly associated (P=0.023) with breast cancer survival when including the potential confounding factors of tumour size, tumour stage and grade, NPI value, ER, PgR and HER2 status and Lymph node status (with individual Kaplan–Meier statistics of P<0.001, P<0.001, P<0.001, P<0.001, P=0.002, P<0.001, P<0.001, P<0.001 respectively) (Table 2). Expression of GPER in the nucleus was not significantly associated with breast cancer specific-survival (P=0.067) (Figure 2B). In addition to disease specific survival, cytoplasmic expression of GPER was significantly associated with adverse relapse free interval (P=0.023), but not nuclear GPER expression (P=0.057) (Figure 3A and 3B).
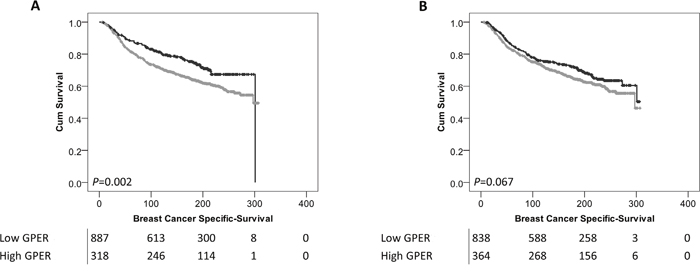
Figure 2: Kaplan-Meier analysis of breast cancer specific survival showing the impact of low (grey line) and high (black line) GPER protein expression within the cytoplasm (A) or the nucleus (B) with significance determined using the log-rank test. The numbers shown below the Kaplan-Meier survival curves are the number of patients at risk at the specified month.
Table 2: Cox proportional hazards analysis for overall survival for cytoplasmic GPER expression in breast cancer
P value |
Exp(B) |
95.0% CI for Exp(B) |
||
|---|---|---|---|---|
Lower |
Upper |
|||
Tumour size |
0.031 |
1.373 |
1.030 |
1.831 |
Tumour stage |
0.000 |
2.441 |
1.748 |
3.409 |
Tumour grade |
0.000 |
1.882 |
1.390 |
2.548 |
NPI |
0.984 |
1.004 |
0.658 |
1.533 |
ER status |
0.023 |
1.475 |
1.054 |
2.065 |
PgR status |
0.021 |
0.699 |
0.516 |
0.947 |
HER2 status |
0.000 |
1.845 |
1.392 |
2.444 |
Lymph node status |
0.081 |
0.701 |
0.471 |
1.045 |
Cytoplasmic GPER1 |
0.023 |
0.731 |
0.558 |
0.958 |
Exp(B) is used to denote hazard ratio and 95% CI is used to denote 95% confidence interval.
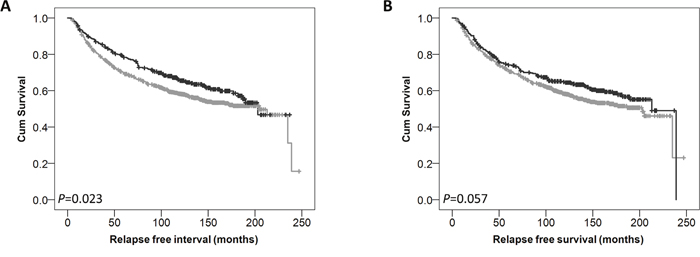
Figure 3: Kaplan-Meier analysis of relapse free survival showing the impact of low (grey line) and high (black line) GPER protein expression within the cytoplasm (A) or the nucleus (B) with significance determined using the log-rank test.
Interestingly, low expression of cytoplasmic GPER was significantly associated with adverse survival of patients who received endocrine therapy (P=0.003) (Figure 4B); whereas no association was observed in breast cancer-specific survival in patients who did not receive endocrine therapy (P=0.205) (Figure 4A). There was no difference observed in breast cancer specific survival of patients receiving endocrine therapy dependent upon nuclear GPER expression.
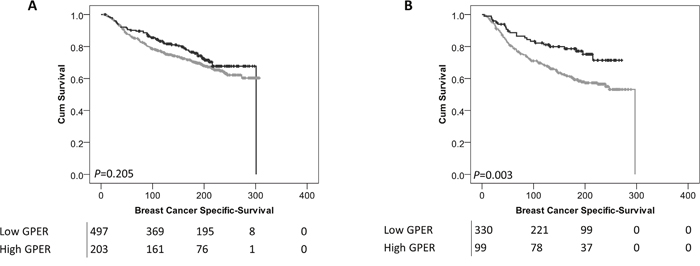
Figure 4: Kaplan-Meier analysis of breast cancer specific survival showing the impact of low (grey line) and high (black line) GPER protein expression within the cytoplasm in patients who did not receive endocrine therapy (A) or patients that did receive endocrine therapy (B) with significance determined using the log-rank test. The numbers shown below the Kaplan-Meier survival curves are the number of patients at risk at the specified month.
GPER mRNA expression and clinicopathological variables
Data was available for two GPER probes in the Molecular Taxonomy of Breast Cancer International Consortium (METABRIC) data set: probe 1 (ILMN_1795298) and probe 2 (ILMN_2384056). Both were assessed independently for associations with clinicopathological variables and patient survival (Table 3) and were categorised into low and high groups using X-tile. Both GPER probe 1 and probe 2 demonstrated that low GPER expression were associated with basal and HER2 PAM50 subtype (χ2=207.4; d.f.=4; P<0.001 and χ2=177.5; d.f.=4; P<0.001 respectively). Low GPER mRNA expression was associated with P53 mutation status (χ2=19.7; d.f.=1; P<0.001 and χ2=33.4; d.f.=1; P<0.001 for probe 1 and 2 respectively), stage (χ2=11.4; d.f.=4; P=0.023 and χ2=11.1; d.f.=4; P=0.025 for probe 1 and 2 respectively), larger tumour size (χ2=16.2; d.f.=1; P<0.001 and χ2=16.9; d.f.=1; P<0.001 for probe 1 and 2 respectively), higher tumour grade (χ2=83.0; d.f.=2; P<0.001 and χ2=87.3; d.f.=2; P<0.001 for probe 1 and 2 respectively) and ER negative tumours (χ2=119.1; d.f.=1; P<0.001 and χ2=130.3; d.f.=1; P<0.001 for probe 1 and 2 respectively).
Table 3: Associations between the GPER mRNA expressions in the METABRIC cohort with clinicopathological variables
GPER probe 1 |
GPER probe 2 |
||||||
|---|---|---|---|---|---|---|---|
low |
high |
P value |
low |
high |
P value |
||
PAM 50 subtype |
Basal |
208 (10.5%) |
123 (6.2%) |
<0.001 |
124 (6.3%) |
207 (10.5%) |
<0.001 |
HER2 |
183 (9.3%) |
56 (2.8%) |
100 (5.1%) |
139 (7.0%) |
|||
Luminal A |
241 (12.2%) |
472 (23.9%) |
78 (4.0%) |
637 (32.3%) |
|||
Luminal B |
220 (11.1%) |
270 (13.7%) |
117 (5.9%) |
372 (18.9%) |
|||
Normal |
49 (2.5%) |
150 (7.6%) |
15 (0.8%) |
184 (9.3%) |
|||
P53 mutation status |
Mutated |
65 (8.0%) |
34 (4.2%) |
<0.001 |
49 (6.0%) |
50 (6.1%) |
<0.001 |
Wild type |
301 (36.9%) |
416 (51.0%) |
161 (19.7%) |
557 (68.2%) |
|||
Stage |
0 |
234 (15.3%) |
256 (16.7%) |
0.023 |
113 (7.4%) |
376 (24.6%) |
0.025 |
1 |
141 (9.2%) |
229 (15.0%) |
64 (4.2%) |
307 (20.1%) |
|||
2 |
263 (17.2%) |
308 (40.1%) |
143 (9.3%) |
428 (28.0%) |
|||
3 |
42 (2.7%) |
48 (3.1%) |
19 (1.2%) |
71 (4.6%) |
|||
4 |
2 (0.1%) |
8 (0.5%) |
0 (0.0%) |
10 (0.7%) |
|||
Tumour size |
Less than 2cm |
242 (12.4) |
379 (19.4%) |
<0.001 |
102 (5.2%) |
521 (26.6%) |
<0.001 |
2cm or greater |
651 (33.2%) |
686 (35.0%) |
329 (16.8%) |
1007 (51.4%) |
|||
Tumour grade |
1 |
48 (2.5%) |
121 (6.4%) |
<0.001 |
16 (0.8%) |
153 (8.1%) |
<0.001 |
2 |
286 (15.1%) |
483 (25.6%) |
108 (5.7%) |
661 (35.0%) |
|||
3 |
532 (28.2%) |
419 (22.2%) |
294 (15.6%) |
658 (34.8%) |
|||
ER status |
Negative |
301 (15.6%) |
139 (7.2%) |
<0.001 |
184 (9.5%) |
256 (13.2%) |
<0.001 |
Positive |
582 (30.1%) |
913 (47.2%) |
242 (12.5%) |
1254 (64.8%) |
|||
The P values are resultant from Pearson χ2 test of association. ER is oestrogen receptor and PgR is progesterone receptor.
Association between GPER mRNA expression and patient survival
Low GPER probe 1 and probe 2 mRNA expression was significantly associated with adverse overall survival of the breast cancer cohort; (P=0.004) and (P=0.001) respectively (Figure 5A and 5B).
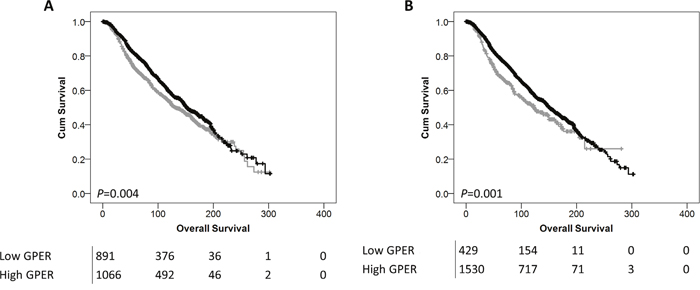
Figure 5: Kaplan-Meier analysis of overall survival showing the impact of low (grey line) and high (black line) GPER mRNA expression with probe 1 (A) or probe 2 (B) with significance determined using the log-rank test. The numbers shown below the Kaplan-Meier survival curves are the number of patients at risk at the specified month.
Comparison between GPER mRNA and protein expression
There were 194 tumours in this study that were assessed for GPER protein expression and for GPER mRNA expression as part of the METABRIC cohort. Cytoplasmic expression of GPER was not correlated with GPER probe 1 or probe 2 mRNA expression (P=0.824, R2=-0.016 and P=0.868, R2=0.012 respectively. Nuclear GPER expression was not correlated with GPER probe 1 mRNA expression (P=0.079, R2=-0.126), but was correlated with GPER probe 2 mRNA expression (P=0.024, R2=0.162).
Expression profiling
The gene expression data was analysed using an artificial neural network approach that uses a machine learning based data mining algorithm [21]. A rank order of all the genes was produced based on the minimum average root mean squared error. The top 200 transcripts were selected for GPER probe 1 and probe 2, and 84 common transcripts were identified. The top 20 unique transcripts include myomesin 1, ribosomal protein L39 like, vinexin beta and high density lipoprotein binding protein (Table 4). Some of these transcripts were assessed further using an ANOVA based approach to determine their relationship with GPER mRNA expression. A positive association was observed between both GPER probes and notch-4 (both P<0.001), jagged-1 (both P<0.001), claudin-5 (both P<0.001), CD34 (both P<0.001) and adenylate cyclase 4 (both P<0.001).
Table 4: The top 20 unique transcripts identified using artificial neural networks as associated with GPER mRNA expression in the METABRIC series
Illumina ID |
Gene |
Description |
Molecular class |
|
|---|---|---|---|---|
1 |
ILMN_1680344 |
MYOM1 |
Myomesin 1 |
Structural protein |
2 |
ILMN_2108357 |
RPL39L |
Ribosomal Protein L39 Like |
Ribosomal subunit |
3 |
ILMN_1789338 |
SORBS3 |
Vinexin beta |
Adhesion molecule |
4 |
ILMN_1726210 |
GPIHBP1 |
High density lipoprotein binding protein |
Unknown |
5 |
ILMN_2172269 |
TMEM183B |
Transmembrane protein 183B |
Transcription regulatory protein |
6 |
ILMN_1676897 |
HSPA12B |
Heat shock 70kDa protein 12B |
Heat shock protein |
7 |
ILMN_2317581 |
SHANK3 |
SH2 and multiple ankyrin repeat domains 3 |
Cytoskeletal associated protein |
8 |
ILMN_1752589 |
TMEM183A |
Chromosome 1 open reading frame 37 |
Unclassified |
9 |
ILMN_1728197 |
CLDN5 |
Claudin-5 |
Adhesion molecule |
10 |
ILMN_1711157 |
NOTCH4 |
Notch-4 |
Cell surface receptor |
11 |
ILMN_1672102 |
PTPRB |
Receptor type protein tyrosine phosphatase beta |
Receptor tyrosine phosphatase |
12 |
ILMN_1748206 |
C20orf160 |
C20orf160 protein |
Unclassified |
13 |
ILMN_1738742 |
PLAT |
Tissue type plasminogen activator |
Serine protease |
14 |
ILMN_1732799 |
CD34 |
CD34 |
Adhesion molecule |
15 |
ILMN_2148944 |
ADCY4 |
Adenylate cyclase 4 |
Adenylate cyclase |
16 |
ILMN_1681356 |
PDE2A |
Phosphodiesterase 2A, cGMP-stimulated |
Phosphodiesterase |
17 |
ILMN_1719236 |
CDH5 |
Cadherin-5 |
Adhesion molecule |
18 |
ILMN_1691376 |
JAG1 |
Jagged-1 |
Cell surface receptor |
19 |
ILMN_1707232 |
EBF3 |
Early B-cell factor 3 |
Transcription factor |
20 |
ILMN_1692340 |
ZNF662 |
FLJ45880 protein |
DNA binding protein |
DISCUSSION
In this study, we describe how GPER protein and mRNA expression levels at the time of surgery are associated with breast cancer patient survival and various clinicopathological variables. Low cytoplasmic GPER protein expression was significantly associated with adverse breast cancer specific survival (P=0.002) and remained so in multivariate analysis including various potentially confounding factors, such as ER status. GPER expression within the nucleus was not associated with patient survival. It would be interesting to hypothesise over the importance of non-genomic actions of GPER; however, this study assessed expression of GPER with no measure of its activity.
Previously published studies have investigated GPER expression in patient samples to show a number of associations with clinicopathological variables, however the results from these have not always been in agreement. One of the largest studies to date investigated 981 primary invasive breast carcinomas, including investigation of nuclear and cytoplasmic GPER staining and is in consensus with the current findings. This study demonstrated that low expression of GPER was significantly associated with adverse patient survival and that there was no association with nuclear GPER expression and patient survival; this could not be demonstrated in multivariate analysis and was not described in any patient subset [22]. No data for systemic therapy was available for the patient cohort, so this was not assessed. Other studies have also investigated GPER expression, including a study of 481 breast cancer patients split into two cohorts of pre and post-menopausal women, which showed that high GPER protein expression was associated with increased distant disease free survival of ER positive lymph node negative and stage II breast cancer, but did not assess associations with disease specific survival [15]. A study investigating 321 invasive and 40 intraductal breast tumours showed associations between GPER expression with tumour size and the presence of distant metastasis, but also did not assess for associations with disease specific survival [16]. Furthermore GPER has been assessed in 323 breast cancer patients with a validation cohort of 103 patients to show associations between GPER expression and lymph node status, and HER2 status; this study also demonstrated an association between high GPER expression and adverse relapse free survival but no association was observed for overall survival [17].
Interestingly, we were also able to demonstrate that low cytoplasmic GPER expression was associated with adverse survival in breast cancer patients treated with endocrine therapy, mainly in the adjuvant setting. This is in disagreement with a previous study that demonstrated that high GPER expression was associated with adverse relapse free survival of breast cancer patients treated with tamoxifen but did not describe associations with breast cancer specific survival [17].
Associations between GPER protein expression and HER2 status, amongst other clinicopathological variables, have been described in some studies, however; there was no association between cytoplasmic or nuclear GPER expression with HER2 in this study. A number of associations between clinicopathological variables and nuclear GPER expression were observed, but none when expression was assessed within the cytoplasm. It is unclear as to the function of nuclear GPER expression, there are limited reports of nuclear expression in vitro, with studies demonstrating concentration of GPER in a compartment in close proximity to the nucleus [23], and direct nuclear localisation in breast cancer associated fibroblasts driven by changes in N-linked glycosylation [24].
We also investigated the expression of GPER mRNA in the METABRIC cohort. Low GPER expression was significantly associated with adverse survival of breast cancer patients. Two probes representing GPER were identified and assessed, probe 1 (ILMN_1795298) and probe 2 (ILMN_2384056), both located in the 3’ untranslated region. GPER mRNA expression was associated with various clinicopathological variables, the strongest association being with PAM50 subtype, ER status and tumour grade.
Other studies investigating GPER mRNA expression in breast cancer have done so in comparison to normal mammary tissue to demonstrate lower staining in tumour tissue [25]. One of the largest studies to date reported GPER expression in 84 normal breast tissues and 781 primary breast tumours using TCGA RNAseq data accessed through the UCSC Cancer Genomics Browser; they demonstrated that GPER expression is lower in primary tumours than normal breast tissues and that higher GPER expression in breast cancer patients was associated with increased survival, which is in agreement with our findings [19].
We performed artificial neural network analysis of transcriptomic array data to identify genes strongly associated with GPER expression. Interestingly, some well investigated proteins associated with breast cancer were identified, including notch-4, jagged-1 and CD34. Furthermore; links between some of the genes identified as associated with GPER expression have previously been described. The use of a GPER agonists has been shown to increase the levels of claudin-5 in the ischemic CA1 in vivo [26] and also increased levels of CD34 in mouse xenograft models of breast cancer [27]. GPER has also been shown to be capable of stimulating adenylyl cyclase activity [28]. Although a direct link with notch-4 has not been described, GPER has been shown to engage notch-1 signaling to alter gene expression and cell migration in breast cancer in vitro [29].
In summary, we have been able to demonstrate that low GPER protein and mRNA expression is associated with adverse survival in a large cohort of breast cancer patients. These findings suggest that GPER may have prognostic potential and may have utility as a therapeutic target and warrant further investigation in multi-centre studies.
MATERIALS AND METHODS
Immunohistochemistry patient cohort
This study is reported according to reporting recommendations for tumour marker prognostic studies (REMARK) criteria [30]. Ethical approval for this study was granted by Nottingham Research Ethics Committee 2, under the title ‘Development of a molecular genetic classification of breast cancer’ (C202313). 1245 early stage invasive breast cancer patients treated at Nottingham University Hospitals between 1987 and 1998 were stained for GPER protein expression. All specimens have been handled according to The Royal College of Pathologists ‘Pathology reporting of breast disease in surgical excision specimens incorporating the dataset for histological reporting of breast cancer’, with specimens sent immediately to the pathological laboratory after surgical resection and pre-dissected/incised. If incision of the fresh specimen was not possible, it was immediately placed in an adequate volume of fixative, at least twice that of the specimen.
All patients were managed in a standard manner, where all patients underwent a mastectomy or wide local excision, as decided by disease characteristics or patient choice, followed by radiotherapy if indicated. Patients received systemic adjuvant treatment on the basis of Nottingham Prognostic index (NPI), ER, and menopausal status. Patients with an NPI score less than 3.4 did not receive adjuvant treatment and patients with an NPI score of 3.4 were candidates for CMF chemotherapy (cyclophosphamide, methotrexate and 5-fluorouracil) if they were ER negative or premenopausal; and hormonal therapy if they were ER positive. Breast cancer specific survival was calculated as the time interval between primary surgery and death resultant from breast cancer.
Median survival for the cohort was 204 months as estimated by the reverse Kaplan-Meier method. The median age for this cohort was 55 years, ranging from 24 to 72. In this cohort 16.1% of patients (199/1238) had grade one tumours, 33.6% (416/1238) had grade two tumours and 50.3% (623/1238) had grade three tumours. 60.9% of patients (754/1238) had stage one tumours, 30.1% of patients (373/1238) had stage two tumours and 9.0% of patients (111/1238) had stage 3 tumours. 72.9% of patients (878/1205) were ER positive, 56.7% of patients (665/1173) were progesterone receptor (PgR) positive and 13.6% (165/1213) of patients were HER2 positive. 58.2% (725/1245) were invasive ductal carcinomas, 17.3% (215/1245) were tubular mixed, 5.9% (74/1245) were classic lobular all other subcategories accounted for less than 5% of the studied cohort.
Immunohistochemistry
Immunohistochemistry was performed as previously described using a Novolink Polymer Detection kit (Leica) according to the manufacturers’ instructions [31]. In brief, slides were deparaffinised in xylene, followed by rehydration in ethanol and water. Antigen retrieval was performed in 0.01molL-1 sodium citrate buffer (pH6.0) in a microwave for 10 minutes at 750W and 10 minutes at 450W. Tissue was treated with peroxidase block, washed with Tris-buffered saline (TBS), and then treated with protein block solution. Rabbit polyclonal anti-GPER (Thermo Scientific (PA5-28647)) was used as primary antibody diluted 1:100 and was incubated on the tissue for one hour. Tissue was washed with TBS prior to the application of post primary solution, tissue was subsequently washed with TBS and then Novolink polymer solution was applied. Immunohistochemical reactions were developed using 3, 3’ diaminobenzidine as the chromogenic substrate and tissue was counterstained with haematoxylin. Tissue was dehydrated in ethanol and fixed in xylene. Positive and negative controls were included with each staining run and were comprised of breast tumour composite sections comprising grade 1 and 2 early stage invasive tumour; negative controls had primary antibody omitted from each staining run (Supplementary Figure).
Gene expression patient cohort
Details of the METABRIC data set (n=1980) data set have been published elsewhere [32]. For genomic and transcriptional profiling, DNA and RNA were isolated from samples and hybridised to the Affymetrix SNP 6.0 and Illumina HT-12 v3 platforms as described by Curtis et al (2012) [32]. In the METABRIC cohort ER positive and/or lymph node negative patients did not receive adjuvant chemotherapy; ER negative and/or lymph node positive patients received adjuvant chemotherapy.
Immunohistochemistry scoring and statistical analyses
Assessment of immunohistochemical staining was conducted at 200x magnification following high resolution scanning using a Nanozoomer Digital Pathology Scanner (Hamamatsu Photonics). Staining in the cytoplasm was assessed using a semi-quantitative immunohistochemical H score; where staining intensity was assessed as none (0), weak (1), medium (2) or strong (3) over the percentage area of each staining intensity. Nuclear staining was assessed as the percentage of nuclei with any percentage intensity of staining. Greater than 30% of cores were double assessed, with both assessors blinded to clinical outcome and each other’s scores. The single measure intraclass correlation coefficient were above 0.7, indicating good concordance between scorers.
Statistical analysis was performed using IBM SPSS Statistics (version 24). Data was stratified based on breast cancer specific survival using X-Tile software [33]. All differences were deemed statistically significant at the level of P<0.05. The Pearson χ2 test of association was used to determine the relationship between categorised protein expression and clinicopathological variables. Survival curves were plotted according to the Kaplan-Meier method with significance determined using the log-rank test. The primary endpoint of this study was to determine if GPER expression is associated with breast cancer specific survival.
Identification of genes associated with GPER expression
To further understand the molecular function of GPER in human breast cancer, the METABRIC series was analysed using a supervised artificial neural network. GPER expression was used as the supervising variable as described by Abdel-Fatah et al. [21]. The artificial neural network was conducted with multi-layer perceptron architecture and sigmoidal transfer function, where weights were updated by a back propagation algorithm. The top 200 genes associated with GPER mRNA expression for probe 1 and probe 2 were used for further analysis.
Author contributions
M.N.L, B.S and S.J.S completed the experiments; A.R.G, E.A.R and I.O.E provided samples and clinical information; S.G.M, G.B. and S.J.S performed statistical analysis; S.J.S conceived the study and wrote the manuscript; all authors reviewed the manuscript.
ACKNOWLEDGMENTS
We thank the Nottingham Health Science Biobank and Breast Cancer Now for the provision of tissue samples.
CONFLICTS OF INTEREST
The authors have no conflicts of interest to declare.
FUNDING
S.J.S is funded through the University of Nottingham’s Research Vision as a Nottingham Research Fellow, and previously through the University of Nottingham Life Cycle 6 Campaign.
REFERENCES
1. Ferlay J, Soerjomataram I, Dikshit R, Eser S, Mathers C, Rebelo M, Parkin DM, Forman D, Bray F. Cancer incidence and mortality worldwide: sources, methods and major patterns in GLOBOCAN 2012. Int J Cancer. 2015; 136:E359-386.
2. Owman C, Blay P, Nilsson C, Lolait SJ. Cloning of human cDNA encoding a novel heptahelix receptor expressed in Burkitt's lymphoma and widely distributed in brain and peripheral tissues. Biochem Biophys Res Commun. 1996; 228:285-292.
3. Carmeci C, Thompson DA, Ring HZ, Francke U, Weigel RJ. Identification of a gene (GPR30) with homology to the G-protein-coupled receptor superfamily associated with estrogen receptor expression in breast cancer. Genomics. 1997; 45:607-617.
4. Langer G, Bader B, Meoli L, Isensee J, Delbeck M, Noppinger PR, Otto C. A critical review of fundamental controversies in the field of GPR30 research. Steroids. 2010; 75:603-610.
5. Maggiolini M, Picard D. The unfolding stories of GPR30, a new membrane-bound estrogen receptor. J Endocrinol. 2010; 204:105-114.
6. Levin ER, Hammes SR. Nuclear receptors outside the nucleus: extranuclear signalling by steroid receptors. Nat Rev Mol Cell Biol. 2016; 17:783-797.
7. Revankar CM, Cimino DF, Sklar LA, Arterburn JB, Prossnitz ER. A transmembrane intracellular estrogen receptor mediates rapid cell signaling. Science. 2005; 307:1625-1630.
8. Thomas P, Pang Y, Filardo EJ, Dong J. Identity of an estrogen membrane receptor coupled to a G protein in human breast cancer cells. Endocrinology. 2005; 146:624-632.
9. Ge C, Yu M, Zhang C. G protein-coupled receptor 30 mediates estrogen-induced proliferation of primordial germ cells via EGFR/Akt/beta-catenin signaling pathway. Endocrinology. 2012; 153:3504-3516.
10. Martensson UE, Salehi SA, Windahl S, Gomez MF, Sward K, Daszkiewicz-Nilsson J, Wendt A, Andersson N, Hellstrand P, Grande PO, Owman C, Rosen CJ, Adamo ML, et al. Deletion of the G protein-coupled receptor 30 impairs glucose tolerance, reduces bone growth, increases blood pressure, and eliminates estradiol-stimulated insulin release in female mice. Endocrinology. 2009; 150:687-698.
11. Ariazi EA, Brailoiu E, Yerrum S, Shupp HA, Slifker MJ, Cunliffe HE, Black MA, Donato AL, Arterburn JB, Oprea TI, Prossnitz ER, Dun NJ, Jordan VC. The G protein-coupled receptor GPR30 inhibits proliferation of estrogen receptor-positive breast cancer cells. Cancer Res. 2010; 70:1184-1194.
12. Ignatov A, Ignatov T, Roessner A, Costa SD, Kalinski T. Role of GPR30 in the mechanisms of tamoxifen resistance in breast cancer MCF-7 cells. Breast Cancer Res Treat. 2010; 123:87-96.
13. De Marco P, Lappano R, De Francesco EM, Cirillo F, Pupo M, Avino S, Vivacqua A, Abonante S, Picard D, Maggiolini M. GPER signalling in both cancer-associated fibroblasts and breast cancer cells mediates a feedforward IL1beta/IL1R1 response. Sci Rep. 2016; 6:24354.
14. Liang S, Chen Z, Jiang G, Zhou Y, Liu Q, Su Q, Wei W, Du J, Wang H. Activation of GPER suppresses migration and angiogenesis of triple negative breast cancer via inhibition of NF-kappaB/IL-6 signals. Cancer Lett. 2017; 386:12-23.
15. Broselid S, Cheng B, Sjostrom M, Lovgren K, Klug-De Santiago HL, Belting M, Jirstrom K, Malmstrom P, Olde B, Bendahl PO, Hartman L, Ferno M, Leeb-Lundberg LM. G protein-coupled estrogen receptor is apoptotic and correlates with increased distant disease-free survival of estrogen receptor-positive breast cancer patients. Clin Cancer Res. 2013; 19:1681-1692.
16. Filardo EJ, Graeber CT, Quinn JA, Resnick MB, Giri D, DeLellis RA, Steinhoff MM, Sabo E. Distribution of GPR30, a seven membrane-spanning estrogen receptor, in primary breast cancer and its association with clinicopathologic determinants of tumor progression. Clin Cancer Res. 2006; 12:6359-6366.
17. Ignatov A, Ignatov T, Weissenborn C, Eggemann H, Bischoff J, Semczuk A, Roessner A, Costa SD, Kalinski T. G-protein-coupled estrogen receptor GPR30 and tamoxifen resistance in breast cancer. Breast Cancer Res Treat. 2011; 128:457-466.
18. Poola I, Abraham J, Liu A, Marshalleck JJ, Dewitty RL. The Cell Surface Estrogen Receptor, G Protein- Coupled Receptor 30 (GPR30), is Markedly Down Regulated During Breast Tumorigenesis. Breast Cancer (Auckl). 2008; 1:65-78.
19. Manjegowda MC, Gupta PS, Limaye AM. Hyper-methylation of the upstream CpG island shore is a likely mechanism of GPER1 silencing in breast cancer cells. Gene. 2017; 614:65-73.
20. Yang F, Shao ZM. Double-edged role of G protein-coupled estrogen receptor 1 in breast cancer prognosis: an analysis of 167 breast cancer samples and online data sets. Onco Targets Ther. 2016; 9:6407-6415.
21. Abdel-Fatah TMA, Agarwal D, Liu DX, Russell R, Rueda OM, Liu K, Xu B, Moseley PM, Green AR, Pockley AG, Rees RC, Caldas C, Ellis IO, et al. SPAG5 as a prognostic biomarker and chemotherapy sensitivity predictor in breast cancer: a retrospective, integrated genomic, transcriptomic, and protein analysis. Lancet Oncol. 2016; 17:1004-1018.
22. Samartzis EP, Noske A, Meisel A, Varga Z, Fink D, Imesch P. The G protein-coupled estrogen receptor (GPER) is expressed in two different subcellular localizations reflecting distinct tumor properties in breast cancer. PLoS One. 2014; 9:e83296.
23. Cheng SB, Quinn JA, Graeber CT, Filardo EJ. Down-modulation of the G-protein-coupled estrogen receptor, GPER, from the cell surface occurs via a trans-Golgi-proteasome pathway. J Biol Chem. 2011; 286:22441-22455.
24. Pupo M, Bodmer A, Berto M, Maggiolini M, Dietrich PY, Picard D. A genetic polymorphism repurposes the G-protein coupled and membrane-associated estrogen receptor GPER to a transcription factor-like molecule promoting paracrine signaling between stroma and breast carcinoma cells. Oncotarget. 2017; 8:46728-46744. https://doi.org/10.18632/oncotarget.18156.
25. Kuo WH, Chang LY, Liu DL, Hwa HL, Lin JJ, Lee PH, Chen CN, Lien HC, Yuan RH, Shun CT, Chang KJ, Hsieh FJ. The interactions between GPR30 and the major biomarkers in infiltrating ductal carcinoma of the breast in an Asian population. Taiwan J Obstet Gynecol. 2007; 46:135-145.
26. Lu D, Qu Y, Shi F, Feng D, Tao K, Gao G, He S, Zhao T. Activation of G protein-coupled estrogen receptor 1 (GPER-1) ameliorates blood-brain barrier permeability after global cerebral ischemia in ovariectomized rats. Biochem Biophys Res Commun. 2016; 477:209-214.
27. De Francesco EM, Pellegrino M, Santolla MF, Lappano R, Ricchio E, Abonante S, Maggiolini M. GPER mediates activation of HIF1alpha/VEGF signaling by estrogens. Cancer Res. 2014; 74:4053-4064.
28. Filardo EJ, Quinn JA, Frackelton AR Jr, Bland KI. Estrogen action via the G protein-coupled receptor, GPR30: stimulation of adenylyl cyclase and cAMP-mediated attenuation of the epidermal growth factor receptor-to-MAPK signaling axis. Mol Endocrinol. 2002; 16:70-84.
29. Pupo M, Pisano A, Abonante S, Maggiolini M, Musti AM. GPER activates Notch signaling in breast cancer cells and cancer-associated fibroblasts (CAFs). Int J Biochem Cell Biol. 2014; 46:56-67.
30. McShane LM, Altman DG, Sauerbrei W, Taube SE, Gion M, Clark GM. REporting recommendations for tumour MARKer prognostic studies (REMARK). Br J Cancer. 2005; 93:387-391.
31. Storr SJ, Zhang S, Perren T, Lansdown M, Fatayer H, Sharma N, Gahlaut R, Shaaban A, Martin SG. The calpain system is associated with survival of breast cancer patients with large but operable inflammatory and non-inflammatory tumours treated with neoadjuvant chemotherapy. Oncotarget. 2016; 7:47927-47937. https://doi.org/10.18632/oncotarget.10066.
32. Curtis C, Shah SP, Chin SF, Turashvili G, Rueda OM, Dunning MJ, Speed D, Lynch AG, Samarajiwa S, Yuan Y, Gräf S, Ha G, Haffari G, et al; METABRIC Group, The genomic and transcriptomic architecture of 2,000 breast tumours reveals novel subgroups. Nature. 2012; 486:346-352.
33. Camp RL, Dolled-Filhart M, Rimm DL. X-tile: a new bio-informatics tool for biomarker assessment and outcome-based cut-point optimization. Clin Cancer Res. 2004; 10:7252-7259.