
INTRODUCTION
Multiple Myeloma (MM) precursor diseases are defined by the detection of M-protein or the presence of clonal plasma cells within the bone marrow. To account for the different extent of those findings and their unequal risks of progression to active MM, these precursor states are grouped into monoclonal gammopathy of undetermined significance (MGUS) and smoldering multiple myeloma (SMM) [1]. However, even just within the group of SMM patients, the prognosis has been demonstrated to be extremely heterogeneous: While approximately 20% of SMM patients develop active MM within the first 2 years, 25% have not progressed after 10 years, indicating that further risk stratification and different management for subgroups within SMM are needed [2].
The International Myeloma Working Group (IMWG) updated the definition of MM in 2014 with the purpose of including a subset of high-risk SMM patients, who show a high risk for imminent development of end organ damage defined by the CRAB-criteria, into the group of MM patients requiring therapy. To do so, they searched for so called biomarkers of malignancy, which isolate a subset of patients who show an 80% probability of progression to MM (defined by CRAB criteria only) within the next 2 years [3].
A large prospective study was able to show that high-risk SMM patients do benefit from early therapy, with lenalidomid and dexamethasone significantly extending the time to development of CRAB-criteria [4]. Even though high-risk SMM patients were not defined by imaging in this study, this emphasizes the value of optimal risk stratification for SMM patients. However, the current MRI biomarker from the IMWG, i.e. the presence of more than 1 focal lesion (FL) of greater than 5mm in size, has repeatedly failed to reach an 80% 2-year progression rate (2yrPR) [5, 6]. Also, to our best knowledge, the sensitivity and false positive rate (FPR) of this criterion has never been assessed, lacking evidence about which proportion of patients that will progress within 2 years is actually detected by the biomarker ‘>1 focal lesion’ (>1FL).
Therefore, the purpose of this study was to establish and assess new, volumetry based biomarkers derived from whole-body MRI (wb-MRI) and to define the best possible MRI biomarker for risk-stratification of SMM patients, taking the 2yrPR as well as sensitivity and FPR into account.
RESULTS
Analysis of the predictive value of longitudinally assessed total tumor volume, speed of growth, number of focal lesions and the development of the number of focal lesions over time for the risk of progression
We observed a significant correlation between the total tumor volume (TTV) and the time to progression (TTP). Quantitative analysis showed that an increase of the TTV by the factor of 10 leads to an increase of the risk of progression by 65%. Using a cutoff of 7220mm3 TTV for risk stratification into a high-risk and a low-risk group exactly fulfilled the demand of the IMWG to isolate a high-risk group with a 2yrPR of 80%.
Performing quantitative analysis for speed of growth (SOG), we observed a 37% increase of the risk of progression for each additional 100mm3/month SOG, which was also a significant correlation. The cutoff to fulfill the IMWG demand was located at 114mm3/month: Patients that once showed a SOG of more than 114mm3/month had a 2yrPR of 82.5% from this point in time (Figure 1). By adjusting the SOG cutoff, achieving 2yrPR over 90% in the high-risk group was possible.
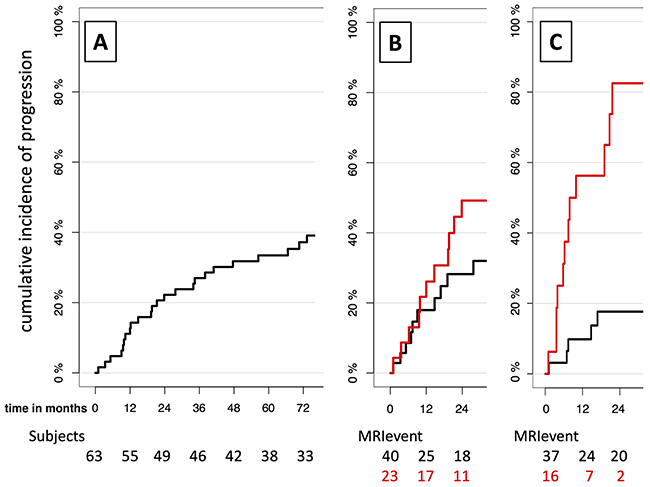
Figure 1: Development of risk stratification for SMM patients by imaging biomarkers: without imaging biomarker (A), with current imaging biomarker >1FL (B) and with new imaging biomarker SOG (C). A: Cumulative incidences of progression for all SMM patients from initial MRI when no risk stratification by an imaging biomarker is performed. Time is given in months from initial MRI. B-C: Cumulative incidences of progression for high-risk group (red) and low-risk group (black). Risk stratification into high- and low-risk group is performed by the current IMWG imaging biomarker >1FL in B, and the new volumetry-based imaging biomarker >114mm3/month SOG in C. Time is given in months from the MRI with biomarker-event (MRI-event), defined as the first time the biomarker-cutoff is overstepped, or from last follow-up MRI when no biomarker event occurred during the follow-up. Below, the number of patients in each group “at risk” is given. The SOG reaches both higher progression rates in the high-risk group and lower progression rates in the low-risk group compared to >1FL.
According to our data, adjusting the cutoffs for the non-volumetry based MRI-biomarkers number of focal lesions (nFL) and the development of the number of focal lesions over time (dev-nFL) also allowed for isolation of a subset with at least 80% 2yrPR. Performing risk stratification based on the number of FLs, a cutoff of ≥5 FL isolated a high-risk group with a 2yrPR of 87.5%. For the development of the number of focal lesions, patients who showed ≥2 new FL per year had a 2yrPR of 85.2%.
Table 1 shows the different biomarkers assessed in this study, the current MRI biomarker (>1FL; Figure 1B), their cutoffs and summarizes their performance according to the IMWG criterion and both sensitivity and FPR. SOG showed the highest ability to discriminate patients that will progress within the next two years with a sensitivity of 63.2%, exceeding the current imaging biomarker >1Fl by 14.9%. In addition, the FPR of the SOG was less than a third of the biomarker >1FL. FPRs of nFL and dev-nFL were even lower than the one of SOG, however their ability to detect patients that will progress within the next 2 years was very low compared to the SOG.
Table 1: Overview of MRI biomarkers given with cutoff, p-value for cutoff, 2yrPR of the high-risk group and performance at sensitivity and FPR
MRI-based biomarker |
>1 focal lesion |
Number of focal lesions |
Development of number of focal lesions |
Total tumor volume |
Speed of growth |
|---|---|---|---|---|---|
Cutoff |
>1 |
≥5 |
≥2 |
≥7220 |
≥114 |
Unit |
FL |
FL |
new FL/year |
mm3 |
mm3/month |
p-value |
<0.001 |
<0.001 |
<0.001 |
<0.001 |
<0.001 |
2-year progression rate |
49.2% |
87.5% |
85.2% |
80.0% |
82.5% |
Sensitivity |
48.3% |
26.5% |
36.2% |
47.0% |
63.2% |
False positive rate |
29.5% |
2.7% |
4.2% |
8.0% |
8.7% |
n patients assessed |
63 |
63 |
53 |
63 |
53 |
n showing biomarker |
23 |
8 |
9 |
15 |
16 |
Additionally, the number of patients that could be assessed with the biomarker and the number of patients presenting the biomarker within the follow-up is given.
To compare the ability of prognostic discrimination between the MRI biomarkers without cutoffs, Harrell’s c-index was calculated for each biomarker, based on all longitudinally assessed biomarker values (Table 2). SOG showed the highest c-Index, stating that it has the best ability of prognostic discrimination among all tested MRI biomarkers.
Table 2: Harrell’s c-Index for the MRI-biomarkers nFL, dev-nFL, TTV and SOG
MRI-based biomarker |
Harrell’s c-Index |
|---|---|
Number of focal lesions |
0.788 |
Development of the number of focal lesions |
0.639 |
Total tumor volume |
0.791 |
Speed of growth |
0.825 |
Supplementary Figure 1 visualizes the complete follow-up of all patients showing focal lesions, displaying all wb-MRIs in a timeline and stating which biomarker was assessed as positive at the corresponding MRI.
Multivariate analysis
Multivariate models were calculated in order to investigate whether TTV and SOG have independent prognostic value. Initial M-protein (M-protein t1) ≥20g/l, which had a significant effect on progression in our cohort, as well as nFL and development of new lesions vs. no development of new lesions were included in the multivariate analysis.
In a basic multivariate model for initial TTV (TTVt1) and initial M-protein, both were significant risk factors (Table 3A).
Table 3: Multivariate analysis
Variable |
HR |
95% CI |
p-value |
|
|---|---|---|---|---|
A |
M-protein t1 ≥20 g/l |
2.77 |
1.11, 6.89 |
0.02869 |
TTVt1 |
1.44 |
1.00, 2.08 |
0.04793 |
|
B |
M-protein t1 ≥20 g/l |
1.32 |
0.50, 3.51 |
0.57340 |
SOGevent (cutoff 0) |
8.42 |
2.49, 28.45 |
< 0.001 |
|
logTTVt1 |
1.14 |
0.82, 1.58 |
0.43855 |
|
C |
M-protein t1 ≥20 g/l |
1.34 |
0.51, 3.55 |
0.55415 |
SOGevent (cutoff 0) |
8.18 |
2.39, 28.02 |
< 0.001 |
|
nFL t1 >0 |
1.60 |
0.53, 4.90 |
0.40675 |
|
D |
M-protein t1 ≥20 g/l |
0.96 |
0.32, 2.84 |
0.93930 |
SOGevent (cutoff 114) |
42.06 |
8.14, 217.33 |
< 0.001 |
|
logTTVt1 |
0.81 |
0.52, 1.27 |
0.35731 |
|
E |
M-protein t1 ≥20 g/l |
0.92 |
0.31, 2.73 |
0.88372 |
SOGevent (cutoff 114) |
30.22 |
6.09, 149.80 |
< 0.001 |
|
nFL t1 >0 |
0.72 |
0.15, 3.46 |
0.68534 |
|
F |
TTV |
1.57 |
1.18, 2.09 |
0.0018 |
nFL |
1.22 |
1.12, 1.32 |
< 0.001 |
Significant findings are given in bold and italic letters.
Including initial M-protein ≥20g/l, initial tumor load and overstepping the cutoff of SOG>0 (first time overstepping certain SOG cutoff is called SOGevent in the following), this SOGevent always remained an independent, significant risk factor, while initial M-protein and initial tumor load lost significance. This was independent of whether initial tumor load was included continuously (logTTVt1) or categorially (nFL t1 >0 vs. nFL t1 =0) (Table 3B-3C). Applying the SOG>114mm3/month cutoff that we introduced to fulfill the biomarker criteria instead of SOG>0 did not change the significance of the parameters in this analysis: SOGevent with cutoff 114mm3/month remained an independent, significant risk factor (Table 3D-3E).
Another interesting question is whether the statistical significance of the SOG depends on whether it is caused by the appearance of new FLs or only by the growth of already existing lesions. To investigate this, we stratified groups by new lesions vs. no new lesions at the 2nd wb-MRI and SOG>0 vs. SOG≤0 (Figure 2). Patients with SOG>0 showed significantly higher incidence of progression than patients with stable disease on wb-MRI (no new lesions and existing lesions not growing), independent of whether new lesions appeared or only existing lesions grew (each with p<0.0001). In the subgroup of patients with SOG>0, patients who developed new lesions had 1.28 times risk of progression compared to patients without new lesions, however this was not statistically significant (p=0.65).
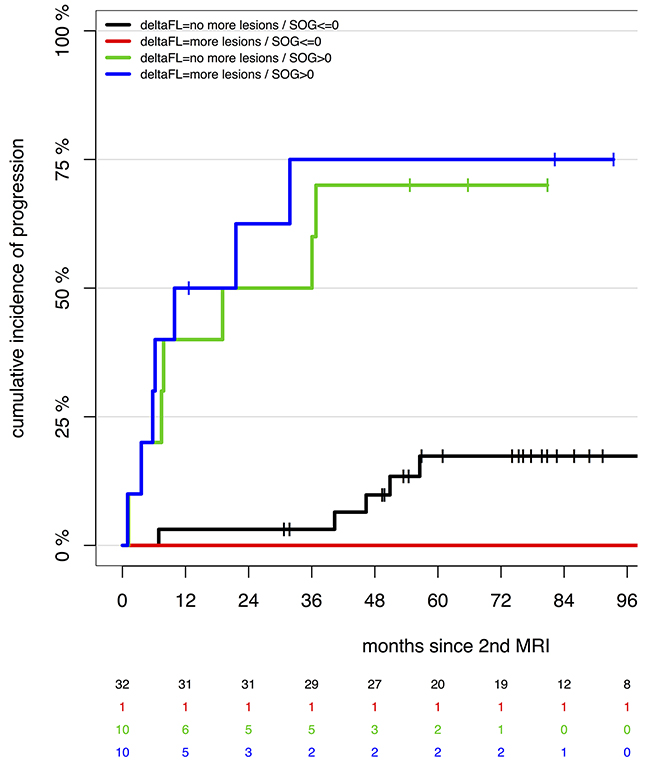
Figure 2: Speed of growth and appearance of new focal lesions. Groups are simultaneously stratified for SOG at 2nd MRI >0 vs. SOG at 2nd MRI ≤0 and new focal lesions appearing at 2nd MRI vs. no new focal lesions appearing at 2nd MRI (deltaFL>0 vs. deltaFL=0, respectively). Groups with SOG>0 show a higher risk of progression than groups with SOG≤0, no matter whether the SOG>0 is caused by appearance of new focal lesions (deltaFL>0, blue, p<0.0001) or just by growth of preexisting lesions (deltaFL=0, green, p<0.0001). In the subgroup with SOG>0, patients with new FL show a 28% higher risk of progression, which is not statistically significant in our cohort (p=0.65).
When multivariate analysis was performed for TTV and nFL over all follow-ups, both remained as significant independent risk factors (Table 3F), also showing that the measurement of tumor volumes had additional prognostic value compared to the lesion count.
Correlation of clinical data with TTV/SOG
We found no significant correlation between any lab parameter and the initial TTV (Supplementary Table 1). For the SOG at 2nd MRI, a significant correlation was observed to the initial beta-2-microglobulin (B2MG) serum level (Table 4A) as well as to deltaHb between initial and 2nd MRI (Table 4B). Results for all other parameters did not show significant correlations (Table 4A-4B).
Table 4: Correlation between SOG and baseline disease parameters and their development
4A |
Parameter |
n |
rho |
p-value |
M-protein |
28 |
0.15 |
0.4471 |
|
Plasmacell count |
37 |
0.13 |
0.4426 |
|
Lactate dehydrogenase |
45 |
0.15 |
0.3316 |
|
Creatinin |
47 |
0.21 |
0.1601 |
|
Calcium |
45 |
0.17 |
0.2671 |
|
Platelets |
45 |
-0.05 |
0.7611 |
|
Leukocytes |
45 |
0.17 |
0.2527 |
|
B2MG |
35 |
0.35 |
0.0423 |
|
Hemoglobin |
47 |
0.08 |
0.5738 |
|
Albumin |
43 |
-0.1 |
0.5054 |
|
C-reactive protein |
33 |
0.14 |
0.4465 |
4B |
Parameter |
n |
rho |
p-value |
delta M-protein |
22 |
0.41 |
0.0548 |
|
delta Creatinin |
43 |
-0.07 |
0.6698 |
|
delta Calcium |
41 |
-0.12 |
0.4585 |
|
delta Platelets |
21 |
-0.14 |
0.5404 |
|
delta Leukocytes |
21 |
-0.27 |
0.2391 |
|
delta Hemoglobin |
43 |
-0.41 |
0.0067 |
|
delta Albumin |
34 |
-0.13 |
0.4473 |
Table 4A shows correlation between baseline disease parameters and SOG at 2nd MRI.
Table 4B states correlations between development of disease parameters between first and 2nd MRI and SOG at 2nd MRI. Significant findings are given in bold and italic letters.
DISCUSSION
MRI has proven to be a suitable tool for risk stratification of SMM patients, using abnormal bone marrow pattern [7, 8], count of FLs [5, 6, 9, 10], development of MRI findings [6] or even parameters from dynamic contrast enhancement MRI (DCE-MRI) as criteria to isolate high-risk groups [11]. Additionally, it was shown that volumetry is the superior method of quantifying tumor burden [12, 13] and that volumetry can contribute to proper risk stratification in lung cancer screening [14, 15]. With these developments in mind, the present study introduces volumetry-based MRI biomarkers for risk stratification of SMM patients and demonstrates their superiority in comparison to other biomarkers, including the recent biomarkers of the 2014 IMWG guidelines.
Performance of biomarkers tested in this study
While the biomarker >1FL failed to reach 80% 2yrPR, both non-volumetry-based (nFL, dev-nFL) and both volumetry-based (TTV, SOG) biomarkers were able to fulfill the IMWG criterion to isolate a high-risk group with ≥80% 2yrPR when cutpoints were adjusted. Taking sensitivity and FPR into account shows that >1FL performs strongly in detecting almost half of the patients that will progress within 2 years, but falsely assigns almost a third of patients who will not progress within 2 years to the high-risk group. This is by far the highest FPR and it results in possible harm to a high number of patients caused by side effects from unnecessary or too early therapy. With 63.2%, SOG shows by far the highest rate of detecting patients with progression within 2 years of all MRI biomarkers, while only assigning 8.7% of patients who are not progressing within 2 years falsely to the high-risk group. The TTV performs similar to SOG regarding FPR, but performs markedly worse regarding sensitivity. The non-volumetry-based biomarkers show the lowest FPRs but poor sensitivity, achieving only about half of the sensitivity of the SOG. Besides the performance on 2yrPR, sensitivity and FPR, Harrell’s c-index additionally expresses the superiority of the SOG for risk stratification.
As a biological background for the superior performance of the volumetry-based biomarkers, it has recently been demonstrated that the maximum diameter of a focal lesion correlates with the proportion of site-specific mutations, indicating an association between the size of FLs and advance of tumor biology [16]. In contrast to nFL and dev-nFL, the volumetry-based biomarkers take the size of focal lesions into account and therefore include information about the current advance of tumor biology, which is lost when only the number of FLs is assessed.
Performance of SOG in comparison with other biomarkers from the literature
The biomarker >1FL has been associated with a higher risk of progression [5, 6, 9, 10], but failed to isolate a high-risk group with ≥80% 2yrPR [5, 6], which is supported by our data.
With the criterion ‘radiological Progressive Disease’ (rPD) Merz et al. proposed an imaging biomarker evaluating development of both focal and diffuse pattern over time, resulting in a 2yrPR at the edge of 70% [6]. While the SOG performs better on the 2yrPR, it has to be remarked that we did not take the diffuse infiltration into account, which was of prognostic significance in some studies [7, 10]. A further improvement of the imaging biomarker might be achieved by combining SOG with parameters evaluating state and/or development of diffuse infiltration into a combined score.
Zamagni et al. performed risk stratification based on 18F-FDG PET/CT, where PET-positive findings defined by showing focal lesions or diffuse bone marrow involvement were associated with a 58% 2yrPR [17]. From the data shown in this publication, we calculated that the sensitivity of this biomarker was only 25%. In comparison to PET/CT, SOG not only performs much better on 2yrPR and sensitivity, but also does not have any radiation exposure.
To assess the absolute amount of contribution of the SOG to the detection of patients that will develop CRAB-criteria within two years by all biomarkers, the sensitivity of the other recent IMWG biomarkers has to be taken into account. For the serum free light chain ratio using a cutoff ≥100 the sensitivity for detecting patients with a progression within the first 2 years was 31.9% [18]. For the percentage of plasma cells in the bone marrow, Rajkumar reported that 3.2% of SMM patients showed a bone marrow plasma cell percentage ≥60% and that 95% of those progressed to MM within the first 2 years [19]. Thus, based on the estimation that 20% of SMM patients progress in the first 2 years [2], this results in a sensitivity of approximately 15%. Compared to 31.9% and approximately 15% estimated sensitivity of the other two current IMWG biomarkers, the SOG with 63% sensitivity contributes enormously to the overall detection of SMM patients that will progress within 2 years. Additionally, it is a non-invasive procedure which can easily be repeated annually or semiannually.
Multivariate analysis
Using multivariate analysis, we demonstrate that overstepping a certain SOG cutoff (0 or 114mm3/month) is an independent, significant risk factor for progression to MM. The SOG as a parameter reflecting the dynamic of the disease has more prognostic impact than parameters based on only one point in time (such as TTV or nFL). This finding contributes to a collection of results in the body of literature that show a prognostic significance of longitudinal parameters both in imaging [6] and laboratory investigation [20–22].
The significance of SOG does not depend on whether it is exclusively caused by the growth of existing lesions or whether it also results from the arising of new lesions. A different pathomechanism might be the reason why in some cases only a few lesions exist and grow in a rather stationary manner, while in other patients many new lesions arise. With this in mind, it is an interesting finding that patients with new arising lesions at the 2nd MRI have a tendency towards a more aggressive course of disease, even though this was not significant.
Limitations
The small number of patients is a limitation of this study. However, it must be taken into account that only few centers performed MR imaging on SMM patients before the IMWG updated the disease definition of MM in 2014 [3]. Therefore, this is one of the largest cohorts with longitudinal MR-Imaging in untreated SMM patients. The retrospective design of this study has to be named as another disadvantage. Wb-MRIs were mainly scheduled by the treating physicians and did not follow a distinct schema such as follow up every 6 or 12 months, at least until 2014 when annual wb-MRIs became included in the routine assessment of SMM patients for the first 5 years from diagnosis. For these reasons, our results should be verified by a prospective study with a fixed follow-up schema and a larger number of patients. As the SOG is a longitudinal biomarker representing the dynamic of the disease like rPD, evolving M-protein or evolving Hb, it cannot be calculated at the initial examination, but start e.g. with the first follow-up after six months. Manual 3D-segmentation is currently a more time-consuming task than solely counting focal lesions. However, there is a development towards automatic tools for combined lesion detection and segmentation [23], which would reduce the workload for the determination of the SOG.
MATERIALS AND METHODS
Patients
In this study, 63 SMM patients (according to the 2003 guidelines [1]) who received at least one wb-MRI were analyzed retrospectively. All patients included in this study received initial wb-MRI between 2004 and 2011 at our center and received quarterly or at least semiannual clinical evaluations until they progressed to MM (n=23), received local therapy of FLs (n=4), systemic therapy due to the call of the treating physician without diagnosis of MM (n=6), died (n=2), or for at least 3 years from initial MRI in case none of the abovementioned events occurred (n=28). No patient had received a systemic therapy before or during the observation period; however 10 patients were included who had received local radiation therapy for a concomitant solitary plasma cell tumor before the first MRI. Volumetry was not performed on those irradiated solitary plasma cell tumors, but volumetry was performed on all focal lesions outside the radiation field. Progression was defined by development of myeloma defining events without biomarkers of malignancy, shortly the CRAB-Criteria [3]. Patients who received local therapy (radiation therapy or resection) of FLs or systemic therapy due to the call of the treating physician without diagnosis of MM were excluded from follow up from this time point, because the natural development of the TTV could have been affected by the therapy. Patients had a median age of 55 years (range 29-76 years) at initial MRI; 62% were male. Fifty-three patients received at least two (on average four) wb-MRIs, before progress occurred or they left observation. The median interval between MRI examinations was 13 months and the median observation time from first to last MRI was 46 months. Patients with one wb-MRI could not be included in analysis of the dynamic biomarkers speed of growth and development of the number of focal lesions over time. Approval had been received from the institutional ethics committee for retrospective analysis of imaging data from patients with monoclonal plasma cell disorders with waiver of informed consent. Parts of this cohort had been included in previous studies [6, 10, 24–26].
Imaging protocols
All wb-MRI exams originating from two identical 1.5 Tesla MRI systems (Magnetom Avanto, Siemens Healthineers, Erlangen/Germany) at our site were included. The imaging protocol has been published before [24, 26] and comprised phased-array, body-matrix surface coils (Siemens Healthineers, Erlangen/ Germany). The sequence protocol included the following: T1-weighted turbo-spin echo sequences (repetition time (TR), 627 milliseconds [ms]; echo time (TE), 11 ms; section thickness (ST), 5 mm; acquisition time (TA), 2:45 min) and T2-weighted short-tau inversion recovery sequences (TR, 5300 ms; TE, 74 ms; ST, 5 mm; TA, 3:00) of the head, thorax, abdomen, pelvis, and legs in coronal orientation; T1-weighted turbo-spin echo sequences (TR, 621 ms; TE, 11 ms; ST, 3 mm; TA, 1:38 ) and T2*-weighted turbo-spin echo sequences (TR, 4000 ms; TE, 93 ms; ST, 4 mm; TA, 2:30) of the spine in sagittal orientation. The patients were positioned with their arms along the body. The examinations covered the region between the skull vertex and the mid-calves. Depending on the body height of the patient, the distal calves and the feet were not always included. The total image acquisition time was approximately 40 minutes. Contrast medium was not given.
Volumetry
ITK SNAP (Version 3.4.0, www.itksnap.org), a common software for the segmentation of anatomical structures in 3D medical images [27], was used for volumetry. Segmentation of all detected lesions >5mm was performed manually (Figure 3) by one research assistant who was supervised by a radiology resident experienced in musculoskeletal imaging. When performing volumetry, the examiners were blinded to clinical and prognostic information. In some cases, lesions were not delimitable anymore due to intensified diffuse bone marrow infiltration over time. We assume the tumor cells of those focal lesions did not disappear but are not measurable anymore. Since calculating no volume for those lesions (while the tumor load presumably is still present) would be incorrect, we performed a calculative correction for those unmeasurable lesions, using the volume of the lesion in the previous imaging as a replacement. FLs were measured in T1- and T2-weighted images if possible. As there was no systematic difference between T1 and T2 volumes, the average volume was used for further calculation. Adding up the volumes of all FLs results in the TTV. The SOG was defined by the difference of TTVs divided by the time between two consecutive MRIs.
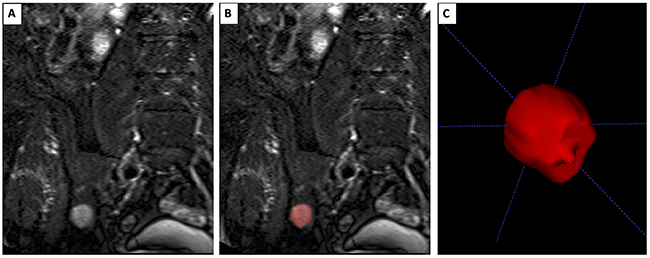
Figure 3: Segmentation of a focal lesion. Extract of a T2-weighted coronal MRI sequence of abdomen/pelvis. (A) Native imaging with hyperintense focal lesion of the iliac bone in ITKSnap, (B) Image with focal lesion highlighted in red after 3D-segmentation was performed. (C) 3D-view of segmented focal lesion in ITK-SNAP.
Clinical and laboratory examinations
Clinical and serological examination of included patients was performed every 3-6 months for the complete follow-up period in our outpatient clinic. Progression was defined by development of myeloma defining events without biomarkers of malignancy, shortly the CRAB-Criteria [3].
Statistical analysis
Primary clinical endpoint was TTP, defined as time from 1st/2nd MRI to progression. Deaths without prior disease progression were considered as competing event. Cumulative incidence of progressive disease was estimated using Aalen-Johansen estimator accounting for death. Cause-specific Cox regression was used to assess the impact of imaging parameters on risk of progression. TTV was log10-transformed for prognostic analysis. Harrell’s c-index was used to compare prognostic discrimination of different MRI biomarkers. Imaging parameters assessed during follow-up were analyzed as time-dependent variables in Cox regression. For multivariable Cox proportional hazard analysis, multiple imputation of missing M-Protein values was performed using MICE algorithm.
Imaging biomarker events were defined as the first time a certain threshold was exceeded. The 2yrPR in patients with imaging event was defined as the estimated proportion of patients with progression within 2 years after onset of imaging event. Cutoffs of imaging parameters were selected based on a 2yrPR of at least 80%. P-values of these cutoffs were adjusted for multiple testing of all possible cutoffs using Holm correction in order to control the family-wise error rate. For patients without imaging event during follow-up, time to progression was calculated from last MRI in cutoff analysis.
To assess the predictive discrimination of biomarkers for risk stratification beyond the 2yrPR after biomarker event, we assessed time-dependent sensitivity and FPR for disease progression after 2 years accounting for censored data [28].
Sensitivity here indicates the proportion of patients correctly identified to be at high risk, whereas the false positive rate, or 1 – specificity, indicates the proportion of patients incorrectly identified as being at high risk.
Spearman correlation coefficient was used to assess correlation between imaging and lab parameters. Analysis was performed with software R 3.4.
CONCLUSIONS
Of all biomarkers derived from wb-MRI, SOG shows the best ability of prognostic discrimination and is the preferable imaging biomarker for risk stratification of smoldering multiple myeloma patients. Using a cutoff of 114mm3/month, it fulfills the IMWG demand of 80% 2yrPR of the high-risk group and detects by far the most patients that are fulfilling the CRAB-criteria within the following two years. Additionally, it shows a low FPR. Further studies on larger cohorts should be performed in order to confirm that the SOG is the best imaging biomarker and that SOG should be used for risk stratification of SMM patients or as a criterion for the definition of symptomatic disease with indication for systemic treatment.
Abbreviations
B2MG, beta-2-microglobulin
CI, confidence interval
dev-nFL, development of the number of focal lesions over time
FPR, false positive rate
HR, hazard ratio
n, number
nFL, number of focal lesions
rPD, radiological progressive disease
SOG, speed of growth
ST, section thickness
t1, initial
TA, acquisition time
TE, echo time
TR, repetition time
TTP, time to progression
TTV, total tumor volume.
Author contributions
M.W. performed lesion detection and segmentation, planned and contributed to data analysis, wrote and edited the manuscript. L.K. supervised lesion detection and segmentation, contributed to manuscript writing and editing. M.P. planned and contributed to data analysis and manuscript editing. B.H.M. contributed to conception and overall experimental design and to manuscript editing. T.H. planned and performed statistical analysis, contributed to manuscript writing and editing. J.Ho. contributed to data analysis and manuscript editing. B.W. contributed to collection of clinical data. H-U.K. contributed to conception and overall experimental design. M.M. contributed to collection of clinical data and manuscript editing. J. Hi. contributed to collection of clinical data, planning of data analysis and manuscript editing. G.L. contributed to conception and overall experimental design and contributed to manuscript editing. M-A.W. provided conception and overall experimental design and contributed to manuscript writing and editing.
ACKNOWLEDGMENTS
The authors would like to thank the Deutsche Forschungsgemeinschaft (DFG; WE 2709/3-1 and ME 3511/3-1) and the Austrian Science Fund (FWF; I2714-B31) for research funding. The authors acknowledge financial support by Deutsche Forschungsgemeinschaft within the funding programme Open Access Publishing, by the Baden-Württemberg Ministry of Science, Research and the Arts and by Ruprecht-Karls-Universität Heidelberg.
CONFLICTS OF INTEREST
Outside the submitted work the following relationships are reported: J.Hi.: Consultancy: Amgen, Celgene; Honoraria: Amgen, BMS, Celgene, Janssen, Novartis, Takeda; Research Funding: Celgene, Sanofi; Advisory Board: Amgen, BMS, Celgene, Janssen, Novartis, Takeda; Travel Support: Amgen, BMS, Celgene, Janssen, Novartis, Takeda.
M.W., L.K., M.P., B.H.M., T.H., J.Ho., B.W., H-U.K., M.M., G.L. and M-A.W. declare they have no conflict of interest.
FUNDING
The present study was supported by the Deutsche Forschungsgemeinschaft (DFG; WE 2709/3-1 and ME 3511/3-1) and the Austrian Science Fund (FWF; I2714-B31).
REFERENCES
1. International Myeloma Working Group. Criteria for the classification of monoclonal gammopathies, multiple myeloma and related disorders: a report of the International Myeloma Working Group. Br J Haematol. 2003; 121:749–57. https://doi.org/10.1046/j.1365-2141.2003.04355.x.
2. Kyle RA, Remstein ED, Therneau TM, Dispenzieri A, Kurtin PJ, Hodnefield JM, Larson DR, Plevak MF, Jelinek DF, Fonseca R, Melton LJ 3rd, Rajkumar SV. Clinical course and prognosis of smoldering (asymptomatic) multiple myeloma. N Engl J Med. 2007; 356:2582–90. https://doi.org/10.1056/NEJMoa070389.
3. Rajkumar SV, Dimopoulos MA, Palumbo A, Blade J, Merlini G, Mateos MV, Kumar S, Hillengass J, Kastritis E, Richardson P, Landgren O, Paiva B, Dispenzieri A, et al. International Myeloma Working Group updated criteria for the diagnosis of multiple myeloma. Lancet Oncol. 2014; 15:e538–48. https://doi.org/10.1016/S1470-2045(14)70442-5.
4. Mateos MV, Hernández MT, Giraldo P, de la Rubia J, de Arriba F, Corral LL, Rosiñol L, Paiva B, Palomera L, Bargay J, Oriol A, Prosper F, López J, et al. Lenalidomide plus dexamethasone versus observation in patients with high-risk smouldering multiple myeloma (QuiRedex): long-term follow-up of a randomised, controlled, phase 3 trial. Lancet Oncol. 2016; 17:1127–36. https://doi.org/10.1016/S1470-2045(16)30124-3.
5. Kastritis E, Moulopoulos LA, Terpos E, Koutoulidis V, Dimopoulos MA. The prognostic importance of the presence of more than one focal lesion in spine MRI of patients with asymptomatic (smoldering) multiple myeloma. Leukemia. 2014; 28:2402–03. https://doi.org/10.1038/leu.2014.230.
6. Merz M, Hielscher T, Wagner B, Sauer S, Shah S, Raab MS, Jauch A, Neben K, Hose D, Egerer G, Weber MA, Delorme S, Goldschmidt H, Hillengass J. Predictive value of longitudinal whole-body magnetic resonance imaging in patients with smoldering multiple myeloma. Leukemia. 2014; 28:1902–08. https://doi.org/10.1038/leu.2014.75.
7. Moulopoulos LA, Dimopoulos MA, Smith TL, Weber DM, Delasalle KB, Libshitz HI, Alexanian R. Prognostic significance of magnetic resonance imaging in patients with asymptomatic multiple myeloma. J Clin Oncol. 1995; 13:251–56. https://doi.org/10.1200/JCO.1995.13.1.251.
8. Mariette X, Zagdanski AM, Guermazi A, Bergot C, Arnould A, Frija J, Brouet JC, Fermand JP. Prognostic value of vertebral lesions detected by magnetic resonance imaging in patients with stage I multiple myeloma. Br J Haematol. 1999; 104:723–29. https://doi.org/10.1046/j.1365-2141.1999.01244.x.
9. Dhodapkar MV, Sexton R, Waheed S, Usmani S, Papanikolaou X, Nair B, Petty N, Shaughnessy JD Jr, Hoering A, Crowley J, Orlowski RZ, Barlogie B. Clinical, genomic, and imaging predictors of myeloma progression from asymptomatic monoclonal gammopathies (SWOG S0120). Blood. 2014; 123:78–85. https://doi.org/10.1182/blood-2013-07-515239.
10. Hillengass J, Fechtner K, Weber MA, Bäuerle T, Ayyaz S, Heiss C, Hielscher T, Moehler TM, Egerer G, Neben K, Ho AD, Kauczor HU, Delorme S, Goldschmidt H. Prognostic significance of focal lesions in whole-body magnetic resonance imaging in patients with asymptomatic multiple myeloma. J Clin Oncol. 2010; 28:1606–10. https://doi.org/10.1200/JCO.2009.25.5356.
11. Hillengass J, Ritsch J, Merz M, Wagner B, Kunz C, Hielscher T, Laue H, Bäuerle T, Zechmann CM, Ho AD, Schlemmer HP, Goldschmidt H, Moehler TM, Delorme S. Increased microcirculation detected by dynamic contrast-enhanced magnetic resonance imaging is of prognostic significance in asymptomatic myeloma. Br J Haematol. 2016; 174:127–35. https://doi.org/10.1111/bjh.14038.
12. Brandelik SC, Krzykalla J, Hielscher T, Hillengass J, Kloth JK, Kauczor HU, Weber MA. [Focal lesions in whole-body MRI in multiple myeloma : quantification of tumor mass and correlation with disease-related parameters and prognosis]. [Article in German]. Radiologe. 2018; 58:72–78. https://doi.org/10.1007/s00117-017-0299-7.
13. Nishino M, Jackman DM, DiPiro PJ, Hatabu H, Jänne PA, Johnson BE. Revisiting the relationship between tumour volume and diameter in advanced NSCLC patients: an exercise to maximize the utility of each measure to assess response to therapy. Clin Radiol. 2014; 69:841–48. https://doi.org/10.1016/j.crad.2014.03.020.
14. van Klaveren RJ, Oudkerk M, Prokop M, Scholten ET, Nackaerts K, Vernhout R, van Iersel CA, van den Bergh KA, van ’t Westeinde S, van der Aalst C, Thunnissen E, Xu DM, Wang Y, et al. Management of lung nodules detected by volume CT scanning. N Engl J Med. 2009; 361:2221–29. https://doi.org/10.1056/NEJMoa0906085.
15. Saghir Z, Dirksen A, Ashraf H, Bach KS, Brodersen J, Clementsen PF, Døssing M, Hansen H, Kofoed KF, Larsen KR, Mortensen J, Rasmussen JF, Seersholm N, et al. CT screening for lung cancer brings forward early disease. The randomised Danish Lung Cancer Screening Trial: status after five annual screening rounds with low-dose CT. Thorax. 2012; 67:296–301. https://doi.org/10.1136/thoraxjnl-2011-200736.
16. Rasche L, Chavan SS, Stephens OW, Patel PH, Tytarenko R, Ashby C, Bauer M, Stein C, Deshpande S, Wardell C, Buzder T, Molnar G, Zangari M, et al. Spatial genomic heterogeneity in multiple myeloma revealed by multi-region sequencing. Nat Commun. 2017; 8:268. https://doi.org/10.1038/s41467-017-00296-y.
17. Zamagni E, Nanni C, Gay F, Pezzi A, Patriarca F, Bellò M, Rambaldi I, Tacchetti P, Hillengass J, Gamberi B, Pantani L, Magarotto V, Versari A, et al. 18F-FDG PET/CT focal, but not osteolytic, lesions predict the progression of smoldering myeloma to active disease. Leukemia. 2016; 30:417–22. https://doi.org/10.1038/leu.2015.291.
18. Larsen JT, Kumar SK, Dispenzieri A, Kyle RA, Katzmann JA, Rajkumar SV. Serum free light chain ratio as a biomarker for high-risk smoldering multiple myeloma. Leukemia. 2013; 27:941–46. https://doi.org/10.1038/leu.2012.296.
19. Rajkumar SV, Larson D, Kyle RA. Diagnosis of smoldering multiple myeloma. N Engl J Med. 2011; 365:474–75. https://doi.org/10.1056/NEJMc1106428.
20. Fernández de Larrea C, Isola I, Cibeira MT, Rosiñol L, Calvo X, Tovar N, Elena M, Magnano L, Aróstegui JI, Rozman M, Yagüe J, Bladé J. Smoldering multiple myeloma: impact of the evolving pattern on early progression. Blood. 2014; 124:3363. http://www.bloodjournal.org/content/124/21/3363.
21. Ravi P, Kumar S, Larsen JT, Gonsalves W, Buadi F, Lacy MQ, Go R, Dispenzieri A, Kapoor P, Lust JA, Dingli D, Lin Y, Russell SJ, et al. Evolving changes in disease biomarkers and risk of early progression in smoldering multiple myeloma. Blood Cancer J. 2016; 6:e454. https://doi.org/10.1038/bcj.2016.65.
22. Rosiñol L, Bladé J, Esteve J, Aymerich M, Rozman M, Montoto S, Giné E, Nadal E, Filella X, Queralt R, Carrió A, Montserrat E. Smoldering multiple myeloma: natural history and recognition of an evolving type. Br J Haematol. 2003; 123:631–36. https://doi.org/10.1046/j.1365-2141.2003.04654.x.
23. Kleesiek J, Petersen J, Döring M, Maier-Hein K, Köthe U, Wick W, Hamprecht FA, Bendszus M, Biller A. Virtual Raters for Reproducible and Objective Assessments in Radiology. Sci Rep. 2016; 6:25007. https://doi.org/10.1038/srep25007.
24. Fechtner K, Hillengass J, Delorme S, Heiss C, Neben K, Goldschmidt H, Kauczor HU, Weber MA. Staging monoclonal plasma cell disease: comparison of the Durie-Salmon and the Durie-Salmon PLUS staging systems. Radiology. 2010; 257:195–204. https://doi.org/10.1148/radiol.10091809.
25. Hillengass J, Bäuerle T, Bartl R, Andrulis M, McClanahan F, Laun FB, Zechmann CM, Shah R, Wagner-Gund B, Simon D, Heiss C, Neben K, Ho AD, et al. Diffusion-weighted imaging for non-invasive and quantitative monitoring of bone marrow infiltration in patients with monoclonal plasma cell disease: a comparative study with histology. Br J Haematol. 2011; 153:721–28. https://doi.org/10.1111/j.1365-2141.2011.08658.x.
26. Kloth JK, Hillengass J, Listl K, Kilk K, Hielscher T, Landgren O, Delorme S, Goldschmidt H, Kauczor HU, Weber MA. Appearance of monoclonal plasma cell diseases in whole-body magnetic resonance imaging and correlation with parameters of disease activity. Int J Cancer. 2014; 135:2380–86. https://doi.org/10.1002/ijc.28877.
27. Yushkevich PA, Piven J, Hazlett HC, Smith RG, Ho S, Gee JC, Gerig G. User-guided 3D active contour segmentation of anatomical structures: significantly improved efficiency and reliability. Neuroimage. 2006; 31:1116–28. https://doi.org/10.1016/j.neuroimage.2006.01.015.
28. Heagerty PJ, Lumley T, Pepe MS. Time-dependent ROC curves for censored survival data and a diagnostic marker. Biometrics. 2000; 56:337–44. https://doi.org/10.1111/j.0006-341X.2000.00337.x.