
INTRODUCTION
Chloride intracellular channel 1 (CLIC1) is one of the CLIC family proteins, and was initially found to be overexpressed in activated macrophages [1]. CLIC1 exists as an integral membrane form and soluble cytoplasmic form [2]. As a homologous protein of the glutathione S-transferase (GST) superfamily [3, 4], CLIC1 is considered to act as a sensor and effector during oxidative stress [5]. CLIC1 is ubiquitously expressed in human tissues, and plays important roles in many physiological functions, including the modulation of ion homeostasis and regulation of cell volume and organelle acidity [6-8]. Recent studies revealed that CLIC1 is expressed in various cancers, and plays crucial roles in multiple cell functions including control of the cell cycle, apoptosis, proliferation, invasiveness, and metastasis [8-24]. However, the expression and role of CLIC1 in human esophageal squamous cell carcinoma (ESCC) remains unknown.
We previously reported that several ion transporters are expressed in human ESCC and play crucial roles in multiple cell functions. For example, Na+/K+/2Cl- cotransporter 1 (NKCC1) regulates cell cycle progression [25], K-Cl cotransporter 3 (KCC3) regulates cell migration and invasion [26], anion exchanger 1 (AE1) functions as a regulator of proliferation, survival, migration, and invasion [27], Na+/H+ exchanger 1 (NHE1) plays a suppressive role in proliferation, survival, migration, and invasion [28], and aquaporin 5 (AQP5) affects proliferation and cell survival [29]. The objectives of the present study were to investigate the role of CLIC1 in the proliferation, apoptosis, migration, and invasion of ESCC. Microarray analyses showed that the depletion of CLIC1 with small interfering RNA (siRNA) changed the expression levels of many genes involved in apoptosis and epithelial-mesenchymal transition (EMT). Furthermore, we analyzed the expression of CLIC1 in human ESCC samples and investigated its relationship with the clinicopathological features and prognosis of ESCC patients. Our results indicate that CLIC1 plays an important role in the progression of ESCC.
RESULTS
Expression of CLIC1 in ESCC cell lines
In order to elucidate the functions of CLIC1 in ESCCs, we investigated 9 cell lines for CLIC1 protein expression. Western blotting revealed that the CLIC1 protein was expressed in all cell lines (Figure 1A).
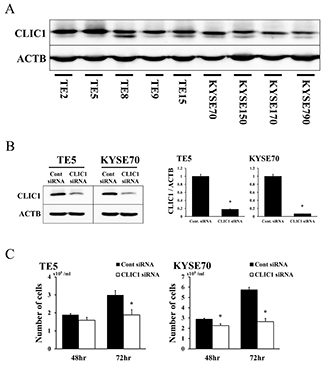
Figure 1: Expression of CLIC1 in ESCC cells. (A) CLIC1 protein expression was analyzed in 9 ESCC cell lines. Western blotting showed that CLIC1 was strongly expressed in all 9 ESCC cell lines. (B) Western blotting revealed that CLIC1 siRNA effectively reduced CLIC1 protein levels in TE5 and KYSE70 cells. CLIC1 siRNA effectively reduced CLIC1 mRNA levels in TE5 and KYSE70 cells. Mean±SEM. n=3. *p<0.05 (significantly different from control siRNA). (C) The down-regulation of CLIC1 inhibited the proliferation of TE5 and KYSE70 cells. The number of cells was counted 48 and 72 h after siRNA transfection. Mean±SEM. n=3. *p<0.05 (significantly different from control siRNA).
CLIC1 regulates cell proliferation in ESCC cells
We performed knockdown experiments using CLIC1 siRNA on the TE5 and KYSE70 cell lines and investigated their effects on cell proliferation. CLIC1 protein and mRNA levels were markedly decreased by CLIC1 siRNA transfection in both cell lines (Figure 1B). Cell numbers were significantly lower in CLIC1 siRNA-transfected TE5 cells than in control cells 72 h after transfection (Figure 1C). In KYSE70 cells, the number of CLIC1-depleted cells was significantly lower than that of control cells 48 and 72 h after transfection (Figure 1C). In the cell cycle analysis, the knockdown of CLIC1 increased the number of cells in the sub-G1 phase in the TE5 and KYSE70 cell lines (Figure 2A). These results indicate that CLIC1 has a critical function in controlling the proliferation and survival of ESCC cells.
CLIC1 regulates apoptosis in ESCC cells
We then transfected TE5 and KYSE70 cells with CLIC1 siRNA and examined apoptosis. The depletion of CLIC1 increased early apoptosis (annexin V positive/PI negative) and late apoptosis (annexin V positive/PI positive) in the TE5 and KYSE70 cell lines 72 h after siRNA transfection (Figure 2B). Western blotting and quantitative RT-PCR revealed that the down-regulation of CLIC1 affected reductions in Bcl-2 protein and mRNA levels, and the cleavage of caspase 3 (Figure 2C). These results suggest that the expression of CLIC1 affects apoptosis in ESCC cells.
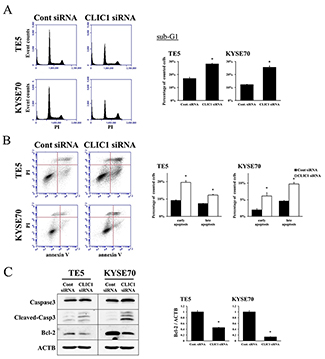
Figure 2: CLIC1 controls apoptosis of ESCC cells. (A) The down-regulation of CLIC1 increased the number of cells in the sub-G1 phase in TE5 and KYSE70 cells. Cells transfected with control or CLIC1 siRNA were stained with propidium iodide (PI) and analyzed by flow cytometry. Mean±SEM. n=3. *p<0.05 (significantly different from control siRNA). (B) The down-regulation of CLIC1 increased the early and late apoptosis phases in TE5 and KYSE70 cells. Cells transfected with control or CLIC1 siRNA were stained with PI and annexin V, and then analyzed by flow cytometry. Mean±SEM. n=3. *p<0.05 (significantly different from control siRNA). (C) The down-regulation of CLIC1 affected reductions in Bcl-2 protein and mRNA levels and the cleavage of caspase 3.
Depletion of CLIC1 promotes cell migration and invasion in ESCC cells
The depletion of CLIC1 significantly increased the migration and invasion of TE5 and KYSE70 cells (Figure 3A). Western blotting and quantitative RT-PCR showed that the down-regulation of CLIC1 affected EMT-related molecular factors, such as E-cadherin, vimentin, snail, β-catenin, and claudin 1 (Figure 3B-3C). These results indicate that CLIC1 has critical functions in controlling cell migration and invasion in esophageal cancer. In terms of tumor behavior, the molecular mechanisms underlying cell migration and invasion may differ from those of apoptosis.
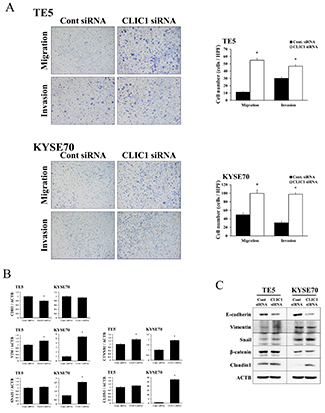
Figure 3: CLIC1 controlled the migration and invasion of ESCC cells. (A) The down-regulation of CLIC1 significantly promoted the migration and invasion of TE5 and KYSE70 cells. Cell migration and invasion were assessed by the Boyden chamber assay. Magnification: ×40. Mean±SEM. n=3. *p<0.05 (significantly different from control siRNA). (B) Verification of gene expression by real-time quantitative RT-PCR. The expression levels of five EMT-related genes (CDH1, VIM, SNAI1, CTNNB1, and CLDN1) in CLIC1-depleted TE5 and KYSE70 cells were compared to those in control siRNA-transfected cells using real-time quantitative RT-PCR. Gene expression levels were normalized to the level of ACTB. Mean±SEM. n=3. *p<0.05 (significantly different from control siRNA). (C) Western blotting showed that the down-regulation of CLIC1 affected EMT-related factors. Detection of EMT-related proteins, including E-cadherin, vimentin, snail, β-catenin, and claudin 1, in CLIC1-knockdown TE5 and KYSE70 cells. The down-regulation of CLIC1 inhibited E-cadherin and induced snail and claudin 1.
Microarray analysis in CLIC1 siRNA-transfected ESCC cells
We examined the gene expression profiles of CLIC1 siRNA-transfected KYSE70 cells in the microarray analysis. The results obtained revealed that the expression of 3099 genes showed fold changes of > 3.0 in the KYSE70 cell line following the knockdown of CLIC1. Among these genes, 957 were up-regulated and 2142 were down-regulated in the CLIC1 siRNA-transfected KYSE70 cell line. Table 1 shows a list of the 20 genes with expression levels that were strongly up- or down-regulated in the CLIC1 siRNA-transfected KYSE70 cell line.
Table 1: Twenty genes displaying the greatest change in expression levels in CLIC1-depleted KYSE70 cells
Up-regulated Genes |
|||
|---|---|---|---|
Gene Symbol |
Gene ID |
Gene Name |
Fold Change |
DAPP1 |
NM_014395 |
Dual adaptor of phosphotyrosine and 3-phosphoinositides |
188.63 |
GUCY1B3 |
NM_000857 |
Guanylate cyclase 1, soluble, beta 3 |
148.50 |
C11orf88 |
NM_207430 |
Chromosome 11 open reading frame 88 |
145.68 |
LRCH1 |
NM_015116 |
Leucine-rich repeats and calponin homology (CH) domain containing 1 |
113.46 |
C3orf80 |
NM_001168214 |
Chromosome 3 open reading frame 80 |
107.61 |
EDA2R |
NM_001242310 |
Ectodysplasin A2 receptor |
85.48 |
MYD88 |
NM_002468 |
Myeloid differentiation primary response 88 |
80.89 |
ARG1 |
NM_001244438 |
Arginase 1 |
76.83 |
HSD11B1 |
NM_181755 |
Hydroxysteroid (11-beta) dehydrogenase 1 |
76.06 |
CPXM2 |
NM_198148 |
Carboxypeptidase X (M14 family), member 2 |
74.54 |
SLC40A1 |
NM_014585 |
Solute carrier family 40 (iron-regulated transporter), member 1 |
74.37 |
SIRPD |
NM_178460 |
Signal-regulatory protein delta |
74.11 |
NOXRED1 |
NM_001113475 |
NADP-dependent oxidoreductase domain containing 1 |
72.68 |
C21orf62 |
NM_019596 |
Chromosome 21 open reading frame 62 |
71.03 |
RHBG |
NM_001256395 |
Rh family, B glycoprotein |
70.75 |
LBP |
NM_004139 |
Lipopolysaccharide binding protein |
68.21 |
WFDC1 |
NM_021197 |
WAP four-disulfide core domain 1 |
67.19 |
IRF7 |
NM_004031 |
Interferon regulatory factor 7 |
59.49 |
PPARG |
NM_138711 |
Peroxisome proliferator-activated receptor gamma |
57.45 |
DPPA5 |
NM_001025290 |
Developmental pluripotency associated 5 |
56.87 |
Down-regulated Genes |
|||
Gene Symbol |
Gene ID |
Gene Name |
Fold Change |
TRIM72 |
NM_001008274 |
Tripartite motif containing 72 |
-73.84 |
MYOT |
NM_006790 |
Myotilin |
-72.81 |
LDB3 |
NM_001171611 |
LIM domain binding 3 |
-71.29 |
OCLM |
NM_022375 |
Oculomedin |
-62.79 |
ESYT3 |
NM_031913 |
Extended synaptotagmin-like protein 3 |
-62.19 |
RPS4Y2 |
NM_001039567 |
Ribosomal protein S4, Y-linked 2 |
-58.48 |
COL5A2 |
NM_000393 |
Collagen, type V, alpha 2 |
-58.08 |
THEM4 |
NM_053055 |
Thioesterase superfamily member 4 |
-55.60 |
PPBP |
NM_002704 |
Pro-platelet basic protein |
-55.19 |
PGPEP1 |
NM_017712 |
Pyroglutamyl-peptidase I |
-54.54 |
IKZF3 |
NM_012481 |
IKAROS family zinc finger 3 |
-51.05 |
CLCN4 |
NM_001830 |
Chloride channel, voltage-sensitive 4 |
-47.59 |
FAM92B |
NM_198491 |
Family with sequence similarity 92, member B |
-45.21 |
DYNLRB2 |
NM_130897 |
Dynein, light chain, roadblock-type 2 |
-44.66 |
SYT16 |
NM_031914 |
Synaptotagmin XVI |
-43.77 |
CSF1R |
NM_005211 |
Colony stimulating factor 1 receptor |
-43.55 |
UNC5C |
NM_003728 |
Unc-5 homolog C |
-42.89 |
RXFP2 |
NM_130806 |
Relaxin/insulin-like family peptide receptor 2 |
-42.77 |
SULT6B1 |
NM_001032377 |
Sulfotransferase family, cytosolic, 6B, member 1 |
-42.23 |
ACRV1 |
NM_001612 |
Acrosomal vesicle protein 1 |
-42.05 |
IPA revealed that “Cancer” was one of the top-ranking diseases, and also that “Cell Morphology”, “Cellular Growth and Proliferation”, “Cellular Development”, “Cellular Movement”, and “Cellular Assembly and Organization” were top-ranking biological functions related to the depletion of CLIC1 (Supplementary Table 1).
Signal pathways and molecular mechanisms regulated by CLIC1 in ESCC cells
IPA showed that the “Toll-like receptor (TLR) signaling pathway” was one of the top-ranked canonical pathways, and also that several genes related to this pathway were up-regulated in CLIC1-depleted KYSE70 cells (Figure 4A, Table 2). In order to verify the data for gene expression profiling, 3 selected genes (MYD88, TLR2, and JUN) were examined in more detail using quantitative RT-PCR. The mRNA expression levels of MYD88, TLR2, and JUN were increased by CLIC1 siRNA transfection in TE5 and KYSE70 cells (Figure 4B). Figure 4A shows that the up-regulation of “JUN” required activation of the JNK pathway. Therefore, we focused on the TLR signaling pathway and MAPK pathway (not only “JNK”, but also “p38 MAPK” and “ERK”), and analyzed the functions of CLIC1 in the control of these pathways. A Western blot analysis revealed that the down-regulation of CLIC1 increased the phosphorylation level of JNK, decreased that of ERK, and did not affect that of p38 MAPK in TE5 and KYSE70 cells (Figure 4C). These results were consistent with those for gene expression profiles and indicated that the TLR signaling pathway and JNK pathway are key mechanisms by which CLIC1 controls cancer cell functions, such as the proliferation and survival of ESCC cells.
Table 2: Toll-like receptor signaling pathway-related genes with expression levels in KYSE70 cells that were changed by the depletion of CLIC1
Toll-like receptor signaling pathway |
|||
|---|---|---|---|
Gene Symbol |
Gene ID |
Gene Name |
Fold Change |
MYD88 |
NM_002468 |
Myeloid differentiation primary response 88 |
80.89 |
LBP |
NM_004139 |
Lipopolysaccharide binding protein |
68.21 |
TLR2 |
NM_003264 |
Toll-like receptor 2 |
24.00 |
IL1B |
NM_000576 |
Interleukin 1, beta |
21.60 |
TNFAIP3 |
NM_006290 |
Tumor necrosis factor, alpha-induced protein 3 |
13.05 |
MAP2K6 |
NM_002758 |
Mitogen-activated protein kinase kinase 6 |
10.02 |
TNF |
NM_000594 |
Tumor necrosis factor |
8.25 |
UBD |
NM_006398 |
Ubiquitin D |
5.47 |
NFKB2 |
NM_001288724 |
Nuclear factor of kappa light polypeptide gene enhancer in B-cells 2 |
5.17 |
LY96 |
NM_015364 |
Lymphocyte antigen 96 |
4.25 |
IL1A |
NM_000575 |
Interleukin 1, alpha |
3.79 |
JUN |
NM_002228 |
Jun proto-oncogene |
3.10 |
IL33 |
NM_033439 |
Interleukin 33 |
-4.15 |
PPARA |
NM_005036 |
Peroxisome proliferator-activated receptor alpha |
-4.31 |
TLR3 |
NM_003265 |
Toll-like receptor 3 |
-7.79 |
TLR10 |
NM_030956 |
Toll-like receptor 10 |
-8.67 |
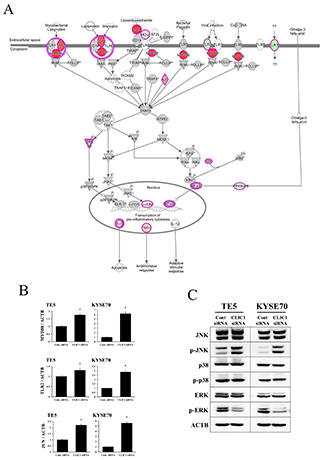
Figure 4: Top-ranked signaling pathway related to CLIC1 down-regulation according to an Ingenuity Pathway Analysis. (A) The Toll-like receptor (TLR) signaling pathway was one of the top-ranked canonical pathways, and several genes related to this pathway were up-regulated in CLIC1-depleted KYSE70 cells. (B) Verification of gene expression by real-time quantitative RT-PCR. The expression levels of three selected genes (MYD88, TLR2, and JUN) in CLIC1-depleted TE5 and KYSE70 cells were compared to those in control siRNA-transfected cells using real-time quantitative RT-PCR. Gene expression levels were normalized to the level of ACTB. Mean±SEM. n=3. *p<0.05 (significantly different from control siRNA). (C) Detection of the phosphorylation of JNK, p38, and ERK in CLIC1-knockdown TE5 and KYSE70 cells. Western blotting revealed that the down-regulation of CLIC1 activated the JNK pathway and inhibited the ERK pathway.
Immunohistochemical analysis of CLIC1 expression in ESCC tumors
Immunohistochemistry for the CLIC1 protein revealed that CLIC1 expression was mainly observed in the cytoplasm of the lower layers of the non-cancerous esophageal epithelia, with the exception of the basal and parabasal cell layers (Figure 5A, Supplementary Figure 1A). In ESCC tissues, the CLIC1 protein was mainly expressed in the cytoplasm of cancer cells (Figure 5B). The CLIC1 expression levels of immunohistochemically stained samples were graded semi-quantitatively based on staining intensity and the percentage of positive tumor cells in the magnification ×100. Staining intensity was scored as either 0 (no staining), 1 (weakly staining), 2 (moderately staining), or 3 (strongly staining) (Figure 5C-5F, Supplementary Figure 1B-1E). Since in the normal esophageal epithelia, CLIC1 expression of their lower layers was mainly weakly staining, or the staining intensity score of 1 (Figure 5A, Supplementary Figure 1A), we focused on the region of the staining intensity score of 2 or 3 in ESCC tissues. We found the heterogeneity in the same ESCC tissue (Supplementary Figure 2). Therefore, the proportion of the staining intensity score of 2 or 3 was recorded as the “CLIC1 IHC score”. The median CLIC1 IHC score was 0.3 (range=0-1; mean±standard deviation (SD) = 0.42±0.36).
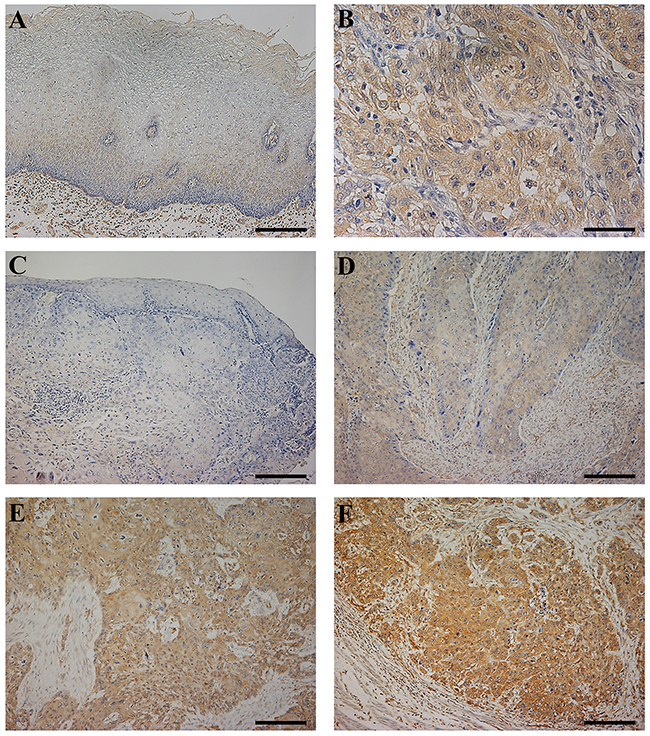
Figure 5: CLIC1 protein expression in human esophageal squamous cell carcinoma (ESCC). (A) Immunohistochemical staining of non-cancerous esophageal epithelia with the CLIC1 antibody. Magnification: ×100. Bar 200 μm. Cells expressing CLIC1 were primarily confined to the lower layer of the squamous epithelium with the exception of the basal and parabasal cell layers. CLIC1 expression of their lower layers was mainly weakly staining. (B) Immunohistochemical staining of primary human ESCC samples with the CLIC1 antibody. Magnification: ×400. Bar 50 μm. In ESCC cells, CLIC1 was expressed mainly in the cytoplasm. (C-F) Photomicrographs of CLIC1 immunohistochemistry are shown with examples of an intensity score of 0 (C), 1 (D), 2 (E), and 3 (F). Magnification: ×100. Bar 200 μm.
Patients were initially categorized into a very strong CLIC1 expression group (IHC score ≥0.9, n=9) and the other (IHC score <0.9, n=52). In this analysis, no correlation was observed between clinicopathological features and the very strong expression of CLIC1 (Table 3). The 5-year overall survival rate of the very strong CLIC1 expression group was 44.4%, which was significantly poorer than that of the other group (69.8%) (p=0.041) (Figure 6B). These results support a relationship between the expression of CLIC1 and cell proliferation and apoptosis in in vitro experiments.
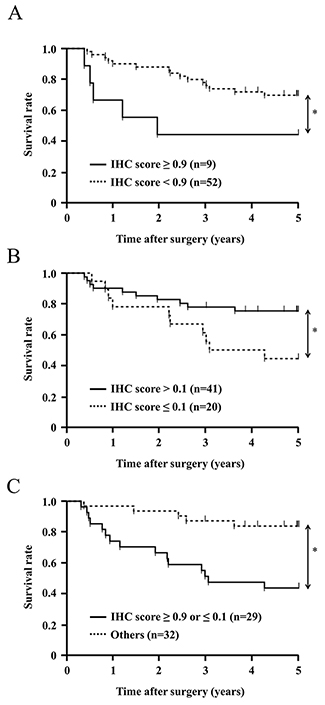
Figure 6: Survival curve of patients after curative resection for ESCC according to the expression of CLIC1. All patients were classified into two groups: (A) CLIC1 IHC score ≥0.9 (n=9), and CLIC1 IHC score <0.9 (n=52) in the tumor. (B) CLIC1 IHC score >0.1 (n=41), and CLIC1 IHC score ≤0.1 (n=20) in the tumor. (C) CLIC1 IHC score ≥0.9 or ≤0.1 (n=29), and CLIC1 IHC score <0.9 and >0.1 (n=32) in the tumor. *p<0.05: Log-rank test.
Table 3: Relationships between clinicopathological features of ESCC and CLIC1 expression
Variable |
IHC score |
p value * |
IHC score |
p value * |
||
|---|---|---|---|---|---|---|
< 0.9 |
≥ 0.9 |
≤ 0.1 |
> 0.1 |
|||
(n=52) |
(n=9) |
(n=20) |
(n=41) |
|||
Gender |
||||||
Male |
44 |
8 |
0.739 |
17 |
35 |
0.97 |
Female |
8 |
1 |
3 |
6 |
||
Age |
||||||
<65 years |
32 |
3 |
0.114 |
15 |
20 |
0.048 |
≥65 years |
20 |
6 |
5 |
21 |
||
Recurrence |
||||||
Positive |
19 |
5 |
0.281 |
10 |
14 |
0.236 |
Negative |
33 |
4 |
10 |
27 |
||
Tumor length |
||||||
<50 cm |
36 |
5 |
0.42 |
13 |
28 |
0.798 |
≥50 cm |
16 |
4 |
7 |
13 |
||
Histological type |
||||||
Well/Moderately |
37 |
7 |
0.682 |
10 |
34 |
0.008 |
Poorly |
15 |
2 |
10 |
7 |
||
Lymphatic invasion |
||||||
Negative |
24 |
5 |
0.602 |
10 |
19 |
0.583 |
Positive |
28 |
4 |
10 |
22 |
||
Venous invasion |
||||||
Negative |
26 |
6 |
0.355 |
11 |
21 |
0.781 |
Positive |
26 |
3 |
9 |
20 |
||
Pathological depth of the tumor |
||||||
pT1 |
22 |
5 |
0.46 |
8 |
19 |
0.639 |
pT2-3 |
30 |
4 |
12 |
22 |
||
Pathological lymph node metastasis |
||||||
pN0 |
22 |
5 |
0.46 |
7 |
20 |
0.306 |
pN1-3 |
30 |
4 |
13 |
21 |
||
* Fisher’s exact test.
Patients were then categorized into a very weak CLIC1 expression group (IHC score ≤0.1, n=20) and the other (IHC score >0.1, n=41). The very weak expression of CLIC1 correlated with age and histological type, but not with other clinicopathological variables, including gender, recurrence, tumor length, lymphatic invasion, venous invasion, pathological depth of the tumor, and pathological lymph node metastasis (Table 3). The 5-year overall survival rate of the very weak CLIC1 expression group was 42.4%, which was significantly poorer than that of the other group (77.4%) (p=0.034) (Figure 6A). These results support the depletion of CLIC1 promoting cellular movement in in vitro experiments.
Furthermore, Patients were categorized into three following groups; the very strong CLIC1 expression group (IHC score ≥0.9, n=9), the middle CLIC1 expression group (0.1< IHC score <0.9, n=32) and the very weak CLIC1 expression group (IHC score ≤0.1, n=20). The 5-year overall survival rate of the very strong CLIC1 expression group and that of the very weak CLIC1 expression group were significantly poorer than that of the middle CLIC1 expression group (Supplementary Figure 3).
We investigated whether the very strong or very weak expression of CLIC1 was prognostic for ESCC patients after curative resection. The univariate analysis showed that the presence of lymphatic invasion, venous invasion, and the pathological depth of the tumor correlated with a poor 5-year overall survival rate. The 5-year overall survival rate of the very strong or very weak CLIC1 expression group was 44.8%, which was significantly poorer than that of the other group (84.2%) (p=0.001). A multivariate analysis with these three factors and an IHC score ≥0.9 or ≤0.1 revealed that the very strong or very weak expression of CLIC1 was an independent prognostic factor (Table 4). These results suggest that very strong or very weak expression of CLIC1 in ESCC tissues is related to the poor prognosis of patients with ESCC after curative resection.
Table 4: Five-year overall survival rates of patients with ESCC according to various clinicopathological parameters
Variable |
Univariate |
Multivariate |
||||
|---|---|---|---|---|---|---|
n=61 |
5-year OS rate (%) |
p value * |
HR |
95% CI |
p value ** |
|
Gender |
||||||
Male |
52 |
64.6 |
0.538 |
|||
Female |
9 |
75 |
||||
Age |
||||||
<65 years |
26 |
76 |
0.182 |
|||
≥65 years |
35 |
58.8 |
||||
Tumor length |
||||||
<50 cm |
41 |
67.1 |
0.591 |
|||
≥50 cm |
20 |
64.3 |
||||
Histological type |
||||||
Well/Moderately |
44 |
71.6 |
0.192 |
|||
Poorly |
17 |
52.9 |
||||
Lymphatic invasion |
||||||
Positive |
32 |
57.9 |
0.099 |
2.51 |
0.921-7.374 |
0.0724 |
Negative |
29 |
74.8 |
||||
Venous invasion |
||||||
Positive |
32 |
52.5 |
0.045 |
3.203 |
1.206-9.175 |
0.0192 |
Negative |
29 |
77.6 |
||||
Pathological depth of the tumor |
||||||
pT1 |
27 |
77.4 |
0.054 |
2.694 |
0.964-8.299 |
0.0589 |
pT2-3 |
34 |
56.6 |
||||
Pathological lymph node metastasis |
||||||
pN0 |
27 |
73.5 |
0.207 |
|||
pN1-3 |
34 |
59.7 |
||||
IHC score |
||||||
≤ 0.1 or ≥ 0.9 |
29 |
44.8 |
0.001 |
10.31 |
3.542-35.70 |
<0.0001 |
Others |
32 |
84.2 |
||||
OS: overall survival; HR: hazard ratio; CI: confidence interval.
* Log-rank test. ** Cox’s proportional hazards model.
DISCUSSION
Recent studies have shown that CLIC1 is present in various tumor tissues, and demonstrated the expression and role of CLIC1 during tumor development in various cancers, including gastric cancer [9-11], colonic cancer [8, 12], hepatic cancer [13-15], gallbladder cancer [16, 17], pancreatic cancer [18], lung cancer [19], prostate cancer [20], ovarian cancer [21, 22], and glioblastoma [23]. However, the expression of CLIC1 in human ESCC tissues and the pathophysiological role of its expression in ESCC cells currently remain unclear.
The expression of CLIC1 correlates with cell proliferation and apoptosis in several cancers. Ma PF et al. [10] showed that the strong expression of CLIC1 inhibited cell proliferation and enhanced apoptosis in gastric cancer cells. Lu J et al. [18] reported that the depletion of CLIC1 inhibited cell proliferation and enhanced apoptosis in pancreatic cancer cells. In the present study, we demonstrated that the depletion of CLIC1 inhibited cell proliferation and enhanced apoptosis in ESCC cells. A cell cycle analysis revealed that the down-regulation of CLIC1 increased the number of cells in the sub-G1 phase in ESCC cells. These results indicate that the expression of CLIC1 influences apoptosis in ESCC cells.
In order to investigate the molecular mechanisms underlying the roles of CLIC1 expression in tumor progression and apoptosis, microarrays and a pathway analysis using IPA were performed using CLIC1 siRNA-transfected KYSE70 cells. The results obtained revealed that the TLR signaling pathway was one of the top-ranked canonical pathways, and also that “MYD88” and “TLR2” were strongly up-regulated genes. Previous studies reported that the TLR signaling pathway correlated with apoptosis. Krysko DV et al. [30] identified TLR2 and TLR9 as sensors of apoptosis. Zou et al. [31] showed that the up-regulation of TLR2/MYD88 induced the activation of c-Jun via the mitogen-activated protein kinase (MAPK)/JNK pathway, and then induced apoptosis. Zhao et al. [32] demonstrated that activating the MAPK/JNK pathway induced autophagy and apoptotic cell death in colonic cancer cells. The present results revealed that the depletion of CLIC1 activated the TLR2/MYD88 pathway and MAPK/JNK pathway, and induced apoptosis in TE5 and KYSE70 ESCC cells. This is the first study to show that the expression of CLIC1 may influence the activation of the TLR2/JNK pathway in ESCC cells.
Previous studies reported that the expression of CLIC1 had a crucial influence on ERK and p38, which are the other main subgroups of MAPKs. Wang P et al. [12] and Tian Y et al. [20] showed that the down-regulation of CLIC1 suppressed cell migration and invasion via the MAPK/ERK pathway in colonic and prostate cancer cells. Zhao W et al. [11] found that the overexpression of CLIC1 induced cell migration and invasion via the p38 MAPK pathway in gastric cancer cells. The present results revealed that the depletion of CLIC1 promoted cell migration and invasion, suppressed the MAPK/ERK pathway, and had no influence on the p38 MAPK pathway in ESCC cells. Therefore, the molecular mechanisms underlying cell migration and invasion in CLIC1-depleted ESCC cells appear to differ from those in other CLIC1-regulated cancer cells. The main cause of the difference among ESCC and other cancers remains unknown, and further investigations on the underlying molecular mechanisms are needed.
Previous immunohistochemical studies showed that the expression of CLIC1 in human tumor tissue samples was associated with the clinicopathological features and prognosis of patients. Chen CD et al. [9] examined 56 samples from gastric cancer patients and showed that metastasis correlated with CLIC1 expression, and also that the strong expression group had a significantly poorer prognosis than the weak expression group. Zhang S et al. [13] examined 85 samples from hepatic tumor patients and showed that the strong expression of CLIC1 correlated with tumor size, distant metastasis, and a poor survival. Ding Q et al. [17] examined 75 samples from gallbladder cancer patients and found that the overexpression of CLIC1 was associated with the histological type, perineural invasion, and poor prognosis. Lu J et al. [18] examined 75 samples from pancreatic cancer patients and demonstrated that the strong expression of CLIC1 was associated with the histological type, tumor size, and poor prognosis. Our immunohistochemical study revealed no relationship between the very strong expression of CLIC1 and clinicopathological features; however, the 5-year overall survival rate was significantly poorer in the very strong CLICI expression group than in the other group and the very strong expression of CLIC1 was an independent prognostic factor in ESCC tissues. On the other hand, the immunohistochemical investigation also revealed that the very weak expression of CLIC1 was associated with lymphatic metastasis, the 5-year overall survival rate was significantly poorer in the very weak CLICI expression group than in the other group, and the very weak expression of CLIC1 was an independent prognostic factor in human ESCC tissues. In in vitro experiments with ESCC cells, the expression of CLIC1 regulated tumor behaviors, including cell proliferation, apoptosis, and cellular movement, and our immunohistochemical results supported those obtained in in vitro experiments; that is, the group of very strong CLIC1 expression was poorer prognosis due to inhibiting apoptosis of ESCC cells, and the group of very weak CLIC1 expression was poorer prognosis due to promoting cell movement of ESCC cells. In short, our results indicate that CLIC1 expression levels are related to the switching of the tumor behaviors of ESCC. Although a deeper understanding of CLIC1 expression and its heterogeneity in biopsy specimen is needed, further analyses may be helpful in the clinical use of CLIC1 IHC score as a preoperative biomarker in future.
In summary, we herein demonstrated that CLIC1 plays a role in the proliferation, apoptosis, and cellular movement of ESCC cells. Our microarray data also showed that CLIC1 affects the expression of other genes with functions related to cell proliferation and apoptosis. Immunohistochemistry revealed that the very strong or weak expression of CLIC1 in human ESCC tissue was related to the prognosis of ESCC patients. Although further investigations on the underlying molecular mechanisms are needed, the present results suggest that CLIC1 is a useful biomarker of tumor progression and/or a novel therapeutic target for the future treatment of ESCC.
MATERIALS AND METHODS
Cell lines, antibodies, and other reagents
The poorly differentiated human ESCC cell lines, TE2, TE5, and TE9, moderately differentiated human ESCC cell line, TE8, and well-differentiated human ESCC cell line, TE15, were obtained from the Cell Resource Center of Biomedical Research Institute of Development, Aging, and Cancer (Tohoku University, Sendai, Japan). The poorly differentiated human ESCC cell lines, KYSE70 and KYSE150, moderately differentiated human ESCC cell line, KYSE170, and well-differentiated human ESCC cell line, KYSE790, were obtained from Kyoto University (Kyoto, Japan). These cells were grown in RPMI-1640 medium (Nacalai Tesque, Kyoto, Japan) supplemented with 100 U/mL of penicillin, 100 μg/mL of streptomycin, and 10% fetal bovine serum (FBS). Cells were cultured in flasks and dishes in a humidified incubator at 37ºC under 5% CO2 in air.
The following antibodies were used in the present study: a mouse monoclonal CLIC1 antibody (Abcam, Cambridge, MA, UK), rabbit monoclonal c-Jun N-terminal kinase (JNK), phosphorylated JNK, extracellular signal-regulated kinase (ERK), phosphorylated ERK, p38, phosphorylated p38, snail, β-catenin, caspase 3, cleaved caspase 3, and Bcl-2 antibodies, mouse monoclonal E-cadherin and vimentin antibodies, horseradish peroxidase (HRP)-conjugated mouse and anti-rabbit secondary antibodies (Cell Signaling Technology, Beverly, MA, UK), a claudin 1 antibody (Zymed Laboratories, San Francisco, CA, USA), and monoclonal Anti-β-actin (mouse IgG1 isotype) antibody (Sigma-Aldrich, St. Louis, MO, USA).
siRNA transfection
Cells were transfected with 12 nmol/L CLIC1 siRNA (Stealth RNAi siRNA #HSS101987, Invitrogen, Carlsbad, CA, USA) using the Lipofectamine RNAiMAX reagent (Invitrogen), according to the manufacturer’s instructions. Medium containing siRNA was replaced with fresh medium after 24 h. Control siRNA (Stealth RNAi siRNA Negative Control; Invitrogen) was used as a negative control.
Protein studies
Cells were lysed with M-PER lysis buffer, sonicated, and then centrifuged at 15,000 rpm for 10 min at 4ºC to obtain supernatants (cell lysates). Protein concentrations were measured using the Protein Assay Rapid Kit (Wako Pure Chemical Industries, Osaka, Japan). After SDS-PAGE, proteins were transferred onto polyvinylidene difluoride (PVDF) membranes. The membranes were then incubated with appropriate primary antibodies at 4ºC overnight. The antibody complexes were visualized by an enhanced chemiluminescence detection system (ImageQuant LAS 4000 mini; GE Healthcare, Buckinghamshire, UK), as directed by the manufacturer. A densitometric analysis was performed using ImageQuant TL (GE Healthcare), and the band intensity of each protein was normalized by that of β-actin for each cell line.
Real-time quantitative RT-PCR
Total RNA was extracted using an RNeasy kit (Qiagen, Valencia, CA, USA). Messenger RNA (mRNA) expression was measured by quantitative real-time PCR (7300 Real-Time PCR System; Applied Biosystems, Foster City, CA, USA) using TaqMan Gene Expression Assays (Applied Biosystems) according to the manufacturer’s instructions.
Expression levels were measured for the following genes: CLIC1 (Hs00559461_m1), MYD88 (Hs01573837_g1), TLR2 (Hs02621280_s1), JUN (Hs01103582_s1), Bcl2 (Hs00608023_m1), CDH1 (Hs00170423_m1), VIM (Hs00185584_m1), SNAI1 (Hs00195591_m1), CTNNB1 (Hs00355049_m1), and CLDN1 (Hs00221623_m1) (Applied Biosystems). The expression of each gene was normalized against the housekeeping gene β-actin (ACTB, Hs01060665_g1; Applied Biosystems). Each assay was performed in triplicate.
Cell proliferation
Cells were seeded on six-well plates at a density of 0.5×10⁵ cells per well and incubated at 37ºC with 5% CO2. siRNA transfection was performed 24 h after cell seeding. Cells were detached from the flasks 48 and 72 h after siRNA transfection using 0.5 ml trypsin–EDTA solution, diluted in 1.5 ml RPMI medium, and then counted with a hemocytometer.
Cell cycle analysis
The cell cycle phase was evaluated 72 h after siRNA transfection by fluorescence-activated cell scoring (FACS). Briefly, cells were treated with Triton X-100 and RNase, and nuclei were stained with propidium iodide (PI) prior to the measurement of DNA content using BD Accuri C6 FACS (BD Biosciences, Franklin Lakes, NJ). At least 30,000 cells were analyzed.
Analysis of apoptotic cells
Cells were harvested 72 h after siRNA transfection and stained with fluorescein isothiocyanate-conjugated annexin V and phosphatidylinositol using the annexin V kit (Beckman Coulter, Brea, CA, USA) according to the manufacturer’s protocol. The proportion of apoptotic cells was analyzed by flow cytometry with BD Accuri C6 (BD Biosciences).
Patients and primary tissue samples
Histologically proven primary ESCC tumor samples were obtained from 61 consecutive patients who underwent esophagectomy (potentially curative R0 resection) at Kyoto Prefectural University of Medicine (Kyoto, Japan) between 1998 and 2009. Tumor samples were embedded in paraffin after formalin fixation for 12 h. Patient eligibility criteria were as follows: (1) the presence of ESCC, (2) the absence of synchronous or metachronous cancers, and (3) a lack of preoperative radiation therapy. All patients gave written informed consent. Relevant clinicopathological and survival data were obtained from hospital records. Cancer recurrence was noted in 24 patients (39.3%) during the follow-up period. The initial recurrence pattern detected by imaging studies was classified as locoregional, distant, or both sites. Nineteen patients (31.2%) died of cancer recurrence, and 1 (1.6%) of another disease. The median follow-up period of all patients was 62.0 months (range, 4–157 months). Staging was primarily based on the International Union Against Cancer (UICC)/TNM Classification of Malignant Tumors (7th edition).
Immunohistochemistry
Paraffin sections (thickness of 4 μm) of tumor tissues were subjected to immunohistochemical staining for the CLIC1 protein using the avidin-biotin-peroxidase complex method. Briefly, paraffin sections were dewaxed in xylene and hydrated through a graded series of alcohols. Antigen retrieval was not performed. Endogenous peroxidases were quenched by incubating the sections for 30 min in 0.3 % H2O2. Sections were then treated with a protein blocker and incubated at 4°C overnight with the anti-CLIC1 (1:3000) antibody diluted in PBS. The avidin-biotin-peroxidase complex system (Vectastain ABC Elite kit; Vector Laboratories, Burlingame, CA, USA) was used with diaminobenzidine tetrahydrochloride for color development. Sections were counterstained with hematoxylin, dehydrated through a graded series of alcohols, cleared in xylene, and then mounted.
CLIC1 expression levels of immunohistochemically stained samples were graded semi-quantitatively, considering both the staining intensity and percentage of positive tumor cells. Staining intensity was scored as either 0 (no staining), 1 (weakly staining), 2 (moderately staining), or 3 (strongly staining). The proportion of the staining intensity score of 2 or 3 was recorded as the “CLIC1 IHC score”.
Microarray sample preparation and hybridization
KYSE70 cells were transfected with control siRNA and CLIC1 siRNA (n = 1). Total RNA was extracted 48 h after siRNA transfection using an RNeasy kit (Qiagen). RNA quality was monitored with an Agilent 2100 Bioanalyzer (Agilent Technologies, Santa Clara, CA, USA). Cyanine-3 (Cy3)-labeled cRNA was prepared from 0.1 μg of total RNA using a Low Input Quick Amp Labeling Kit (Agilent) according to the manufacturer’s instructions. Samples were purified using RNeasy columns (Qiagen). A total of 0.60 μg of Cy3-labeled cRNA was fragmented and hybridized to an Agilent SurePrint G3 Human Gene Expression 8 × 60 K ver 2.0 Microarray for 17 h. Slides were washed and scanned immediately on an Agilent DNA Microarray Scanner (G2565CA) using the one-color scan setting for 8 × 60 K array slides.
Processing of microarray data
Scanned images were analyzed with Feature Extraction Software 10.10 (Agilent) using default parameters to obtain background-subtracted and spatially detrended Processed Signal intensities. Signal transduction networks were analyzed using Ingenuity Pathway Analysis (IPA) software (Ingenuity Systems, Inc., Redwood City, CA, USA).
Statistical analysis
Chi-squared or Fisher’s exact tests were used to evaluate differences between proportions, and the Student’s t-test was used to evaluate continuous variables. Survival curves were constructed by the Kaplan–Meier method, and differences in survival were examined using the Log-rank test. Cox’s proportional hazard model was used to identify prognostic factors. Differences were considered significant when the relevant p value was <0.05. These analyses were performed using the JMP statistical software package (JMP, version 12, SAS Institute Inc., Cary, NC, USA).
ACKNOWLEDGMENTS
This work was supported by a Grant-in-Aid for Scientific Research (C) (17K10602, 17K10710) and Grants-in-Aid for Young Scientists (B) (17K16576) from the Japan Society for the Promotion of Science.
CONFLICTS OF INTEREST
None of the authors have any conflicts of interest or financial ties to disclose.
REFERENCES
1. Valenzuela SM, Martin DK, Por SB, Robbins JM, Warton K, Bootcov MR, Schofield PR, Campbell TJ, Breit SN. Molecular cloning and expression of a chloride ion channel of cell nuclei. J Biol Chem. 1997; 272:12575-12582.
2. Tulk BM, Kapadia S, Edwards JC. CLIC1 inserts from the aqueous phase into phospholipid membranes, where it functions as an anion channel. Am J Physiol Cell Physiol. 2002; 282:C1103-1112.
3. Harrop SJ, DeMaere MZ, Fairlie WD, Reztsova T, Valenzuela SM, Mazzanti M, Tonini R, Qiu MR, Jankova L, Warton K, Bauskin AR, Wu WM, Pankhurst S, et al. Crystal structure of a soluble form of the intracellular chloride ion channel CLIC1 (NCC27) at 1.4-A resolution. J Biol Chem. 2001; 276:44993-45000.
4. Goodchild SC, Angstmann CN, Breit SN, Curmi PM, Brown LJ. Transmembrane extension and oligomerization of the CLIC1 chloride intracellular channel protein upon membrane interaction. Biochemistry. 2011; 50:10887-10897.
5. Averaimo S, Milton RH, Duchen MR, Mazzanti M. Chloride intracellular channel 1 (CLIC1): sensor and effector during oxidative stress. FEBS Lett. 2010; 584:2076-2084.
6. Okada Y. Ion channels and transporters involved in cell volume regulation and sensor mechanisms. Cell Biochem Biophys. 2004; 41:233-258.
7. Jiang L, Salao K, Li H, Rybicka JM, Yates RM, Luo XW, Shi XX, Kuffner T, Tsai VW, Husaini Y, Wu L, Brown DA, Grewal T, et al. Intracellular chloride channel protein CLIC1 regulates macrophage function through modulation of phagosomal acidification. J Cell Sci. 2012; 125:5479-5488.
8. Wang P, Zhang C, Yu P, Tang B, Liu T, Cui H, Xu J. Regulation of colon cancer cell migration and invasion by CLIC1-mediated RVD. Mol Cell Biochem. 2012; 365:313-321.
9. Chen CD, Wang CS, Huang YH, Chien KY, Liang Y, Chen WJ, Lin KH. Overexpression of CLIC1 in human gastric carcinoma and its clinicopathological significance. Proteomics. 2007; 7:155-167.
10. Ma PF, Chen JQ, Wang Z, Liu JL, Li BP. Function of chloride intracellular channel 1 in gastric cancer cells. World J Gastroenterol. 2012; 18:3070-3080.
11. Zhao W, Lu M, Zhang Q. Chloride intracellular channel 1 regulates migration and invasion in gastric cancer by triggering the ROS-mediated p38 MAPK signaling pathway. Mol Med Rep. 2015; 12:8041-8047.
12. Wang P, Zeng Y, Liu T, Zhang C, Yu PW, Hao YX, Luo HX, Liu G. Chloride intracellular channel 1 regulates colon cancer cell migration and invasion through ROS/ERK pathway. World J Gastroenterol. 2014; 20:2071-2078.
13. Zhang S, Wang XM, Yin ZY, Zhao WX, Zhou JY, Zhao BX, Liu PG. Chloride intracellular channel 1 is overexpression in hepatic tumor and correlates with a poor prognosis. APMIS. 2013; 121:1047-1053.
14. Wei X, Li J, Xie H, Wang H, Wang J, Zhang X, Zhuang R, Lu D, Ling Q, Zhou L, Xu X, Zheng S. Chloride intracellular channel 1 participates in migration and invasion of hepatocellular carcinoma by targeting maspin. J Gastroenterol Hepatol. 2015; 30:208-216.
15. Li RK, Zhang J, Zhang YH, Li ML, Wang M, Tang JW. Chloride intracellular channel 1 is an important factor in the lymphatic metastasis of hepatocarcinoma. Biomed Pharmacother. 2012; 66:167-172.
16. Wang JW, Peng SY, Li JT, Wang Y, Zhang ZP, Cheng Y, Cheng DQ, Weng WH, Wu XS, Fei XZ, Quan ZW, Li JY, Li SG, et al. Identification of metastasis-associated proteins involved in gallbladder carcinoma metastasis by proteomic analysis and functional exploration of chloride intracellular channel 1. Cancer Letters. 2009; 281:71-81.
17. Ding Q, Li M, Wu X, Zhang L, Wu W, Ding Q, Weng H, Wang X, Liu Y. CLIC1 overexpression is associated with poor prognosis in gallbladder cancer. Tumour Biol. 2015; 36:193-198.
18. Lu J, Dong Q, Zhang B, Wang X, Ye B, Zhang F, Song X, Gao G, Mu J, Wang Z, Ma F, Gu J. Chloride intracellular channel 1 (CLIC1) is activated and functions as an oncogene in pancreatic cancer. Med Oncol. 2015; 32:616.
19. Wang W, Xu X, Wang W, Shao W, Li L, Yin W, Xiu L, Mo M, Zhao J, He Q, He J. The expression and clinical significance of CLIC1 and HSP27 in lung adenocarcinoma. Tumour Biol. 2011; 32:1199-1208.
20. Tian Y, Guan Y, Jia Y, Meng Q, Yang J. Chloride intracellular channel 1 regulates prostate cancer cell proliferation and migration through the MAPK/ERK pathway. Cancer Biother Radiopharm. 2014; 29:339-344.
21. Qu H, Chen Y, Cao G, Liu C, Xu J, Deng H, Zhang Z. Identification and validation of differentially expressed proteins in epithelial ovarian cancers using quantitative proteomics. Oncotarget. 2016; 7:83187-83199. https://doi.org/10.18632/oncotarget.13077.
22. Ye Y, Yin M, Huang B, Wang Y, Li X, Lou G. CLIC1 a novel biomarker of intraperitoneal metastasis in serous epithelial ovarian cancer. Tumour Biol. 2015; 36:4175-4179.
23. Setti M, Savalli N, Osti D, Richichi C, Angelini M, Brescia P, Fornasari L, Carro MS, Mazzanti M, Pelicci G. Functional role of CLIC1 ion channel in glioblastoma-derived stem/progenitor cells. J Natl Cancer Inst. 2013; 105:1644-1655.
24. Valenzuela SM, Mazzanti M, Tonini R, Qiu MR, Warton K, Musgrove EA, Campbell TJ, Breit SN. The nuclear chloride ion channel NCC27 is involved in regulation of the cell cycle. J Physiol. 2000; 529 Pt 3:541-552.
25. Shiozaki A, Nako Y, Ichikawa D, Konishi H, Komatsu S, Kubota T, Fujiwara H, Okamoto K, Kishimoto M, Marunaka Y, Otsuji E. Role of the Na (+)/K (+)/2Cl(-) cotransporter NKCC1 in cell cycle progression in human esophageal squamous cell carcinoma. World J Gastroenterol. 2014; 20:6844-6859.
26. Shiozaki A, Takemoto K, Ichikawa D, Fujiwara H, Konishi H, Kosuga T, Komatsu S, Okamoto K, Kishimoto M, Marunaka Y, Otsuji E. The K-Cl cotransporter KCC3 as an independent prognostic factor in human esophageal squamous cell carcinoma. Biomed Res Int. 2014; 2014:936401.
27. Shiozaki A, Kudou M, Ichikawa D, Shimizu H, Arita T, Kosuga T, Konishi H, Komatsu S, Fujiwara H, Okamoto K, Kishimoto M, Marunaka Y, Otsuji E. Expression and role of anion exchanger 1 in esophageal squamous cell carcinoma. Oncotarget. 2017; 8:17921-17935. https://doi.org/10.18632/oncotarget.14900.
28. Hikami S, Shiozaki A, Kitagawa-Juge M, Ichikawa D, Kosuga T, Konishi H, Komatsu S, Fujiwara H, Okamoto K, Otsuji E. The role of cIAP1 and XIAP in apoptosis induced by tumor necrosis factor alpha in esophageal squamous cell carcinoma cells. Dig Dis Sci. 2017; 62:652-659.
29. Shimizu H, Shiozaki A, Ichikawa D, Fujiwara H, Konishi H, Ishii H, Komatsu S, Kubota T, Okamoto K, Kishimoto M, Otsuji E. The expression and role of Aquaporin 5 in esophageal squamous cell carcinoma. J Gastroenterol. 2014; 49:655-666.
30. Krysko DV, Kaczmarek A, Krysko O, Heyndrickx L, Woznicki J, Bogaert P, Cauwels A, Takahashi N, Magez S, Bachert C, Vandenabeele P. TLR-2 and TLR-9 are sensors of apoptosis in a mouse model of doxorubicin-induced acute inflammation. Cell Death Differ. 2011; 18:1316-1325.
31. Zhou X, Hong T, Yu Q, Nie S, Gong D, Xiong T, Xie M. Exopolysaccharides from Lactobacillus plantarum NCU116 induce c-Jun dependent Fas/Fasl-mediated apoptosis via TLR2 in mouse intestinal epithelial cancer cells. Sci Rep. 2017; 7:14247.
32. Zhao Y, Li ETS, Wang M. Alisol B 23-acetate induces autophagic-dependent apoptosis in human colon cancer cells via ROS generation and JNK activation. Oncotarget. 2017; 8:70239-70249. https://dx.doi.org/10.18632%2Foncotarget.19605
.