

INTRODUCTION
Gastric cancer (GC) is the second most common cancer worldwide and the 4th leading cause of cancer-relative death [1–2]. The 5-year relative survival rates of GC is only approximately 30% and many patients are diagnosed in advanced stage [3–5]. The tumor node metastasis (TNM) staging system is considered as the gold standard for staging GC [6]. Lymph node (LN) metastasis is an important index for assessing TNM staging [7]. The 7th edition TNM staging system recommends that “≥ 16 LNs be assessed pathologically” [8]. In many Western and American cohorts where less extensive lymphadenectomies are performed and in which fewer LNs are examined [9–11]. Apparently, this stage based on absolute number of positive LNs is intrinsically susceptible to stage migration, particularly when understaging reflects insufficient lymph node retrieved [12]. Especially in pathological stage III GC, because the LN counts are its main components, stage migration is a very definite possibility. In 2005, David et al. [13] analyzed the relationships between the number of LNs examined and GC survival for the stage subgroups T1/2N0, T1/2N1, T3N0 and T3N1 based on the 6th edition TNM staging system, and reported that the overall survival was highly dependent on the number of LNs examined. However, the relationship between LN count and the outcome of pathological stage III GC patients is still not fully studied. The purpose of this study was to assess the relationship between LN count and the outcome of pathological stage III GC patients to determine the optimal number of LNs that should be examined.
RESULTS
Characteristics and clinical features of patients
From 2004 to 2010, a total of 3,149 patients with pathological stage III GC met our selection criteria, including 2,072 male and 1,347 female. The median age of patients was 62 years (18–93). There were 1,004 patients with stage IIIA, 1,373 with stage IIIB and 1,042 with stage IIIC. The demographics and pathological features of patients are summarized in Table 1. The phase was closely correlated with race, primary site, grade, histologic type, marital status, LNs retrieved and mean of LNs dissected (P < 0.05).
Table 1: Baseline demographic and tumor characteristics of patients with GC in SEER database and make comparison between pIIIA, pIIIB and pIIIC groups
Parameter |
Characteristic |
Total |
IIIA |
IIIB |
IIIC |
P value |
|---|---|---|---|---|---|---|
3419 |
1004 |
1373 |
1042 |
|||
Year of diagnosis |
0.564 |
|||||
2004–2007 |
2016 |
578 (57.6) |
817 (59.5) |
621 (59.6) |
||
2008–2010 |
1403 |
426 (42.4) |
556 (40.5) |
421 (40.4) |
||
Sex |
0.139 |
|||||
Male |
2072 |
606 (60.4) |
857 (62.4) |
609 (58.4) |
||
Female |
1347 |
398 (39.6) |
516 (37.6) |
433 (41.6) |
||
Age |
0.086 |
|||||
< 60 |
1274 |
347 (34.6) |
519 (37.8) |
408 (39.2) |
||
≥ 60 |
2145 |
657 (65.4) |
854 (62.2) |
634 (60.8) |
||
Race |
0.003 |
|||||
White |
2219 |
667 (66.4) |
873 (63.6) |
679 (65.2) |
||
Black |
480 |
163 (16.2) |
190 (13.8) |
127 (12.2) |
||
Others |
720 |
174 (17.3) |
310 (22.6) |
236 (22.6) |
||
Primary Site |
0.000 |
|||||
Cardia, NOS |
764 |
264 (26.3) |
317 (23.1) |
183 (17.6) |
||
Non-cardia |
2361 |
664 (66.1) |
937 (68.2) |
760 (72.9) |
||
Stomach, NOS |
294 |
76 (7.6) |
119 (8.7) |
99 (9.5) |
||
Grade |
0.000 |
|||||
Grade I/II |
683 |
252 (25.1) |
278 (20.2) |
153 (14.7) |
||
Grade III/IV |
2736 |
752 (74.9) |
1095 (79.8) |
889 (85.3) |
||
Histologic type |
0.000 |
|||||
Carcinoma |
264 |
58 (5.8) |
101 (7.4) |
105 (10.1) |
||
Adenocarcinoma |
2142 |
681 (67.8) |
897 (65.3) |
564 (54.1) |
||
Mucinous adenocarcinoma |
117 |
44 (4.4) |
42 (3.1) |
31 (3.0) |
||
Signet ring cell carcinoma |
896 |
221 (22.0) |
333 (24.3) |
342 (32.8) |
||
Marital status |
0.960 |
|||||
Married |
2150 |
622 (62.0) |
873 (63.6) |
655 (62.9) |
||
Divorced |
254 |
72 (7.2) |
104 (7.6) |
78 (7.5) |
||
Single/Separated |
521 |
163 (16.2) |
200 (14.6) |
158 (15.2) |
||
Widowed |
494 |
147 (14.6) |
196 (14.3) |
151 (14.5) |
||
LNs |
0.000 |
|||||
≤ 15 |
1500 |
569 (56.7) |
612 (44.6) |
319 (30.6) |
||
> 15 |
1919 |
435 (43.3) |
761 (55.4) |
723 (69.4) |
||
LNs dissected |
17 (1–89) |
14 (1–79) |
17 (1–89) |
21 (3–80) |
0.000 |
A value of P < 0.05 indicates statistical significance.
The mean of LNs dissected was 17 (1–89), and there were 14 (1–79) LNs dissected in stage IIIA, 17 (1–89) in IIIB and 21 (3–80) in IIIC. The ratio of > 15/(≤ 15 + > 15) LNs examined was 43.87% in this cohort, and the ratio was 43.3% in IIIA, 55.4% in IIIB and 69.4% in IIIC.
Identification of cutoff points for the minimum number of LNs count in pIII GC patients
The 5-year cause specific survival (CSS) were calculated for patients with different LNs count. As shown in Table 2, LN count was a prognosis factor with the numbers from 2 to 24 (except for 1, P = 0.183). The optimal cutoff points for continuous variable LNs was identified by X-tile (Figure 1). The optimal cutoff value for retrieved LNs was 9 (χ2 = 58.163, P < 0.001) and then divided the patients into high and low risk subsets with the 5-year CSS of 15.6% and 24.4% respectively.
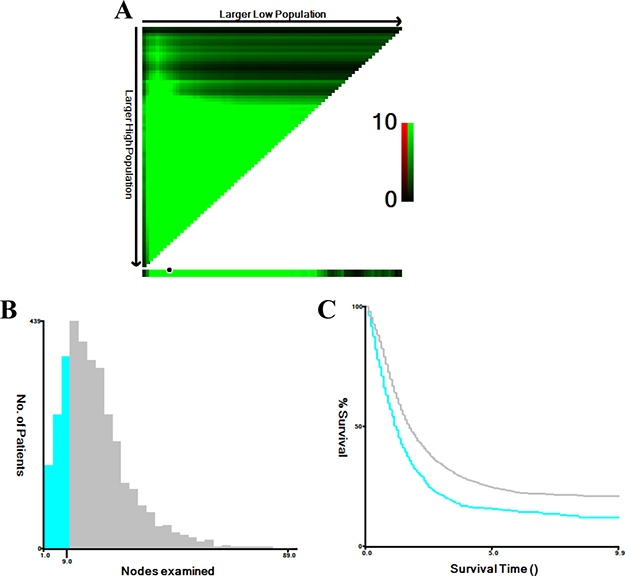
Figure 1: X-tile analysis of survival data from the SEER registry. X-tile analysis was performed using patients’ data from the SEER registry, equally divided into training and validation sets. X-tile plots of the training sets are shown with plots of matched validation sets shown in the smaller inset (A). The optimal cut-point highlighted by the black circle in the left panels is shown on a histogram of the entire cohort (B), and a Kaplan-Meier plot (C). P values were determined using the cutoff point defined in the training set and applying it to the validation set. (The optimal cutoff value for LN count is 9, χ2 = 58.163, P < 0.001).
Table 2: Univariate analysis of the influence of different LN count on CSS in patients with GC in ypIII stage
LNs |
No. |
5-year CCS |
χ2 |
P value |
LNs |
No. |
5-year CCS |
χ2 |
P value |
|---|---|---|---|---|---|---|---|---|---|
≤ 1 |
29 |
17.2% |
1.777 |
0.183 |
≤ 13 |
1227 |
18.5% |
38.929 |
0.000 |
> 1 |
3390 |
22.8% |
> 13 |
2192 |
25.2% |
||||
≤ 2 |
58 |
9.5% |
5.557 |
0.018 |
≤ 14 |
1344 |
18.6% |
38.774 |
0.000 |
> 2 |
3361 |
23.0% |
> 14 |
2075 |
25.5% |
||||
≤ 3 |
101 |
10.5% |
15.961 |
0.000 |
≤ 15 |
1500 |
18.7% |
39.233 |
0.000 |
> 3 |
3318 |
23.1% |
> 15 |
1919 |
25.9% |
||||
≤ 4 |
160 |
10.9% |
29.447 |
0.000 |
≤ 16 |
1626 |
19.3% |
31.726 |
0.000 |
> 4 |
3259 |
23.3% |
> 16 |
1793 |
25.9% |
||||
≤ 5 |
226 |
9.8% |
48.842 |
0.000 |
≤ 17 |
1760 |
19.1% |
39.316 |
0.000 |
> 5 |
3193 |
23.7% |
> 17 |
1659 |
26.7% |
||||
≤ 6 |
307 |
11.7% |
47.631 |
0.000 |
≤ 18 |
1887 |
19.8% |
33.128 |
0.000 |
> 6 |
3112 |
23.9% |
> 18 |
1532 |
26.4% |
||||
≤ 7 |
418 |
13.5% |
52.991 |
0.000 |
≤ 19 |
1989 |
20.2% |
28.815 |
0.000 |
> 7 |
3001 |
24.1% |
> 19 |
1430 |
26.3% |
||||
≤ 8 |
516 |
14.7% |
52.228 |
0.000 |
≤ 20 |
2117 |
20.4% |
26.896 |
0.000 |
> 8 |
2903 |
24.2% |
> 20 |
1302 |
26.7% |
||||
≤ 9 |
660 |
15.6% |
58.163 |
0.000 |
≤ 21 |
2227 |
20.3% |
27.737 |
0.000 |
> 9 |
2759 |
24.4% |
> 21 |
1192 |
27.4% |
||||
≤ 10 |
788 |
16.8% |
50.955 |
0.000 |
≤ 22 |
2337 |
20.4% |
27.517 |
0.000 |
> 10 |
2631 |
24.5% |
> 22 |
1082 |
27.9% |
||||
≤ 11 |
948 |
17.1% |
47.893 |
0.000 |
≤ 23 |
2428 |
20.4% |
31.490 |
0.000 |
> 11 |
2471 |
24.9% |
> 23 |
991 |
28.6% |
||||
≤ 12 |
1089 |
18.4% |
37.425 |
0.000 |
≤ 24 |
2514 |
20.7% |
27.814 |
0.000 |
> 12 |
2330 |
24.8% |
> 24 |
905 |
28.6% |
A value of P < 0.05 indicates statistical significance.
Impact of LNs count on CSS of GC patients in the SEER database
Univariate analysis showed that compared with their counterparts, patients in the group of year of diagnosis (2004–2007), age (≥ 60), race (white), grade (III/IV), histologic type (carcinoma), marital status (widowed), LNs retrieved (≤ 9) or AJCC stage (IIIC) had worse outcomes (all P < 0.05). Multivariate Cox proportional hazards model were used to assess the risk factors for CSS. We found that the year of diagnosis, sex, race, grade, histologic type, marital status, LNs retrieved (with an optimal cutoff value of 9) and AJCC stage were independent prognostic factors (all P < 0.05). LNs retrieved (> 9) had a significant impact on CSS of GC patients in the SEER database (HR: 1.530; 95% CI: 1.389–1.686, P < 0.001) (Table 3).
Table 3: Univariate and multivariate analysis for evaluating the influence of LNs on CSS in patients with ypIII GC
Parameter |
Characteristic |
5-year CCS |
Univariate analysis |
Multivariate analysis |
||
|---|---|---|---|---|---|---|
χ2 test |
P value |
HR (95% CI) |
P value |
|||
Year of diagnosis |
10.205 |
0.001 |
0.036 |
|||
2004–2007 |
20.6% |
Ref |
||||
2008–2010 |
26.3% |
1.089 (1.006~1.180) |
||||
Sex |
3.391 |
0.066 |
NI |
|||
Male |
23.3% |
|||||
Female |
21.9% |
|||||
Age |
114.628 |
0.000 |
0.000 |
|||
< 60 |
31.0% |
Ref |
||||
≥ 60 |
17.9% |
0.640 (0.586~0.698) |
||||
Race |
24.086 |
0.000 |
0.000 |
|||
White |
20.6% |
Ref |
||||
Black |
22.0% |
1.318 (1.193~1.456) |
0.000 |
|||
Others |
29.9% |
1.288 (1.123~1.478) |
0.000 |
|||
Primary Site |
4.942 |
0.084 |
NI |
|||
Cardia, NOS |
19.1% |
|||||
Non-cardia |
24.2% |
|||||
Stomach, NOS |
21.4% |
|||||
Grade |
19.283 |
0.000 |
0.004 |
|||
Grade I/II |
30.2% |
Ref |
||||
Grade III/IV |
20.9% |
0.859 (0.773~0.954) |
||||
Histologic type |
15.995 |
0.001 |
0.009 |
|||
Carcinoma |
17.3% |
Ref |
||||
Adenocarcinoma |
25.2% |
1.092 (0.937~1.272) |
0.260 |
|||
Mucinous adenocarcinoma |
24.4% |
0.887 (0.807~0.974) |
0.012 |
|||
Signet ring cell carcinoma |
18.1% |
0.957 (0.765~1.197) |
0.699 |
|||
Marital status |
50.020 |
0.000 |
0.000 |
|||
Married |
24.4% |
Ref |
||||
Divorced |
17.6% |
0.785 (0.703~0.877) |
0.000 |
|||
Single/Separated |
26.4% |
0.975 (0.822~1.155) |
0.768 |
|||
Widowed |
14.8% |
0.848 (0.732~0.982) |
0.028 |
|||
LNs |
58.163 |
0.000 |
0.000 |
|||
≤ 9 |
15.6% |
Ref |
||||
> 9 |
24.4% |
1.530 (1.389~1.686) |
||||
AJCC stage |
154.496 |
0.000 |
0.000 |
|||
IIIA |
33.2% |
Ref |
||||
IIIB |
22.5% |
0.491 (0.442~0.545) |
0.000 |
|||
IIIC |
12.8% |
0.708 (0.647~0.776) |
0.000 |
|||
A value of P < 0.05 indicates statistical significance.
Subgroup analysis of impact of LNs count on CSS during each pIII stage
Subgroup analysis showed that LN count was a prognosis factor in pIIIA (χ2 = 75.055, P < 0.001), pIIIB (χ2 = 32.464, P < 0.001) and pIIIC (χ2 = 6.903, P = 0.009) (Figure 2) (Tables 4–6). After adjusting variables, the number of LNs was also validated as an independent survival factor in pIIIA (LNs > 9, HR: 1.849, 95% CI: 1.571~2.176, P < 0.001), pIIIB (LNs > 9, HR: 1.414, 95% CI: 1.221~1.636, P < 0.001) and pIIIC (LNs > 9, HR: 1.306, 95% CI: 1.034~1.649, P = 0.025) subgroups by multivariate Cox regression (Tables 4–6).
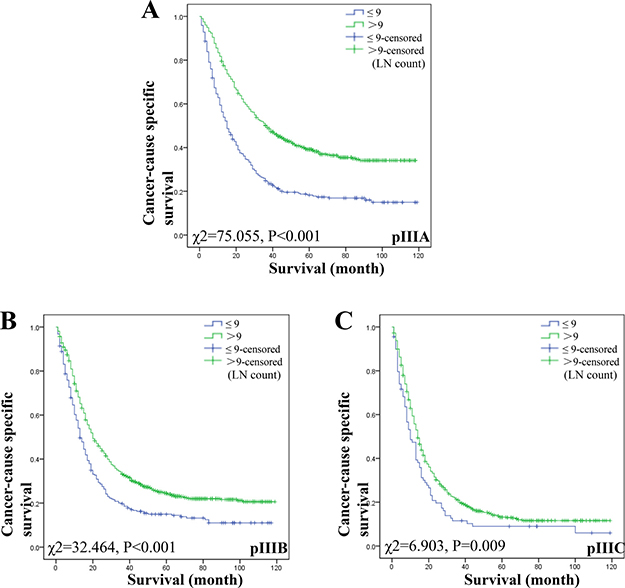
Figure 2: Log-rank tests of CSS comparing GC patients with LN count (≤ 9 VS > 9) for (A) stage pIIIA: χ2 = 75.055, P < 0.001; (B) stage pIIIB: χ2 = 32.464, P < 0.001; and (C) stage pIIIC: χ2 = 6.903, P = 0.009.
Table 4: Univariate and multivariate analysis for evaluating the influence on CSS in patients with ypIIIA GC
Parameter |
Characteristic |
5-year CCS |
Univariate analysis |
Multivariate analysis |
||
|---|---|---|---|---|---|---|
χ2 test |
P value |
HR (95% CI) |
P value |
|||
Year of diagnosis |
4.721 |
0.030 |
0.491 |
|||
2004–2007 |
30.6% |
Ref |
||||
2008–2010 |
36.5% |
1.058 (0.901~1.241) |
||||
Sex |
0.847 |
0.357 |
NI |
|||
Male |
34.1% |
|||||
Female |
31.9% |
|||||
Age |
31.356 |
0.000 |
0.000 |
|||
< 60 |
44.1% |
Ref |
||||
≥ 60 |
27.4% |
0.668 (0.562~0.794) |
||||
Race |
22.006 |
0.000 |
0.002 |
|||
White |
29.2% |
Ref |
||||
Black |
30.9% |
1.510 (1.196~1.906) |
0.001 |
|||
Others |
50.7% |
1.471 (1.106~1.957) |
0.008 |
|||
Primary Site |
8.814 |
0.012 |
0.018 |
|||
Cardia, NOS |
25.3% |
Ref |
||||
Non-cardia |
36.7% |
1.208 (0.885~1.650) |
0.234 |
|||
Stomach, NOS |
30.0% |
0.935 (0.700~1.247) |
0.646 |
|||
Grade |
2.431 |
0.119 |
NI |
|||
Grade I/II |
37.4% |
|||||
Grade III/IV |
31.7% |
|||||
Histologic type |
0.366 |
0.947 |
NI |
|||
Carcinoma |
34.8% |
|||||
Adenocarcinoma |
33.6% |
|||||
Mucinous adenocarcinoma |
30.6% |
|||||
Signet ring cell carcinoma |
||||||
Marital status |
11.732 |
0.008 |
0.061 |
|||
Married |
35.1% |
Ref |
||||
Divorced |
21.6% |
0.870 (0.697~1.085) |
0.216 |
|||
Single/Separated |
36.7% |
1.265 (0.908~1.763) |
0.165 |
|||
Widowed |
26.4% |
0.893 (0.675~1.182) |
0.429 |
|||
LNs |
75.055 |
0.000 |
0.000 |
|||
≤ 9 |
18.3% |
Ref |
||||
> 9 |
39.2% |
1.849 (1.571~2.176) |
||||
A value of P < 0.05 indicates statistical significance.
Table 5: Univariate and multivariate analysis for evaluating the influence on CSS in patients with ypIIIB GC
Parameter |
Characteristic |
5-year CCS |
Univariate analysis |
Multivariate analysis |
||
|---|---|---|---|---|---|---|
χ2 test |
P value |
HR (95% CI) |
P value |
|||
Year of diagnosis |
5.882 |
0.015 |
0.081 |
|||
2004–2007 |
19.8% |
Ref |
||||
2008–2010 |
27.7% |
1.119 (0.986~1.270) |
||||
Sex |
3.191 |
0.074 |
NI |
|||
Male |
23.4% |
|||||
Female |
21.1% |
|||||
Age |
72.076 |
0.000 |
0.000 |
|||
< 60 |
32.1% |
Ref |
||||
≥ 60 |
16.8% |
0.564 (0.490~0.650) |
||||
Race |
9.274 |
0.010 |
0.004 |
|||
White |
20.9% |
Ref |
||||
Black |
20.3% |
1.292 (1.108~1.507) |
0.001 |
|||
Others |
28.7% |
1.274 (1.030~1.577) |
0.026 |
|||
Primary Site |
2.666 |
0.264 |
NI |
|||
Cardia, NOS |
17.3% |
|||||
Non-cardia |
24.0% |
|||||
Stomach, NOS |
25.9% |
|||||
Grade |
8.971 |
0.003 |
0.002 |
|||
Grade I/II |
30.7% |
Ref |
||||
Grade III/IV |
20.4% |
0.768 (0.652~0.905) |
||||
Histologic type |
9.073 |
0.028 |
0.019 |
|||
Carcinoma |
14.0% |
Ref |
||||
Adenocarcinoma |
24.8% |
1.295 (1.016~1.651) |
0.037 |
|||
Mucinous adenocarcinoma |
21.2% |
0.908 (0.781~1.055) |
0.206 |
|||
Signet ring cell carcinoma |
19.0% |
1.024 (0.708~1.483) |
0.898 |
|||
Marital status |
18.011 |
0.000 |
0.355 |
|||
Married |
22.9% |
Ref |
||||
Divorced |
23.9% |
0.874 (0.733~1.043) |
0.135 |
|||
Single/Separated |
26.4% |
0.951 (0.720~1.258) |
0.726 |
|||
Widowed |
16.1% |
0.976 (0.767~1.242) |
0.845 |
|||
LNs |
32.464 |
0.000 |
0.000 |
|||
≤ 9 |
15.0% |
Ref |
||||
> 9 |
24.5% |
1.414 (1.221~1.636) |
||||
A value of P < 0.05 indicates statistical significance.
Table 6: Univariate and multivariate analysis for evaluating the influence on CSS in patients with ypIIIC GC
Parameter |
Characteristic |
5-year CCS |
Univariate analysis |
Multivariate analysis |
||
|---|---|---|---|---|---|---|
χ2 test |
P value |
HR (95% CI) |
P value |
|||
Year of diagnosis |
0.219 |
0.640 |
NI |
|||
2004–2007 |
12.2% |
|||||
2008–2010 |
14.0% |
|||||
Sex |
0.003 |
0.955 |
NI |
|||
Male |
12.4% |
|||||
Female |
13.7% |
|||||
Age |
28.371 |
0.000 |
0.000 |
|||
< 60 |
18.3% |
Ref |
||||
≥ 60 |
9.4% |
0.754 (0.653~0.872) |
||||
Race |
4.091 |
0.129 |
NI |
|||
White |
11.7% |
|||||
Black |
12.6% |
|||||
Others |
16.2% |
|||||
Primary Site |
9.312 |
0.010 |
0.019 |
|||
Cardia, NOS |
13.2% |
Ref |
||||
Non-cardia |
13.2% |
0.715 (0.549~0.931) |
0.013 |
|||
Stomach, NOS |
9.0% |
0.728 (0.580~0.913) |
0.006 |
|||
Grade |
0.581 |
0.446 |
NI |
|||
Grade I/II |
17.4% |
|||||
Grade III/IV |
12.0% |
|||||
Histologic type |
3.187 |
0.364 |
NI |
|||
Carcinoma |
9.8% |
|||||
Adenocarcinoma |
15.6% |
|||||
Mucinous adenocarcinoma |
12.9% |
|||||
Signet ring cell carcinoma |
9.0% |
|||||
Marital status |
34.518 |
0.000 |
0.000 |
|||
Married |
15.9% |
Ref |
||||
Divorced |
5.3% |
0.652 (0.539~0.789) |
0.000 |
|||
Single/Separated |
15.0% |
0.909 (0.685~1.206) |
0.509 |
|||
Widowed |
0% |
0.712 (0.554~0.914) |
0.008 |
|||
LNs |
6.903 |
0.009 |
0.025 |
|||
≤ 9 |
9.0% |
Ref |
||||
> 9 |
13.2% |
1.306 (1.034~1.649) |
||||
A value of P < 0.05 indicates statistical significance.
DISCUSSION
In 1997, the Union for International Cancer Control (UICC) and American Joint Committee on Cancer (AJCC) redefined the pathologic N based on the number of involved nodes rather than the location, and thus reached an agreement that the cut-off points for the N classification should be as follows: N0 (no regional LN metastasis), N1 (1–6 nodes metastasis), N2 (7–15 nodes metastasis), and N3 (more than 15 nodes metastasis). In 2010, the 7th edition TNM staging system was changed to accommodate that N1 was set by 1–2 nodes metastasis, N2 by 3–6 nodes metastasis, and N3 by more than 7 nodes metastasis (N3a: 7~15, and N3b: more than 16) [8]. The total number of LNs retrieved is fundamental in the pathological staging systems for GC, which has direct implications on the survival of GC patients, validated in several large clinical series [12–17]. However, the optimal number of LNs to be removed to achieve an optimum reliability in stage assignment remains less clear.
Inadequate LN evaluation is related to worse outcomes in terms of tumor recurrence and patient survival [7]. Siewert et al. [10] showed that LN status was one of the most important prognostic factors in patients with resected GC and extended LN dissection did not increase the mortality or morbidity rate of resection for GC but markedly improved long-term survival in patients with stage II. Smith et al. [13] reported that 5-year survival with only one LN examined was 56% (T1/2N0), 35% (T1/2N1), 29% (T3N0), or 13% (T3N1); moreover for every 10 extra LNs dissected, survival improved by 7.6% (T1/2N0), 5.7% (T1/2N1), 11% (T3N0), or 7% (T3N1), and detected significantly superior survival differences for cut points at up to 40 LNs. Zheng et al. [12] demonstrated that the number of the retrieved LNs count was an independent prognostic factor for GC with no LN metastasis and the higher the LN count is, the better the survival would be; the longest CSS was observed in the group of LN count more than 14. Jiao et al. [18] found that patients with node-negative GC and LNs retrieved more than 15 had a better survival compared with those with LNs ≤ 15, and the cut-point analysis showed that T2-T4 patients with 11–15 LNs had a significantly longer mean overall survival than those with 4–10 LNs or 1–3 LNs. However, the relationship between LN count and pathological stage III GC has not been fully investigated. In this study, we revealed that the more LN count retrieved, the better the survival would be. LN count was a prognosis factor for patients with pIII GC. After using X-tile to identify 9 as the optimal cutoff value, LN count was found as an independent prognosis factor in pathological stage III GC. We suggest that LN count is a good supplement for current staging systems on evaluating the prognosis of these patients and it could be involved in practical prediction models.
The reason for the correlation between the LNs retrieved and survival has not been revealed. This is mainly due to stage-migration [12]. Lymphatic micrometastasis is a key etiology of recurrence and metastasis after resection of GC, which is difficult to be found during operation [19–20]. We could retrieve more LNs to reduce the lymphatic micrometastases to improve the outcome of GC. We previously identified 12 negative LNs as the optimal cutoff value to divide the patients into high and low risk subsets in terms of survival rate and firmly demonstrated that negative LN count was an independent prognostic factor for patients with GC who received preoperative radiotherapy [21]. Zheng et al. [12] demonstrated the importantly prognostic value of LNs count on survival of patients with node-negative GC. It is suggested that increased LNs retrieval would reduce the possibility of understaging, and thus then improve survival. In this study, we also found that the higher the LN count retrieved, the better survival would be in patients with pathological stage III GC.
The results of this study have some potential shortcomings. First, the SEER database does not include information of therapeutic options such as radical resection or palliative therapy, and detailed information of chemotherapy, which may also impact patients’ prognosis [21]. Second, the information about recurrence and metastasis of GC and whether or not medical treatment on patients with recurrence or metastasis is given is still unknown in SEER database, which we cannot adjust in survival analysis [12]. Third, even different pathological doctors influence the number of LNs retrieval. But for the SEER database lacks these information, we cannot adjust for this.
In conclusion, our analysis of the SEER database revealed that the number of LNs retrieved (with an optimal cutoff value of 9) was an independent prognosis factor for patients with pathological stage III GC. Subgroup analysis showed that LN count was an independent prognostic factor in patients with pathological stage III GC (pIIIA, pIIIB and pIIIC).
MATERIALS AND METHODS
Patient selection
The current SEER database consists of 18 population-based cancer registries that represent approximately 26% of the population in the United States. Research Program, National Cancer Institute SEER*Stat software, was used to access the database. We searched for GC patients, at age ≥ 18 years, diagnosed between 2004 and 2010. Histological types were limited to adenocarcinoma (8140/3, 8144/3, 8255/3, 8211/3, 8260/3, 8263/3), signet ring cell carcinoma (8490/3) and carcinoma (8490/3). Patients were excluded if one accept neoadjuvant radiotherapy, or had more than one primary neoplasm, distant metastasis, no surgical resection, undefined TNM stage, unknown cause of death or survival months.
Patients’ demographic and clinicopathological variables, including years of diagnosis, age, sex, race, primary site, grade, histologic type, marital status, pathological T or N stage, reginal LNs retrieval and metastasis were retrieved from the SEER database. The primary endpoint in this study was CSS, defined as the period from diagnosis to death due to GC. Data of patients who died from other causes or who were alive on the date of their last follow-up were censored. TNM classification was restaged according to the criteria described in the AJCC Cancer Staging Manual (7th edition, 2010).
Statistical analysis
The LNs cutoff points were analyzed using the X-tile program, identifying the cutoff with the minimum P values from log-rank χ2 statistics for the categorical LNs in terms of survival. The Kaplan-Meier method was used to calculate the actual survival rate and to plot survival curves, followed by the log-rank test for clinical and histological variables. The Cox proportional hazard regression model was used to identify the variables that could independently influence survival in GC. Hazard ratios (HRs) and 95% confidence intervals (CI) were calculated. All statistical analyses were performed using SPSS ver.19.0 (SPSS Inc., Chicago, IL), and a value of P < 0.05 indicated statistical significance. All tests were 2 sided with p < 0.05 defined as statistically significant.
Author contributions
ZQH and XXL planned the study. WJW and HSY calculated statistics and analyzed the data. JY and HLW wrote the manuscript. XXL and XWL supervised the entire project. All authors reviewed the manuscript.
ACKNOWLEDGMENTS AND FUNDING
This work was funded by National Youth Science Foundation (81402002). The authors acknowledged the efforts of the Surveillance, Epidemiology, and End Results (SEER) Program tumor registries in the creation of the SEER database. The interpretation and reporting of these data were the sole responsibility of the authors.
CONFLICTS OF INTEREST
The authors declare that they have no competing interests.
REFERENCES
1. Harada K, Mizrak Kaya D, Shimodaira Y, Ajani JA. Global chemotherapy development for gastric cancer. Gastric Cancer. 2017; 20:92–101. https://doi.org/10.1007/s10120-016-0655-8.
2. Laks S, Meyers MO, Kim HJ. Surveillance for Gastric Cancer. Surg Clin North Am. 2017; 97:317–31. https://doi.org/10.1016/j.suc.2016.11.007.
3. Shitara K. Chemotherapy for advanced gastric cancer: future perspective in Japan. Gastric Cancer. 2017; 20:102–10. https://doi.org/10.1007/s10120-016-0648-7.
4. Jemal A, Bray F, Center MM, Ferlay J, Ward E, Forman D. Global cancer statistics. CA Cancer J Clin. 2011; 61:69–90. https://doi.org/10.3322/caac.20107.
5. Torre LA, Bray F, Siegel RL, Ferlay J, Lortet-Tieulent J, Jemal A. Global cancer statistics, 2012. CA Cancer J Clin. 2015; 65:87–108. https://doi.org/10.3322/caac.21262.
6. Galli F, Ruspi L, Marzorati A, Lavazza M, Di Rocco G, Boni L, Dionigi G, Rausei S. N staging system: tumor-node-metastasis and future perspectives. Transl Gastroenterol Hepatol. 2017; 2:4. https://doi.org/10.21037/tgh.2017.01.03.
7. De Marco C, Biondi A, Ricci R. N staging: the role of the pathologist. Transl Gastroenterol Hepatol. 2017; 2:10. https://doi.org/10.21037/tgh.2017.01.02.
8. Ahmad SA, Xia BT, Bailey CE, Abbott DE, Helmink BA, Daly MC, Thota R, Schlegal C, Winer LK, Ahmad SA, Al Humaidi AH, Parikh AA. An update on gastric cancer. Curr Probl Surg. 2016; 53:449–90. https://doi.org/10.1067/j.cpsurg.2016.08.001.
9. Lee WJ, Siewert JR, Roder JD, Böttcher K, Hermanek P. Prognostic relevance of systematic lymph node dissection in gastric carcinoma. Br J Surg. 1994; 81:315–6.
10. Siewert JR, Bottcher K, Stein HJ, Roder JD. Relevant prognostic factors in gastric cancer: ten-year results of the German Gastric Cancer Study. Ann Surg. 1998; 228:449–61.
11. Zilberstein B, Martins BC, Jacob CE, Bresciani C, Lopasso FP, de Cleva R, Pinto Junior PE, Junior UR, Perez RO, Gama-Rodrigues J. Complications of gastrectomy with lymphadenectomy in gastric cancer. Gastric Cancer. 2004; 7:254–9. https://doi.org/10.1007/s10120-004-0301-8.
12. Zheng WF, Ji TT, Lin Y, Li RZ. The prognostic value of lymph nodes count on survival of patients with node-negative gastric cancer. Oncotarget. 2016; 7:43680–8. https://doi.org/10.18632/oncotarget.9845.
13. Smith DD, Schwarz RR, Schwarz RE. Impact of total lymph node count on staging and survival after gastrectomy for gastric cancer: data from a large US-population database. J Clin Oncol. 2005; 23:7114–24. https://doi.org/10.1200/JCO.2005.14.621.
14. Zhou R, Zhang J, Sun H, Liao Y, Liao W. Comparison of three lymph node classifications for survival prediction in distant metastatic gastric cancer. Int J Surg. 2016; 35:165–71. https://doi.org/10.1016/j.ijsu.2016.09.096.
15. Liu J, Su M, Wang J, Zhang G, Zhou J, Zhang A, Ren Z, Zheng X, Hong S, Wang S, Zhang R. A novel grade-lymph node ratio model predicts the prognosis of the advanced gastric cancer patients after neoadjuvant radiotherapy. Oncotarget. 2017; 8:14058–67. https://doi.org/10.18632/oncotarget.12573.
16. Deng J, Yamashita H, Seto Y, Liang H. Increasing the Number of Examined Lymph Nodes is a Prerequisite for Improvement in the Accurate Evaluation of Overall Survival of Node-Negative Gastric Cancer Patients. Ann Surg Oncol. 2017; 24:745–53. https://doi.org/10.1245/s10434-016-5513-8.
17. Attaallah W, Uprak K, Gunal O, Yegen C. Prognostic Impact of the Metastatic Lymph Node Ratio on Survival in Gastric Cancer. Indian J Surg Oncol. 2016; 7:67–72. https://doi.org/10.1007/s13193-016-0490-8.
18. Jiao XG, Deng JY, Zhang RP, Wu LL, Wang L, Liu HG, Hao XS, Liang H. Prognostic value of number of examined lymph nodes in patients with node-negative gastric cancer. World J Gastroenterol. 2014; 20:3640–8. https://doi.org/10.3748/wjg.v20.i13.3640.
19. Zeng YJ, Zhang CD, Dai DQ. Impact of lymph node micrometastasis on gastric carcinoma prognosis: a meta-analysis. World J Gastroenterol. 2015; 21:1628–35. https://doi.org/10.3748/wjg.v21.i5.1628.
20. Hayashi N, Ito I, Yanagisawa A, Kato Y, Nakamori S, Imaoka S, Watanabe H, Ogawa M, Nakamura Y. Genetic diagnosis of lymph-node metastasis in colorectal cancer. Lancet. 1995; 345:1257–9.
21. Li X, Zhang W, Zhang X, Wang H, Xu K, Yao H, Yao J, Liang X, Hu Z. The prognostic value of negative lymph node count for patients with gastric cancer who received preoperative radiotherapy. Oncotarget. 2017; 8:46946–54. https://doi.org/10.18632/oncotarget.14943.