

INTRODUCTION
Cardiovascular diseases (CVDs) are globally the leading cause of death in Western Countries. Atherosclerosis is preceded by endothelial dysfunction, a protrombotic and pro-inflammatory state of the endothelium which involves the increased expression of cell surface adhesion molecules, the production of inflammatory cytokines and chemokines and altered contractility of vascular smooth muscle cells (VSMCs) [1]. Recruitment of blood leukocytes to the injured vascular endothelium is a hallmark of the initiation and progression of atherosclerosis and involves many inflammatory mediators, modulated by cells of both innate and adaptive immunity [1]. Key factors contributing to early stages of atherosclerosis include the pro-inflammatory cytokines Interferon (IFN)α, IFNγ and Toll-like receptor 4 (TLR4) activators [2]. IFNα and IFNγ induce gene expression by phosphorylating STAT members in a Janus-kinase (JAK)-dependent manner. IFNα-induced STAT1 and STAT2 heterodimers, complexed with IRF9 form ISGF3 and regulate expression of ISRE-containing genes. IFNα and IFNγ are able to activate the formation of STAT1 or STAT3 homo-/heterodimers, which then promote the expression of a distinct set of GAS-driven genes. IFNs additionally activate transcription factors of the IRF family including IRF1 and IRF8, that modulate a second wave of ISRE-dependant gene expression [3, 4].
TLR4 ligation results in the rapid activation of signal dependent transcription factors, including members of the nuclear factor-κB (NF-κB) and IRF families [4–7] that amplify the initial inflammatory response, exert antimicrobial activities and initiate the development of acquired immunity. Several of the cytokines that are upregulated in the initial wave of immediate early gene expression e.g. IFNβ and TNFα, which induce a secondary wave of STAT1 and STAT2 dependent gene expression and NF-κB signaling, respectively [4, 8, 9]. On the other hand, IL-6 leads to the activation of STAT3.
By sharing the same important transcription factors that have the ability to activate gene expression in different combinations, IFNγ and TLR4 participate in signaling cross-talk through combinatorial actions of transcription factors on ISRE, GAS, ISRE/GAS, ISRE/NF-κB or GAS/NF-κB binding sites. Inflammation-induced activation of STAT1, STAT2, and STAT3, NF-κB and different IRFs coordinates a platform for synergistic amplification of multiple chemokines, adhesion molecules, antiviral and antimicrobial proteins. Thus, signal integration between IFNγ and LPS in vascular cells and atheroma interacting immune cells modulates important aspects of inflammation, with STATs being important mediators [7, 10].
STAT inhibitory strategies are actively pursued and mostly focus on inhibiting STAT dimerization. In contrast to STAT1, searches for STAT3-targeting compounds, exploring the pTyr-SH2 interaction area of STAT3, are numerous and yielded many small molecules [11, 12]. For example, STATTIC was discovered by high-throughput screening and shown to inhibit activation, dimerization, nuclear translocation of STAT3, and to increase apoptosis in STAT3-dependent cancer cell lines through direct interaction with STAT3 (reviewed in [7, 13]). Similarly, the small-molecule STX-0119 was able to inhibit STAT3 dimerization and suppress the growth of human lymphoma SCC3 cells, through apoptosis and downregulation of STAT3 targets such as c-myc, cyclin D1, survivin and Bcl-xL. STX-0119 also demonstrated potent antitumor effects in vivo in SCC3-bearing nude mice by down-regulating STAT3 target genes and induction of apoptosis in the tumors [14]. Recently, we proposed a STAT cross-binding mechanism for STATTIC and STX-0119, in which both compounds target the SH2 domain of STAT1, STAT2 and STAT3 with similar affinity. We hypothesized that non-specific STAT-inhibitors that simultaneously block STAT1, STAT2 and STAT3 activity and pro-inflammatory target gene expression may be a promising avenue for the treatment of CVDs.
To prove this, we developed a pipeline approach combining comparative in silico docking of multiple STAT-SH2 models on multi-million CL and CDL libraries with in vitro STAT inhibition validation, as a novel STAT-inhibitory selection strategy. This approach allowed us to identify a new type of multi-STAT inhibitor, C01L_F03 targeting the SH2 domain of STAT1, 2 and 3 with equal affinity. Moreover, we observed a similar STAT cross-binding mechanism for STATTIC and STX-0119, leading to genome-wide inhibition of pro-atherogenic gene expression directed by cooperative involvement of STATs with IRFs and/or NF-κB. Consequently, a multi-STAT inhibitory strategy was applied to inhibit endothelial cell (EC) migration, leukocyte adhesion to ECs and impairment of mesenteric artery contractility under inflammatory conditions.
RESULTS
Identification of C01, E01 and F01 as novel low potent STAT1-SH2 inhibitory compounds
Potential STAT1-targeting inhibitors were selected from a CL library, using the pre-screen algorithm (see Materials & Methods), according to STAT1-BS. Compounds with the highest STAT1-BS were checked for availability and 12 of them were purchased (Table 1). These compounds, named A01 to L01, displayed STAT1-BS from 8.51 for J01 (the highest) to 7.56 for A01 (the lowest).
Table 1: Docking characteristics (pscreen algorithm, STAT1-BS, Crash and Polar Score) of top 12 selected compounds from Clean Leads primary screen bound to STAT1-SH2 domain
Compound |
ZINC ID |
STAT1-BS |
Crash |
Polar Score |
|---|---|---|---|---|
A01 |
ZINC04943450 |
7.56 |
–1.12 |
6.96 |
B01 |
ZINC05362485 |
7.71 |
–1.66 |
8.67 |
C01 |
ZINC08344970 |
8.09 |
–1.66 |
6.9 |
D01 |
ZINC09418732 |
7.63 |
–1.11 |
7.57 |
E01 |
ZINC09970661 |
8.36 |
–1.27 |
6.05 |
F01 |
ZINC13362660 |
7.78 |
–1.04 |
6.62 |
G01 |
ZINC13443544 |
7.81 |
–1.77 |
4.94 |
H01 |
ZINC15772297 |
7.79 |
–0.99 |
5.98 |
I01 |
ZINC20069236 |
7.76 |
–1.72 |
8.99 |
J01 |
ZINC20312047 |
8.51 |
–0.85 |
6.87 |
K01 |
ZINC07047084 |
7.58 |
–1.4 |
8.94 |
L01 |
ZINC08477975 |
7.66 |
–1.32 |
6.92 |
To test the inhibitory capacity of these compounds towards STAT1 phosphorylation in vitro, we first treated HMECs with LPS (1 μg/ml for 4 h) in the presence or absence of the individual compounds (200 μM for 40 h). Except for C01, E01 and F01 (Figure 1A and 1B), none of the other compounds were able to inhibit STAT1 phosphorylation (not shown). A representative experiment is shown in Figure 1A, in which the phosphorylation and expression of STAT1, was followed. Indeed, a dramatic reduction in phosphorylation, but not total expression, of STAT1 could be observed in LPS-stimulated cells pre-treated with C01, E01 or F01. Notably, treatment with C01 resulted in partial inhibition, whereas E01 and F01 completely inhibited STAT1 phosphorylation (Figure 1B). Under similar conditions, 100 μM of E01 and F01 only partially inhibited STAT1 phosphorylation, while in case of 50 or 25 μM no inhibition could be observed (data not shown).
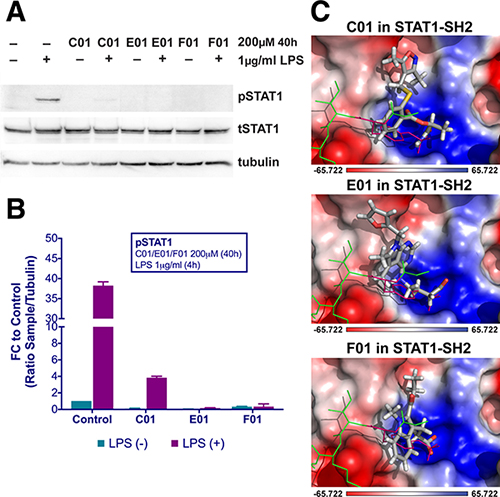
Figure 1: C01, E01 and F01 inhibit LPS-induced STAT1 phosphorylation (A). HMECs were treated with 200 μM of tested compounds for 40 h and with 1 μg/ml of LPS for 4 h. Protein extracts were collected and levels of pSTAT1, tSTAT1 and α-tubulin were assessed by western blotting. Western quantification (B). Bars represent mean quantification form 3 individual repeats ± SEM as error bars. Top-scored binding conformations of C01, E01 and F01 in the SH2 domain of STAT1 (C). C01, E01 and F01 compounds are shown in stick representation and colored according to the atomic structure. pTyr-linker is presented as green colored lines with pTyr residue in pink. SH2 domain of STAT1 is in the surface representation, colored according to the distribution of the electrostatic surface potential, calculated with APBS [89]. Blue indicates positively charged regions, red indicates negatively charged regions. Docking results were obtained using Surflex-Dock 2.6 program [15, 69].
Next, we examined the in silico binding affinity of C01, E01 and F01 to the SH2 domain of STAT1, including the pTyr-binding pocket (pY+0) and the hydrophobic pocket (pY-X). C01 (ZINC08344970–structure shown in Supplementary Figure 1) exhibited binding affinity to pY+ 0 and pY-X of STAT1 (Figure 1C), in the same way as F01 (ZINC13362660–structure shown in Supplementary Figure 1). On the other hand, E01 (ZINC09970661–structure shown in Supplementary Figure 1) only showed affinity for pY+0, but not to pY-X and shifted towards the Ile-binding sub-site of the STAT1 pTyr-linker (Figure 1C). STAT1-BS was the highest for E01 (8.36) as compared to C01 (8.09) and F01 (7.78). Among these three compounds C01 displayed a higher input of polar interactions to the BS (6.9), than E01 (6.05) and F01 (6.62), but at the same time the highest error rate of binding, represented by Crash value of –1.66. E01 and F01 had significantly lower penalty score for inappropriate binding to STAT1-SH2 domain, –1.27 and –1.04 respectively (Table 1). Together, this suggested that C01, E01 and F01 inhibit STAT1 phosphorylation by targeting the pY+0 and pY-X of its SH2 domain, however with low potency.
C01L_F03 exhibits similarity to C01 and shows potent STAT-SH2 cross-binding
To identify more potent variants of the above characterized STAT1 inhibitors, a similarity screen on the CL list and the CDL list of the ZINC database was performed for compounds with a similarity of 50% to C01, E01 or F01. Moreover, to target multiple sites of the SH2 domain only CDL compounds with a molecular weight > 300g/mol were included. Altogether 1961 compounds were analyzed for C01, E01 and F01 similarity by Surflex-Sim 2.6 and docked to the SH2 domains of STAT1, STAT2 and STAT3, using the more accurate screening method with pgeom parameter settings in Surflex-Dock 2.6 [15]. The compounds were filtered by STAT1-CBAV(STAT2) > 0 and STAT1-CBAV(STAT3) > 0 to compare binding affinities between STAT1, 2 and 3.
Two important observations could be made from the data analysis. First, the most interesting compounds were all from the CDL list with a molecular weight exceeding 300g/mol. Second, these compounds were mostly C01-like. Accordingly, six compounds C01L_A03 to C01L_F03 (accompanying structures are shown in Supplementary Figure 2) were selected with STAT1-CBAV > 0 (Table 2). Their STAT1-BS as well as their STAT1-CBAV values were higher than those for E01 and F01, calculated using the same pgeom parameter setting. In comparison to C01 all six compounds displayed significant higher STAT1-BS, but in case of STAT1-CBAV differences were not always observed. For example, C01L_A03 contained the highest STAT1-BS (9.84), as well as STAT1-CBAV (3.6 for STAT2 and 4.14 for STAT3). In the docking model of STAT1 C01L_A03 bound to pY+0, pY-X and partially the Ile sub-site (data not shown). C01L_C03, on the other hand, bound to pY+0, while pY-X and the Ile sub-site of STAT1 were only partially targeted (data not shown). In case of C01-similarity, C01L_D03 and C01L_A03 displayed highest C01-SIM values, 0.846 and 0.785, respectively. C01L_E03 and C01L_F03 had more similar structures in comparison to the other compounds (see Supplementary Figure 2). This correlated with similar STAT1-BS and C01-SIM values for these two compounds (Table 2). Moreover, their binding position in STAT1-SH2 was also comparable (data not shown).
Table 2: Docking characteristics (pgeom algorithm, STAT1-BS, STAT1-CBAV) of C01L_A03-C01L_F03 bound to STAT1, STAT2 and STAT3-SH2 domain in comparison to C01, E01 and F01 from primary screening, as well as C01-like similarity analysis (C01-SIM, C01-RMSD)
Compound |
ZINC ID |
C01-SIM |
C01-RMSD |
STAT1-BS |
STAT1-CBAV (STAT2) |
STAT1-CBAV (STAT3) |
|---|---|---|---|---|---|---|
C01 |
ZINC08344970 |
1.000 |
0.00 |
6.73 |
1.74 |
2.08 |
E01 |
ZINC09970661 |
0.604 |
2.96 |
6.95 |
–1.65 |
–0.73 |
F01 |
ZINC13362660 |
0.567 |
2.40 |
6.38 |
–0.09 |
–0.19 |
C01L_A03 |
ZINC03470000 |
0.785 |
2.28 |
9.84 |
3.60 |
4.14 |
C01L_B03 |
ZINC05585448 |
0.771 |
2.82 |
8.31 |
2.19 |
1.19 |
C01L_C03 |
ZINC08712870 |
0.760 |
2.47 |
7.08 |
0.70 |
1.00 |
C01L_D03 |
ZINC08712921 |
0.846 |
2.84 |
7.30 |
1.50 |
1.78 |
C01L_E03 |
ZINC21128441 |
0.777 |
2.13 |
8.01 |
2.94 |
2.68 |
C01L_F03 |
ZINC05312694 |
0.767 |
2.75 |
8.23 |
3.36 |
0.22 |
A more exhaustive docking analysis was performed for C01L_F03 (ZINC05312694–structure shown in Supplementary Figure 2). The C01L_F03`s STAT1-BS of 8.23 and a STAT1-CBAV(STAT3) < 1 (0.22), suggested STAT1 and STAT3-SH2 cross-binding (Table 3). This coincides with the high conservation between these two STATs–sharing 50% of global amino acid sequence homology, according to pairwise sequence identity analysis [16]. On the other hand, the higher STAT1-CBAV(STAT2) for C01L_F03 (Table 3; 3.36) predicted lower affinity for STAT2 than for STAT1 and STAT3. In contrast, the C01 compound displayed similar STAT1-CBAV for STAT2 and STAT3, 1.74 and 2.08 respectively, whereas the STAT1-BS was lower by 1.5 than for C01L_F03 (Table 3). The binding affinity of C01L_F03 to the individual STAT-SH2 domains, corresponded with the graphical analysis. According to Table 3, from the top 20 optimized binding conformations of C01L_F03 to STAT1-SH2, 19 (95%) favored pY+0 and pY-X simultaneously. LBPV analyses for other STAT-SH2 revealed that C01L_F03 also shares high affinity for pY+0 and pY-X in case of STAT3 with LBPV0+X = 0.75 and much lower for STAT2 with LBPV0+X = 0.2 (Table 3). These calculations were supported by graphical presentation of the docking results (Figure 2A) in which the top scored conformation of C01L_F03 for each individual STAT competed with pTyr binding to the particular STAT-SH2 domain. In the docking model of STAT1-SH2, C01L_F03 bound to pY+0 and pY-X similar to C01. The same conformation could be observed in the STAT3-SH2. In case of STAT2-SH2, C01L_F03 predominantly bound to pY+0, but not to pY-X and shifted towards the Leu-binding sub-site of the STAT2 pTyr-linker (Figure 2A). C01 in the STAT2-SH2 domain, on the other hand, remained in a similar position as in STAT1 and STAT3-SH2 domains. Together, the docking results of C01 and C01L_F03 suggest higher potency of the latter towards STAT1 inhibition, although with a certain degree of STAT-SH2 cross-binding.
Table 3: Docking characteristics (pgeom algorithm, STAT1-BS, STAT1-CBAV, LBPV) of STATTIC, STX-0119, C01, E01, F01 and C01L_F03 bound to STAT1, STAT2 and STAT3-SH2 domain
Compound |
STAT1-BS |
STAT1-CBAV (STAT2) |
STAT1-CBAV (STAT3) |
STAT1-LBPV |
STAT2-LBPV |
STAT3-LBPV |
|||
|---|---|---|---|---|---|---|---|---|---|
STATTIC |
4.70 |
–0.86 |
0.39 |
0.70 |
0.2X |
0.90 |
0.05X |
0.30 |
0.55X |
STX-0119 |
4.36 |
–0.32 |
0.25 |
0.450+X |
0.30+X |
0.250+X |
|||
C01 |
6.73 |
1.74 |
2.08 |
0.50+X |
0.450+X |
0.350+X |
|||
E01 |
6.95 |
–1.65 |
–0.73 |
0.650+X |
0.30+X |
0.30+X |
|||
F01 |
6.38 |
–0.09 |
–0.19 |
0.20+X |
0.20+X |
0.30+X |
|||
C01L_F03 |
8.23 |
3.36 |
0.22 |
0.950+X |
0.20+X |
0.750+X |
|||
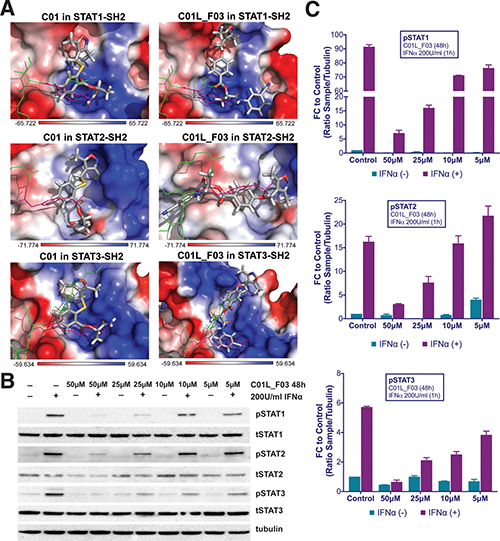
Figure 2: Top-scored binding conformations of C01 and C01L_F03 in the SH2 domain of STAT1, STAT2 and STAT3 (A). C01 and C01L_F03 compounds are shown in stick representation and colored according to the atomic structure. pTyr-linker is presented as green colored lines with pTyr residue in pink. SH2 domains of STAT1, STAT2 and STAT3 are in the surface representation, colored according to the distribution of the electrostatic surface potential, calculated with APBS [89]. Blue indicates positively charged regions, red indicates negatively charged regions. Docking results were obtained using Surflex-Dock 2.6 program [15, 69]. C01L_F03 inhibits IFNα induced phosphorylation of STAT1, STAT2 and STAT3 (B). HMECs were treated with 50 μM, 25 μM, 10 μM and 5 μM C01L_F03 for 48 h and with 200 U/ml of IFNα for 1 h. Protein extracts were collected and levels of pSTAT1, pSTAT2, pSTAT3, tSTAT1, tSTAT2, tSTAT3 and α-tubulin were assessed by western blotting. Western quantification (C). Bars represent mean quantification form 3 individual repeats ± SEM as error bars.
C01L_F03 inhibits IFNα-induced phosphorylation of STAT1, STAT2 and STAT3 and binding to target gene promoters and their expression
In addition to the docking experiments, the six compounds from the similarity screen were tested for their potential to block IFNα induced STAT phosphorylation. This led to the selection of C01L_F03 as our most potent candidate (not shown).
To address STAT cross-binding specificity of C01L_F03 we pre-treated HMECs for 48 or 24 hours (data not shown) with various concentrations of the compound (50 μM, 25 μM and 10 μM) in the presence or absence of IFNα (200 U/ml), which was added 1 h before protein isolation. A representative experiment is shown in Figure 2B in which the phosphorylation of STAT1, STAT2 and STAT3 was followed. These results stand in line with our docking studies. IFNα-induced phosphorylation of all three STATs was almost fully inhibited in the presence of 50 μM and 25 μM, and partially of 10 μM and 5 μM of C01L_F03 for 48 h (Figure 2C). 24 h treatment with C01L_F03 resulted only in partial inhibition with the highest concentration (data not shown). Under the same conditions levels of total STAT proteins were not influenced by C01L_F03 treatment. After 48 h treatment with 50 μM C01L_F03 exhibited cytotoxic effect causing death of approximately 30% of cells (not shown). However, at a concentration of 25 μM barely any toxicity was visible. What is more 24 h treatment with 50 μM of C01L_F03 showed no toxicity (not shown).
The inhibitory effect of C01L_F03 was also studied at the gene expression level. In agreement with the STAT cross-binding characteristics from our docking results, C01L_F03 was able to completely inhibit IFNα-induced expression of the multiple STAT- and IRF-target genes–CXCL10, IFIT2 and OAS2 at 25 μM and partially for 10 μM pre-treated for 48 h (Figure 3A). The same was true for the STAT1 target gene–IRF1 and the STAT3 target gene–SOCS3. To further demonstrate that the effect of C01L_F03 on STAT target gene expression was mediated by inhibiting binding of STATs to target gene promoters, we performed immunoprecipitation followed by qPCR on Chromatin extracted from untreated or IFNα treated HMECs in the absence or presence of 50 μM C01L_F03. Accordingly, using antibodies against pSTAT1, pSTAT2, or pSTAT3, treatment with IFNα caused enhanced binding of pSTAT1 and pSTAT2 to the promoter ISRE element of OAS2 (Figure 3B), and respectively of pSTAT1 and pSTAT3 to IRF1 and SOCS3 containing GAS sites as compared to untreated controls (Figure 3B). More important, the presence of CO1L_F03 dramatically reduced this DNA-binding of the different STATs (Figure 3B) and correlated with inhibition of target gene expression (Figure 3A).
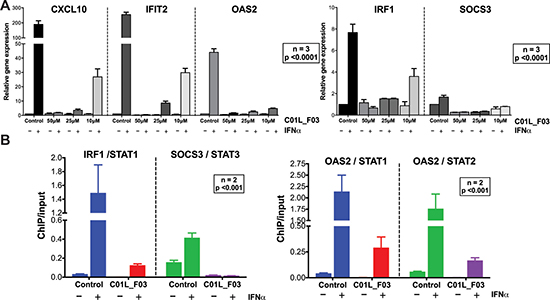
Figure 3: C01L_F03 inhibits IFNα induced gene expression of CXCL10, IFIT2, OAS2, IRF1 and SOCS3 (A). HMECs were treated with 50 μM, 25 μM, 10 μM of C01L_F03 for 48 h and with 200 U/ml of IFNα for 4 h. RNA was isolated and subjected to qPCR analysis. Experiments were performed in 3 individual repeats, which were compared by two-way ANOVA test and unpaired two-tailed student T-test. C01L_F03 inhibits IFNα stimulated binding of STAT1, STAT2 and STAT3 to the ISRE of OAS2, and GAS of IRF1 and SOCS3 (B). HMECs were treated with 50 μM of C01L_F03 for 48 h. Chromatin was isolated and subjected to IP with antibodies against pSTAT1, pSTAT2 or pSTAT3, followed by qPCR analysis (primers are listed in Table 6). Experiments were performed in 2 individual repeats, which were compared by two-way ANOVA test and unpaired two-tailed student T-test.
STATTIC & STX-0119 exhibit STAT cross-binding in analogy to C01L_F03
Recently, we proposed a similar STAT cross-binding mechanism for STATTIC and STX-0119 [17], chemical structures of STATTIC and STX-0119 are displayed in Supplementary Figure 1. They were previously discovered as direct STAT3 inhibitors by high throughput screening [13] and virtual screening [18], respectively. In analogy to C01L_F03, we decided to examine this in more detail, by using a comparative docking strategy combined with western and Real-time PCR analysis.
First, docking simulation of STATTIC and STX-0119 in the STAT-SH2 domain of STAT1, STAT2 and STAT3 using the pgeom algorithm, resulted in a list of 20 optimized conformations for both compounds with corresponding BS values for each individual STAT (not shown). Table 3 shows the top STAT1-BS of STATTIC (4.70) and of STX-0119 (4.36), as well as STAT1-CBAVs (STATTIC: -0.86 for STAT2 and 0.39 for STAT3; STX-0119: -0.32 for STAT2 and 0.25 for STAT3). As becomes clear from the calculated STAT1-CBAVs, both compounds exhibited a similar binding affinity to the SH2 domain of STAT1, STAT2 and STAT3.
In addition, we determined the LBPV of STATTIC and STX-0119 towards the STAT-SH2 pY+0 and pY-X cavities. Thus, we were able to calculate the conformational tendency of STATTIC and STX-0119 to the STAT3-SH2. According to Table 3, from the top 20 optimized binding conformations of STATTIC to STAT3-SH2, 6 (30%) favor pY+0 and 11 (55%) fit to pY-X. LBPV analyses for other STAT-SH2 revealed that STATTIC also shares partial affinity between pY+0 and pY-X in case of STAT1 and STAT2 (Table 3) similar to STAT3. From the top 20 optimized binding conformations of STX-0119 to STAT3-SH2, only 5 (25%) of them favor both cavities simultaneously, which is in the same range in case of STAT1 and STAT2 (Table 3). These calculations were supported by graphical presentation of the docking results (Figure 4A) in which the top scored conformation of STATTIC and STX-0119 for each individual STAT competes with pTyr in binding to the STAT-SH2 domain. Together, this supports the affirmation that due to its small size and low molecular weight STATTIC lacks STAT-SH2 binding specificity. Because of targeting both cavities (pY-0 and pY-X) with low BS difference (based on CBAV) and weak affinity (based on LBPV) the same is true for STX-0119.
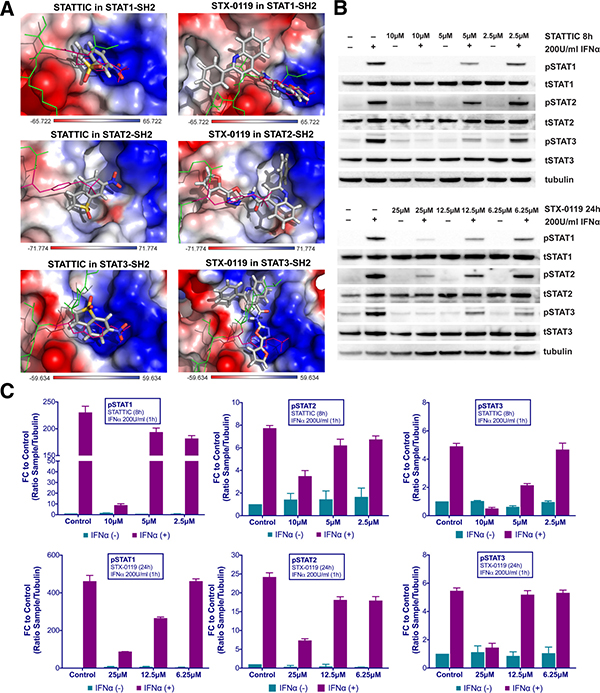
Figure 4: Top-scored binding conformations of STATTIC and STX-0119 in the SH2 domain of STAT1, STAT2 and STAT3 (A). STATTIC and STX-0119 compounds are shown in stick representation and colored according to the atomic structure. pTyr-linker is presented as green colored lines with pTyr residue in pink. SH2 domains of STAT1, STAT2 and STAT3 are in the surface representation, colored according to the distribution of the electrostatic surface potential, calculated with APBS [89]. Blue indicates positively charged regions, red indicates negatively charged regions. Docking results were obtained using Surflex-Dock 2.6 program [15, 69]. STATTIC and STX-0119 inhibit IFNα induced phosphorylation of STAT1, STAT2 and STAT3 (B). HMECs were treated with 10 μM, 5 μM, 2.5 μM of STATTIC for 8 h or with 25 μM, 12.5 μM, 6.25 μM of STX-0119 for 24 h and with 200 U/ml of IFNα for 1 h. Protein extracts were collected and levels of pSTAT1, pSTAT2, pSTAT3, tSTAT1, tSTAT2, tSTAT3 and α-tubulin were assessed by western blotting. Western quantification (C). Bars represent mean quantification form 3 individual repeats ± SEM as error bars.
STATTIC & STX-0119 inhibit IFNα-induced STAT1, STAT2 and STAT3 phosphorylation and target gene expression
These findings were further validated in HMECs in vitro, by testing the potential of STATTIC and STX-0119 at varying concentrations to inhibit STAT phosphorylation induced by IFNα. For STATTIC and STX-0119 (Figure 4B and 4C), we observed inhibition of phosphorylation of STAT1, STAT2 and STAT3 in a concentration dependent manner (STATTIC: between 10 and 2.5 μM for 8 h; STX-0119: between 25 and 6.25 μM for 24 h). Corresponding with the effects shown at the STAT-phosphorylation level both inhibitors also efficiently decreased IFNα-induced gene expression of the multi-STAT and IRF-targets CXCL10, OAS2 and IFIT2, the STAT1-only target IRF1 and STAT3-only target SOCS3 (Figure 5A and 5B). In comparison to C01L_F03, STATTIC was the most potent one of the three tested compounds. Moreover, all three compounds exhibited a certain degree of cytotoxicity only at the highest used concentrations (not shown).
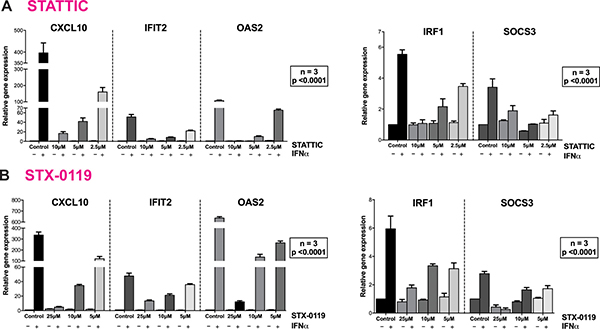
Figure 5: STATTIC and STX-0119 inhibits IFNα induced gene expression of CXCL10, IFIT2, OAS2, IRF1 and SOCS3. HMECs were treated with (A) 10 μM, 5 μM, 2.5 μM of STATTIC for 8 h or (B) with 25 μM, 12.5 μM, 6.25 μM of STX-0119 for 24 h and with 200 U/ml of IFNα for 4 h. RNA was isolated and subjected to qPCR analysis. Experiments were performed in 3 individual repeats, which were compared by two-way ANOVA test and unpaired two-tailed student T-test.
Together our data provide a molecular basis for STAT-cross-binding specificity of C01L_F03, STATTIC and STX-0119 and their potential to inhibit multi-STAT and IRF-target genes.
C01L_F03, STATTIC and STX-0119 interact with the SH2 domain of STAT1, STAT2 and STAT3
To provide evidence that STATTIC, STX-0119 and C01L_F03 concert their inhibitory actions through direct interaction with the STAT-SH2 domain we performed docking simulations in combination with STAT-SH2 in silico mutagenesis (see Materials & Methods). As presented in Figure 6A, mutating a.a. R602 in STAT1 [19], R601 in STAT2 [20] and R609 in STAT3 [21], resulted in a significant decrease in binding stability (ΔG0) between the SH2 domains of STAT1, STAT2 and STAT3 and all three inhibitors. The same was true, after mutating a second important a.a. K584 in STAT1 [22], R583 in STAT2 and K591 in STAT3 [23], albeit to a lesser extent (Figure 6A).
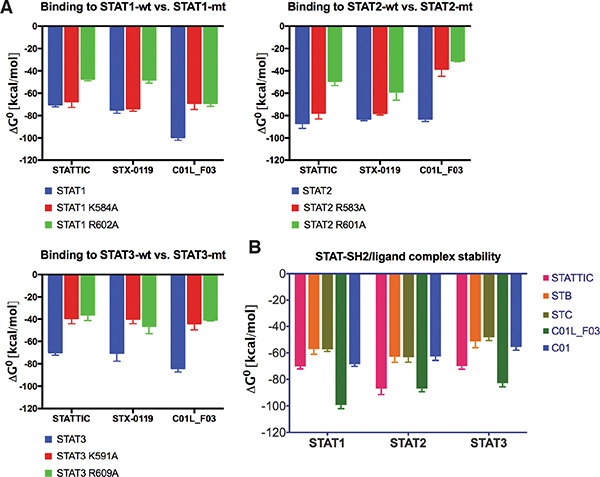
Figure 6: Comparison of wt and mutated STAT-SH2/ligand complex stability (A). STAT1, 2 or 3 – wild type and with single point mutation to Ala – complexes with STATTIC, STX-0119 or C01L_F03 have been subjected to the in silico studies of binding stability in the equilibrium. ΔG0 (free enthalpy change), which is a measure of the strength of the complex formation was estimated (based on HADDOCK ligand docking protocol [74, 75] with addition of Surflex-Dock protocol [17]). More negative ΔG0 (higher free enthalpy change) corresponds to stronger interaction between ligand and the protein, which is a reflection of better complex stability. Comparison of STAT-SH2/ligand complex stability (B). Complexes of STAT1, 2 and 3, with STATTIC and its analogs STB and STC, as well as C01 and C01L_F03 have been subjected to the in silico studies of binding stability in the equilibrium as in 6A.
A similar approach was used to compare binding stability of STATTIC and published STATTIC analogues–STB and STC–Supplementary Figure 1 [13]), and of C01L_F03 and C01 which differ in in silico binding affinity for STAT1, 2 and 3 (Table 3). As becomes clear from Figure 6B, STATTIC analogues exhibit lower binding stability (ΔG0) for the SH2 domains of STAT1, 2 and 3 as compared to wt STATTIC. Likewise, interaction between C01 and STAT1, 2 and 3, corresponds with a lower binding stability (ΔG0) in relation to C01L_F03.
C01L_F03, STATTIC and STX-0119 commonly inhibit cross-talk between IFNγ and LPS in a ‘multi-STAT’ and ‘STAT-only’ manner
In a second set of experiments HMECs were treated with IFNγ and LPS to further investigate the ability of C01L_F03, STATTIC and STX-0119 to inhibit pro-inflammatory and pro-atherogenic signaling depending on multiple STATs, IRFs and NF-κB. As shown in Figure 7, pre-treatment of HMECs with C01L_F03, STATTIC or STX-0119 resulted in inhibition of IFNγ+LPS induced gene expression of IFIT2, OAS2, CCL5, CXCL10, CXCL9, ICAM1 and VCAM1, in a concentration dependent manner. In general, the different compounds displayed similar inhibition characteristics, although sometimes minor variations could be observed. These data suggested that C01L_F03, STATTIC and STX-0119 may commonly block cross-talk between IFNγ and LPS in human microvascular endothelial cells.
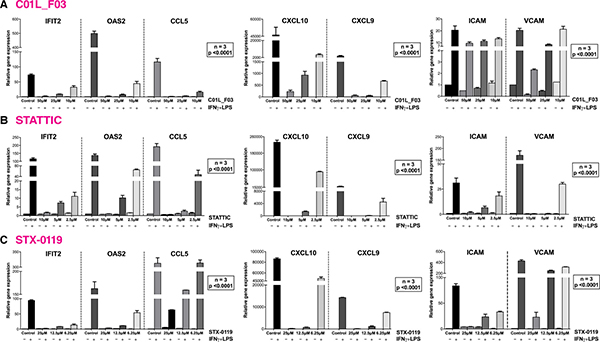
Figure 7: C01L_F03, STATTIC and STX-0119 inhibit IFNγ+LPS induced gene expression of IFIT2, OAS2, CCL5, CXCL10, CXCL9, ICAM1 and VCAM1. HMECs were treated with (A) 50 μM, 25 μM, 10 μM of C01L_F03 for 48 h or (B) 10 μM, 5 μM, 2.5 μM of STATTIC for 8 h or (C) with 25 μM, 12.5 μM, 6.25 μM of STX-0119 for 24 h and for 8 h with IFNγ + 4 h with LPS. RNA was isolated and subjected to qPCR analysis. Experiments were performed in 3 individual repeats, which were compared by two-way ANOVA test and unpaired two-tailed student T-test.
To provide further evidence for this, we decided to study the genome-wide effect of C01L_F03, STATTIC and STX-0119 on IFNγ+LPS-mediated vascular inflammation. For this, we performed a microarray experiment on RNA isolated from HMECs treated with IFNγ+LPS in the presence or absence of: 50 μM of C01L_F03, 25 μM of STX-0119 or 10 μM of STATTIC (GEO accession: GSE101508). IFNγ+LPS increased the expression of 731 genes at least two-fold or higher as compared to untreated cells, of which the top-25 are shown in Table 4. These included many known IFNγ and LPS target genes associated with: chemotaxis/migration (CXCL9, CXCL10, CCL7, CCL8, CCL3L3, MMP3, MMP12), adhesion (VCAM1, CD74), immune response to viral infection (UBD, GBP4, GBP5, OAS2, MX2, INDO, OASL, IFI44L, MX2). GO analysis of the complete list of IFNγ+LPS responsive genes revealed enrichment of biological functions mainly involved in: cytokine-mediated signaling pathway (GO:0019221); defense response and immune system process (GO:0006952 and GO:0002376); regulation of cytokine production (GO:0001817), inflammatory response (GO:0006954), regulation of cell adhesion (GO:0030155) or cell migration (GO:0030334), (see Table 5 and Figure 8A).
Table 4: Representative top-25 genes induced by IFNγ+LPS, displaying significant inhibition by all three compounds
GENE ID |
Fold change relative to control |
|||
|---|---|---|---|---|
IFNγ+LPS |
C01L_F03 |
STATTIC |
STX-0119 |
|
CXCL10 |
9298.61 |
615.79 |
15.14 |
223.90 |
CCL8 |
2118.86 |
6.83 |
6.31 |
0.79 |
UBD |
1860.83 |
129.28 |
2.09 |
62.19 |
CXCL9 |
1565.00 |
2.26 |
1.00 |
6.31 |
GBP4 |
793.16 |
38.79 |
16.30 |
8.61 |
GBP5 |
435.89 |
20.26 |
5.26 |
11.63 |
OAS2 |
329.65 |
2.61 |
6.29 |
1.48 |
VCAM1 |
326.83 |
33.01 |
1.36 |
8.12 |
CCL7 |
289.01 |
1.00 |
3.41 |
1.00 |
INDO |
209.33 |
1.00 |
1.80 |
1.00 |
MMP3 |
192.62 |
2.22 |
28.96 |
2.89 |
IDO1 |
178.80 |
1.62 |
6.03 |
1.42 |
CCL3L3 |
165.18 |
4.69 |
1.52 |
20.25 |
OASL |
160.22 |
3.99 |
1.21 |
14.16 |
LYPD5 |
127.07 |
6.75 |
6.90 |
7.66 |
LTB |
125.33 |
1.00 |
0.75 |
0.95 |
MMP12 |
111.79 |
0.70 |
0.70 |
0.70 |
IFI44L |
100.04 |
1.14 |
1.14 |
1.21 |
LOC730249 |
91.23 |
0.60 |
0.96 |
0.78 |
CD74 |
88.67 |
1.18 |
0.76 |
0.84 |
LOC100129681 |
76.64 |
1.31 |
2.35 |
0.18 |
MX2 |
68.99 |
0.40 |
0.74 |
1.23 |
DLL1 |
68.78 |
3.39 |
10.80 |
8.11 |
C1S |
64.57 |
4.22 |
5.98 |
2.39 |
TNFSF10 |
64.45 |
0.67 |
1.22 |
0.21 |
Gene expression levels were presented as fold change relative to control.
Table 5: Comparison of top-12 GO terms, selected based on Fold Enrichment values, between genes induced by treatment with IFNγ+LPS and group of IFNγ+LPS induced and inhibited simultaneously by C01L_F03, STATTIC and STX-0119
GO Term |
Biological Process |
Induced by IFNg and LPS |
Inhibited by C01L_F03, STATTIC |
||||
|---|---|---|---|---|---|---|---|
Fold Enrichment |
Uniqueness |
Dispensability |
Fold Enrichment |
Uniqueness |
Dispensability |
||
GO:0043207 |
response to external biotic stimulus |
55.28 |
0.84 |
0.00 |
28.14 |
0.82 |
0.11 |
GO:0009607 |
response to biotic stimulus |
54.84 |
0.92 |
0.12 |
27.38 |
0.92 |
0.12 |
GO:0006952 |
defense response |
52.46 |
0.88 |
0.43 |
29.61 |
0.88 |
0.43 |
GO:0019221 |
cytokine-mediated signaling pathway |
52.09 |
0.74 |
0.11 |
29.62 |
0.76 |
0.00 |
GO:0002376 |
immune system process |
49.72 |
1.00 |
0.00 |
28.66 |
0.99 |
0.00 |
GO:0001817 |
regulation of cytokine production |
37.65 |
0.83 |
0.00 |
10.67 |
0.81 |
0.05 |
GO:0007166 |
cell surface receptor signaling pathway |
28.05 |
0.79 |
0.28 |
13.89 |
0.81 |
0.28 |
GO:0006954 |
inflammatory response |
27.36 |
0.86 |
0.68 |
8.28 |
0.87 |
0.68 |
GO:0042127 |
regulation of cell proliferation |
23.04 |
0.86 |
0.71 |
7.97 |
0.87 |
0.71 |
GO:0042981 |
regulation of apoptotic process |
22.99 |
0.82 |
0.83 |
4.23 |
0.86 |
0.83 |
GO:0030334 |
regulation of cell migration |
17.90 |
0.81 |
0.05 |
4.70 |
0.72 |
0.76 |
GO:0030155 |
regulation of cell adhesion |
15.23 |
0.88 |
0.05 |
9.09 |
0.86 |
0.05 |
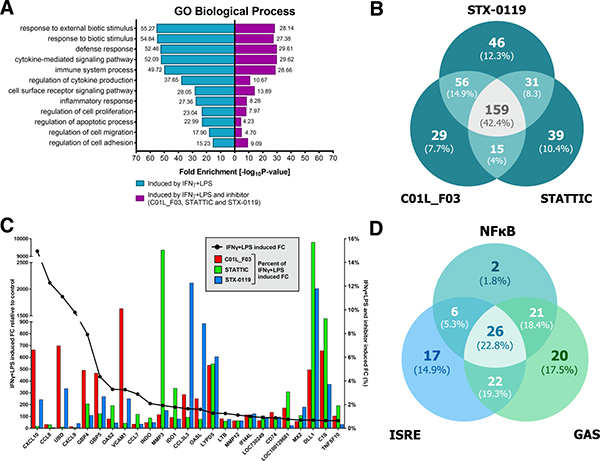
Figure 8: Comparison of top GO terms (A). Terms were selected based on Fold Enrichment values, between genes induced by treatment with IFNγ+LPS and group of IFNγ+LPS induced and inhibited simultaneously by three compounds. Venn diagram distribution of IFNγ+LPS induced and inhibited (C01L_F03, STATTIC, STX-0119) genes (B). Data were obtained from HMECs treated with 50 μM of C01L_F03, 10 μM of STATTIC and 25 μM of STX-0119 and IFNγ+LPS. Three lists of inhibited genes were uploaded and analyzed by VennDiagram package in R [79]. The diagram shows how many genes are induced by IFNγ+LPS and simultaneously inhibited by two or three inhibitors or only by one compound. Representative genes induced by IFNγ+LPS, displaying significant inhibition by all three compounds (C). Expression levels of IFNγ+LPS-induced genes (displayed as ●, left Y-axis) were presented as fold change (FC) relative to control. Expression of C01L_F03 or STATTIC or STX-0119 inhibited genes (displayed as colored bars, right Y-axis) was presented as percent of IFNγ+LPS-induced FC. Venn diagram distribution of ISRE, GAS, NF-κB binding sites among genes inhibited simultaneously by three compounds (D). Three lists of inhibited genes were uploaded and analyzed by VennDiagram package in R [79].
Next, we aimed at identifying the IFNγ+LPS target genes that were commonly inhibited by C01L_F03, STX-0119 and STATTIC. For this, genes were considered of which the expression was more than 4 times inhibited by all three inhibitors as compared to IFNγ+LPS alone (see Materials & Methods). As such, out of the 731 up-regulated genes C01L_F03 inhibited expression of 259, STATTIC of 244 genes and STX-0119 of 292 genes (Figure 8B). What is more, expression of 159 genes was commonly inhibited by C01L_F03, STATTIC and STX-0119 (according to the requirements specified in Materials & Methods), of which the inhibition pattern of the top-25 is displayed in Figure 8C. Among those we could recognize the ones which were already validated by Real-time PCR (Figure 3A; 5A and 5B; Figure 7) e.g. CXCL10, IFIT2, OAS2 or VCAM1, as well as many known STAT target genes (i.e. SOCS1, IRF1, IRF8, APOL1, BID as STAT1 targets; IFIT1, IFIT2, IFIT3, OAS1, OAS2, MX1, MX2, ISG15 as STAT1-STAT2 targets; SOCS3, CCND1, MMP3, FAS PIM1, VEGF, S1PR1 as STAT3 targets). GO analysis of the 159 commonly inhibited genes furthermore revealed enrichment of biological functions connected to pro-inflammatory and pro-atherogenic responses (Figure 8C). The complete list of up and down-regulated genes in response to IFNγ+LPS in the presence or absence of C01L_F03, STATTIC and STX-0119 is shown in Supplementary Table 1.
To address the ‘multi-STAT’ and ‘STAT-only’ characteristics of these three inhibitors, we subsequently performed promoter analysis on the 159 commonly inhibited genes, for the presence of ISRE, STAT or NF-κB binding sites. Figure 8D shows the predicted representation of individual or combined ISRE, STAT or NF-κB binding sites, in their proximal promoters (–950 to + 100). The majority of these genes contained single ISRE (14.9%) or GAS (17.5%) sites, or combinations of ISRE+GAS (19.3%), ISRE+NF-κB (5.3%), GAS+NF-κB (18.4%) or ISRE+GAS+NF-κB (22.8%). In general, under these conditions ISRE motifs correspond to potential binding of multiple STATs (STAT1 and STAT2) and IRFs (IRF1, IRF8 and IRF9), and GAS motifs to that of multiple STATs (STAT1 and STAT3). Surprisingly, 2 genes (1.8%) - IL7R, USP18 were assigned to the group with only an NF-κB site in their proximal promoter. However, both genes contained either a GAS (IL7R) or ISRE (USP18) sequence just outside the 950bp selected promoter area (not shown). These results strongly suggest that C01L_F03, STATTIC and STX-0119 are ‘multi-STAT’ and ‘STAT-only’ inhibitors that commonly inhibit pro-inflammatory and pro-atherogenic gene expression directed by cooperative involvement of STATs with IRFs and/or NF-κB.
C01L_F03, STATTIC and STX-0119 inhibit IFNγ+LPS induced VSMC migration
In addition, we aimed at providing evidence that a multi-STAT inhibitory strategy could be used to inhibit IFNγ+LPS induced vascular inflammation in different models. First, we performed a wound healing assay to examine the effect of all three compounds on IFNγ+LPS induced ECs migration (Figure 9A). Cells stimulated with IFNγ+LPS showed increased capacity of migration, resulting in almost 80% wound coverage after 12-hour of treatment (Figure 9B). In contrast, HMECs treated additionally with C01L_F03, STATTIC or STX-0119 demonstrated drastic reduction of movement. All three inhibitors caused decrease of IFNγ+LPS induced wound healing to less than 15% (Figure 9B), whereas in the absence of IFNγ+LPS they were not capable of closing more than 10% of the artificial wound (Figure 9B). In agreement with the effect on IFNγ+LPS-induced gene expression (Figure 8), based on concentration and time of treatment, STATTIC was the most potent of the three compounds.
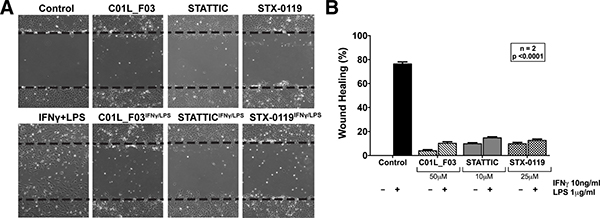
Figure 9: Wound healing assay performed on HMECs treated with C01L_F03, STATTIC and STX-0119 with or without IFNγ+LPS presence (A). Dashed lines determine scratch borders at the beginning of the experiment. Statistical evaluation of wound healing assay (B). Graph shows percentage of healed wound in comparison to 0 h control. Experiment was performed in 2 individual repeats (40 distance measurements in total), which were compared by two-way ANOVA test.
C01L_F03, STATTIC and STX-0119 inhibit IFNγ and LPS induced mononuclear leukocyte adhesion to HUVECs
Our previous studies reported increased adhesion of monocytes to ECs in vitro under static conditions in response to IFNγ and LPS in a STAT1-dependent manner [4]. We next evaluated the effect of IFNγ for 24 h followed by LPS for another 4 h challenge on mononuclear-endothelial cell interactions in vitro using the dynamic flow chamber assay. Thus, freshly-isolated human mononuclear cells were perfused across HUVECs monolayers stimulated or not with the IFNγ+LPS combination. Significant increases in mononuclear cell adhesion were detected in stimulated cells compared to untreated cells (Figure 10). Treatment with C01L_F03 (50 mM; Figure 10A), STATTIC (5 μM; Figure 10B) or STX-0119 (25 mM; Figure 10C) for 4 h or 24 h resulted in significant inhibition of mononuclear cell adhesion to ECs induced by the IFNγ+LPS combination. In the presence of a lower concentration of STATTIC–1 μM (24 h), a similar drastic reduction in the number of adhered mononuclear cells induced by the IFNγ+LPS combination was observed > 70% inhibition, Figure 10B).
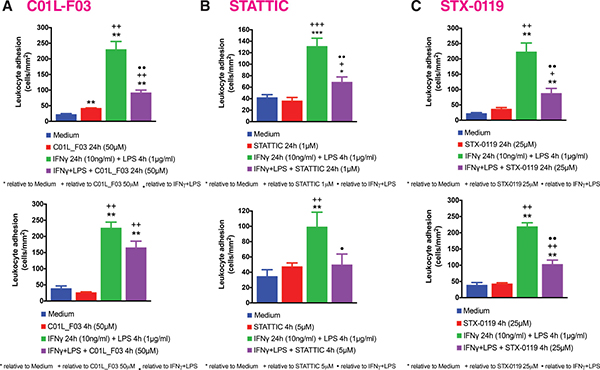
Figure 10: C01L_F03, STATTIC, STX-0119 and inhibit IFNγ+LPS-induced HUVECs mononuclear cell adhesion under physiological flow. HUVECs were stimulated with IFNγ (10 ng/ml) for 24 h and LPS (1 μg/ml) for 4 h. In the experiments, cells were pretreated with (A) C01L_F03 50 μM for 4 h or C01L_F03 50 μM for 24 h; (B) STATTIC 5 μM for 4 h or STATTIC 1 μM for 24 h; (C) STX-0119 25 μM for 4 h or STX-0119 25 μM for 24 h. Freshly isolated human mononuclear cells (106 cells/ml) were perfused across the endothelial monolayers for 5 min. at 0.5dyn/cm2 and leukocyte adhesion quantified. Experiments were performed in 5–7 individual repeats, which were compared by one-way ANOVA test and unpaired two-tailed student T-test with *p < 0.05; **p < 0.01 and ***p < 0.001.
C01L_F03, STATTIC and STX-0119 protect against IFNγ and LPS induced impairment of mesenteric artery contractility
Recently we also observed that among the genes that were highly amplified upon treatment with IFNγ and LPS in primary mouse VSMCs, appeared inducible nitric oxide synthase (iNOS, Nos2). Since dysregulation of Nos2 expression and its activity affect vessel function, we evaluated the physiological ramifications of these experimental conditions using a wire myograph/organ chamber setting and indeed observed that IFNγ and LPS induced impairment of mesenteric artery contractility (Figure 11A). Here we examined the possible protective effect of a multi-STAT inhibitory strategy under similar conditions. As expected, stimulation of the mesenteric arteries isolated from WT animals with IFNγ+LPS resulted in drastic impairment of contractility after subjection to NA treatment as compared to matched control arteries (Figure 11A). Nevertheless, pre-incubation with C01L_F03 (1 mM), STATTIC (1 nM) or STX-0119 (10 nM) prevented the impaired response to NA elicited by IFNγ+LPS (Figure 11B, 11C and 11D respectively). Notably, STATTIC and STX-0119 could only be used in the nM range, without causing IFNγ+LPS-independent impairment of vessel function and integrity (not shown).
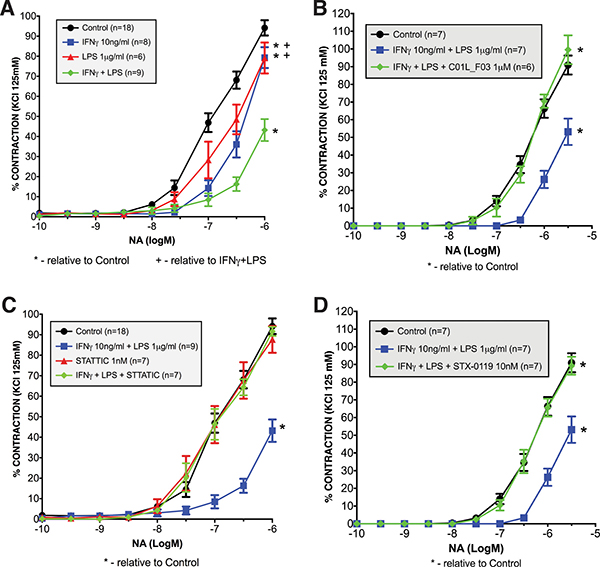
Figure 11: Ameliorated response to noradrenaline in mesenteric arteries stimulated with IFNγ and LPS (A). Isolated mesenteric arteries from WT mice were incubated with IFNγ (10 ng/ml for 3 h prior to NA stimulation), and/or LPS (1 μg/ml for 1.5 h prior to NA stimulation). Next, response to noradrenaline was tested on the small-vessel myograph. C01L_F03, STATTIC and STX-0119 prevent the impaired response to NA elicited by IFNγ+LPS treatment. Isolated mesenteric arteries from WT mice were pre-incubated with (B) C01L_F03 (1 μM for 4 h) or (C) STATTIC (1 nM for 4 h) or (D) STX-0119 (10 nM for 4 h) prior to NA stimulation and/or IFNγ (10 ng/ml for 3 h prior to NA stimulation) and LPS (1 μg/ml for 1.5 h prior to NA stimulation). Next, response to noradrenaline was tested on the small-vessel myograph. Response to noradrenaline in WT mice presented as a percentage of the maximal contraction to KCl. Two-way ANOVA test was used with *p < 0.05 vs. Control and + p < 0.05 vs. IFNγ+LPS.
DISCUSSION
The STAT transcription factor family consists of highly conserved members that play a crucial role in fundamental cellular processes, including cell growth and differentiation, development, apoptosis, immune responses and inflammation [24, 25]. The abnormal activation of STAT pathways is implicated in many human diseases, including CVDs, consequently identifying these proteins as highly interesting therapeutic targets [26, 27].
Searches for STAT3-targeting compounds, exploring the pTyr-SH2 interaction area of STAT3, yielded many small molecules including STATTIC and STX-0119. Only a few inhibitors for other STATs are described. In our pursuit for novel STAT inhibitors, we used a comparative in silico docking strategy on CL library from ZINC in combination with 3D structure models for human (h)STAT1, 2 and 3. We selected three novel STAT1 inhibitors C01, E01 and F01 that inhibit STAT1 phosphorylation by targeting the pY+0 and pY-X of its SH2 domain, however with low potency (Figure 1). To find more potent variants of these compounds, a similarity screen on the CL and the CDL libraries of the ZINC database was performed for compounds with a similarity of ≥ 50% to C01, E01 or F01. Consequently, we identified the novel multi-STAT inhibitor C01L_F03, which targets the SH2 domain of STAT1, STAT2 and STAT3 with the same affinity (Figure 2). In addition, it was shown to simultaneously block phosphorylation and DNA-binding of these three STATs and expression of a selection of target genes in ECs in response to IFNα (Figures 2 and 3). These included the multiple STAT (STAT1/STAT2)-target genes–CXCL10, IFIT2 and OAS2, as well as the STAT1 target gene–IRF1 and the STAT3 target gene–SOCS3. It also predicts anti-inflammatory potential of C01L_F03 by simultaneous inhibiting STAT1, STAT2 and STAT3 activity.
According to a similar docking strategy, recently we obtained further insight into the STAT-SH2 cross-binding specificity of a pre-selection of known STAT3 inhibitors, including STATTIC and STX-0119 [17]. Surprisingly, all of these compounds targeted the highly conserved pTyr-SH2 binding pocket of all STATs. Moreover, based on the binding affinity scores (BS) and graphic representation in the SH2 domain of hSTAT1, hSTAT2 and hSTAT3, we concluded that none of these compounds are STAT3-specific. Here, we followed up on the proposed STAT cross-binding specificity of STATTIC and STX-0119. As compared to C01L_F03, a similar in silico and in vitro multi-STAT inhibiting capacity was shown for STATTIC and STX-0119 (Figures 4 and 5). STATTIC was the most potent of the three compounds, reflected by the time of treatment and concentration used. This could be in agreement with the fact that STATTIC is the smallest compound of the three, and equally targeted the pTyr-binding or hydrophobic SH2 cavity. In addition, the covalent binding of STATTIC has shown to contribute to its potent inhibitory activity towards STAT3 [28]. In contrast, the larger two compounds C01L_F03 and STX-0119 covered both pTyr-binding and hydrophobic SH2 cavities for binding, at the same time. Not surprisingly, the non-specific in silico binding of STATTIC and STX-0119 towards all STATs (STAT1-STAT6) [17], could also be observed for C01L_F03 (data not shown). Together our data provide a molecular basis for STAT-cross-binding specificity of C01L_F03, STATTIC and STX-0119 and their potential to inhibit multi-STAT-activity and target gene expression.
The comparative docking simulations and in vitro inhibition studies related to STAT-cross-binding specificity correspond to other studies. For example, Bill et al. proved the non-specificity of curcumin towards STAT3 and provided evidence of its cross-binding to STAT3 and STAT1 [29]. This also accounted for other natural products like cryptotanshinone [30] and resveratrol analogs (RSVA314 and RSVA405) [31]. Proof that STATTIC is not STAT3 specific correlates with Sanseverino et al., who used human monocyte-derived dendritic cells and found that STATTIC inhibits not only STAT3 activation but also that of STAT1 and to a lesser extent of STAT2, in response to cell activation by IL-6 or IFNβ [32]. An inhibitory effect of STATTIC on STAT1 phosphorylation has also been described in human ovarian cancer cells [33] and melanoma cells [34]. Therefore, evidence accumulates that many of the known STAT3 inhibitors do not seem STAT3 specific.
Docking simulations of C01L_F03, STATTIC and STX-0119 in combination with in silico STAT-SH2 mutagenesis provided further evidence to suggest that these compounds directly interact with hSTAT1, hSTAT2 and hSTAT3 (Figure 6). In this respect, docking simulations highly correlated with in vitro mutagenesis studies of a.a. R602 in STAT1, R601 in STAT2 and R609 in STAT3, which were experimentally proven to be crucial for STAT phosphorylation and reciprocal binding of the pTyr-linker to the STAT-SH2 domain (STAT1-R602 [19]; STAT2-R601 [20]; STAT3-R609 [21]). The same was true, for the second mutation a.a. K584 in STAT1 [22], R583 in STAT2 and K591 in STAT3 [23]. In case of STATTIC and its selective binding to STAT3, the lower STAT3 binding affinity of published STATTIC analogues–STB and STC [13]) coincided with decreased binding stability towards STAT-SH2 models (Figure 6). Combined with the observed in vitro effects of C01L_F03 on STAT DNA-binding (Figure 3) this strongly suggests that all three compounds act as direct STAT-inhibitors.
Of all STATs especially STAT1, STAT2 and STAT3 have been recognized as prominent modulators of inflammation, especially in immune and vascular cells during atherosclerosis [7, 35]. However, STAT-inhibitory strategies targeting CVDs, still await entering the clinic. Based on the newly identified STAT cross-binding mechanism for C01L_F03, STATTIC and STX-0119, we subsequently pursued a multi-STAT inhibitory approach as a novel strategy in the treatment of vascular inflammation and CVDs. Along these lines, we first tested the effect of C01L_F03, STATTIC and STX-0119 on signal integration between IFNγ and LPS, which in vascular cells and atheroma interacting immune cells modulates important aspects of vascular inflammation [10]. Indeed, pre-treatment of ECs with C01L_F03, STATTIC or STX-0119 resulted in a similar inhibition pattern of IFNγ+LPS induced expression of the genes IFIT2, OAS2, CCL5, CXCL10, CXCL9, ICAM1 and VCAM1, with STATTIC being the most potent one (Figure 7). At the same time, we were able to prove that treatment of VSMCs with IFNγ and LPS in the presence of STATTIC resulted in potent inhibition of the pro-inflammatory and pro-atherogenic genes CXCL9, CXCL10, CCL5, Nos2, IFIT1 and OAS2 (not shown). This suggested that C01L_F03, STATTIC and STX-0119 may commonly block cross-talk between IFNγ and LPS in ECs and VSMCs. To provide further evidence for this, we decided to study the genome-wide effect of C01L_F03, STATTIC and STX-0119 on IFNγ+LPS-mediated vascular inflammation (Figure 8). Thus, IFNγ+LPS increased the expression of 731 genes, of which 159 were commonly inhibited by C01L_F03, STATTIC and STX-0119. These 159 genes generally represented the ones with the highest IFNγ+LPS inducible levels and their biological functions reflected strong inhibitory potential of C01L_F03, STATTIC and STX-0119 towards pro-inflammatory and proatherogenic responses. Among those genes many known STAT target genes (i.e. SOCS1, IRF1, IRF8, APOL1, BID as STAT1 targets; IFIT1, IFIT2, IFIT3, OAS1, OAS2, MX1, MX2, ISG15 as STAT1-STAT2 targets; SOCS3, CCND1, MMP3, FAS PIM1, VEGF, S1PR1 as STAT3 targets) could be recognized. More important, promoter analysis of the 159 commonly inhibited genes, for the presence of ISRE, STAT or NF-κB binding sites provided additional evidence that C01L_F03, STATTIC and STX-0119 are ‘multi-STAT’ as well as ‘STAT-only’ inhibitors that commonly inhibit pro-inflammatory and pro-atherogenic gene expression directed by cooperative involvement of multiple STATs with IRFs and/or NF-κB.
According to previous studies, transcription of genes that contain STAT-, ISRE- and NF-κB-binding sites in their promoter regions are often cooperatively regulated by extracellular stimuli that activate STATs, IRFs and NF-κB, such as IFNγ, IFNα and TNFα, IL-1β or LPS [36–44]. In general it is believed that in immune cells, but also in vascular cells, multiple inflammatory stimuli culminate in gene expression that requires cooperation of STATs with IRFs and/or NF-κB [45]. They ultimately promote type I immune actions, which are associated with host-defense mechanisms against viral and bacterial infections and excessive immune responses [46], which are at the basis of different diseases, including CVDs. This is in agreement with our recent data mining studies of atherosclerotic plaque transcriptomes. Indeed, detailed promoter analysis of differentially expressed inflammatory genes in coronary and carotid plaques predicted cooperative involvement of NF-κB, STATs, and IRFs (on ISRE, GAS, ISRE/GAS, ISRE/NF-κB or GAS/NF-κB binding sites) in regulation of their expression in different cell types present in human atherosclerotic plaques [47]. Combined with our findings here, this suggests strong inhibitory potential of C01L_F03, STATTIC and STX-0119 towards vascular inflammation and vascular dysfunction.
The fact that among the 159 genes that were commonly inhibited by C01L_F03, STATTIC and STX-0119 were multiple chemokines and adhesion molecules, prompted us to investigate the effect of a multi-STAT inhibitory strategy on IFNγ+LPS dependent ECs migration and leukocyte adhesion to ECs. The endothelial scratch wound (migration) assay has been described as a simple and well-developed method to measure cell migration in vitro [48], which reflects vascular and immune cell migration during atherosclerosis. In addition, pathological angiogenesis of the vessel wall is a consistent feature of atherosclerotic plaque development and progression of the disease [49]. Indeed, a significant decrease in IFNγ+LPS-induced ‘wound healing’ of scratched ECs could be detected in the presence of C01L_F03, STATTIC and STX-0119 (Figure 9). Interestingly a subset of C01L_F03, STATTIC and STX-0119 inhibited chemokines, including CXCL9, CXCL10, CCL7, CCL8, CCL3L3, CCL5, and CCRL2, has been reported to be increased in cells from the vasculature. Also, transcriptional regulation of a number of these genes in response to IFNγ and LPS in various cell types was shown to involve multiple STATs, IRFs and or NF-κB [10, 47]. This coincides with our results here, but also with our recently published data, in which phosphorylated STAT1 in VSMCs and ECs of human atherosclerotic plaques correlated with elevated expression of the chemokines CXCL9 and CXCL10 [10]. Moreover, evidence exists that chemokines cooperate in leukocyte recruitment to the injured artery during vascular remodeling [50–52] and as such are involved in the pathogenesis of atherosclerosis. Our observation that C01L_F03, STATTIC and STX-0119 were also able to significantly inhibit IFNγ-and LPS-dependent expression of VCAM1 and ICAM1 (Figures 7 and 8 and Table 4, Supplementary Table 1) as well as dramatically reduce adhesion of leukocytes to ECs under dynamic flow conditions (Figure 10), is in line with a prominent role for both adhesion molecules in these phenomena [35]. Moreover, the transcriptional regulation of both ICAM1 and VCAM1 has shown to depend on several transcription factors, including multiple STATs, IRFs, and NF-κB [35, 38, 53]. This could provide an explanation for the potent inhibitory effect of STATTIC on IFNγ+LPS-induced adhesion of leukocytes to ECs, however we cannot exclude the possibility that other adhesion molecules may also be involved.
Finally, a multi-STAT inhibitory strategy was tested for the potential to inhibit IFNγ+LPS induced impairment of mesenteric artery contractility (Figure 11). Previously, we observed that the signal integration between IFNγ and LPS in mesenteric artery segments resulted in impaired aortic contractility (Figure 11A), which coincided with a dramatic increase in VSMC-specific expression of Nos2 [10]. Nos2 participates in vascular dysfunction and is associated with progression of atherosclerosis [54, 55]. Now we prove for the first time that C01L_F03, STATTIC and STX-0119 are able to protect against IFNγ and LPS induced impairment of mesenteric artery contractility, likely by inhibiting Nos2 expression. The transcriptional regulation of Nos2 in response to IFNγ and LPS also has shown to depend on several transcription factors, including STATs, IRFs, and NF-κB [37, 56].
STATTIC as well as STX-0119 have shown to increase the apoptotic rate of a variety of cancer cell lines in vitro and in tumors in vivo, in a STAT3-dependent manner. In our studies, STATTIC and STX-0119, but also C01L_F03 exhibited cytotoxic effects at the highest used concentrations. It is possible that this cell death is mediated by inhibiting the anti-apoptotic effects of STAT3. However, at lower concentrations at which all three inhibitors potently inhibited STAT-dependent pro-inflammatory and pro-atherogenic gene expression, this cell death was not visible. Surprisingly, in the mesenteric artery contractility experiments STATTIC and STX-0119 could only be used in the nM range, without causing IFNγ+LPS-independent impairment of vessel function and integrity. This is a thousand fold less as in the wound healing and adhesion assay and could point to a greater sensitivity of STATTIC and STX-0119 in vivo as compared to in vitro.
Targeting the STAT3 pathway is an upcoming therapeutic approach in the treatment of a rising number of inflammatory or proliferative diseases, e.g. myelofibrosis, myeloproliferative disorders, rheumatoid arthritis and colitis ulcerosa, which also has a modulating effect on vascular cell function. Promising results for several FDA-approved indirect STAT3 inhibitors (Ruxolitinib: JAK1/2-inhibition; Tocilizumab: IL-6 receptor antibody; Tofacitinib: pan-JAK inhibition) as well as known drugs which are currently tested in clinical trials for CVDs treatment (Sirukumab: IL-6 binding antibody; Baricitinib: JAK1/JAK2 inhibitor), predict STAT3-inhibiting strategies to find their way to the clinic in the near future [57]. Recently, Johnson et al. provided the first evidence that direct inhibitors of STAT3 activation protect against AngII-induced oxidative stress, endothelial dysfunction, and hypertension in mice. Incubation of isolated carotid arteries from C57BL/6J mice with AngII overnight increased superoxide and reduced vasodilator responses to the endothelium-dependent agonist acetylcholine. These effects were prevented by the addition of S3I-201 or STATTIC. In vivo, administration of AngII increased arterial pressure, and this effect was prevented by S3I-201 treatment. After systemic treatment with AngII, dilator responses to acetylcholine were reduced in carotid artery and basilar arteries, whereas S3I-201 treatment prevented most of this impairment. In contrast, S31-201 did not prevent AngII induced hypertrophy in the carotid artery [58]. Because AngII promotes vascular disease in the presence of multiple cardiovascular risk factors, the authors suggested that selective targeting of STAT3 might have substantial therapeutic potential. Because we and others proved that S3I-201 and STATTIC are not STAT3-specific [17], an additional role of other STATs in AngII-induced vascular dysfunction and hypertension cannot be ruled out. Indeed, evidence in the literature points to the involvement of STAT1 [59–62], whereas that of STAT2 is currently not known.
A large number of independent studies have been published that confirm the potency of STATTIC as a direct STAT3 inhibitor and support its utility in combating tumor cells. These studies demonstrate the potent anticancer activities of STATTIC, including activity against colon cancer-initiating cells [63], against glioma cell migration on three-dimensional nanofiber scaffolds [64], and against outgrowth of breast cancer cells in an ex vivo model [65], and extend to in vivo activity of STATTIC in a mouse xenograft model for head and neck squamous cell carcinoma [66]. Likewise, STX-0119 also demonstrated potent antitumor effects in vivo in SCC3-bearing nude mice in a STAT3-dependent manner [14]. With their ability to function as multi-STAT inhibitors, like C01L_F03, they could additionally act as potent inhibitors of vascular inflammation in atherosclerosis.
In conclusion, our STAT-inhibitory studies of C01L_F03, STATTIC and STX-0119 and our previous revelation of STAT cross-binding of a pre-selection of known STAT3 inhibitors in combination with the literature, collectively provide evidence for a novel class of multi-STAT inhibitory compounds that target cooperative involvement of multiple STATs with NF-κB and/or IRFs (on ISRE, GAS, ISRE/GAS, ISRE/NF-κB or GAS/NF-κB binding sites) in the regulation of crucial pro-inflammatory and pro-atherogenic target genes [7]. Based on this we propose their potential as a potent clinical application in CVDs apart from their established role in cancer treatment and prevention. It should be noted that the primary aim of our study was to test our novel comparative in silico docking STAT-inhibitor selection strategy and offer support for the possibility of using a multi-STAT inhibitory approach in the context of vascular inflammation. However, our future studies will be dedicated to optimize our selection strategy to identify new STAT inhibitors with higher potency and bioavailability. Further testing and optimizing of already available non-specific STAT inhibitors like STATTIC, i.e. by chemical modification, may also be a promising avenue. In this respect it is also important to consider that STATs are essential factors to maintain normal homeostasis in many body organs and tissues. Consequently, for the treatment of single atherosclerotic lesions and to prevent systemic effects on other STATs, a local, ‘targeted’ application with negligible systemic side effects might be a favourable scenario.
MATERIALS AND METHODS
Protein model preparation
Three-dimensional models of STAT1, STAT2 and STAT3 were prepared based on the existing crystal structures for STATs deposited in RCSB Protein Data Bank: 1YVL–unphosphorylated STAT1 monomer; 1BF5–phosphorylated STAT1 dimer and 1BG1–phosphorylated STAT3 dimer (detailed description see Czerwoniec et al. [67] and Szelag et al. [17]). The AMBER ff99SB charges were applied to models of human STAT1, STAT2 and STAT3 using Chimera Dock Prep protocol [68]. For docking and virtual screening procedures at the level of protein structures we selected the highly conserved pTyr-binding pocket (pY+0) and hydrophobic side-pocket (pY-X) at the surface of the SH2 domain, essential for STAT activation and binding of inhibitors [17, 23]. Then a ligand-based approach, implemented in Surflex-Dock 2.6 [69], was used to generate a ‘protomol’–‘a pre-computed molecular representation of an idealized ligand’. This protomol operates as the molecular probe of the active site to which ligands are matched [15]. In case of STATs, the ligand used to generate the protomol included a fragment of the STAT-SH2 specific pTyr-linker matching the selected sub-pockets (STAT1–GpY701IK; STAT2–KpY690LK; STAT3–PpY705LK [67]).
Compound library selection and small inhibitors preparation
Two small compound libraries of Clean Leads (CL) and Clean Drug-Like (CDL) were selected and downloaded from ZINC Database, with ready-to-dock parameters of protonation state and partial atomic charges [70]. CL with molecular weight between 250–350 g/mol are smaller than most drugs. CDL chemical parameters fulfill criteria of the Lipinski`s rule of five [71, 72]. CL are in general more soluble than their bigger CDL cousins, and thus more likely to actually be assayed in vitro. In 2011 for the purpose of primary virtual screening (pre-screen) a CL subset has been downloaded, containing at that time 712426 compounds. During the next step–similarity screening in 2013–CL subset in number of 4591276 and CDL subset in number of 13195609 compounds were selected.
Geometries of STAT3 inhibitors used for docking–STATTIC [73] and STX-0119 [18] were obtained from ZINC Database (code names ZINC00162014 and ZINC04107278 respectively). The structures were provided in ready-to-dock, 3D formats with molecules represented in biologically relevant forms [70].
Virtual screening of small compound libraries
An adjusted six-step virtual screening procedure was employed to select the top STAT1 inhibitors. The applied strategy is an antecedent to our more advanced protocol for big-scale virtual screening, named CAVS (see Czerwoniec et al. [67]). The procedure used here is characterized by the following steps:
Pre-screen
Docking simulations were carried out with CL library (712426 compounds) for STAT1 using Surflex-Dock 2.6 [69] based on the pscreen algorithm with fast screening parameter settings [15, 67]. As a result, we obtained 10 binding poses of each compound in the predefined area of the STAT1-SH2 domain. Additionally, each binding pose was supplied with a Binding Score value (BS) representing the total predicted binding affinity of the compound to the STAT1-SH2 domain. Moreover, input of polar interactions to the BS (represented by Polar Score) the error rate of binding (represented by Crash) were also calculated.
Primary filtering of inhibitors
At first, the best ten binding poses for each compound were filtered out for further analysis. Then by using the STAT1-BS the binding quality between different compounds was compared. Compounds with the highest STAT1-BS values were selected, checked for availability and 12 compounds (A01-L01) have been purchased for initial experimental validation.
Similarity screen
Based on the experimental results the best three compounds for STAT1 inhibition (C01, E01 and F01 from CL library) were used to perform a structural similarity screening. The CL list containing now 4591276 structures was screened with the criteria of at least 50% similarity to C01, E01 and F01. 1129 CL compounds fulfilled these criteria. Similarly, the CDL list with 13195609 structures was screened for compounds with > 50% similarity and a molecular weight of ≥ 300g/mol, to include bigger structures which could target a larger area of the SH2 domain. These criteria were fulfilled by 832 CDL compounds. Then for a total of 1961 compounds, similarity scores (SIM and RMSD) were calculated using Surflex-Sim 2.6 [69] to assess the level of similarity to C01, E01 and F01.
Re-screen
Repeated docking simulations of a total of 1961 compounds from the similarity screen to STAT1, STAT2 and STAT3-SH2 were carried out with Surflex-Dock 2.6 based on the pgeom algorithm recommended for detailed studies of relative alignments. More exhaustive parameter settings were used for optimal pose prediction of the compounds [15, 67]. As a result, we obtained 20 binding poses of each compound in the predefined area of STAT-SH2 domain.
Secondary filtering of inhibitors
At first, the best of 20 binding poses for each compound was filtered out for further analysis. Then by using the ‘Comparative Binding Affinity Value’ for STAT1 (STAT1-CBAV, more details see Czerwoniec et al. [67]) the binding between STAT1, STAT2 and STAT3 was compared for each compound. Compounds with STAT1-CBAV ≥ 0 were selected for graphical validation.
Binding diversity of conformers
Finally, graphical validation of the selected compounds was represented by the ‘ligand binding pose variation’ (LBPV). This parameter reflects the docking accuracy. For detailed description of this procedure, see Czerwoniec et al. [67]. LBPV in range [0.8–1.0] represents low conformer diversity and very good binding specificity of the compound to STAT-SH2, whereas in range [0.0–0.2] denotes high conformer diversity and poor binding specificity. Finally, compounds with the highest STAT1-CBAV and STAT1-LBPV values were selected, checked for availability and six compounds (C01L_A03 to C01L_F03) have been purchased for further experimental validation.
Comparative docking of STATTIC, STX-0119 and C01L_F03
Docking simulations of STATTIC and STX-0119 for STAT1, STAT2 and STAT3 were carried out with Surflex-Dock 2.6 [69] based on the pgeom algorithm [15, 67], in order to be able to compare them with compounds obtained from CL and CDL virtual screening. As a result, we obtained 20 binding poses of each structure in the predefined area of STAT-SH2 domain. Then, the best twenty binding poses for each compound were filtered out for further analysis. Finally, STAT1-CBAV was determined to compare the binding between STAT1, STAT2 and STAT3 for both compounds. Also, LBPV was used to validate the docking accuracy.
Moreover, we performed more exact docking simulations of STATTIC; two STATTIC analogs STB and STC; STX-0119; C01 and C01L_F03 for STAT1, 2 and 3 (see Szelag et al. [17]). Geometries of two STATTIC analogs, which displayed lesser inhibition of STAT3 binding in vitro [13], were obtained from ZINC Database (code names ZINC00162015 and ZINC00162011 respectively). The structures were provided in ready-to-dock, 3D formats with molecules represented in biologically relevant forms [70]. For all studied complexes of STAT1, 2 and 3 with STATTIC, STB, STC, STX-0119, C01 and C01L_F03 HADDOCK ligand docking protocol [74, 75] was used with addition of Surflex-Dock protocol (pgeomx algorithm) [17] to estimate the ΔG0 (free enthalpy change), which corresponds to the stability of the complex in a protein-ligand interaction in the equilibrium. More negative ΔG0 (higher free enthalpy change) corresponds to stronger interaction between ligand and the protein, which is a reflection of better complex stability.
In silico STAT-SH2 mutagenesis
We have performed docking studies of STATTIC, STX-0119 and C01L_F03 to wt and mutated STAT1, 2, 3 (with our STAT 3D models described in [17]). For this purpose, HADDOCK ligand docking protocol [74, 75] was used with addition of Surflex-Dock protocol [17] to estimate the ΔG0 (free enthalpy change), which corresponds to the stability of the complex in a protein-ligand interaction in the equilibrium. We assumed that mutation of selected a.a. to alanine would impair binding of studied inhibitors to STAT1, 2 and 3-SH2 domain.
Cell culture experiments
Recombinant IFNα and IFNγ were purchased from Merck, while LPS was provided by Sigma-Aldrich. C01 and C01L_A03-C01L_F03 were purchased from Enamine; E01 from Asinex; F01 from ChemDiv; STX-0119 from Merck and STATTIC from Sigma-Aldrich. Rabbit polyclonal antibodies against STAT1-pTyr701, tSTAT1, tSTAT2, tSTAT3 were obtained from Santa Cruz, STAT2-pTyr689 and STAT3-pTyr705 form Merck. Tubulin antibody was purchased from Merck and anti-rabbit HRP-conjugated antibody from Sigma-Aldrich. Human Microvascular Endothelial Cells (HMECs) [76] were provided by the Center for Disease Control and Prevention (Atlanta, GA) and cultured in MCDB-131 medium (IITD PAN, Wroclaw, Poland) containing 10% of fetal bovine serum (FBS) (Gibco, Thermo Fisher Scientific), 100U/ml penicillin, 100 μg/ml streptomycin, 0.01 μg/ml EGF, 0.05 μM hydrocortisone and 2 mM L-glutamine. At least 12 h before the experiment, full medium was exchanged for serum starved-medium (containing 1% of FBS instead of 10%). After minimum 12 h-starvation HMECs were pre-treated with various concentrations of inhibitors: C01, E01, F01 (40 h) or C01L_F03 (48 h) or STATTIC (8 h) or STX-0119 (24 h). Additionally, HMECs were treated with 200U/ml of IFNα (1 h for protein isolation or 4 h for RNA isolation) or 10 ng/ml IFNγ (8 h) and/or 1 μg/ml LPS (4 h).
Western blot analysis
HMECs were washed with phosphate buffered saline (PBS) and lysed using radio-immune precipitation assay (RIPA) lysis buffer (50 mM Tris-HCl, pH = 8.0, 150 mM NaCl, 1% Nonidet-40, 0.5% sodium deoxycholate, 0.1% SDS, 1% protein inhibitor cocktail, 1% EDTA, 0.1% PMSF) and stored at –80°C. Lysates were quantified using bicinchoninic acid (BCA) kit (Perce). Thirty micrograms of protein were loaded on Blot 4–12% Bis-Tris Plus Gels, electrophoresed and transferred to PVDF membranes (Santa Cruz). All western blot analyses were performed with Snap ID system (Merck). Membranes were blocked in 0.125% non-fat dry milk or 1% BSA in TBS-Tween (TBS-T) and incubated with primary antibodies (1:1000 pSTAT1, 1:500 tSTAT1, 1:500 pSTAT2, 1:500 tSTAT2, 1:3500 pSTAT3, 1:500 tSTAT3, 1:2000 tubulin) and then with secondary anti-rabbit HRP-conjugated antibody (1:20000). Immunoreactive bands were visualized by enhanced chemiluminescence (ECL) using Luminata Forte HRP Substrate (Merck) and detected with G:Box System (Syngene). After detection membranes were stripped with buffer containing 25 mM glycine, 1% SDS, pH = 2.0 and re-probed. The software Image Studio Lite from LI-COR Biosciences was used for western blot quantification with α-tubulin as reference protein.
ChIP qPCR
ChIP experiments were performed as described by Daniel et al. in 2014 with minor modifications [77]. Briefly, 15 mln cells were seeded and pre-treated with 50 μM of C01L_F03 48 h and for 1 h with 200U/ml of IFNα. Cross-linking with DSG (Sigma) was performed for 45 min and then with formaldehyde (Sigma) for 10 min. After fixation chromatin was sonicated with a Diagenode Bioruptor Plus to generate fragments with length of 200–1000 bp. Chromatin was immunoprecipitated with antibodies against pSTAT1, pSTAT2 and pSTAT3 (Cell Signalling Technology®). Chromatin-antibody complexes were precipitated with anti-IgA and anti-IgG paramagnetic beads (Life Technologies). After four washing steps, complexes were eluted and the cross-links reversed. DNA fragments were column purified (Qiagen, MinElute). DNA was quantified with a Qubit fluorometer (Invitrogen). Immunoprecipitated DNA was quantified by quantitative PCR (qPCR) and normalized to values obtained after amplification of unprecipitated (input) DNA. Sequences of oligonucleotides (Genomed) are in Table 6.
Table 6: List of primer sequences used in experimental procedures
Gene |
Primer Sequence (5` → 3` order) |
|
|---|---|---|
Forward |
Reverse |
|
ACTB |
ACAGAGCCTCGCCTTTGCCGAT |
ATCATCCATGGTGAGCTGGCGG |
CXCL10 |
GCAGAGGAACCTCCAGTCTCAGCA |
AGAGAGAGGTACTCCTTGAATGCCAC |
CXCL9 |
GTGGTGTTCTTTTCCTCTTGGG |
CTCACTACTGGGGTTCCTTGC |
IFIT2 |
TCTTCCGTGTCTGTTCCATTC |
AGCTGAAAGTTGCCATACCG |
IRF1 |
GTCCAGCCGAGATGCTAAGAGC |
TCTTCCGTGTCTGTTCCATTC |
OAS2 |
CAATCAGCGAGGCCAGTAAT |
TCCAGGTTGGGAGAAGTCAA |
CCL5 |
CCATATTCCTCGGACACCAC |
GGGTGACAAAGACGACTGCT |
ICAM |
CAGCGGCTGACGTGTGCAGTAA |
TTGGGCGCCGGAAAGCTGTA |
VCAM |
TCCAGGTGGAGCTCTACTCATTCCC |
TCCCATTCACGAGGCCACCACT |
OAS2_ChIP |
CGCTGCAGTGGGTGGAGAGA |
GCCGGCAAGACAGTGAATGG |
SOCS3_ChIP |
CCATTCGGGAGTTCCTGGAC |
TTGGCTTCTTGTGCTTGTGC |
IRF1_ChIP |
CCAAACACTTAGCGGGATTC |
GAAATGACGGCACGCAG |
RNA isolation and quantitative reverse transcription-PCR (qRT-PCR) analysis
Total RNA was isolated using GeneMATRIX Universal RNA Purification Kit (EURx, Gdansk, Poland). 500 ng of total RNA was subjected to reverse transcription and PCR amplification was performed in Maxima SYBR Green/ROX qRT-PCR Master Mix (Thermo Fisher Scientific) on the Eco qRT-PCR System (Illumina). The amount of target gene in each sample was normalized to β-actin (ACTB) endogenous control (ΔCT). Data were transformed as described previously [78]. Forward and reverse primers used in experiments are depicted in Table 6.
Microarray analysis
Firstly, before treatment HMECs were starved for 12 h in 1% MCDB medium (IITD PAN, Wroclaw, Poland). Then cells were incubated with C01L_F03 (50 μM, 48 h) or STX-0119 (25 μM, 24 h) or STATTIC (10 μM, 8 h), IFNγ (10 ng/ml, 8 h) and LPS (1 μg/ml, 4 h) before RNA isolation. RNA was isolated from harvested cells with GeneMATRIX Universal RNA Purification Kit (EURx, Gdansk, Poland) and then labelled with Illumina®TotalPrep™ RNA Amplification Kit (Thermo Fisher Scientific). To obtain raw data Standard Illumina Expression BeadChip HumanHT-12v4 hybridization protocol was used. To avoid false results in case of all negative signals their value was changed to one, then signals were log-transformed. For further analysis, statistically significant average gene expression signals from two independent biological repeats were taken for statistical testing (GEO accession: GSE101508). Background subtraction and quantile normalization were applied and genes significantly (p-value ≤ 0.05) up-regulated at least 2-fold in any sample were selected for further analysis. IFNγ+LPS responsive genes that were commonly inhibited by C01L_F03, STATTIC or STX-0119 were selected according to the following formula: Fold Change (FC)IFNγ+LPS/FCIFNγ+LPS + inhibitor value ≥ 4. Lists of inhibited genes were compared by Venn diagram analysis in the VennDiagram package in R [79]. Identification of overlapping genes was based on ‘Gene ID and name’.
Gene ontology enrichment analysis
Two datasets from microarray analysis (IFNγ+LPS induced genes; 731 in total; IFNγ+LPS responsive genes commonly inhibited by C01L_F03, STATTIC and STX-0119) were mapped to gene ontology terms of biological process category using GOrilla webserver [80, 81]. A p-value of 10–3 was used as a threshold and Illumina gene list from HumanHT-12v4 served as a background model. Then all statistically significant enriched GO categories were analyzed by REVIGO webserver [82] with medium similarity (0.7) and SimRel semantic similarity measure and mapped to Homo sapiens background to generate lists without redundant GO terms. Finally, the top 12 enriched GO terms with the highest fold enrichment for cells stimulated with IFNγ+LPS were selected and compared to those treated with tested compounds in presence of IFNγ+LPS.
Promoter analysis
The initial list of 731 IFNγ+LPS induced genes was used for promoter analysis. The list was uploaded into pSCAN webserver [83] in search for ISRE, GAS and NF-κB binding sites. We analyzed 950bp upstream and 50bp downstream of the transcription start sites and obtained lists of overrepresented transcription factor binding sites, including matrix similarity score. Based on the results produced by pSCAN we chose matrices for further analysis. For checking distribution of: ISRE sequence we chose matrices: MA0652.1, MA0137.1, MA0.517.1; for GAS sequence: MA0137.2 and MA0137.3 and for NF-κB binding site: MA0105.1, MA0105.3. To prevent false positive results, we introduced threshold of matrix similarity score ³ 0.85 for potential GAS, ISRE and ³ 0.90 for potential NF-κB binding sites. To confirm ‘STAT specificity’ of tested inhibitors, produced gene lists were merged for each individual binding site and compared with gene list of 159 genes inhibited commonly by C01L_F03, STATTIC and STX-0119 (by Venn diagram analysis by VennDiagram package in R [79]). Identification of overlapping genes was based on ‘Gene ID and name’. The next step was to check if identified sequences may appear in one gene simultaneously. For that purpose, lists of genes containing either ISRE, GAS, NF-κB binding site were compared by Venn diagram analysis according to previously used protocol.
In vitro wound healing assay
HMEC cells were split on 100 mm dishes and plated to reach high confluency. Cells then were starved in MCDB medium (IITD PAN, Wroclaw, Poland) with 0.1% of FBS for 12 h. Next step was to treat 2 dishes with 25 μM of C01L_F03 and 2 dishes with 25 μM of STX-0119. After 12 h of pre-incubation with C01L_F03 or STX-0119 scratches in these dishes were made. Another set of 2 dishes was treated with 10 μM of STATTIC 12 h before pictures were taken. At the same time 10 ng/ml of IFNγ and 1 μg/ml of LPS were added to one dish from each pair treated with C01L_F03, STX-0119 or STATTIC. Additionally, scratches were also made in set of 2 dishes that remained not treated with any inhibitor, one was used as an untreated control and to the second only IFNγ and LPS were added. Pictures were taken with Axio Observer.Z1 Microscope (Zeiss) after 12 h since the moment when scratches were made. The images acquired for each sample from two independent repeats were further analyzed quantitatively by ImageJ [84]. For each image, 20 distances between one side of scratch and the other were measured at certain intervals (μm). By comparing the images from or inhibitor (with or without IFNγ+LPS treatment) to control, the distances of each scratch closure were obtained. Analysis of HMECs migration according to wound healing in vitro, which was performed according to Liang et al. [48].
Leukocyte-endothelial cell interactions under flow conditions
Human umbilical vein endothelial cells (HUVECs) were isolated by collagenase treatment [85] and maintained in human endothelial cell specific medium (EBM-2, Lonza, Verviers, Belgium), supplemented with endothelial growth media (EGM-2, Lonza) and 10% fetal bovine serum (FBS, Lonza). Cells up to passage 1 were grown to confluence to preserve endothelial features. Cells were incubated for 24 h in medium containing 1% FBS prior to every experiment.
Mononuclear cells were obtained from buffy coats of healthy donors by Ficoll Hypaque density gradient centrifugation [86]. The Glycotech flow chamber was assembled and placed on an inverted microscope stage. Freshly isolated mononuclear cells (1 × 10⁶/ml) were then perfused across the endothelial monolayers (HUVECs) unstimulated or stimulated with IFNγ (10 ng/ml, PreproTech, London, UK) for 24 h and LPS (1 μg/ml, Sigma Aldrich, Madrid, Spain) for 4 h. In the experiments cells were incubated with STATTIC 5 μM for 4 h or 1 μM for 24 h, STX-0119 25 μM or C01L_F03 50 μM for 24 h. In all experiments, leukocyte interactions were determined after 5 min at 0.5 dyn/cm2. Cells interacting with the surface of the endothelium were visualized and recorded (×20 objective, ×10 eyepiece) using phase-contrast microscopy (Axio Observer A1 Carl Zeiss microscope, Thornwood, NY) [87].
Ex vivo contractility studies
Four-month-old male C57Bl/6 mice were used for vascular reactivity experiments. Animals were maintained under standardized conditions with an artificial 12 h dark-light cycle, with free access to food and water. All animal studies were performed according to national guidelines and approved by the institutional animal care committees of Spain.
Immediately following sacrifice, the mesentery was removed, and placed in a Petri dish containing Krebs-Henseleit solution (KHS) at 4°C. The first branch mesenteric arteries (mean internal diameter ranged between 200 and 250 μm with non-significant differences observed among the different groups of mice) were dissected and mounted as ring preparations on a small-vessel myograph (DMT, Aarhus, Denmark) to measure isometric tension [88]. The microvessels were exposed to 125 mM KCl to achieve a stable contraction, after which they were washed three times with KHS and a further 30 min. washout period was allowed. At this point, the vascular segments were maintained for 4 h prior to the exposure to increasing concentrations of noradrenaline (NA; 10–10 to 10–6M) to assess vascular contraction. In some experiments, the vascular segments were exposed to STATTIC (1 nM), STX-0119 (10 nM) or C01L_F03 (1 μM), IFNγ (10 ng/ml for 3 h prior to NA stimulation), and/or LPS (1 μg/ml for 1.5 h prior to NA stimulation) based on a previous report [10]. Because of incubation time limitations of the system (< 8 h), we were able to test STATTIC, C01L_F03 and STX-0119 only for 4 h prior to NA stimulation.
Statistical analysis
Results of qRT-PCR assay are presented as mean ± SEM for three independent repeats. Results of wound healing assay are presented as mean ± SEM for two independent repeats. Data for both experiments were compared by two-way ANOVA and unpaired two-tailed student T-test as indicated. A probability value p < 0.0001 was considered statistically significant. Results of mononuclear cell adhesion to HUVEC assay are presented as mean ± SEM for five to seven independent repeats. Data were compared by one-way ANOVA and unpaired two-tailed student T-test. A probability value p < 0.05 was considered statistically significant. Results of ex vivo contractility studies are presented as mean ± SEM for six to eighteen independent repeats. Data were compared by two-way ANOVA. A probability value p < 0.05 was considered statistically significant. All statistical tests were performed with GraphPad Prism version 7.0a for Mac OS X, GraphPad Software, La Jolla California USA, www.graphpad.com.
Abbreviations
ACTB–Actin Beta, APOL1–Apolipoprotein L1, BCA–Bicinchoninic acid, BID–BH3 Interacting Domain Death Agonist, BS–Binding Score value, CAVS–Comparative Approach for Virtual Screening, CBAV–Comparative Binding Affinity Value, CCL3L3–C-C Motif Chemokine Ligand 3 Like 3, CCL5–C-C Motif Chemokine Ligand 5, CCL7–C-C Motif Chemokine Ligand 7, CCL8–C-C Motif Chemokine Ligand 8, CCND1–Cyclin D1, CD74–Cluster of Differentiation 74, CDL–Clean Drug-Like, CL–Clean Leads, CVDs–Cardiovascular Diseases, CXCL10–C-X-C motif chemokine 10, CXCL9–C-X-C motif chemokine 9, ECs–Endothelial Cells, EGF–Endothelial Growth Factor, FAS–Fas Cell Surface Death Receptor, FBS–Fetal Bovine Serum, FC–Fold Change, GAS–Interferon-Gamma Activated Sequence, GBP4–Guanylate Binding Protein 4, GBP5–Guanylate Binding Protein 5, GO–Gene Ontology, HMECs–Human Microvascular Endothelial Cells, HRP–Horseradish Peroxidase, HUVECs–Human Umbilical Vein Endothelial Cells, ICAM1–Intercellular Adhesion Molecule 1, IFI44L–Interferon Induced Protein 44 Like, IFIT1–Interferon Induced Protein With Tetratricopeptide Repeats 1, IFIT2–Interferon Induced Protein With Tetratricopeptide Repeats 2, IFIT3–Interferon Induced Protein With Tetratricopeptide Repeats 3, IFN–Interferon, INDO–Indoleamine 2,3-Dioxygenase 1, IRF–Interferon Regulatory Factor, IRF1–Interferon Regulatory Factor 1, IRF8–Interferon Regulatory Factor 8, ISG15–Interferon-Stimulated Gene 15, ISRE–Interferon-Stimulated Response Element, LBPV–Ligand Binding Pose Variation, LPS–Lipopolisaccharyde, MMP12–Matrix Metalloproteinase-12, MMP3–Matrix Metalloproteinase-3, NF-κB–Nuclear Factor κB, OAS1–2`-5`-Oligoadenylate Synthetase 1, OAS2–2`-5`-Oligoadenylate Synthetase 2, PBS–Phosphate Buffered Saline, PIM1–Pim-1 Proto-Oncogene, S1PR1–Sphingosine-1-Phosphate Receptor 1, SCC3–Sister-Chromatid Cohesion protein 3, SH2–Src Homology 2 Domain, SOCS3–Suppressor of Cytokine Signaling 3, STAT–Signal Transducer and Activator of Transcription, TLR4–Toll-like Receptor 4, TNF–Tumor Necrosis Factor, UBD–Ubiquitin D, VCAM1–Vascular Cell Adhesion Molecule 1, VEGF–Vascular Endothelial Growth Factor, VSMCs–Vascular Smooth Muscle Cells.
Author contributions
All the authors significantly contributed to research and to experimental process. Under the supervision of Prof. dr hab Hans A.R. Bluyssen, dr Malgorzata Szelag performed in silico docking of STAT-SH2 models and Martyna Plens-Galaska performed in vitro STAT inhibition validation. Both were also involved in statistical analysis, microarray data analysis and manuscript preparation. Prof. dr hab. Joanna Wesoly assisted in microarray experiments and counseled during the process of data analysis. Aida Collado, Patrice Marques and Maria Jesus Sanz from the University of Valencia performed leukocyte adhesion experiments. Susana Vallejo, Mariella Ramos-González and Concepción Peiró from Universidad Autónoma de Madrid performed ex vivo contractility studies. Both groups, from Valencia and Madrid were also involved in manuscript preparation/writing process.
ACKNOWLEDGMENTS
We would like to acknowledge David Schaller for testing the first set of compounds and performing Western blot experiments.
CONFLICTS OF INTEREST
The authors have declared that no competing financial interest exists.
FUNDING
This publication was supported by grants UMO-2015/17/B/NZ2/00967 (HB) and UMO-2015/16/T/NZ2/00055 (MS) from National Science Centre Poland. This work was supported by the KNOW RNA Research Centre in Poznan (No. 01/KNOW2/2014) and in part by PL-Grid Infrastructure (MS).
REFERENCES
1. Hansson GK, Hermansson A. The immune system in atherosclerosis. Nat Immunol. 2011; 12:204–212.
2. Stark GR, Darnell JE Jr. The JAK-STAT pathway at twenty. Immunity. 2012; 36:503–514.
3. Gough DJ, Levy DE, Johnstone RW, Clarke CJ. IFNgamma signaling-does it mean JAK-STAT? Cytokine & growth factor reviews. 2008; 19:383–394.
4. Sikorski K, Chmielewski S, Przybyl L, Heemann U, Wesoly J, Baumann M, Bluyssen HA. STAT1-mediated signal integration between IFNgamma and LPS leads to increased EC and SMC activation and monocyte adhesion. Am J Physiol Cell Physiol. 2011; 300:C1337–1344.
5. Jones BW, Means TK, Heldwein KA, Keen MA, Hill PJ, Belisle JT, Fenton MJ. Different Toll-like receptor agonists induce distinct macrophage responses. Journal of leukocyte biology. 2001; 69:1036–1044.
6. Kawai T, Akira S. The role of pattern-recognition receptors in innate immunity: update on Toll-like receptors. Nat Immunol. 2010; 11:373–384.
7. Szelag M, Piaszyk-Borychowska A, Plens-Galaska M, Wesoly J, Bluyssen HA. Targeted inhibition of STATs and IRFs as a potential treatment strategy in cardiovascular disease. Oncotarget. 2016.
8. Decker T, Muller M, Stockinger S. The yin and yang of type I interferon activity in bacterial infection. Nat Rev Immunol. 2005; 5:675–687.
9. O’Neill LA, Bowie AG. The family of five: TIR-domain-containing adaptors in Toll-like receptor signalling. Nat Rev Immunol. 2007; 7:353–364.
10. Chmielewski S, Olejnik A, Sikorski K, Pelisek J, Blaszczyk K, Aoqui C, Nowicka H, Zernecke A, Heemann U, Wesoly J, Baumann M, Bluyssen HA. STAT1-dependent signal integration between IFNgamma and TLR4 in vascular cells reflect pro-atherogenic responses in human atherosclerosis. PLoS One. 2014; 9:e113318.
11. Furqan M, Akinleye A, Mukhi N, Mittal V, Chen Y, Liu D. STAT inhibitors for cancer therapy. J Hematol Oncol. 2013; 6:90.
12. Miklossy G, Hilliard TS, Turkson J. Therapeutic modulators of STAT signalling for human diseases. Nature reviews Drug discovery. 2013; 12:611–629.
13. Schust J, Sperl B, Hollis A, Mayer TU, Berg T. Stattic: a small-molecule inhibitor of STAT3 activation and dimerization. Chem Biol. 2006; 13:1235–1242.
14. Ashizawa T, Miyata H, Ishii H, Oshita C, Matsuno K, Masuda Y, Furuya T, Okawara T, Otsuka M, Ogo N, Asai A, Akiyama Y. Antitumor activity of a novel small molecule STAT3 inhibitor against a human lymphoma cell line with high STAT3 activation. International journal of oncology. 2011; 38:1245–1252.
15. Jain AN. Surflex-Dock 2.1: robust performance from ligand energetic modeling, ring flexibility, and knowledge-based search. J Comput Aided Mol Des. 2007; 21:281–306.
16. Lin J, Buettner R, Yuan YC, Yip R, Horne D, Jove R, Vaidehi N. Molecular dynamics simulations of the conformational changes in signal transducers and activators of transcription, Stat1 and Stat3. J Mol Graph Model. 2009; 28:347–356.
17. Szelag M, Czerwoniec A, Wesoly J, Bluyssen HA. Identification of STAT1 and STAT3 specific inhibitors using comparative virtual screening and docking validation. PLoS One. 2015; 10:e0116688.
18. Matsuno K, Masuda Y, Uehara Y, Sato H, Muroya A, Takahashi O, Yokotagawa T, Furuya T, Okawara T, Otsuka M, Ogo N, Ashizawa T, Oshita C, et al. Identification of a New Series of STAT3 Inhibitors by Virtual Screening. ACS Med Chem Lett. 2010; 1:371–375.
19. McBride KM, Banninger G, McDonald C, Reich NC. Regulated nuclear import of the STAT1 transcription factor by direct binding of importin-alpha. EMBO J. 2002; 21:1754–1763.
20. Gupta S, Yan H, Wong LH, Ralph S, Krolewski J, Schindler C. The SH2 domains of Stat1 and Stat2 mediate multiple interactions in the transduction of IFN-alpha signals. EMBO J. 1996; 15:1075–1084.
21. Kretzschmar AK, Dinger MC, Henze C, Brocke-Heidrich K, Horn F. Analysis of Stat3 (signal transducer and activator of transcription 3) dimerization by fluorescence resonance energy transfer in living cells. Biochem J. 2004; 377:289–297.
22. Devaux P, Priniski L, Cattaneo R. The measles virus phosphoprotein interacts with the linker domain of STAT1. Virology. 2013; 444:250–256.
23. Park IH, Li C. Characterization of molecular recognition of STAT3 SH2 domain inhibitors through molecular simulation. J Mol Recognit. 2011; 24:254–265.
24. Levy DE, Darnell JE Jr. Stats: transcriptional control and biological impact. Nature reviews Molecular cell biology. 2002; 3:651–662.
25. Tamura T, Yanai H, Savitsky D, Taniguchi T. The IRF family transcription factors in immunity and oncogenesis. Annual review of immunology. 2008; 26:535–584.
26. Grote K, Luchtefeld M, Schieffer B. JANUS under stress--role of JAK/STAT signaling pathway in vascular diseases. Vascular pharmacology. 2005; 43:357–363.
27. Sun H, Wang Y. Interferon regulatory factors in heart: stress response beyond inflammation. Hypertension. 2014; 63:663–664.
28. Furtek SL, Matheson CJ, Backos DS, Reigan P. Evaluation of quantitative assays for the identification of direct signal transducer and activator of transcription 3 (STAT3) inhibitors. Oncotarget. 2016; 7:77998–78008.
29. Bill MA, Nicholas C, Mace TA, Etter JP, Li C, Schwartz EB, Fuchs JR, Young GS, Lin L, Lin J, He L, Phelps M, Li PK, Lesinski GB. Structurally modified curcumin analogs inhibit STAT3 phosphorylation and promote apoptosis of human renal cell carcinoma and melanoma cell lines. PLoS One. 2012; 7:e40724.
30. Shin DS, Kim HN, Shin KD, Yoon YJ, Kim SJ, Han DC, Kwon BM. Cryptotanshinone inhibits constitutive signal transducer and activator of transcription 3 function through blocking the dimerization in DU145 prostate cancer cells. Cancer research. 2009; 69:193–202.
31. Capiralla H, Vingtdeux V, Zhao H, Sankowski R, Al-Abed Y, Davies P, Marambaud P. Resveratrol mitigates lipopolysaccharide- and Abeta-mediated microglial inflammation by inhibiting the TLR4/NF-kappaB/STAT signaling cascade. J Neurochem. 2012; 120:461–472.
32. Sanseverino I, Purificato C, Gauzzi MC, Gessani S. Revisiting the specificity of small molecule inhibitors: the example of stattic in dendritic cells. Chem Biol. 2012; 19:1213–1214. author reply 1215–1216.
33. Debnath B, Xu S, Neamati N. Small molecule inhibitors of signal transducer and activator of transcription 3 (Stat3) protein. J Med Chem. 2012; 55:6645–6668.
34. Bill MA, Fuchs JR, Li C, Yui J, Bakan C, Benson DM Jr, Schwartz EB, Abdelhamid D, Lin J, Hoyt DG, Fossey SL, Young GS, et al. The small molecule curcumin analog FLLL32 induces apoptosis in melanoma cells via STAT3 inhibition and retains the cellular response to cytokines with anti-tumor activity. Mol Cancer. 2010; 9:165.
35. Dutzmann J, Daniel JM, Bauersachs J, Hilfiker-Kleiner D, Sedding DG. Emerging translational approaches to target STAT3 signalling and its impact on vascular disease. Cardiovasc Res. 2015; 106:365–374.
36. Voraberger G, Schafer R, Stratowa C. Cloning of the human gene for intercellular adhesion molecule 1 and analysis of its 5’-regulatory region. Induction by cytokines and phorbol ester. J Immunol. 1991; 147:2777–2786.
37. Lowenstein CJ, Alley EW, Raval P, Snowman AM, Snyder SH, Russell SW, Murphy WJ. Macrophage nitric oxide synthase gene: two upstream regions mediate induction by interferon gamma and lipopolysaccharide. Proc Natl Acad Sci U S A. 1993; 90:9730–9734.
38. Jahnke A, Johnson JP. Synergistic activation of intercellular adhesion molecule 1 (ICAM-1) by TNF-alpha and IFN-gamma is mediated by p65/p50 and p65/c-Rel and interferon-responsive factor Stat1 alpha (p91) that can be activated by both IFN-gamma and IFN-alpha. FEBS Lett. 1994; 354:220–226.
39. Ohmori Y, Hamilton TA. The interferon-stimulated response element and a kappa B site mediate synergistic induction of murine IP-10 gene transcription by IFN-gamma and TNF-alpha. J Immunol. 1995; 154:5235–5244.
40. Ohmori Y, Schreiber RD, Hamilton TA. Synergy between interferon-gamma and tumor necrosis factor-alpha in transcriptional activation is mediated by cooperation between signal transducer and activator of transcription 1 and nuclear factor kappaB. J Biol Chem. 1997; 272:14899–14907.
41. Pine R. Convergence of TNFalpha and IFNgamma signalling pathways through synergistic induction of IRF-1/ISGF-2 is mediated by a composite GAS/kappaB promoter element. Nucleic acids research. 1997; 25:4346–4354.
42. Ohmori Y, Hamilton TA. Requirement for STAT1 in LPS-induced gene expression in macrophages. Journal of leukocyte biology. 2001; 69:598–604.
43. Naschberger E, Werner T, Vicente AB, Guenzi E, Topolt K, Leubert R, Lubeseder-Martellato C, Nelson PJ, Sturzl M. Nuclear factor-kappaB motif and interferon-alpha-stimulated response element co-operate in the activation of guanylate-binding protein-1 expression by inflammatory cytokines in endothelial cells. Biochem J. 2004; 379:409–420.
44. Wienerroither S, Shukla P, Farlik M, Majoros A, Stych B, Vogl C, Cheon H, Stark GR, Strobl B, Muller M, Decker T. Cooperative Transcriptional Activation of Antimicrobial Genes by STAT and NF-kappaB Pathways by Concerted Recruitment of the Mediator Complex. Cell Rep. 2015; 12:300–312.
45. Sikorski K, Chmielewski S, Olejnik A, Wesoly JZ, Heemann U, Baumann M, Bluyssen H. STAT1 as a central mediator of IFNgamma and TLR4 signal integration in vascular dysfunction. JAKSTAT. 2012; 1:241–249.
46. O’Shea JJ, Ma A, Lipsky P. Cytokines and autoimmunity. Nat Rev Immunol. 2002; 2:37–45.
47. Sikorski K, Wesoly J, Bluyssen HA. Data mining of atherosclerotic plaque transcriptomes predicts STAT1-dependent inflammatory signal integration in vascular disease. International journal of molecular sciences. 2014; 15:14313–14331.
48. Liang CC, Park AY, Guan JL. In vitro scratch assay: a convenient and inexpensive method for analysis of cell migration in vitro. Nat Protoc. 2007; 2:329–333.
49. Van Hinsbergh VW, Tasev D. Platelets and thromboxane receptors: pivotal players in arteriogenesis. Cardiovasc Res. 2015; 107:400–402.
50. Schindler C, Levy DE, Decker T. JAK-STAT signaling: from interferons to cytokines. J Biol Chem. 2007; 282:20059–20063.
51. Wesoly J, Szweykowska-Kulinska Z, Bluyssen HA. STAT activation and differential complex formation dictate selectivity of interferon responses. Acta Biochim Pol. 2007; 54:27–38.
52. Lopez-Pelaez M, Lamont DJ, Peggie M, Shpiro N, Gray NS, Cohen P. Protein kinase IKKbeta-catalyzed phosphorylation of IRF5 at Ser462 induces its dimerization and nuclear translocation in myeloid cells. Proc Natl Acad Sci U S A. 2014; 111:17432–17437.
53. Caldenhoven E, Coffer P, Yuan J, Van de Stolpe A, Horn F, Kruijer W, Van der Saag PT. Stimulation of the human intercellular adhesion molecule-1 promoter by interleukin-6 and interferon-gamma involves binding of distinct factors to a palindromic response element. J Biol Chem. 1994; 269:21146–21154.
54. Kuhlencordt PJ, Chen J, Han F, Astern J, Huang PL. Genetic deficiency of inducible nitric oxide synthase reduces atherosclerosis and lowers plasma lipid peroxides in apolipoprotein E-knockout mice. Circulation. 2001; 103:3099–3104.
55. Niu XL, Yang X, Hoshiai K, Tanaka K, Sawamura S, Koga Y, Nakazawa H. Inducible nitric oxide synthase deficiency does not affect the susceptibility of mice to atherosclerosis but increases collagen content in lesions. Circulation. 2001; 103:1115–1120.
56. Farlik M, Reutterer B, Schindler C, Greten F, Vogl C, Muller M, Decker T. Nonconventional initiation complex assembly by STAT and NF-kappaB transcription factors regulates nitric oxide synthase expression. Immunity. 2010; 33:25–34.
57. Darnell JE Jr, Kerr IM, Stark GR. Jak-STAT pathways and transcriptional activation in response to IFNs and other extracellular signaling proteins. Science. 1994; 264:1415–1421.
58. Johnson AW, Kinzenbaw DA, Modrick ML, Faraci FM. Small-molecule inhibitors of signal transducer and activator of transcription 3 protect against angiotensin II-induced vascular dysfunction and hypertension. Hypertension. 2013; 61:437–442.
59. Horiuchi M, Cui TX, Li Z, Li JM, Nakagami H, Iwai M. Fluvastatin enhances the inhibitory effects of a selective angiotensin II type 1 receptor blocker, valsartan, on vascular neointimal formation. Circulation. 2003; 107:106–112.
60. Banes-Berceli AK, Ketsawatsomkron P, Ogbi S, Patel B, Pollock DM, Marrero MB. Angiotensin II and endothelin-1 augment the vascular complications of diabetes via JAK2 activation. American journal of physiology Heart and circulatory physiology. 2007; 293:H1291–1299.
61. Wincewicz A, Sulkowska M, Rutkowski R, Sulkowski S, Musiatowicz B, Hirnle T, Famulski W, Koda M, Sokol G, Szarejko P. STAT1 and STAT3 as intracellular regulators of vascular remodeling. Eur J Intern Med. 2007; 18:267–271.
62. Jiao S, Zheng X, Yang X, Zhang J, Wang L. Losartan inhibits STAT1 activation and protects human glomerular mesangial cells from angiotensin II induced premature senescence. Canadian journal of physiology and pharmacology. 2012; 90:89–98.
63. Lin L, Liu A, Peng Z, Lin HJ, Li PK, Li C, Lin J. STAT3 is necessary for proliferation and survival in colon cancer-initiating cells. Cancer research. 2011; 71:7226–7237.
64. Agudelo-Garcia PA, De Jesus JK, Williams SP, Nowicki MO, Chiocca EA, Liyanarachchi S, Li PK, Lannutti JJ, Johnson JK, Lawler SE, Viapiano MS. Glioma cell migration on three-dimensional nanofiber scaffolds is regulated by substrate topography and abolished by inhibition of STAT3 signaling. Neoplasia. 2011; 13:831–840.
65. Katz E, Sims AH, Sproul D, Caldwell H, Dixon MJ, Meehan RR, Harrison DJ. Targeting of Rac GTPases blocks the spread of intact human breast cancer. Oncotarget. 2012; 3:608–619.
66. Adachi M, Cui C, Dodge CT, Bhayani MK, Lai SY. Targeting STAT3 inhibits growth and enhances radiosensitivity in head and neck squamous cell carcinoma. Oral Oncol. 2012; 48:1220–1226.
67. Czerwoniec A, Szelag M, Juszczak K, Wesoly J, Bluyssen HAR. CAVS—Novel in silico selection strategy of specific STAT inhibitory compounds. Journal of Computational Science. 2015; 10:186–194.
68. Pettersen EF, Goddard TD, Huang CC, Couch GS, Greenblatt DM, Meng EC, Ferrin TE. UCSF Chimera--a visualization system for exploratory research and analysis. Journal of computational chemistry. 2004; 25:1605–1612.
69. Jain AN. Surflex: fully automatic flexible molecular docking using a molecular similarity-based search engine. J Med Chem. 2003; 46:499–511.
70. Irwin JJ, Shoichet BK. ZINC--a free database of commercially available compounds for virtual screening. J Chem Inf Model. 2005; 45:177–182.
71. Lipinski CA, Lombardo F, Dominy BW, Feeney PJ. Experimental and computational approaches to estimate solubility and permeability in drug discovery and development settings. Adv Drug Deliv Rev. 2001; 46:3–26.
72. Lipinski CA. Lead- and drug-like compounds: the rule-of-five revolution. Drug Discov Today Technol. 2004; 1:337–341.
73. McMurray JS. A new small-molecule Stat3 inhibitor. Chemistry & biology. 2006; 13:1123–1124.
74. Bonvin AM. HADDOCK small molecule binding site screening. 2007.
75. Sennhauser G, Amstutz P, Briand C, Storchenegger O, Grutter MG. Drug export pathway of multidrug exporter AcrB revealed by DARPin inhibitors. PLoS Biol. 2007; 5:e7.
76. Ades EW, Candal FJ, Swerlick RA, George VG, Summers S, Bosse DC, Lawley TJ. HMEC-1: establishment of an immortalized human microvascular endothelial cell line. J Invest Dermatol. 1992; 99:683–690.
77. Daniel B, Nagy G, Hah N, Horvath A, Czimmerer Z, Poliska S, Gyuris T, Keirsse J, Gysemans C, Van Ginderachter JA, Balint BL, Evans RM, Barta E, Nagy L. The active enhancer network operated by liganded RXR supports angiogenic activity in macrophages. Genes Dev. 2014; 28:1562–1577.
78. Willems E, Leyns L, Vandesompele J. Standardization of real-time PCR gene expression data from independent biological replicates. Analytical biochemistry. 2008; 379:127–129.
79. Chen H, Boutros PC. VennDiagram: a package for the generation of highly-customizable Venn and Euler diagrams in R. BMC bioinformatics. 2011; 12:35.
80. Eden E, Lipson D, Yogev S, Yakhini Z. Discovering motifs in ranked lists of DNA sequences. PLoS Comput Biol. 2007; 3:e39.
81. Eden E, Navon R, Steinfeld I, Lipson D, Yakhini Z. GOrilla: a tool for discovery and visualization of enriched GO terms in ranked gene lists. BMC bioinformatics. 2009; 10:48.
82. Supek F, Bosnjak M, Skunca N, Smuc T. REVIGO summarizes and visualizes long lists of gene ontology terms. PLoS One. 2011; 6:e21800.
83. Zambelli F, Pesole G, Pavesi G. Pscan: finding over-represented transcription factor binding site motifs in sequences from co-regulated or co-expressed genes. Nucleic acids research. 2009; 37:W247–252.
84. Schneider CA, Rasband WS, Eliceiri KW. NIH Image to ImageJ: 25 years of image analysis. Nature Methods. 2012; 9:671–675.
85. Rius C, Piqueras L, Gonzalez-Navarro H, Albertos F, Company C, Lopez-Gines C, Ludwig A, Blanes JI, Morcillo EJ, Sanz MJ. Arterial and venous endothelia display differential functional fractalkine (CX3CL1) expression by angiotensin-II. Arterioscler Thromb Vasc Biol. 2013; 33:96–104.
86. Mateo T, Naim Abu Nabah Y, Losada M, Estelles R, Company C, Bedrina B, Cerda-Nicolas JM, Poole S, Jose PJ, Cortijo J, Morcillo EJ, Sanz MJ. A critical role for TNFalpha in the selective attachment of mononuclear leukocytes to angiotensin-II-stimulated arterioles. Blood. 2007; 110:1895–1902.
87. Rius C, Company C, Piqueras L, Cerda-Nicolas JM, Gonzalez C, Servera E, Ludwig A, Morcillo EJ, Sanz MJ. Critical role of fractalkine (CX3CL1) in cigarette smoke-induced mononuclear cell adhesion to the arterial endothelium. Thorax. 2013; 68:177–186.
88. Sobrino A, Vallejo S, Novella S, Lazaro-Franco M, Mompeon A, Bueno-Beti C, Walther T, Sanchez-Ferrer C, Peiro C, Hermenegildo C. Mas receptor is involved in the estrogen-receptor induced nitric oxide-dependent vasorelaxation. Biochem Pharmacol. 2017; 129:67–72.
89. Unni S, Huang Y, Hanson RM, Tobias M, Krishnan S, Li WW, Nielsen JE, Baker NA. Web servers and services for electrostatics calculations with APBS and PDB2PQR. Journal of computational chemistry. 2011; 32:1488–1491.