
INTRODUCTION
Neuroendocrine tumors (NET) are relatively rare neoplasms. However, the number of patients with NET has recently been increasing all over the world [1, 2]. In Japan, the incidence of pancreatic neuroendocrine neoplasm (PanNEN) has been reported to be increasing, showing a 1.2-fold increase from 2005 to 2010 [3]. Among NETs of various organs, the prognosis of PanNEN is poorer [3]. Liver metastasis, found in 42.0% at the initial diagnosis, is one of the poor prognostic factors of PanNEN [3]. The molecular mechanism, promotors, and inhibitors of liver metastasis of PanNEN are mostly unknown. Liver metastasis of PanNEN is generally treated with liver resection, chemotherapy, peptide receptor radionuclide therapy (PRRT), and so on. Several reports have shown that the five-year survival rate after liver resection for PanNEN is 61–76%, and the liver recurrence rate is 54–94% at 5 years after prior liver resection [4–7]. Thus, it is difficult to obtain cure by hepatectomy for liver metastasis of PanNEN. Also, the efficacy of non-surgical treatment for metastatic PanNEN is limited. Therefore, since new treatment strategies are required to improve the prognosis of PanNEN with liver metastasis, it is very important to identify novel liver metastasis-correlated molecules of PanNEN.
Recently, novel biomarkers or target proteins of metastasis in several malignancies, such as pancreatic cancer, bile duct cancer, colorectal cancer, and lung cancer, have been identified by proteomics using clinical samples [8–14]. Prognostic or metastasis-correlated proteins have been examined by proteomic analyses between the primary tumor and metastatic tumor in colon or lung cancer [13, 14]. However, only two studies on the proteomics of PanNEN have been reported. One was a proteomic analysis between insulinoma with and without lymph node metastases [15], and the other one between the tumor tissue of insulinoma and normal tissue [16]. There has been no study of proteomic analysis comparing the primary tumor of PanNEN with liver metastasis. The aim of the present study was to elucidate novel liver metastasis-correlated proteins of PanNEN by proteomic analysis to compare the primary tumor with the paired liver metastasis.
RESULTS
Discovery stage
Protein identification by shotgun proteomics and semi-quantitative comparison
Both primary pancreatic tumor (PT) and paired metastatic liver tumor (LT) samples of 7 cases with PanNEN were investigated by proteomic analysis to determine differences between their protein expressions (Figure 1 and Table 1). A total of 3,722 proteins, including 2,622 proteins in PT and 2,993 in LT, were identified by shotgun proteomics (Figure 2A). Seven hundred and twenty-nine proteins (19.6%) were identified in PT alone, while there were 1,100 proteins (29.6%) in LT alone. 1,893 proteins (50.8%) overlapped. All of the 3,722 proteins identified by shotgun proteomics were compared semi-quantitatively using spectral counting methods (Figure 2B). Based on Rsc >1 or <-1, and statistical significance (p < 0.05 by G-test), 33 and 76 proteins were overexpressed in PT and LT, respectively, were selected. Of these proteins, we focused on 3 and 7 proteins overexpressed in PT and LT, respectively, as candidate proteins potentially associated with malignant disease, referring to previous reports, and so on (Table 2).
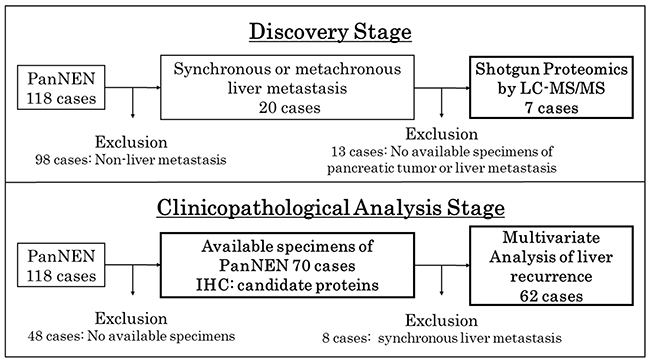
Figure 1: Study flow chart of the sample selection. The study was performed in two stages, a discovery stage for shotgun proteomics by LC-MS/MS and a clinicopathological analysis stage for analysis by IHC and multivariate analysis of liver recurrence.
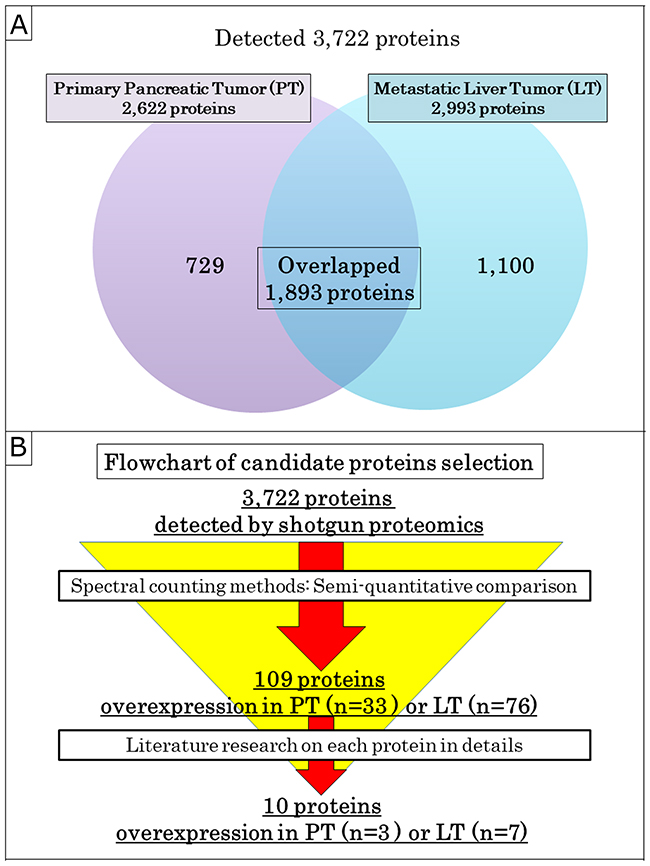
Figure 2: Selection of the candidate proteins. (A) Venn diagram of proteins detected by shotgun proteomics. (B) Flowchart of the candidate proteins selection. All of the 3,722 proteins identified by shotgun proteomics were semi-quantitatively analyzed by the spectral counting method and were narrowed down to 109 proteins. Next, 10 candidate proteins, including 3 and 7 proteins overexpressed in PT and LT, respectively, were selected from among 109 proteins by a literature review on biological role and relevance of malignant disease.
Table 1: Patient characteristics examined by proteomics
Case |
Age |
Gender |
LT |
WHO 2017 Grade |
Ki-67 (%) |
Function type |
Primary tumor diameters (mm) |
RFS (months) |
Prognosis (OS, months) |
|---|---|---|---|---|---|---|---|---|---|
1 |
53 |
Male |
synchronous |
G2 |
5.0 |
NF |
14 |
- |
Alive (89.3) |
2 |
49 |
Female |
synchronous |
G3 |
30.5 |
NF |
70 |
- |
Alive (73.1) |
3 |
63 |
Female |
synchronous |
G3 |
25.0 |
NF |
46 |
- |
Alive (55.2) |
4 |
69 |
Male |
synchronous |
G2 |
8.0 |
NF |
75 |
- |
Dead (72.7) |
5 |
53 |
Male |
metachronous |
G1 |
2.7 |
Gastrinoma |
50 |
25.4 |
Dead (87.0) |
6 |
75 |
Male |
metachronous |
G2 |
11.1 |
NF |
150 |
24.6 |
Dead (80.0) |
7 |
25 |
Male |
synchronous |
G3 |
24.5 |
NF |
40 |
- |
Dead (77.7) |
Abbreviations: NF: non-functioning; RFS: recurrence-free survival; OS: overall survival.
Table 2: List of the candidate proteins selected by shotgun proteomics and semi-quantitative comparison
UniProt Accession Number |
Official Symbol |
Fold Change |
Function by Gene Ontology Annotation Database |
Related pathway by KEGG PATHWAY Database |
|---|---|---|---|---|
Selected overexpressed proteins in pancreatic tumor |
||||
P62491 |
RAB11A |
2.8 |
GTP binding; GTPase activity; Microtubule binging; Myosin V binding; Protein binding |
Endocrine and other factor-regulated calcium reabsorption; Endocytosis; Pancreatic secretion: Vasopressin-regulated water reabsorption |
F5H7S3 |
TPM1 |
6.6 |
Actin biding; Cytoskeletal protein binding; Structural constituent of cytoskeleton; Structural constituent of muscle |
MicroRNAs in cancer; Cardiac muscle contraction; Adrenergic signaling in cardiomyocytes etc. |
Q15836 |
VAMP3 |
3.9 |
Protein binding; SNAP receptor activity; SNARE binding |
Phagosome; SNARE interactions in vesicular transport |
Selected overexpressed proteins in liver tumor |
||||
P08133 |
ANXA6 |
2.2 |
GTP binding; calcium-dependent phospholipid binding; calcium-dependent protein binding etc. |
No hits |
Q9Y2B0 |
CNPY2 |
2.2 |
Protein binding |
No hits |
P68431 |
HIST1H3A |
2.1 |
Cadherin binding; histone binding; nucleosomal DNA binding; protein binding |
Transcriptional misregulation in cancer; Alcoholism; Systemic lupus erythematosus |
Q15691 |
MAPRE1 |
2.3 |
RNA binding; cadherin binding; identical protein binding; microtubule plus-end binding; protein C-terminus binding etc. |
No hits |
Q15907 |
RAB11B |
2.1 |
GDP binding; GTP binding; GTPase activity; cadherin binding; myosin V binding; protein binding |
Endocytosis; AMPK signaling pathway; Vasopressin-regulated water reabsorption |
P67812 |
SEC11A |
3.2 |
Peptidase activity; serine-type peptidase activity |
Protein export |
Q13509 |
TUBB3 |
5.1 |
GTP binding; GTPase activity; Protein binding; Structural constituent of cytoskeleton |
Phagosome; Gap junction; Pathogenic Escherichia coli infection |
Validation of protein expression by immunohistochemistry
In order to confirm the results of proteomic analysis, the expressions of 10 candidate proteins in samples from the discovery stage were evaluated by immunohistochemistry (IHC). Only Histone H3.1 (HIST1H3A) was expressed at the nuclear level, and the others were at the cytoplasm and/or cell membrane level. One protein was not immunoreactive, but the others, which were positive in the tumor cells, could be evaluated. Comparing the protein expressions between the tumors and background normal tissue, or PT and paired LT, Annexin A6 (ANXA6), the canopy FGF signaling regulator 2 (CNPY2), Ras-related protein Rab-11B (RAB11B) and Tubulin beta-3 chain (TUBB3) were the most compatible with the results of the proteomic analysis, and were expressed higher in LT than in PT (Figure 3). These 4 proteins were chosen as candidate liver metastasis-correlated proteins for the next clinicopathological analysis stage, which evaluated the correlationship between the expression of the candidate proteins by IHC and the clinicopathological factors in the surgically resected cases with PanNEN.
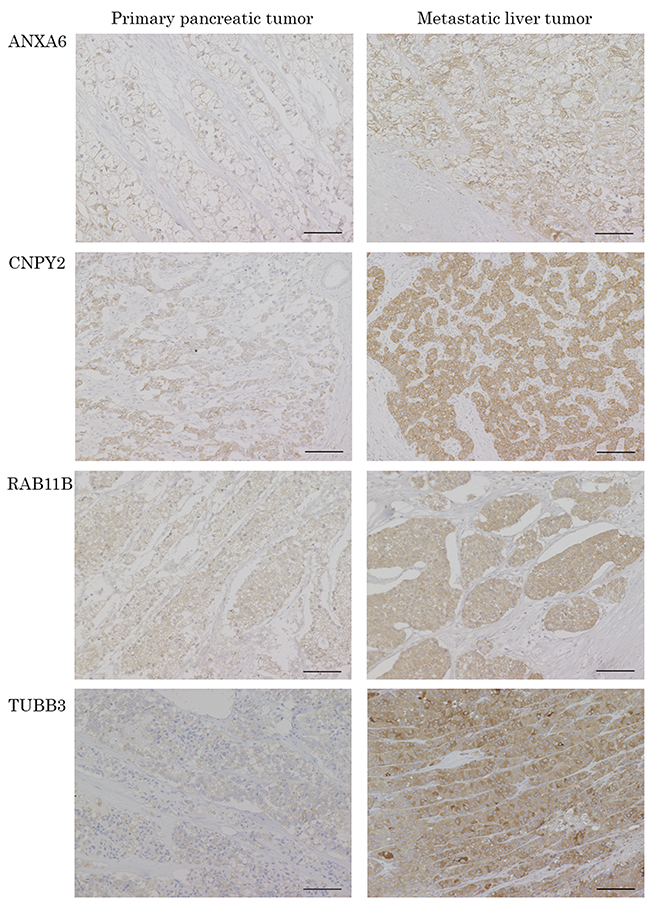
Figure 3: Representative pictures of IHC for the candidate proteins in PT and paired LT. The protein expressions of ANXA6, CNPY2, RAB11B and TUBB3 were confirmed in the patients evaluated with proteomics by IHC. ANXA6, CNPY2, RAB11B and TUBB3 are IHC images of patient NO.6, 4, 2 and 3, respectively. Scale bars indicate 100 μm.
Clinicopathological analysis stage
Patients’ characteristics
Of 118 PanNEN patients who received surgical resection between 1994 and 2016 at Tohoku University Hospital, 70 patients, excluding 48 without available formalin-fixed paraffin-embedded (FFPE) samples, were examined (Figure 1). Table 3 shows the clinicopathological background of the patients. The expression of the candidate proteins in PT was evaluated in patients with or without liver metastasis (Supplementary Figure 1). Synchronous and metachronous liver metastasis was seen in 8 (11.4%) and 12 cases (17.1%), respectively. No liver metastasis was observed in 50 cases (71.4%). High-grade in the WHO 2017 grade, Ki-67 labeling index, mitotic count, tumor size, vascular and lymphatic invasion rates and stage (European Neuroendocrine Tumor Society: ENETS) were significantly higher in the synchronous and metachronous metastasis groups (WHO 2017 grade: p = 0.002; Ki-67: p = 0.003; mitotic count: p = 0.017; tumor size: p = 0.001; vascular invasion: p < 0.001; lymphatic invasion p = 0.002; stage: p < 0.001).
Table 3: Patient characteristics in the clinicopathological analysis stage
Factors |
Synchronous liver metastasis (n = 8) |
Metachronous liver metastasis (n = 12) |
Non-liver metastasis |
p value |
|---|---|---|---|---|
Gender (male: female) |
5: 3 |
7: 5 |
23: 27 |
0.595 |
Age (median±SD) |
51±15.5 |
53±12.8 |
58±17.9 |
0.478 |
Function type NF/ insulinoma/ gastrinoma/ glucagonoma (%) |
7/0/1/0 (87.5/0/12.5/0) |
8/ 2/ 1/ 1 (66.7/ 16.7/ 8.3/ 8.3) |
33/ 15/ 1/ 1 (66.0/ 30.0/ 2.0/ 2.0) |
0.054 |
WHO 2017 Grade G1/ G2/ G3 (%) |
0/5/3 (0/62.5/37.5) |
4/ 6/ 2 (33.3/ 50.0/ 16.7) |
27/ 22/ 1 (54.0/ 44.0/ 2.0) |
0.002 |
Ki-67 (median, range) |
9.0 (2.0–30.5) |
9.7 (1.1–80.0) |
2.6 (0.1–25.2) |
0.003 |
Mitotic count (median, range) |
2 (1–7) |
1 (0–8) |
1 (0–14) |
0.017 |
Tumor size (mm, median, range) |
48 (14–75) |
27 (10–150) |
18 (6–70) |
0.001 |
Lymph node metastasis Positive: Negative (positive rate, %) |
3: 5 (37.5) |
3: 9 (25.0) |
6: 44 (12.0) |
0.100 |
Vascular invasion Positive: Negative (positive rate, %) |
8: 0 (100.0) |
9: 3 (75.0) |
15: 35 (30.0) |
<0.001 |
Lymphatic invasion Positive: Negative (positive rate, %) |
5: 3 (62.5) |
7: 5 (58.3) |
9: 41 (18.0) |
0.002 |
Stage (ENETS) I: II: III: IV |
0: 0: 0: 8 |
3: 6: 3: 0 |
23: 21: 6: 0 |
<0.001 |
Follow up period (Months, median, range) |
75.4 (48.4–146.3) |
54.8 (14.5–157.5) |
57.6 (6.4–239.0) |
0.206 |
Expression in PT; ANXA6 (%) |
6 (75.0) |
11 (91.7) |
31 (62.0) |
0.157 |
Expression in PT; CNPY2 (%) |
7 (87.5) |
10 (83.3) |
19 (38.0) |
0.001 |
Expression in PT; RAB11B (%) |
5 (62.5) |
6 (50.0) |
25 (50.0) |
0.864 |
Expression in PT; TUBB3 (%) |
2 (25.0) |
8 (66.7) |
31 (62.0) |
0.126 |
In the IHC analysis, normal islet cells had negative expression of CNPY2 and positive expression of ANXA6, RAB11B and TUBB3 (Figure 4). The expression of these candidate proteins was not detected in normal exocrine tissue of the pancreas (Figure 4).
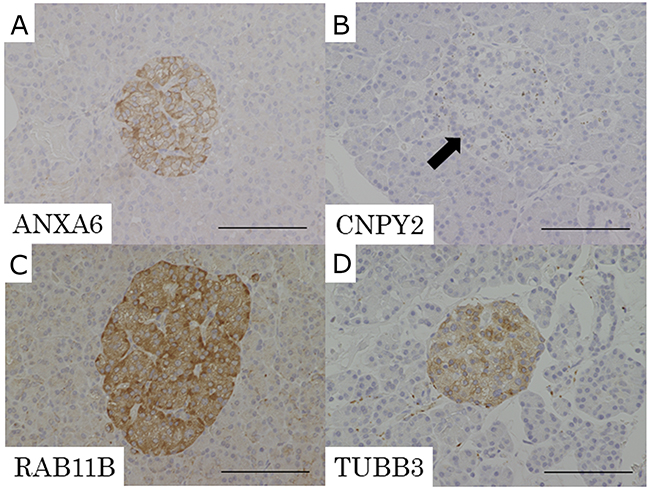
Figure 4: Representative pictures of IHC for the candidate proteins in normal pancreatic tissue. (A) ANXA6, (B) CNPY2, (C) RAB11B, (D) TUBB3. Expression of CNPY2 was negative in normal islet cells (B: arrow). ANXA6, RAB11B and TUBB3 had positive expression in normal islet cells. Expression of ANXA6, CNPY2, RAB11B and TUBB3 was not detected in normal exocrine tissue of the pancreas. Scale bars indicate 100 μm.
Correlationship between expression of candidate proteins and clinicopathological factors
In the immunohistochemical analysis for the candidate proteins, the positive expression rate of CNPY2 was significantly higher in both the synchronous and metachronous liver metastasis groups (p = 0.001). The WHO2017 histological grade was significantly correlated with the expression of CNPY2 (NET G1: 45.2%, NET G2: 48.5%, NET G3: 100.0%, p = 0.044) and RAB11B (NET G1: 35.5%, NET G2: 57.6%, NET G3: 100.0%, p = 0.010) (Supplementary Table 1). RAB11B positive cases were significantly higher in the Ki-67 labeling index compared with the negative cases (p = 0.005) (Supplementary Table 2). None of the immunostained proteins was correlated with the tumor size.
Liver recurrence-free survival and multivariate analysis
To evaluate overall survival (OS) and liver recurrence-free survival (RFS) after surgical resection for primary pancreatic tumors, 62 cases without synchronous liver metastasis were investigated. OS and liver RFS were compared between the positive and negative expression of the candidate proteins. There was no significant correlation between OS and any of the candidate proteins (Supplementary Figure 2). Liver RFS was significantly poorer in the CNPY2 positive patients than in those who were negative (10-year liver RFS; 39.8% vs. 92.3%, p = 0.012). Also, liver RFS tended to be poorer in the ANXA6 positive patients than in the negative patients (10-year liver RFS; 51.4% vs. 95.0%, p = 0.099) (Figure 5). The expression of RAB11B and TUBB3 had no correlationship with liver RFS.
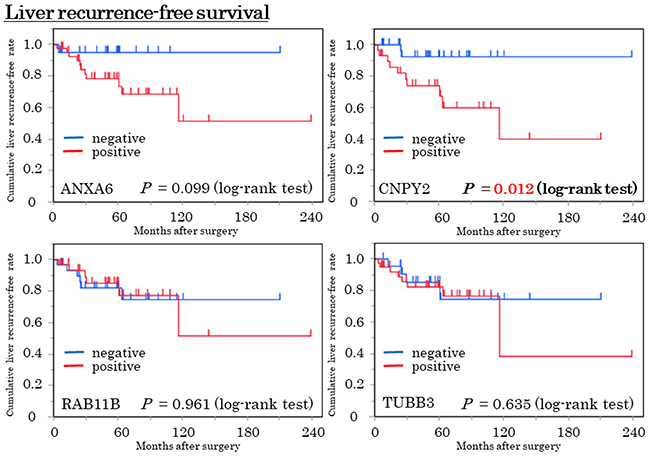
Figure 5: Liver recurrence-free survival (Liver RFS) curve in the expressions of the 4 candidate proteins by the Kaplan-Meier method. Blue and red lines indicate negative and positive expressions, respectively. Patients who were CNPY2 positive were significantly poorer in liver RFS compared with CNPY2 negative patients (p = 0.012, log-rank test). Patients with ANXA6 positive tended to be poorer, compared with ANXA6 negative patients (p = 0.099, log-rank test).
Predictive factors for liver RFS were examined by Cox proportional hazard analysis. The cut-off values of the Ki-67 labeling index and tumor size associated with liver RFS were investigated by receiver operating characteristic (ROC) curve analysis. The cut-off values of the Ki-67 labeling index and tumor size were 8.2% (area under the curve (AUC) = 0.708, p = 0.005), and 42 mm (AUC = 0.671, p = 0.010), respectively. As shown in Table 4, significant factors by univariate analysis included Ki-67 ≥ 8.2% (p = 0.009), tumor size ≥ 42 mm (p = 0.007), vascular invasion (p = 0.009), lymphatic invasion (p = 0.012) and CNPY2 positive (p = 0.010). ANXA6 was likely to be a predictive factor in the univariate analysis (p = 0.064). Significant factors in the univariate analysis were investigated for the multivariate analysis. In the multivariate analysis, the independent predictors of liver RFS were CNPY2 positivity (hazard ratio (HR): 6.19, 95% confidence interval (95% CI): 1.47–42.79, p = 0.011) and tumor size ≥ 42 mm (HR: 4.63, 95% CI: 1.03–23.23, p = 0.045).
Table 4: Univariate and multivariate analysis of clinicopathological factors and the candidate proteins in liver RFS
Factors (n = 62) |
Univariate analysis |
Multivariate analysis |
||
|---|---|---|---|---|
HR (95%CI) |
p value |
HR (95%CI) |
p value |
|
Function: NF vs. functioning |
1.39 (0.76–2.65) |
0.293 |
||
WHO 2017 Grade: G2/G3 vs. G1 |
2.03 (0.64–7.62) |
0.235 |
||
WHO 2017: Grade G3 vs. G1/G2 |
3.50 (0.52–13.91) |
0.117 |
||
Ki-67 ≥ 8.2%: yes vs. no |
4.76 (1.51–16.18) |
0.009 |
0.95 (0.20–5.36) |
0.950 |
Tumor size ≥ 42 mm: yes vs. no |
5.80 (1.69–18.46) |
0.007 |
4.63 (1.03–23.23) |
0.045 |
Lymph node metastasis Positive vs. Negative |
1.43 (0.31–4.90) |
0.610 |
||
Vascular invasion Positive vs. Negative |
4.96 (1.48–22.38) |
0.009 |
1.11 (0.14–7.94) |
0.921 |
Lymphatic invasion Positive vs. Negative |
4.37 (1.39–14.81) |
0.012 |
3.84 (0.90–17.54) |
0.069 |
Stage (ENETS): III/IV vs. I/II |
1.43 (0.31–4.90) |
0.610 |
||
ANXA6 |
4.77 (0.92–87.22) |
0.064 |
||
CNPY2 |
5.60 (1.47–36.48) |
0.010 |
6.19 (1.47–42.79) |
0.011 |
RAB11B |
0.97 (0.30–3.11) |
0.961 |
||
TUBB3 |
1.34 (0.42–5.07) |
0.631 |
||
DISCUSSION
Liver metastasis of NETs is an independent prognostic factor, regardless of the primary organ [3]. Liver metastasis was found at the initial diagnosis in 40–45% of the patients with NETs of the small intestine, pancreas, and colon [3]. Although the development of new drug treatments is needed to improve the prognosis in liver metastasis of PanNEN, the mechanisms of liver metastasis of PanNEN remain unclear.
It is important to detect some specific novel proteins that are strongly expressed or inhibited in liver metastasis of PanNEN for clarifying the mechanism, preventing the onset and improving treatment. For this purpose, we compared the protein expression between the primary tumor and the paired liver metastasis using proteomic analysis in the present study. There has been no study about discovery of novel liver metastasis-correlated proteins of PanNEN by proteomic analysis. However, we previously succeeded in detecting new biomarkers of pancreatic and bile duct cancer using this analysis [10, 11]. Therefore, we considered that it could also be a useful tool for the detection of liver metastasis-related proteins of PanNEN.
At first, we selected 10 proteins from among identified proteins in PT and/or LT as candidates that showed more than a 2 fold difference in the expression levels between PT and LT. Among these 10 proteins, ANXA6, CNPY2, RAB11B and TUBB3, all of which showed higher expression in LT, were focused on according to the confirmation of protein expression by IHC. No characteristic heterogeneous staining was found in IHC for these candidate proteins. Of the four proteins, we found that CNPY2 could be novel liver metastasis-correlated proteins of PanNEN. The present study demonstrated that the expression of CNPY2 and tumor size were independent predictors of liver RFS. Several previous studies revealed that the histological grade, Ki-67 labeling index, tumor size, vascular invasion and lymphatic invasion were correlated with recurrence and survival [17–19]. While positive data of liver metastasis-correlated proteins could be seen, the overall survival indicated no correlation with the expression of CNPY2 in this study. This might be because the population of the cohort was small and thus further studies on CNPY2 in a larger cohort are needed.
The function of CNPY2, previously called MIR-interacting saposin-like protein (MSAP), putative secreted protein Zsig9 (ZSIG9) or transmembrane protein 4 (TMEM4), is still unknown. There have been only a few published reports assessing the function of CNPY2. Guo et al. demonstrated that CNPY2 was regulated by hypoxia inducible factor (HIF)-1 alpha in human smooth muscle cells (SMC) and was a secreted angiogenic growth factor that promotes SMC migration, proliferation, and tissue revascularization by p53 inactivation [20, 21]. It has been reported that CNPY2 is related to esophageal squamous cell carcinoma (ESCC) [22], colorectal cancer (CRC) [23] and renal cancer [24]. No report on other malignancies including NETs has been published. In ESCC, patients with high expression of CNPY2, evaluated by IHC, showed significantly poor OS and RFS compared to those with low expression [22]. CNPY2 promoted tumor development through regulating p53 expression in CRC and renal cancer cells [23, 24]. Yan et al. demonstrated that knockdown of CNPY2 reversibly increased p53 activity using the colorectal cancer cell line HCT116 and suggested that CNPY2 plays a critical role in CRC development by enhancing cell growth, migration, and angiogenesis and by inhibiting apoptosis through negative regulation of the p53 pathway [23]. P53 has been reported to show abnormal immunolabeling for pancreatic neuroendocrine carcinoma (NEC), but not for PanNEN [25, 26]. Further studies are needed to examine the relationship between CNPY2 and p53 in PanNEN. The current study suggests that CNPY2 has potential as a biomarker for liver metastasis of PanNEN. CNPY2, which is a secreted protein, might have potential as a blood biomarker in liver metastasis of PanNEN because CNPY2 was detectable in murine blood plasma by enzyme-linked immunosorbent assay (ELISA) [35].
ANXA6 belongs to a family of calcium-dependent membrane and phospholipid binding proteins. ANXA6 participates in membrane and cytoskeleton organization, cholesterol homeostasis, membrane trafficking, cell adhesion and signal transduction [27, 28]. In malignancies, ANXA6 has been reported to play a role as a tumor suppressor in melanoma [29], breast cancer [30, 31] and gastric cancer [32]. In contrast, ANXA6 has been suggested to be a tumor promoter in cervical cancer [33], large cell lymphoma [28] and the stroma of pancreatic ductal adenocarcinoma [34]. There has been no report on the expression of ANXA6 in NETs. The results of the current study showed that PanNEN patients with ANXA6 expression were likely to have poor liver RFS. ANXA6 might also play a promotive role in the liver metastasis of PanNEN.
MATERIALS AND METHODS
Discovery stage
Patient selection and formalin-fixed paraffin-embedded (FFPE) tissue samples for proteomic analysis
One hundred and eighteen patients with PanNEN who underwent surgical resection between 1994 and 2016 at Tohoku University Hospital were examined. Twenty cases had synchronous or metachronous liver metastasis. Of these cases with liver metastasis, 7 cases had available FFPE samples of both PT and LT of PanNEN in an identical case, and were applied for proteomic analysis as the discovery set (Figure 1). Protein expression was compared between PT and LT by proteomic analysis. This study was approved by the Institutional Review Board of Tohoku University (the reference number 2017-1-437). Table 1 shows the patients’ characteristics at the discovery stage. The histological grade was determined according to the World Health Organization (WHO) 2017 of PanNENs [36]. The cohort contained patients with 5 synchronous and 2 metachronous liver metastases. In the histological grade, NET G2 and NET G3 included 4 and 3 cases, respectively. No patients with NEC G3 were included in the cohort. One case was gastrinoma, and the others were non-functioning PanNEN. Four patients died of the PanNEN. There was no patient with multiple endocrine neoplasia (MEN) in the cohort.
Laser microdissection (LMD) and protein extraction
LMD and protein extraction were performed as previously described [9, 10]. Briefly, 10 μm sections of the FFPE tissue samples were attached to DIRECTOR™ slides (Expression Pathology, MD, USA). After de-paraffinization with xylene, the samples were rehydrated with ethanol, stained with hematoxylin and then air-dried. Using a Leica LMD7000 (Leica Microsystems GmbH, Wetzler, Germany), approximately 30,000 tumor cells (8 mm2) were collected into the cap of a 0.2 ml polymerase chain reaction (PCR) tube. Peptide extraction was performed with a Liquid Tissue™ MS Protein Kit (Expression Pathology) according to the manufacturer’s instructions [37].
Nano HPLC/MS/MS analysis for proteomics
The dried peptide extracts (2–4 μg) were dissolved together in 20 μl sample solution [5% acetonitrile and 0.1% trifluoroacetic acid (TFA)]. Each sample (10 μl) was injected into an EasynLC-1000 system (Thermo Fisher Scientific Inc., MA, USA) that was connected to an EASY-Spray column (25 cm length × C18 ODS 75 μm, Thermo Fisher Scientific Inc.). Peptides were eluted with a 180 min gradient of 4% to 25% solvent B (0.1% formic acid in acetonitrile, v/v) in solvent A (0.1% formic acid in water, v/v) at a flow rate of 300-400 nl/min. Peptides were then ionized and analyzed by a fusion mass spectrometer (Thermo Fisher Scientific Inc.) using a nano-spray source. High-resolution full scan MS spectra (from m/z 400–2,000) were acquired in the Orbitrap with resolution (R = 120,000 at m/z 400) and lock mass enabled (m/z at 445.12003 and 391.28429), followed by MS/MS fragmentation of the most intense ions for 3 sec in the linear ion trap with a collisionally activated dissociation (CID) energy of 35%. The exclusion duration for the data-dependent scan was 0 s, and the isolation window was set at 10.0 m/z.
The MS/MS data were analyzed by sequence alignment using variable and static modifications by Mascot and Sequest algorithms. The protein database utilized was UniProt. The specific parameters for protein sequence database searching included oxidation (M), deamination (N, Q), acetylation (N-term.), and pyroglutamation (E) as variable modifications, and carbamidomethylation (C) as a static modification. Other parameters used in the data analysis were: two allowed missing cleavages, a mass error of 10 ppm for precursor ions, and 0.8 Da for fragment ions. Charge states of +2 to +4 were considered for parent ions. If more than one spectrum was assigned to a peptide, only the spectrum with the highest Mascot score was selected for manual analysis. All peptides identified with a peptide score of Mascot > 20, and Sequest > 0.8 were manually examined using the protocol described previously [38].
Semi-quantitative comparison by spectral counting method
We compared the protein expression across all tissue samples from the results of the shotgun proteomics using the label-free spectral counting method, as previously described [9, 10, 14]. Fold changes in expressed proteins on a base 2 logarithmic scale were evaluated with the protein ratio from the spectral counting (Rsc) [39]. Relative abundances of the identified proteins were investigated by the normalized spectral abundance factor (NSAF) [40]. Comparisons of protein expression between the pancreatic and liver tumors were evaluated with the spectral index (SpI), ranging from -1 to +1 [41]. SpI values close to 0 indicated nearly equal relative peptide abundance in the compared groups. Candidate proteins were selected to satisfy Rsc > 1 or < -1 and p value < 0.05 in G-test [42] and were narrowed down using NSAF and SpI values.
Immunohistochemistry
IHC was performed as previously described [9, 10, 43]. Briefly, 4-μm FFPE tissue sections de-paraffinized with xylene and rehydrated with ethanol solutions and distilled water were heated in citrate acid buffer (10 mmol/l citric acid, pH 6.0) at 121°C for 5 min with an autoclave or microwave oven for 15 min in citrate acid buffer (10 mM citric acid, pH 6.0) for antigen retrieval. Antibodies of ANXA6 (ab31026, dilution 1:25, Abcam, Cambridge, UK), CNPY2 (ab181217, dilution 1:50, Abcam), HIST1H3A (ab174712, dilution 1:20, Abcam), Microtubule-associated protein RP/EB family member 1 (MAPRE1) (ab117821, dilution 1:250, Abcam,), Ras-related protein Rab-11A (RAB11A) (ab180778, dilution 1:50, Abcam), RAB11B (PA5-31348, dilution 1:100, Thermo Fisher Scientific Inc., MA, USA), Signal peptidase complex catalytic subunit (SEC11A) (ab174794, dilution 1:100, Abcam), Tropomyosin alpha-1 chain (TPM1) (ab55915, dilution 1:50, Abcam), TUBB3 (ab18207, dilution 1:1000, Abcam), Vesicle-associated membrane protein 3 (VAMP3) (10702-1-AP, Proteintech, Inc., IL, USA) were used as the primary antibodies. The sections were incubated over night at 4°C with one of the primary antibodies. After blocking endogenous peroxidase with methanol containing 0.3% hydrogen peroxidase, the labeled antigens were identified by an EnVision+ Sytem-HRP (DAKO, Glostrup, Denmark) and visualized by 3, 3’-diaminobenzidine tetrahydrochloride as a chromogen. The sections were lightly counterstained with hematoxylin.
Two of the authors (M.S., T.S.) completely reviewed all slides of the immunostained sections in each sample and classified the cases into two groups. We defined ≥ 10% tumor cells with staining of protein as positive expression, and < 10% tumor cells as negative expression. PT and LT samples in the discovery stage and pancreatic tumors of PanNEN in all cases except for those without available FFPE samples in the next clinicopathological analysis stage were examined by IHC for candidate proteins.
Clinicopathological analysis stage
Of 118 patients with PanNEN, pancreatic tumors of 70 patients with available FFPE tissue were evaluated by IHC for protein expression of the candidate proteins. One patient with MEN type1 was included in the analyzed cohort. The duration of follow-up was calculated from the date of initial surgery to the date of death or last follow-up. Liver RFS was defined as the length of time that patients survived without initial liver metastasis after resection of the primary pancreatic tumor. Eight patients with synchronous liver metastasis were excluded from the analysis of OS and liver RFS (Figure 1). Liver metastasis-correlated factors were identified from clinicopathological factors including candidate proteins by univariate and multivariate analyses with a Cox proportional hazards model.
Statistical analysis
JMP software version 13.0 (SAS Institute, NC, USA) was used for all analyses. Significance was calculated using Fisher’s exact test, Pearson’s χ2-test for categorical variates and Mann–Whitney U test, Kruskal–Wallis test for continuous variates. In the univariate analysis, OS and liver RFS rates were calculated by the Kaplan–Meier method and compared using the log-rank test. Univariate and multivariate analyses were performed using a Cox proportional hazards model to examine potential factors influencing the liver RFS. P < 0.05 was considered statistically significant.
CONCLUSIONS
We have demonstrated for the first time that CNPY2 is a novel liver metastasis-correlated factor of PanNEN. Also, ANXA6 might affect the liver metastasis of PanNEN. Further studies are needed to elucidate the functions of CNPY2 and ANXA6 in PanNEN.
Abbreviations
AUC: area under the curve; ANXA6: Annexin A6; CID: collisionally activated dissociation; CNPY2: the canopy FGF signaling regulator 2; CRC: colorectal cancer; ENETS: European Neuroendocrine Tumor Society; ESCC: esophageal squamous cell carcinoma; FFPE: formalin-fixed paraffin-embedded; HIF-1: hypoxia inducible factor -1; HIST1H3A: Histone H3.1; IHC: immunohistochemistry; KEGG: Kyoto Encyclopedia of Genes and Genomes; LC-MS/MS: liquid chromatography-tandem mass spectrometry; LMD: laser capture microdissection; LT: metastatic liver tumor; MAPRE1: microtubule-associated protein RP/EB family member 1; MEN: multiple endocrine neoplasia; MRLC: myosin regulatory light chain; MS: mass spectrometry; MSAP: MIR-interacting saposin-like protein; NET: neuroendocrine tumors; NEC: neuroendocrine carcinoma; NSAF: the normalized spectral abundance factor; OS: overall survival; PanNEN: pancreatic neuroendocrine neoplasm; PT: primary pancreatic tumor; RAB11A: Ras-related protein Rab-11A; RAB11B: Ras-related protein Rab-11B; RAB25: Ras-related protein Rab-25; RFS: recurrence-free survival; ROC: receiver operating characteristic; Rsc: the protein ratio from spectral counting; PCR: polymerase chain reaction; SEC11A: signal peptidase complex catalytic subunit; SEER: the surveillance, epidemiology, and end results; SpI: spectral index; TMEM4: transmembrane protein 4; TFA: trifluoroacetic acid; TPM1: tropomyosin alpha-1 chain; TUBB3: tubulin beta-3 chain; VAMP3: Vesicle-associated membrane protein 3; WHO: World Health Organization; ZSIG9: putative secreted protein Zsig9.
Author contributions
MS and MM designed the research. MS, YK and TS performed the experiment. TT, SA and YS technically supported the experiments. MS and MM wrote the paper. MI, TH, SA, YS, NS, HO, HH, TM, KN, FM, TN, KI, HS and MU reviewed the manuscript and revised it critically for important intellectual content. MM integrated the entire study. All authors read and approved the final manuscript.
ACKNOWLEDGMENTS
We thank Yoshihiro Sato, Emiko Shibuya and Keiko Inabe in Department of Surgery, Tohoku University Graduate School of Medicine, who provided kind support in this study.
CONFLICTS OF INTEREST
The authors declare that they have no conflicts of interest.
FUNDING
This work was supported by Japan Society for the Promotion of Science Grant-in-Aid for Scientific Research (C: 15K10179) (MM) and the Pancreas Research Foundation of Japan, Grants-in-Aid for Pancreas Research 2014 (SA).
REFERENCES
1. Yao JC, Hassan M, Phan A, Dagohoy C, Leary C, Mares JE, Abdalla EK, Fleming JB, Vauthey JN, Rashid A, Evans DB. One hundred years after “carcinoid”: epidemiology of and prognostic factors for neuroendocrine tumors in 35,825 cases in the United States. J Clin Oncol. 2008; 26: 3063–72. https://doi.org/10.1200/jco.2007.15.4377.
2. Ito T, Igarashi H, Nakamura K, Sasano H, Okusaka T, Takano K, Komoto I, Tanaka M, Imamura M, Jensen RT, Takayanagi R, Shimatsu A. Epidemiological trends of pancreatic and gastrointestinal neuroendocrine tumors in Japan: a nationwide survey analysis. J Gastroenterol. 2015; 50: 58–64. https://doi.org/10.1007/s00535-014-0934-2.
3. Frilling A, Modlin IM, Kidd M, Russell C, Breitenstein S, Salem R, Kwekkeboom D, Lau WY, Klersy C, Vilgrain V, Davidson B, Siegler M, Caplin M, et al, and Working Group on Neuroendocrine Liver Metastases. Recommendations for management of patients with neuroendocrine liver metastases. Lancet Oncol. 2014; 15: e8–21. https://doi.org/10.1016/s1470-2045(13)70362-0.
4. Elias D, Lasser P, Ducreux M, Duvillard P, Ouellet JF, Dromain C, Schlumberger M, Pocard M, Boige V, Miquel C, Baudin E. Liver resection (and associated extrahepatic resections) for metastatic well-differentiated endocrine tumors: a 15-year single center prospective study. Surgery. 2003; 133: 375–82. https://doi.org/10.1067/msy.2003.114.
5. Sarmiento JM, Heywood G, Rubin J, Ilstrup DM, Nagorney DM, Que FG. Surgical treatment of neuroendocrine metastases to the liver: a plea for resection to increase survival. J Am Coll Surg. 2003; 197: 29–37. https://doi.org/10.1016/s1072-7515(03)00230-8.
6. Mayo SC, de Jong MC, Pulitano C, Clary BM, Reddy SK, Gamblin TC, Celinksi SA, Kooby DA, Staley CA, Stokes JB, Chu CK, Ferrero A, Schulick RD, et al. Surgical management of hepatic neuroendocrine tumor metastasis: results from an international multi-institutional analysis. Ann Surg Oncol. 2010; 17: 3129–36. https://doi.org/10.1245/s10434-010-1154-5.
7. Maxwell JE, Sherman SK, O’Dorisio TM, Bellizzi AM, Howe JR. Liver-directed surgery of neuroendocrine metastases: What is the optimal strategy? Surgery. 2016; 159: 320–33. https://doi.org/10.1016/j.surg.2015.05.040.
8. Zhang Y, Ye Y, Shen D, Jiang K, Zhang H, Sun W, Zhang J, Xu F, Cui Z, Wang S. Identification of transgelin-2 as a biomarker of colorectal cancer by laser capture microdissection and quantitative proteome analysis. Cancer Sci. 2010; 101: 523–29.
9. Takadate T, Onogawa T, Fujii K, Motoi F, Mikami S, Fukuda T, Kihara M, Suzuki T, Takemura T, Minowa T, Hanagata N, Kinoshita K, Morikawa T, et al. Nm23/nucleoside diphosphate kinase-A as a potent prognostic marker in invasive pancreatic ductal carcinoma identified by proteomic analysis of laser micro-dissected formalin-fixed paraffin-embedded tissue. Clin Proteomics. 2012; 9: 8. https://doi.org/10.1186/1559-0275-9-8.
10. Takadate T, Onogawa T, Fukuda T, Motoi F, Suzuki T, Fujii K, Kihara M, Mikami S, Bando Y, Maeda S, Ishida K, Minowa T, Hanagata N, et al. Novel prognostic protein markers of resectable pancreatic cancer identified by coupled shotgun and targeted proteomics using formalin-fixed paraffin-embedded tissues. Int J Cancer. 2013; 132: 1368–82. https://doi.org/10.1002/ijc.27797.
11. Maeda S, Morikawa T, Takadate T, Suzuki T, Minowa T, Hanagata N, Onogawa T, Motoi F, Nishimura T, Unno M. Mass spectrometry-based proteomic analysis of formalin-fixed paraffin-embedded extrahepatic cholangiocarcinoma. J Hepatobiliary Pancreat Sci. 2015; 22: 683–91. https://doi.org/10.1002/jhbp.262.
12. Park J, Lee E, Park KJ, Park HD, Kim JW, Woo HI, Lee KH, Lee KT, Lee JK, Park JO, Park YS, Heo JS, Choi SH, et al. Large-scale clinical validation of biomarkers for pancreatic cancer using a mass spectrometry-based proteomics approach. Oncotarget. 2017; 8: 42761–71. https://doi.org/10.18632/oncotarget.17463.
13. Shen Z, Wang B, Luo J, Jiang K, Zhang H, Mustonen H, Puolakkainen P, Zhu J, Ye Y, Wang S. Global-scale profiling of differential expressed lysine acetylated proteins in colorectal cancer tumors and paired liver metastases. J Proteomics. 2016; 142: 24–32. https://doi.org/10.1016/j.jprot.2016.05.002.
14. Kawamura T, Nomura M, Tojo H, Fujii K, Hamasaki H, Mikami S, Bando Y, Kato H, Nishimura T. Proteomic analysis of laser-microdissected paraffin-embedded tissues: (1) Stage-related protein candidates upon non-metastatic lung adenocarcinoma. J Proteomics. 2010; 73: 1089–99. https://doi.org/10.1016/j.jprot.2009.11.011.
15. Alkatout I, Friemel J, Sitek B, Anlauf M, Eisenach PA, Stuhler K, Scarpa A, Perren A, Meyer HE, Knoefel WT, Kloppel G, Sipos B. Novel prognostic markers revealed by a proteomic approach separating benign from malignant insulinomas. Mod Pathol. 2015; 28: 69–79. https://doi.org/10.1038/modpathol.2014.82.
16. Song YL, Yu R, Qiao XW, Bai CM, Lu CM, Xiao Y, Zhong DR, Chen J, Zhao YP, Zhang TP, Song TT, Gao HL, Wan YH, et al. Prognostic relevance of UCH-L1 and alpha-internexin in pancreatic neuroendocrine tumors. Sci Rep. 2017; 7: 2205. https://doi.org/10.1038/s41598-017-02051-1.
17. Jamali M, Chetty R. Predicting prognosis in gastroentero-pancreatic neuroendocrine tumors: an overview and the value of Ki-67 immunostaining. Endocr Pathol. 2008; 19: 282–8. https://doi.org/10.1007/s12022-008-9044-0.
18. Nanno Y, Toyama H, Otani K, Asari S, Goto T, Terai S, Ajiki T, Zen Y, Fukumoto T, Ku Y. Microscopic venous invasion in patients with pancreatic neuroendocrine tumor as a potential predictor of postoperative recurrence. Pancreatology. 2016; 16: 882–7. https://doi.org/10.1016/j.pan.2016.06.008.
19. Ricci C, Casadei R, Taffurelli G, Pacilio CA, Campana D, Ambrosini V, Donatella S, Minni F. Sporadic Small (≤20 mm) Nonfunctioning Pancreatic Neuroendocrine Neoplasm: is the Risk of Malignancy Negligible When Adopting a More Conservative Strategy? A Systematic Review and Meta-analysis. Ann Surg Oncol. 2017; 24: 2603–10.
20. Guo J, Mihic A, Wu J, Zhang Y, Singh K, Dhingra S, Weisel RD, Li RK. Canopy 2 attenuates the transition from compensatory hypertrophy to dilated heart failure in hypertrophic cardiomyopathy. Eur Heart J. 2015; 36: 2530–40. https://doi.org/10.1093/eurheartj/ehv294.
21. Guo J, Zhang Y, Mihic A, Li SH, Sun Z, Shao Z, Wu J, Weisel RD, Li RK. A secreted protein (Canopy 2, CNPY2) enhances angiogenesis and promotes smooth muscle cell migration and proliferation. Cardiovasc Res. 2015; 105: 383–93. https://doi.org/10.1093/cvr/cvv010.
22. He JZ, Wu ZY, Wang SH, Ji X, Yang CX, Xu XE, Liao LD, Wu JY, Li EM, Zhang K, Xu LY. A decision tree-based combination of ezrin-interacting proteins to estimate the prognostic risk of patients with esophageal squamous cell carcinoma. Hum Pathol. 2017; 66: 115–25. https://doi.org/10.1016/j.humpath.2017.06.003.
23. Yan P, Gong H, Zhai X, Feng Y, Wu J, He S, Guo J, Wang X, Guo R, Xie J, Li RK. Decreasing CNPY2 Expression Diminishes Colorectal Tumor Growth and Development through Activation of p53 Pathway. Am J Pathol. 2016; 186: 1015–24. https://doi.org/10.1016/j.ajpath.2015.11.012.
24. Taniguchi H, Ito S, Ueda T, Morioka Y, Kayukawa N, Ueno A, Nakagawa H, Fujihara A, Ushijima S, Kanazawa M, Hongo F, Ukimura O. CNPY2 promoted the proliferation of renal cell carcinoma cells and increased the expression of TP53. Biochem Biophys Res Commun. 2017; 485: 267–71. https://doi.org/10.1016/j.bbrc.2017.02.095.
25. Yachida S, Vakiani E, White CM, Zhong Y, Saunders T, Morgan R, de Wilde RF, Maitra A, Hicks J, Demarzo AM, Shi C, Sharma R, Laheru D, et al. Small cell and large cell neuroendocrine carcinomas of the pancreas are genetically similar and distinct from well-differentiated pancreatic neuroendocrine tumors. Am J Surg Pathol. 2012; 36: 173–84. https://doi.org/10.1097/PAS.0b013e3182417d36.
26. Girardi DM, Silva ACB, Rego JFM, Coudry RA, Riechelmann RP. Unraveling molecular pathways of poorly differentiated neuroendocrine carcinomas of the gastroenteropancreatic system: A systematic review. Cancer Treat Rev. 2017; 56: 28–35. https://doi.org/10.1016/j.ctrv.2017.04.002.
27. Grewal T, Koese M, Rentero C, Enrich C. Annexin A6-regulator of the EGFR/Ras signalling pathway and cholesterol homeostasis. Int J Biochem Cell Biol. 2010; 42: 580–4. https://doi.org/10.1016/j.biocel.2009.12.020.
28. Tressler RJ, Yeatman T, Nicolson GL. Extracellular annexin VI expression is associated with divalent cation-dependent endothelial cell adhesion of metastatic RAW117 large-cell lymphoma cells. Exp Cell Res. 1994; 215: 395–400. https://doi.org/10.1006/excr.1994.1358.
29. Francia G, Mitchell SD, Moss SE, Hanby AM, Marshall JF, Hart IR. Identification by differential display of annexin-VI, a gene differentially expressed during melanoma progression. Cancer Res. 1996; 56: 3855–8.
30. Sakwe AM, Koumangoye R, Guillory B, Ochieng J. Annexin A6 contributes to the invasiveness of breast carcinoma cells by influencing the organization and localization of functional focal adhesions. Exp Cell Res. 2011; 317: 823–37. https://doi.org/10.1016/j.yexcr.2010.12.008.
31. Koese M, Rentero C, Kota BP, Hoque M, Cairns R, Wood P, Vila de Muga S, Reverter M, Alvarez-Guaita A, Monastyrskaya K, Hughes WE, Swarbrick A, Tebar F, et al. Annexin A6 is a scaffold for PKCalpha to promote EGFR inactivation. Oncogene. 2013; 32: 2858–72. https://doi.org/10.1038/onc.2012.303.
32. Wang X, Zhang S, Zhang J, Lam E, Liu X, Sun J, Feng L, Lu H, Yu J, Jin H. Annexin A6 is down-regulated through promoter methylation in gastric cancer. Am J Transl Res. 2013; 5: 555–62.
33. Lomnytska MI, Becker S, Bodin I, Olsson A, Hellman K, Hellstrom AC, Mints M, Hellman U, Auer G, Andersson S. Differential expression of ANXA6, HSP27, PRDX2, NCF2, and TPM4 during uterine cervix carcinogenesis: diagnostic and prognostic value. Br J Cancer. 2011; 104: 110–9. https://doi.org/10.1038/sj.bjc.6605992.
34. Leca J, Martinez S, Lac S, Nigri J, Secq V, Rubis M, Bressy C, Serge A, Lavaut MN, Dusetti N, Loncle C, Roques J, Pietrasz D, et al. Cancer-associated fibroblast-derived annexin A6+ extracellular vesicles support pancreatic cancer aggressiveness. J Clin Invest. 2016; 126: 4140–56. https://doi.org/10.1172/jci87734.
35. Hatta K, Guo J, Ludke A, Dhingra S, Singh K, Huang ML, Weisel RD, Li RK. Expression of CNPY2 in mouse tissues: quantification and localization. PLoS One. 2014; 9: e111370. https://doi.org/10.1371/journal.pone.0111370.
36. Lloyd RV, Klöppel G, Rosai J. WHO Classification of Tumours of Endocrine Organs WHO/IARC Classification of Tumours, 4th Edition, Volume 10. 2017.
37. Prieto DA, Hood BL, Darfler MM, Guiel TG, Lucas DA, Conrads TP, Veenstra TD, Krizman DB. Liquid Tissue: proteomic profiling of formalin-fixed tissues. Biotechniques. 2005; 38: 32–35.
38. Chen Y, Kwon SW, Kim SC, Zhao Y. Integrated approach for manual evaluation of peptides identified by searching protein sequence databases with tandem mass spectra. J Proteome Res. 2005; 4: 998–1005. https://doi.org/10.1021/pr049754t.
39. Old WM, Meyer-Arendt K, Aveline-Wolf L, Pierce KG, Mendoza A, Sevinsky JR, Resing KA, Ahn NG. Comparison of label-free methods for quantifying human proteins by shotgun proteomics. Mol Cell Proteomics. 2005; 4: 1487–502. https://doi.org/10.1074/mcp.M500084-MCP200.
40. Paoletti AC, Parmely TJ, Tomomori-Sato C, Sato S, Zhu D, Conaway RC, Conaway JW, Florens L, Washburn MP. Quantitative proteomic analysis of distinct mammalian Mediator complexes using normalized spectral abundance factors. Proc Natl Acad Sci U S A. 2006; 103: 18928–33. https://doi.org/10.1073/pnas.0606379103.
41. Fu X, Gharib SA, Green PS, Aitken ML, Frazer DA, Park DR, Vaisar T, Heinecke JW. Spectral index for assessment of differential protein expression in shotgun proteomics. J Proteome Res. 2008; 7: 845–54. https://doi.org/10.1021/pr070271+.
42. Zhang B, VerBerkmoes NC, Langston MA, Uberbacher E, Hettich RL, Samatova NF. Detecting differential and correlated protein expression in label-free shotgun proteomics. J Proteome Res. 2006; 5: 2909–18. https://doi.org/10.1021/pr0600273.
43. Aoki S, Mizuma M, Takahashi Y, Haji Y, Okada R, Abe T, Karasawa H, Tamai K, Okada T, Morikawa T, Hayashi H, Nakagawa K, Motoi F, et al. Aberrant activation of Notch signaling in extrahepatic cholangiocarcinoma: clinicopathological features and therapeutic potential for cancer stem cell-like properties. BMC Cancer. 2016; 16: 854. https://doi.org/10.1186/s12885-016-2919-4.